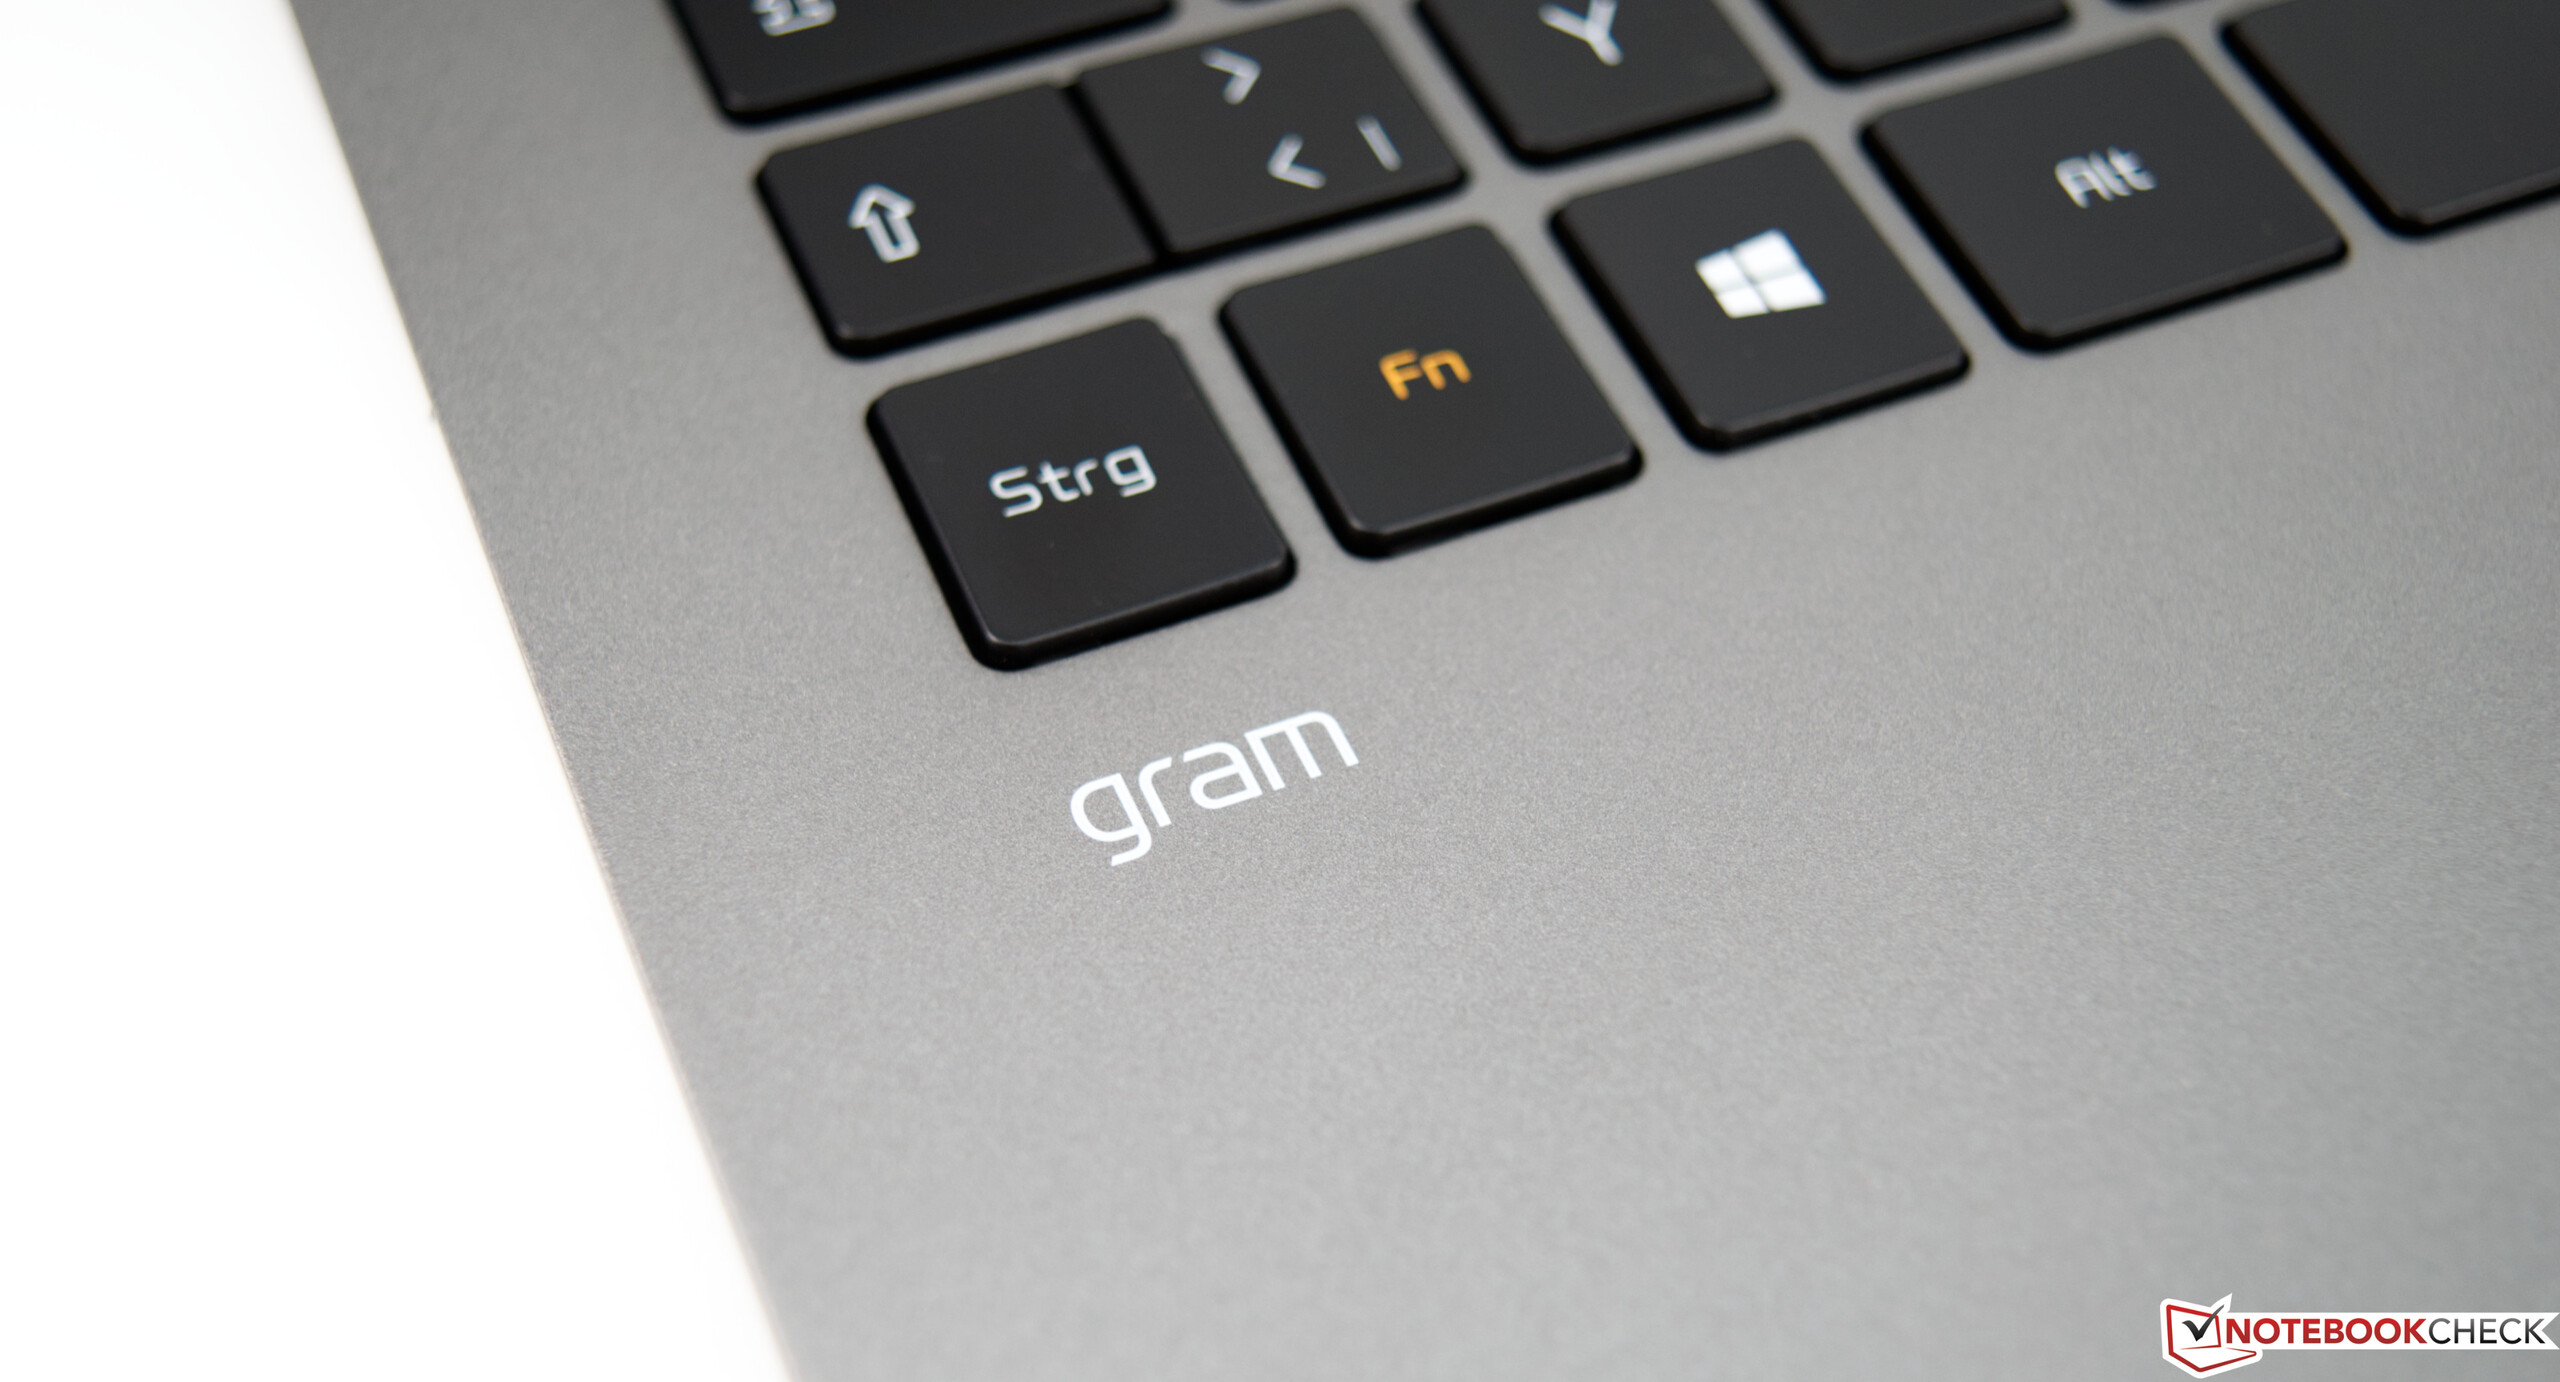
Breve Análise do Portátil LG Gram 15: Portátil peso pena de 15 polegadas com uma excelente tela
Avaliação | Data | Modelo | Peso | Altura | Size | Resolução | Preço |
|---|---|---|---|---|---|---|---|
| 84.8 % v7 (old) | 07/2020 | LG Gram 15Z90N i5-1035G7, Iris Plus Graphics G7 (Ice Lake 64 EU) | 1.1 kg | 16.8 mm | 15.60" | 1920x1080 | |
| 86.4 % v6 (old) | 08/2018 | LG Gram 15Z980-B.AA78B i5-8550U, UHD Graphics 620 | 1.1 kg | 17 mm | 15.60" | 1920x1080 | |
| 80.1 % v7 (old) | 02/2020 | MSI Modern 15 A10RB i7-10510U, GeForce MX250 | 1.6 kg | 15.9 mm | 15.60" | 1920x1080 | |
| 83.8 % v6 (old) | Schenker Work 15 i7-8750H, UHD Graphics 630 | 2.2 kg | 24.9 mm | 15.60" | 1920x1080 | ||
| 82.9 % v7 (old) | 11/2019 | Microsoft Surface Laptop 3 15 Ryzen 5 3580U R5 3580U, Vega 9 | 1.5 kg | 14.7 mm | 15.00" | 2496x1664 | |
| 82.6 % v6 (old) | Schenker Slim 15-RE-E19 i5-8265U, UHD Graphics 620 | 1.5 kg | 19.9 mm | 15.60" | 2x1 |

| SD Card Reader | |
| average JPG Copy Test (av. of 3 runs) | |
| LG Gram 15Z90N (Toshiba Exceria Pro M501 microSDXC 64GB) | |
| Schenker Work 15 (Toshiba Exceria Pro SDXC 64 GB UHS-II) | |
| Média da turma Subnotebook (23.7 - 188, n=9, últimos 2 anos) | |
| LG Gram 15Z980-B.AA78B (Toshiba Exceria Pro M501 64BG) | |
| Schenker Slim 15-RE-E19 (Toshiba Exceria Pro SDXC 64 GB UHS-II) | |
| MSI Modern 15 A10RB (Toshiba Exceria Pro M501 UHS-II) | |
| maximum AS SSD Seq Read Test (1GB) | |
| Média da turma Subnotebook (24.9 - 195, n=8, últimos 2 anos) | |
| LG Gram 15Z90N (Toshiba Exceria Pro M501 microSDXC 64GB) | |
| LG Gram 15Z980-B.AA78B (Toshiba Exceria Pro M501 64BG) | |
| Schenker Work 15 (Toshiba Exceria Pro SDXC 64 GB UHS-II) | |
| Schenker Slim 15-RE-E19 (Toshiba Exceria Pro SDXC 64 GB UHS-II) | |
| MSI Modern 15 A10RB (Toshiba Exceria Pro M501 UHS-II) | |
| Networking | |
| iperf3 transmit AX12 | |
| MSI Modern 15 A10RB | |
| Média Intel Wi-Fi 6 AX201 (49.8 - 1775, n=324) | |
| Schenker Work 15 | |
| Schenker Slim 15-RE-E19 | |
| LG Gram 15Z90N | |
| LG Gram 15Z980-B.AA78B | |
| iperf3 receive AX12 | |
| Média Intel Wi-Fi 6 AX201 (136 - 1743, n=324) | |
| MSI Modern 15 A10RB | |
| LG Gram 15Z90N | |
| Schenker Work 15 | |
| LG Gram 15Z980-B.AA78B | |
| Schenker Slim 15-RE-E19 | |

, i5-1035G7, SK Hynix PC401 512GB M.2 (HFS512GD9TNG)")
, i5-1035G7, SK Hynix PC401 512GB M.2 (HFS512GD9TNG)")
| |||||||||||||||||||||||||
iluminação: 88 %
iluminação com acumulador: 316 cd/m²
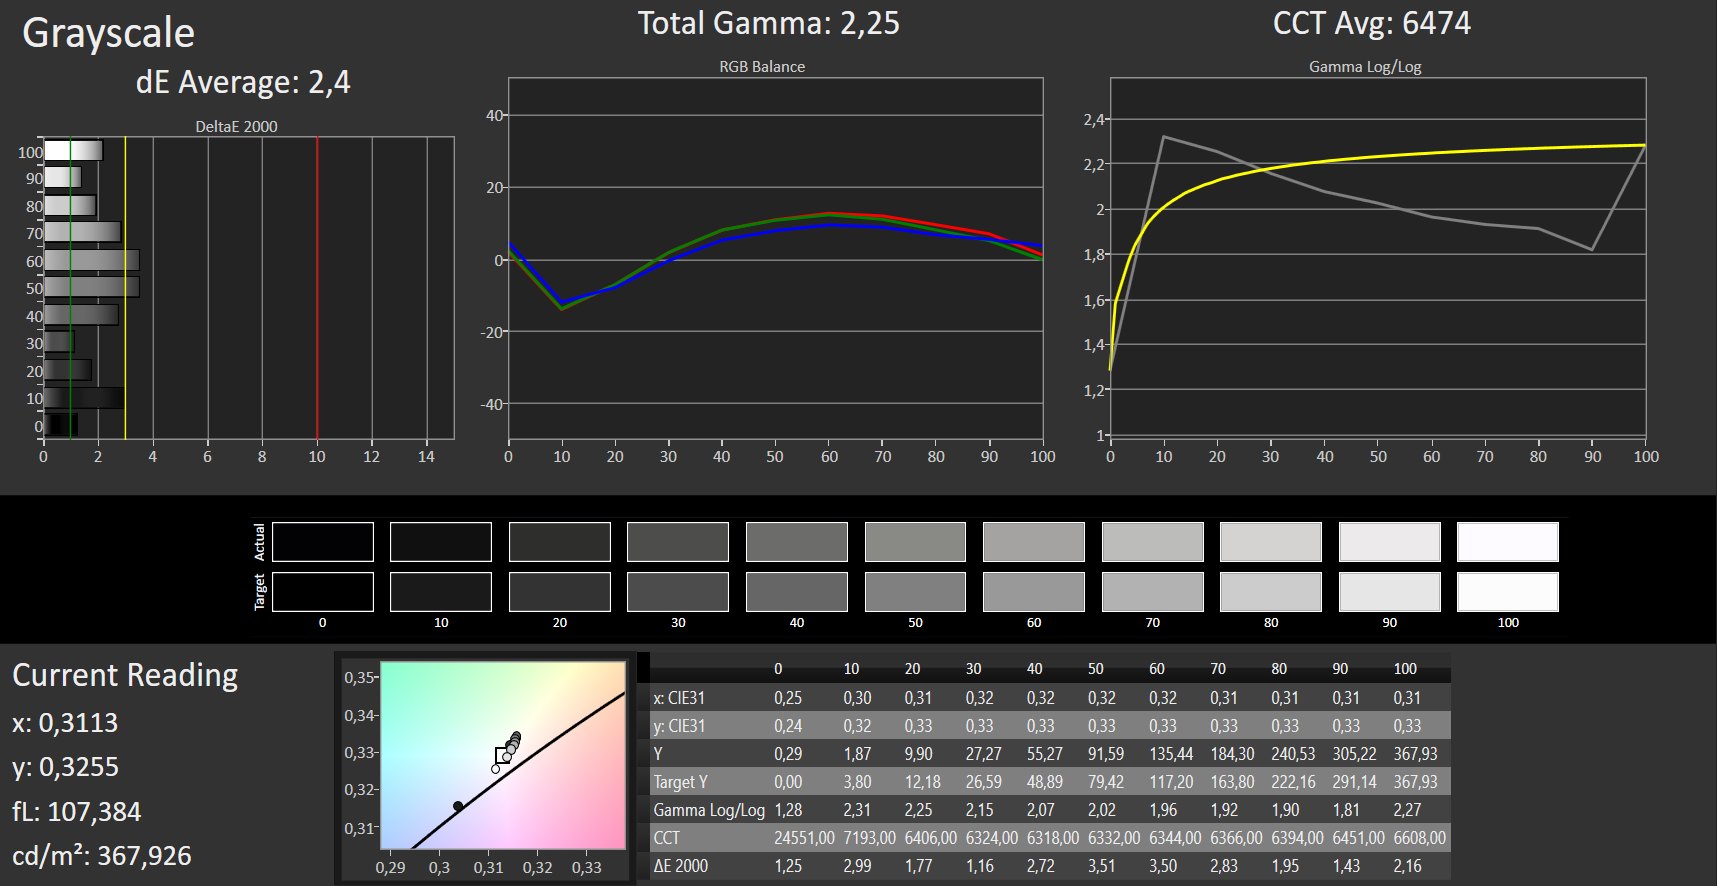
Contraste: 1307:1 (Preto: 0.28 cd/m²)
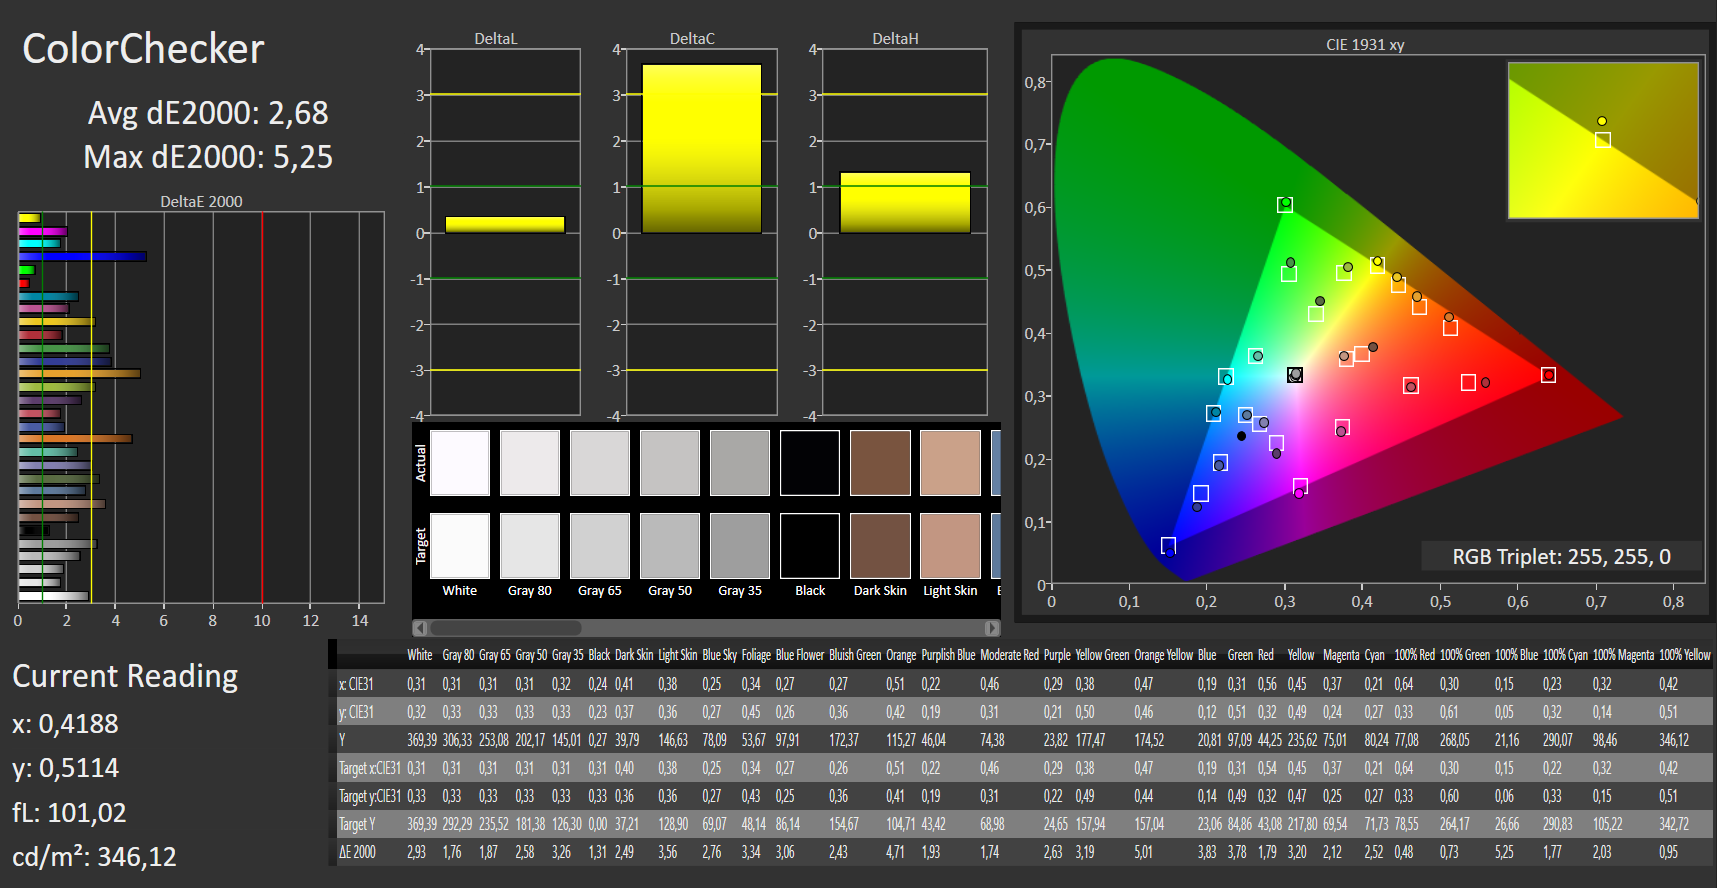
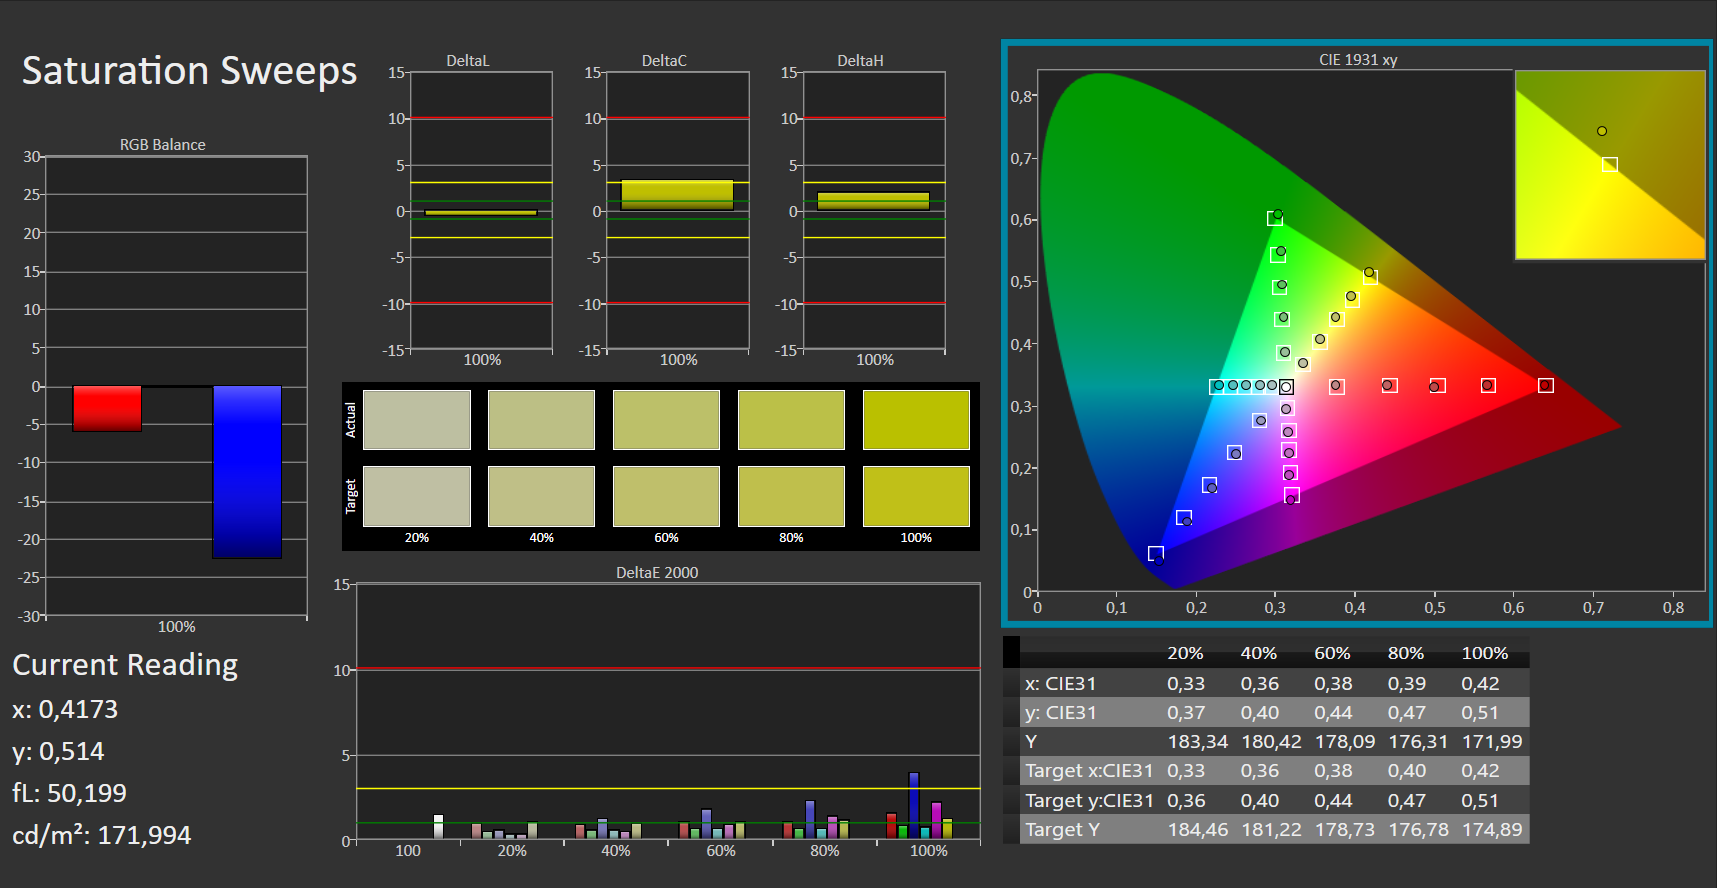
ΔE ColorChecker Calman: 2.68 | ∀{0.5-29.43 Ø4.71}
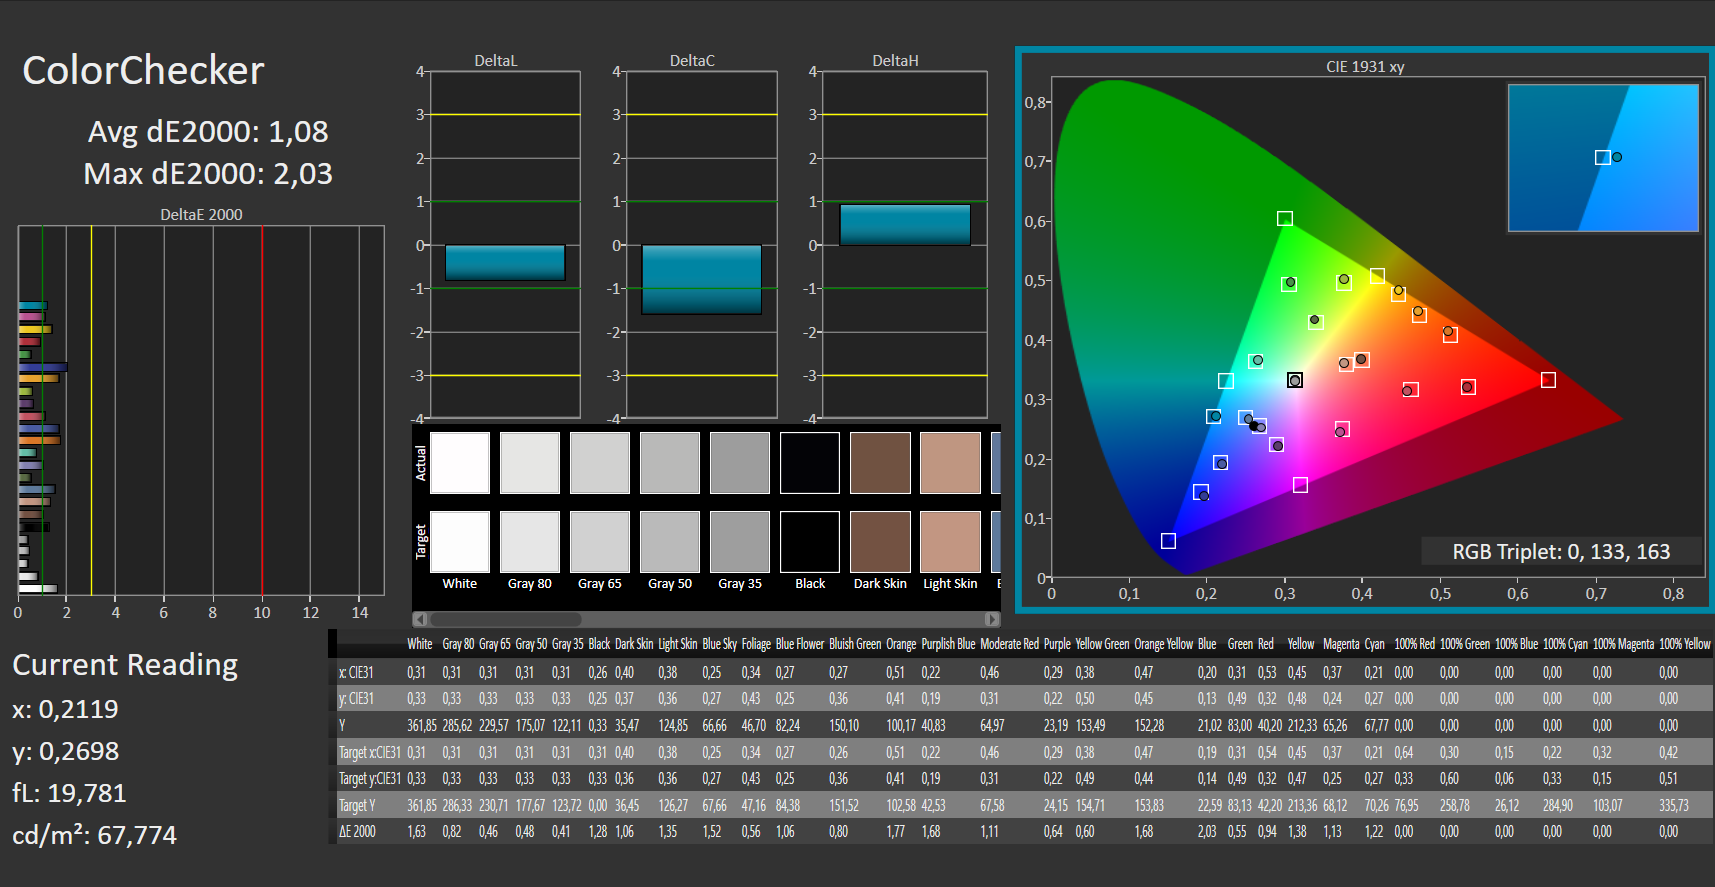
calibrated: 1.08
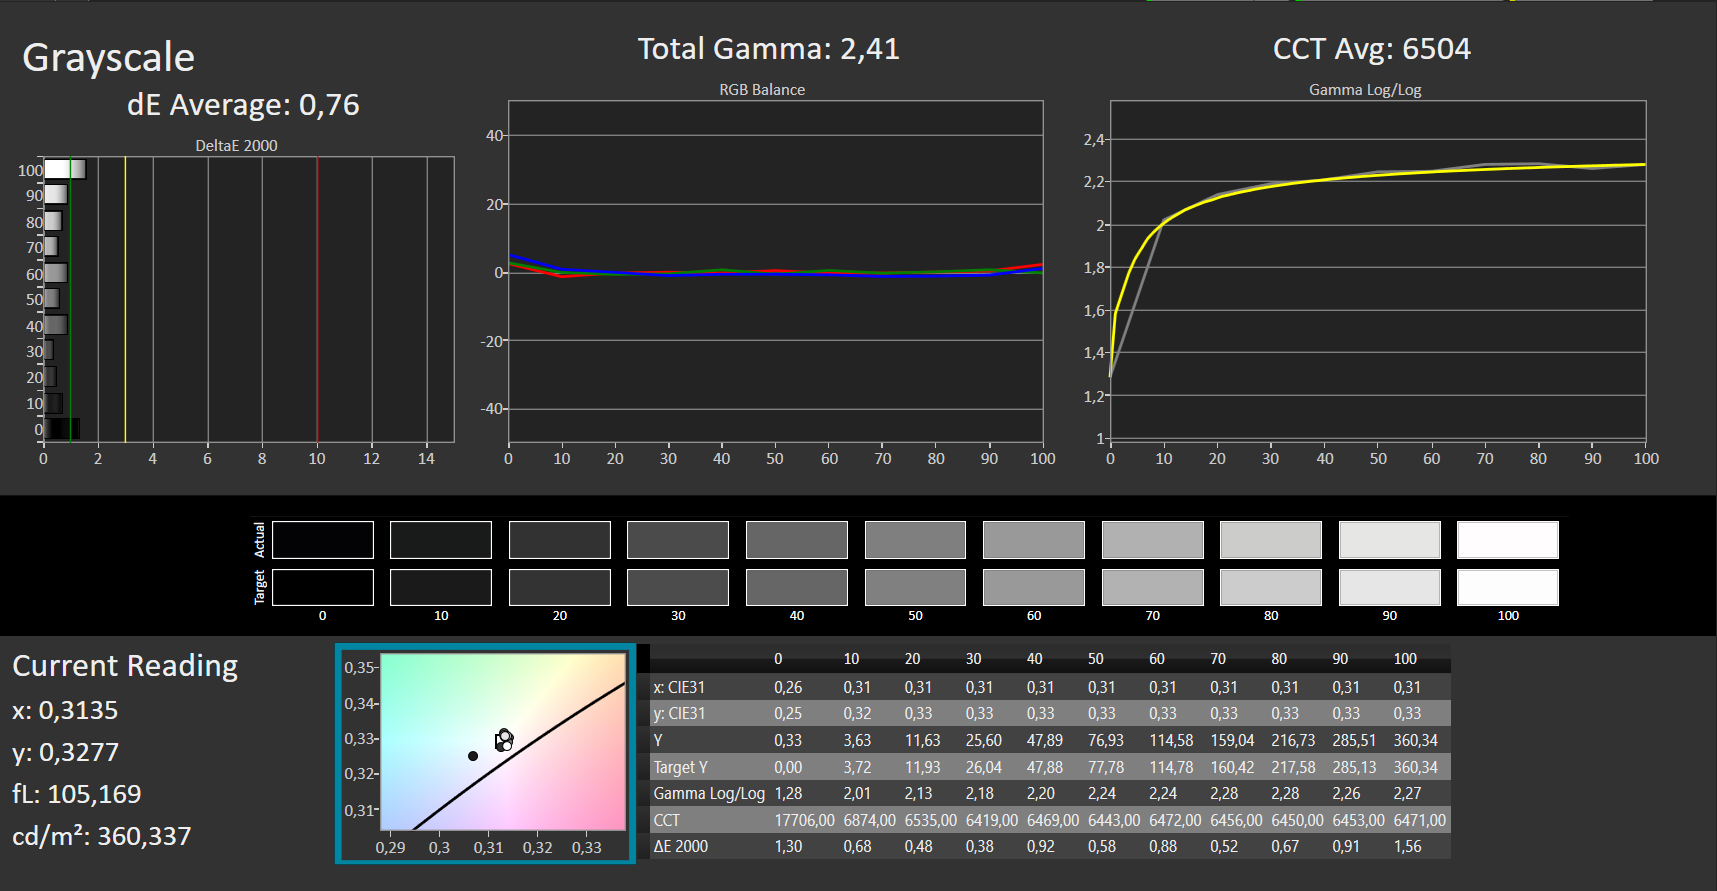
ΔE Greyscale Calman: 2.4 | ∀{0.09-98 Ø4.96}
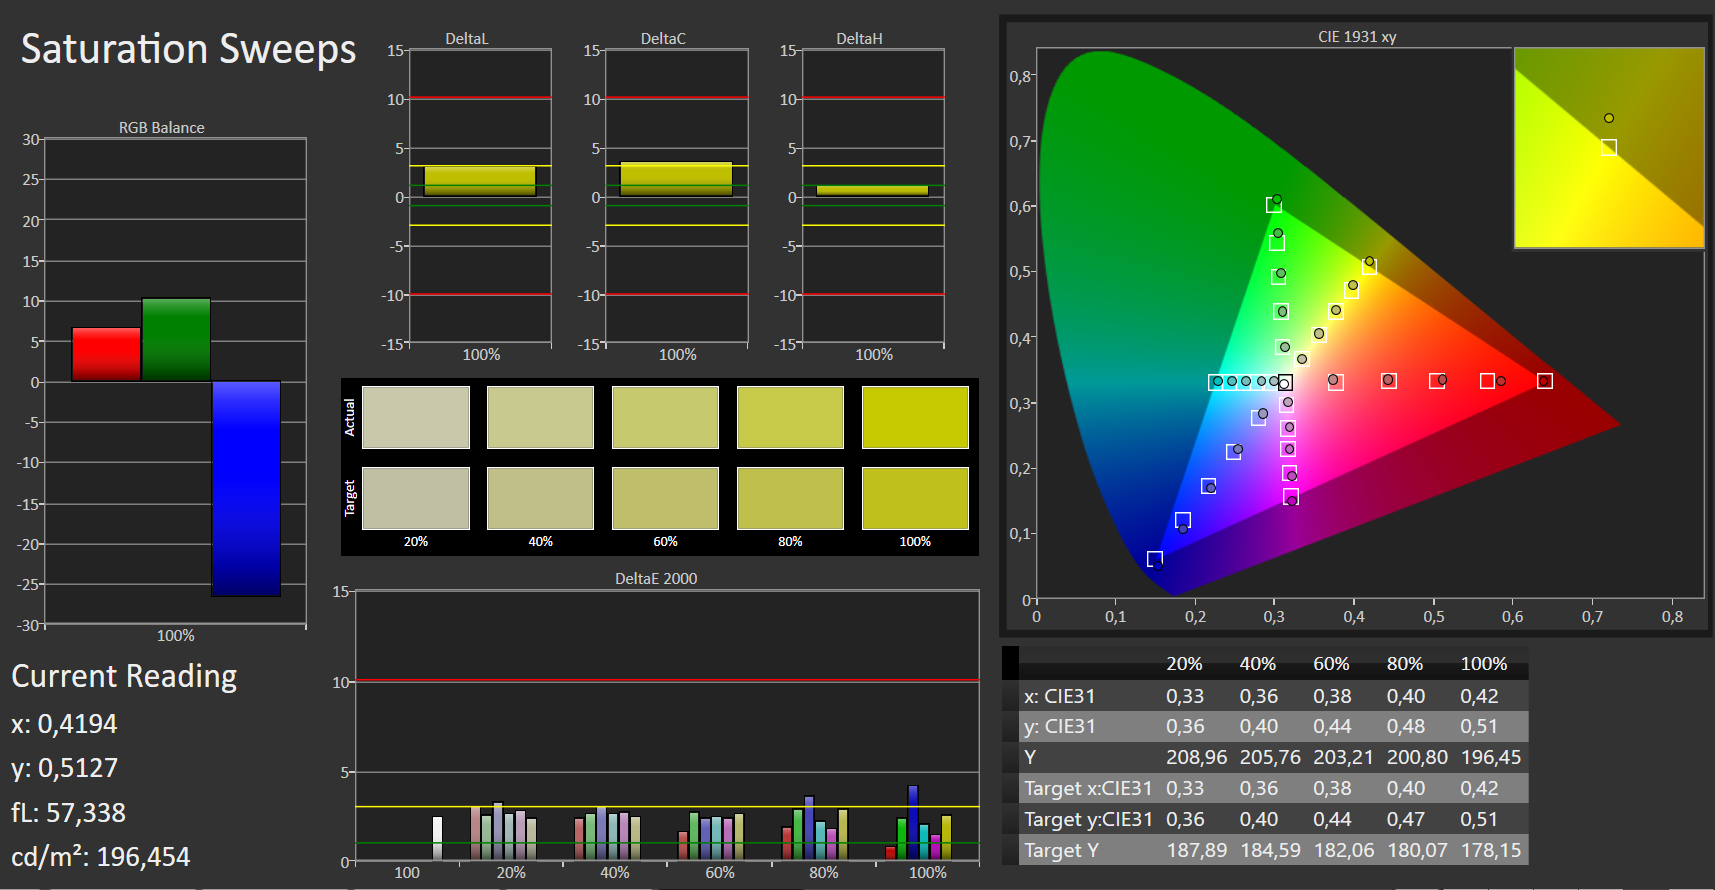
96% sRGB (Argyll 1.6.3 3D)
61% AdobeRGB 1998 (Argyll 1.6.3 3D)
66.8% AdobeRGB 1998 (Argyll 3D)
96.4% sRGB (Argyll 3D)
66% Display P3 (Argyll 3D)
Gamma: 2.25
CCT: 6474 K
| LG Gram 15Z90N LP156WF9-SPN1, .2 IPS LED, 1920x1080, 15.6" | LG Gram 15Z980-B.AA78B LP156WF9-SPN1, IPS LED, 1920x1080, 15.6" | MSI Modern 15 A10RB Chi Mei N156HCE-EN1, IPS, 1920x1080, 15.6" | Schenker Work 15 LP156WFC-SPP1, IPS, 1920x1080, 15.6" | Microsoft Surface Laptop 3 15 Ryzen 5 3580U Sharp LQ150P1JX51, IPS, 2496x1664, 15" | Schenker Slim 15-RE-E19 Chi Mei CMN15E8, IPS, 2x1, 15.6" | |
|---|---|---|---|---|---|---|
| Display | -1% | -1% | -41% | -0% | -5% | |
| Display P3 Coverage (%) | 66 | 65.3 -1% | 66 0% | 38.12 -42% | 66.9 1% | 63.7 -3% |
| sRGB Coverage (%) | 96.4 | 96.2 0% | 92.1 -4% | 57.4 -40% | 99.3 3% | 87.7 -9% |
| AdobeRGB 1998 Coverage (%) | 66.8 | 66.3 -1% | 66.5 0% | 39.39 -41% | 63.7 -5% | 63.9 -4% |
| Response Times | -2% | -38% | -14% | -49% | -6% | |
| Response Time Grey 50% / Grey 80% * (ms) | 36 ? | 34.3 ? 5% | 43.2 ? -20% | 37.2 ? -3% | 47.2 ? -31% | 37 ? -3% |
| Response Time Black / White * (ms) | 22 ? | 23.7 ? -8% | 34.4 ? -56% | 27.2 ? -24% | 36.8 ? -67% | 24 ? -9% |
| PWM Frequency (Hz) | 26040 ? | 21370 ? | 25000 ? | |||
| Screen | -15% | -20% | -72% | 0% | -26% | |
| Brightness middle (cd/m²) | 366 | 349 -5% | 289.4 -21% | 238 -35% | 416.9 14% | 289 -21% |
| Brightness (cd/m²) | 342 | 331 -3% | 273 -20% | 235 -31% | 389 14% | 280 -18% |
| Brightness Distribution (%) | 88 | 84 -5% | 82 -7% | 87 -1% | 86 -2% | 87 -1% |
| Black Level * (cd/m²) | 0.28 | 0.32 -14% | 0.27 4% | 0.14 50% | 0.4 -43% | 0.36 -29% |
| Contrast (:1) | 1307 | 1091 -17% | 1072 -18% | 1700 30% | 1042 -20% | 803 -39% |
| Colorchecker dE 2000 * | 2.68 | 3.1 -16% | 2.32 13% | 6.1 -128% | 2.75 -3% | 3.93 -47% |
| Colorchecker dE 2000 max. * | 5.25 | 6.6 -26% | 5.76 -10% | 14.2 -170% | 6.64 -26% | 6.98 -33% |
| Colorchecker dE 2000 calibrated * | 1.08 | 1.5 -39% | 2.49 -131% | 4.4 -307% | 0.71 34% | |
| Greyscale dE 2000 * | 2.4 | 3.3 -38% | 3 -25% | 5.2 -117% | 1.8 25% | 3.73 -55% |
| Gamma | 2.25 98% | 2.16 102% | 2.22 99% | 2.45 90% | 2.09 105% | 2.42 91% |
| CCT | 6474 100% | 6973 93% | 6867 95% | 7469 87% | 6646 98% | 6802 96% |
| Color Space (Percent of AdobeRGB 1998) (%) | 61 | 61.46 1% | 59.8 -2% | 36.3 -40% | 63.4 4% | 57 -7% |
| Color Space (Percent of sRGB) (%) | 96 | 96.05 0% | 92 -4% | 57.2 -40% | 99.4 4% | 87 -9% |
| Média Total (Programa/Configurações) | -6% /
-10% | -20% /
-19% | -42% /
-59% | -16% /
-6% | -12% /
-19% |
* ... menor é melhor
Exibir tempos de resposta
| ↔ Tempo de resposta preto para branco | ||
|---|---|---|
| 22 ms ... ascensão ↗ e queda ↘ combinadas | ↗ 12 ms ascensão | 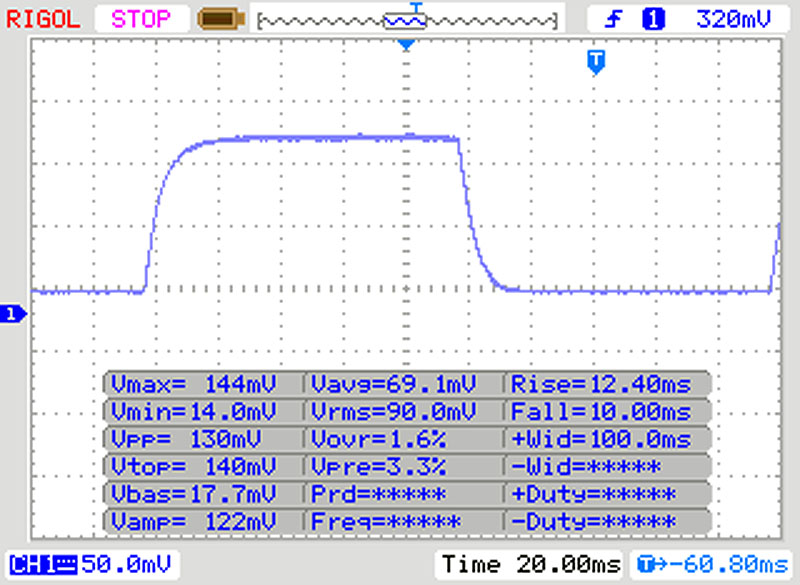 |
| ↘ 10 ms queda | ||
| A tela mostra boas taxas de resposta em nossos testes, mas pode ser muito lenta para jogadores competitivos. Em comparação, todos os dispositivos testados variam de 0.1 (mínimo) a 240 (máximo) ms. » 49 % de todos os dispositivos são melhores. Isso significa que o tempo de resposta medido é pior que a média de todos os dispositivos testados (19.8 ms). | ||
| ↔ Tempo de resposta 50% cinza a 80% cinza | ||
| 36 ms ... ascensão ↗ e queda ↘ combinadas | ↗ 18 ms ascensão | 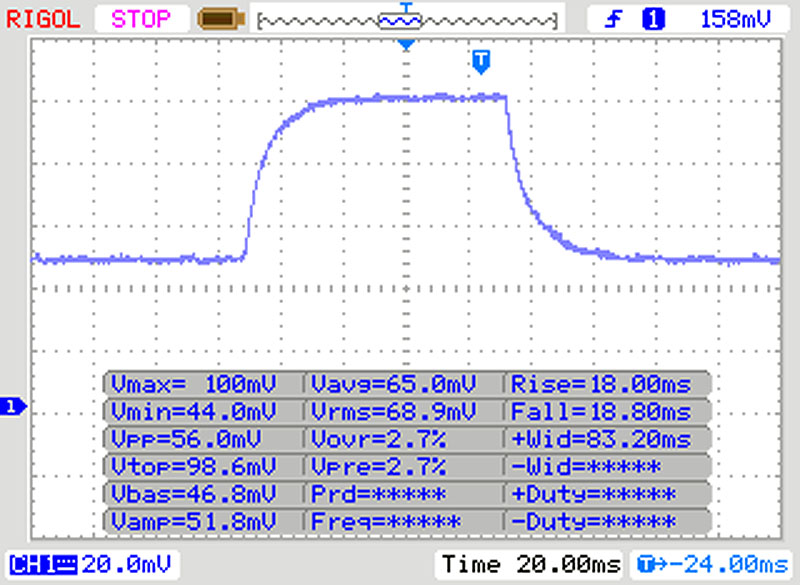 |
| ↘ 18 ms queda | ||
| A tela mostra taxas de resposta lentas em nossos testes e será insatisfatória para os jogadores. Em comparação, todos os dispositivos testados variam de 0.165 (mínimo) a 636 (máximo) ms. » 51 % de todos os dispositivos são melhores. Isso significa que o tempo de resposta medido é pior que a média de todos os dispositivos testados (31 ms). | ||
Cintilação da tela / PWM (modulação por largura de pulso)
| Tela tremeluzindo / PWM não detectado | 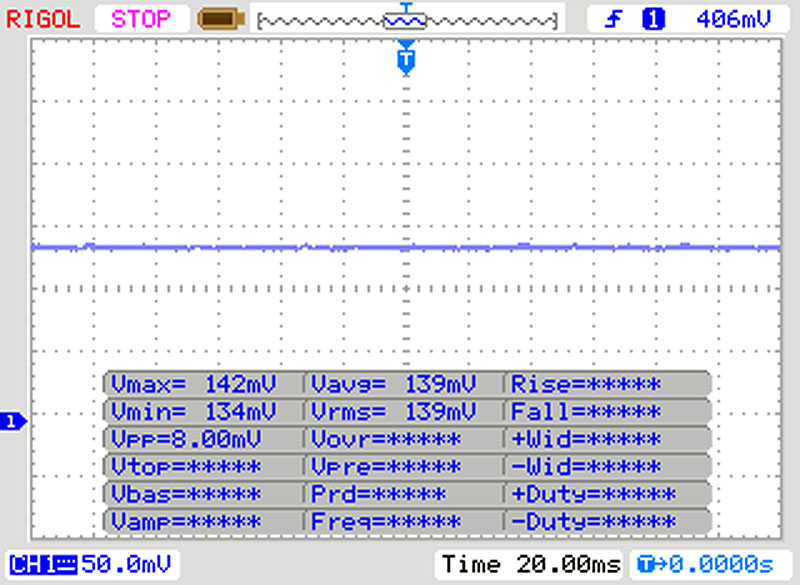 | ||
[pwm_comparison] Em comparação: 52 % de todos os dispositivos testados não usam PWM para escurecer a tela. Se PWM foi detectado, uma média de 7754 (mínimo: 5 - máximo: 343500) Hz foi medida. | |||
Cinebench R15: CPU Single 64Bit | CPU Multi 64Bit
Blender: v2.79 BMW27 CPU
7-Zip 18.03: 7z b 4 -mmt1 | 7z b 4
Geekbench 5.5: Single-Core | Multi-Core
HWBOT x265 Benchmark v2.2: 4k Preset
LibreOffice : 20 Documents To PDF
R Benchmark 2.5: Overall mean
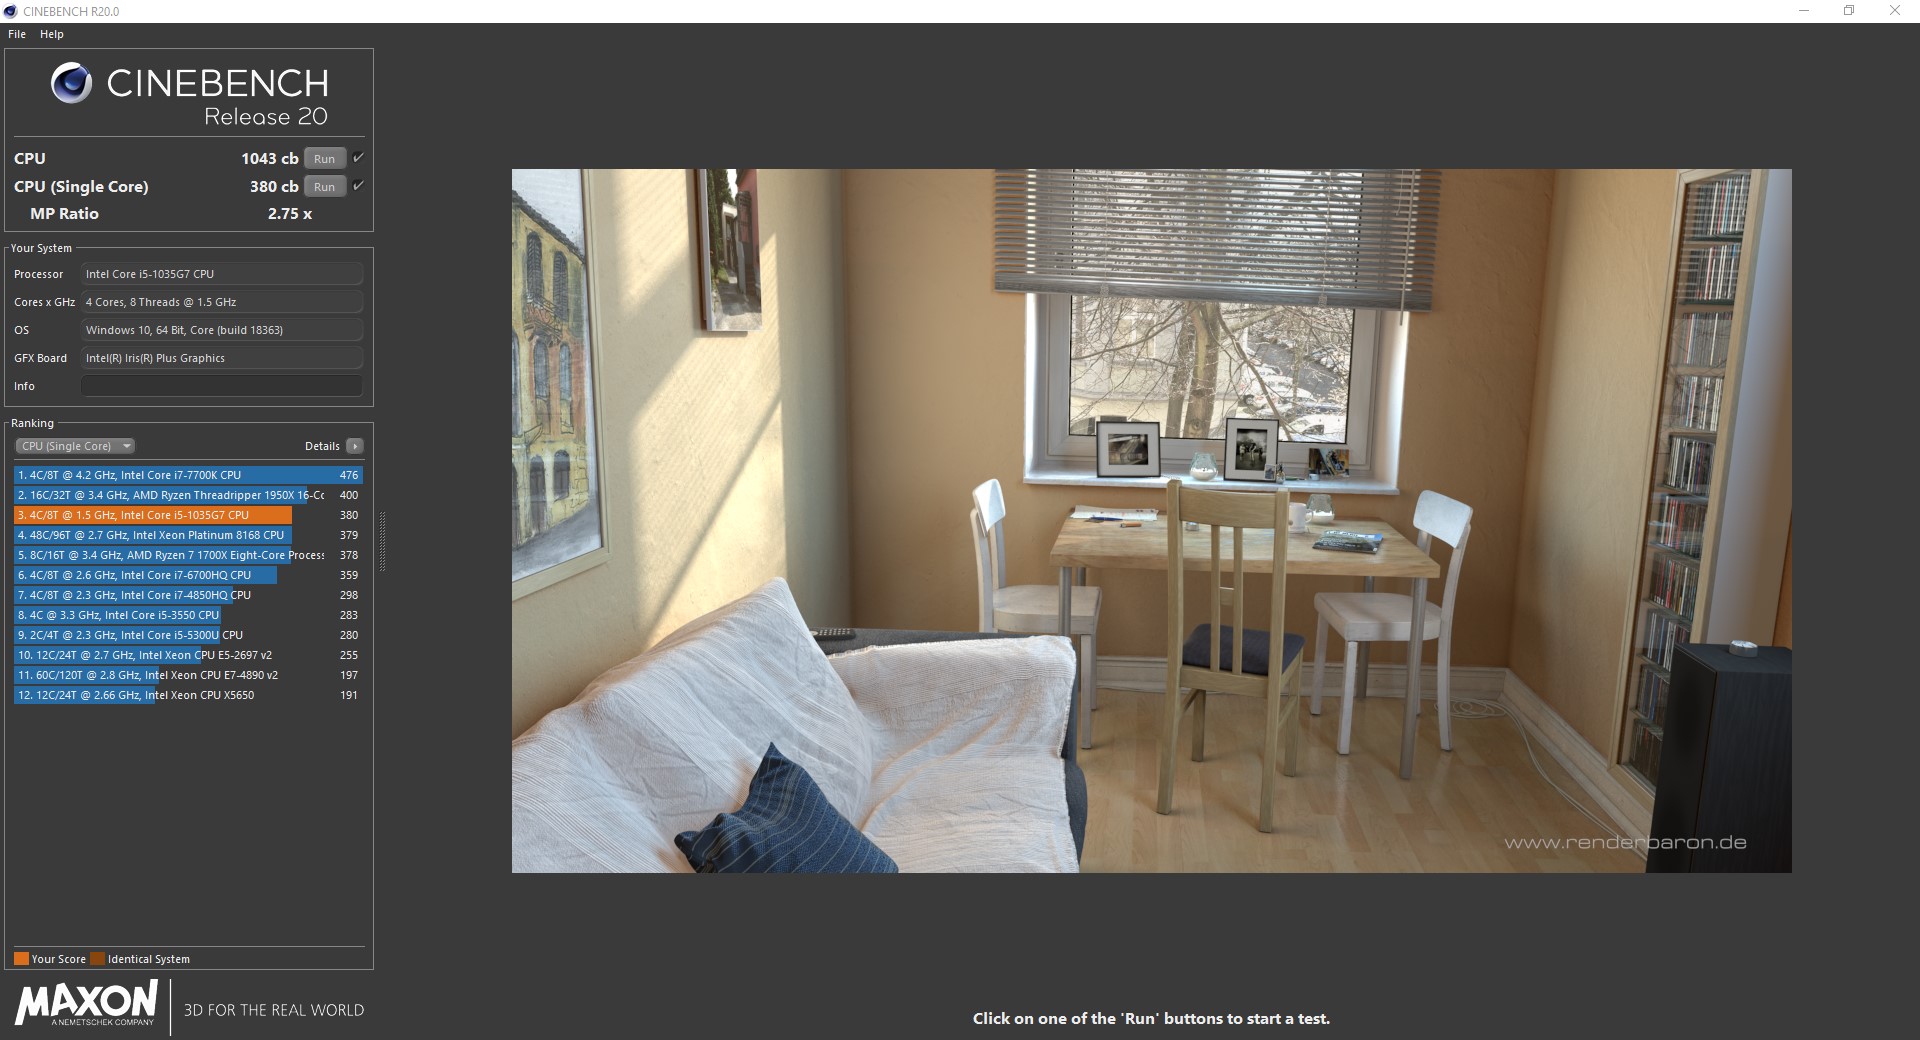
| Cinebench R20 / CPU (Single Core) | |
| Média da turma Subnotebook (128 - 832, n=56, últimos 2 anos) | |
| MSI Modern 15 A10RB | |
| Média Intel Core i5-1035G7 (380 - 439, n=3) | |
| Schenker Work 15 | |
| LG Gram 15Z90N | |
| Microsoft Surface Laptop 3 15 Ryzen 5 3580U | |
| Cinebench R20 / CPU (Multi Core) | |
| Média da turma Subnotebook (579 - 8541, n=56, últimos 2 anos) | |
| Schenker Work 15 | |
| MSI Modern 15 A10RB | |
| Microsoft Surface Laptop 3 15 Ryzen 5 3580U | |
| Média Intel Core i5-1035G7 (1043 - 1630, n=3) | |
| LG Gram 15Z90N | |
| Cinebench R15 / CPU Single 64Bit | |
| Média da turma Subnotebook (72.4 - 322, n=56, últimos 2 anos) | |
| MSI Modern 15 A10RB | |
| Schenker Work 15 | |
| Média Intel Core i5-1035G7 (153 - 172, n=3) | |
| Schenker Slim 15-RE-E19 | |
| LG Gram 15Z980-B.AA78B | |
| LG Gram 15Z90N | |
| Microsoft Surface Laptop 3 15 Ryzen 5 3580U | |
| Cinebench R15 / CPU Multi 64Bit | |
| Média da turma Subnotebook (327 - 3345, n=56, últimos 2 anos) | |
| Schenker Work 15 | |
| MSI Modern 15 A10RB | |
| Microsoft Surface Laptop 3 15 Ryzen 5 3580U | |
| Média Intel Core i5-1035G7 (539 - 736, n=3) | |
| Schenker Slim 15-RE-E19 | |
| LG Gram 15Z90N | |
| LG Gram 15Z980-B.AA78B | |
| Blender / v2.79 BMW27 CPU | |
| LG Gram 15Z90N | |
| LG Gram 15Z980-B.AA78B | |
| Média Intel Core i5-1035G7 (771 - 1075, n=3) | |
| Microsoft Surface Laptop 3 15 Ryzen 5 3580U | |
| Schenker Work 15 | |
| Schenker Work 15 | |
| Média da turma Subnotebook (159 - 2271, n=57, últimos 2 anos) | |
| 7-Zip 18.03 / 7z b 4 -mmt1 | |
| Média da turma Subnotebook (2643 - 6699, n=58, últimos 2 anos) | |
| Schenker Work 15 | |
| Schenker Work 15 | |
| Média Intel Core i5-1035G7 (4091 - 4252, n=3) | |
| LG Gram 15Z90N | |
| Microsoft Surface Laptop 3 15 Ryzen 5 3580U | |
| 7-Zip 18.03 / 7z b 4 | |
| Média da turma Subnotebook (11668 - 77867, n=56, últimos 2 anos) | |
| Schenker Work 15 | |
| Schenker Work 15 | |
| Média Intel Core i5-1035G7 (13921 - 19168, n=3) | |
| Microsoft Surface Laptop 3 15 Ryzen 5 3580U | |
| LG Gram 15Z90N | |
| Geekbench 5.5 / Single-Core | |
| Média da turma Subnotebook (726 - 2224, n=48, últimos 2 anos) | |
| LG Gram 15Z90N | |
| Média Intel Core i5-1035G7 (n=1) | |
| Microsoft Surface Laptop 3 15 Ryzen 5 3580U | |
| Geekbench 5.5 / Multi-Core | |
| Média da turma Subnotebook (2557 - 17218, n=48, últimos 2 anos) | |
| Microsoft Surface Laptop 3 15 Ryzen 5 3580U | |
| LG Gram 15Z90N | |
| Média Intel Core i5-1035G7 (n=1) | |
| HWBOT x265 Benchmark v2.2 / 4k Preset | |
| Média da turma Subnotebook (0.97 - 25.1, n=56, últimos 2 anos) | |
| Schenker Work 15 | |
| Schenker Work 15 | |
| Média Intel Core i5-1035G7 (4.63 - 4.71, n=2) | |
| Microsoft Surface Laptop 3 15 Ryzen 5 3580U | |
| LG Gram 15Z980-B.AA78B | |
| LibreOffice / 20 Documents To PDF | |
| Média da turma Subnotebook (39.9 - 220, n=55, últimos 2 anos) | |
| Média Intel Core i5-1035G7 (n=1) | |
| LG Gram 15Z90N | |
| R Benchmark 2.5 / Overall mean | |
| LG Gram 15Z90N | |
| Média Intel Core i5-1035G7 (n=1) | |
| Média da turma Subnotebook (0.4024 - 1.456, n=57, últimos 2 anos) | |
* ... menor é melhor
| PCMark 8 | |
| Home Score Accelerated v2 | |
| Schenker Work 15 | |
| MSI Modern 15 A10RB | |
| Média Intel Core i5-1035G7, Intel Iris Plus Graphics G7 (Ice Lake 64 EU) (3497 - 3725, n=2) | |
| LG Gram 15Z90N | |
| Schenker Slim 15-RE-E19 | |
| Microsoft Surface Laptop 3 15 Ryzen 5 3580U | |
| LG Gram 15Z980-B.AA78B | |
| Média da turma Subnotebook (1739 - 1828, n=2, últimos 2 anos) | |
| Work Score Accelerated v2 | |
| MSI Modern 15 A10RB | |
| Schenker Work 15 | |
| LG Gram 15Z90N | |
| Média Intel Core i5-1035G7, Intel Iris Plus Graphics G7 (Ice Lake 64 EU) (4755 - 4772, n=2) | |
| Microsoft Surface Laptop 3 15 Ryzen 5 3580U | |
| LG Gram 15Z980-B.AA78B | |
| Média da turma Subnotebook (1609 - 1656, n=2, últimos 2 anos) | |
| PCMark 8 Home Score Accelerated v2 | 3497 pontos | |
| PCMark 8 Creative Score Accelerated v2 | 5038 pontos | |
| PCMark 8 Work Score Accelerated v2 | 4772 pontos | |
| PCMark 10 Score | 3906 pontos | |
Ajuda | ||
| DPC Latencies / LatencyMon - interrupt to process latency (max), Web, Youtube, Prime95 | |
| LG Gram 15Z90N | |
* ... menor é melhor
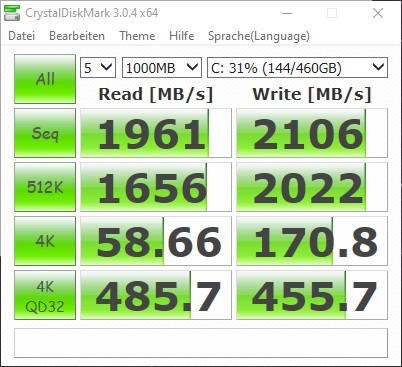
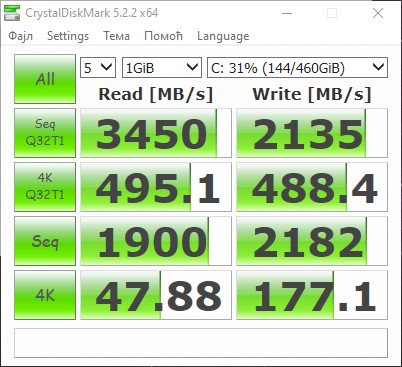
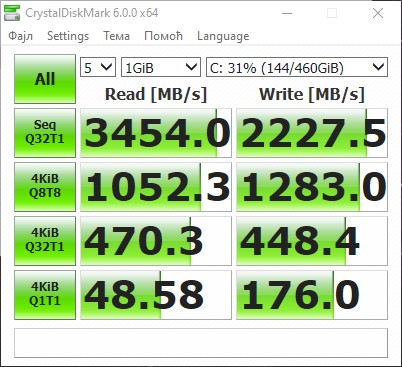
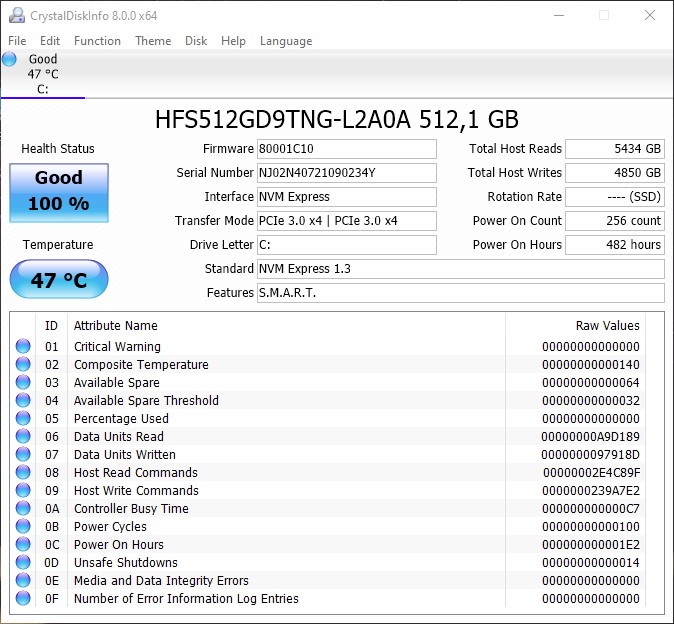
| LG Gram 15Z90N SK Hynix PC401 512GB M.2 (HFS512GD9TNG) | MSI Modern 15 A10RB WDC PC SN730 SDBPNTY-512G | Schenker Work 15 Samsung SSD 970 EVO Plus 500GB | Microsoft Surface Laptop 3 15 Ryzen 5 3580U SK hynix BC501 HFM256GDGTNG | Schenker Slim 15-RE-E19 Samsung SSD 970 EVO Plus 500GB | Média SK Hynix PC401 512GB M.2 (HFS512GD9TNG) | |
|---|---|---|---|---|---|---|
| CrystalDiskMark 5.2 / 6 | 15% | 8% | -45% | 0% | -17% | |
| Write 4K (MB/s) | 177.1 | 208.4 18% | 149.6 -16% | 99 -44% | 187.2 6% | 143.3 ? -19% |
| Read 4K (MB/s) | 47.88 | 51 7% | 49.29 3% | 35.63 -26% | 51.8 8% | 45.3 ? -5% |
| Write Seq (MB/s) | 2182 | 2687 23% | 1653 -24% | 706 -68% | 1438 -34% | 1514 ? -31% |
| Read Seq (MB/s) | 1900 | 2168 14% | 1468 -23% | 1044 -45% | 1347 -29% | 1758 ? -7% |
| Write 4K Q32T1 (MB/s) | 448.4 | 489.2 9% | 478.2 7% | 326.6 -27% | 396.7 -12% | 425 ? -5% |
| Read 4K Q32T1 (MB/s) | 470.3 | 600 28% | 561 19% | 270 -43% | 534 14% | 459 ? -2% |
| Write Seq Q32T1 (MB/s) | 2228 | 2699 21% | 3272 47% | 820 -63% | 3280 47% | 1531 ? -31% |
| Read Seq Q32T1 (MB/s) | 3454 | 3374 -2% | 3550 3% | 2028 -41% | 3556 3% | 2895 ? -16% |
| Write 4K Q8T8 (MB/s) | 1283 | 2067 61% | 918 ? -28% | |||
| Read 4K Q8T8 (MB/s) | 1052 | 1064 1% | 819 ? -22% | |||
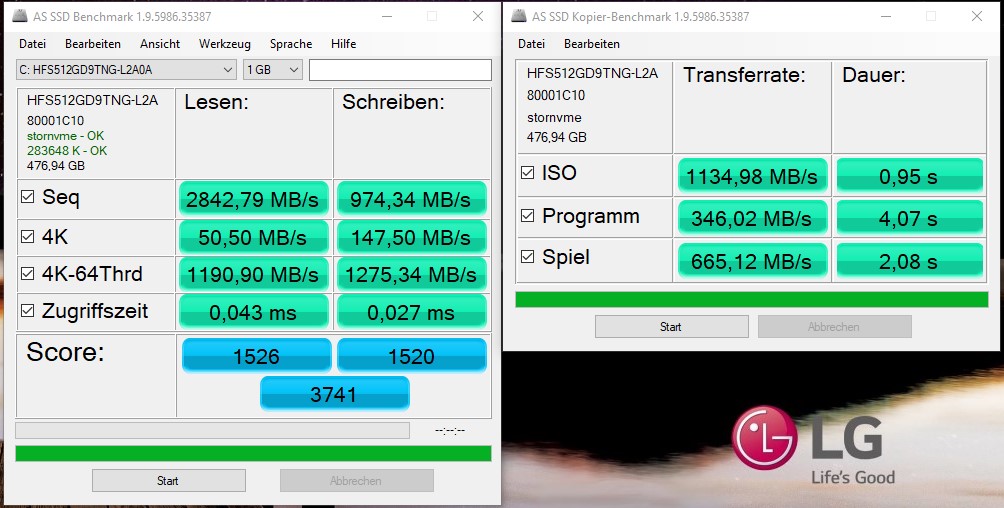
| AS SSD | 7% | 36% | -67% | 23% | -13% | |
| Seq Read (MB/s) | 2842 | 2084 -27% | 2716 -4% | 1122 -61% | 2661 -6% | 2266 ? -20% |
| Seq Write (MB/s) | 974 | 2442 151% | 2531 160% | 514 -47% | 2426 149% | 1137 ? 17% |
| 4K Read (MB/s) | 50.5 | 47.52 -6% | 55.9 11% | 34.98 -31% | 59 17% | 43.2 ? -14% |
| 4K Write (MB/s) | 147.5 | 135.8 -8% | 134.7 -9% | 96.8 -34% | 166 13% | 118.8 ? -19% |
| 4K-64 Read (MB/s) | 1191 | 1043 -12% | 1183 -1% | 492 -59% | 1314 10% | 819 ? -31% |
| 4K-64 Write (MB/s) | 1275 | 955 -25% | 2280 79% | 339.9 -73% | 1494 17% | 956 ? -25% |
| Access Time Read * (ms) | 0.043 | 0.062 -44% | 0.034 21% | 0.056 -30% | 0.046 -7% | 0.04909 ? -14% |
| Access Time Write * (ms) | 0.027 | 0.076 -181% | 0.028 -4% | 0.11 -307% | 0.023 15% | 0.04845 ? -79% |
| Score Read (Points) | 1526 | 1299 -15% | 1510 -1% | 639 -58% | 1639 7% | 1089 ? -29% |
| Score Write (Points) | 1520 | 1335 -12% | 2668 76% | 488 -68% | 1902 25% | 1188 ? -22% |
| Score Total (Points) | 3741 | 3326 -11% | 4952 32% | 1434 -62% | 4379 17% | 2787 ? -26% |
| Copy ISO MB/s (MB/s) | 1135 | 1926 70% | 2041 80% | 828 -27% | 1286 ? 13% | |
| Copy Program MB/s (MB/s) | 346 | 714 106% | 405.7 17% | 200.5 -42% | 470 ? 36% | |
| Copy Game MB/s (MB/s) | 665 | 1425 114% | 1000 50% | 387.4 -42% | 837 ? 26% | |
| Média Total (Programa/Configurações) | 11% /
10% | 22% /
24% | -56% /
-59% | 12% /
14% | -15% /
-15% |
* ... menor é melhor

Dauerleistung Lesen: DiskSpd Read Loop, Queue Depth 8
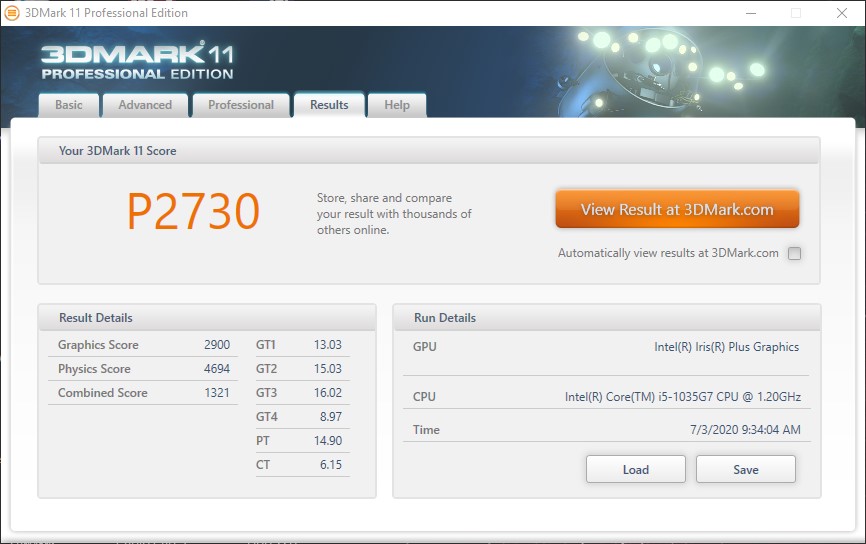
| 3DMark 11 - 1280x720 Performance GPU | |
| Média da turma Subnotebook (995 - 18489, n=54, últimos 2 anos) | |
| MSI Modern 15 A10RB | |
| Microsoft Surface Laptop 3 15 Ryzen 5 3580U | |
| Média Intel Iris Plus Graphics G7 (Ice Lake 64 EU) (2112 - 4630, n=28) | |
| LG Gram 15Z90N | |
| Schenker Slim 15-RE-E19 | |
| Schenker Work 15 | |
| 3DMark | |
| 1280x720 Cloud Gate Standard Graphics | |
| Média da turma Subnotebook (5577 - 61591, n=28, últimos 2 anos) | |
| MSI Modern 15 A10RB | |
| Microsoft Surface Laptop 3 15 Ryzen 5 3580U | |
| Média Intel Iris Plus Graphics G7 (Ice Lake 64 EU) (7024 - 18881, n=24) | |
| Schenker Work 15 | |
| LG Gram 15Z980-B.AA78B | |
| LG Gram 15Z90N | |
| 1920x1080 Fire Strike Graphics | |
| Média da turma Subnotebook (832 - 16347, n=55, últimos 2 anos) | |
| MSI Modern 15 A10RB | |
| Microsoft Surface Laptop 3 15 Ryzen 5 3580U | |
| Média Intel Iris Plus Graphics G7 (Ice Lake 64 EU) (1418 - 3156, n=27) | |
| LG Gram 15Z90N | |
| Schenker Work 15 | |
| LG Gram 15Z980-B.AA78B | |
| 3DMark 11 Performance | 2736 pontos | |
| 3DMark Ice Storm Standard Score | 14678 pontos | |
| 3DMark Cloud Gate Standard Score | 6616 pontos | |
| 3DMark Fire Strike Score | 1298 pontos | |
| 3DMark Fire Strike Extreme Score | 626 pontos | |
Ajuda | ||
| baixo | média | alto | ultra | |
|---|---|---|---|---|
| BioShock Infinite (2013) | 48.6 | 25.8 | 21.1 | 7.8 |
| Dota 2 Reborn (2015) | 54.4 | 29 | 17.5 | 16.4 |
| Rise of the Tomb Raider (2016) | 19.5 | 15.3 | 7.89 | 6.28 |
| X-Plane 11.11 (2018) | 21.5 | 11.4 | 11.3 |
Barulho
| Ocioso |
| 30.7 / 30.7 / 31.9 dB |
| Carga |
| 34 / 34.2 dB |
 | ||
30 dB silencioso 40 dB(A) audível 50 dB(A) ruidosamente alto |
||
min: | ||
(+) A temperatura máxima no lado superior é 38 °C / 100 F, em comparação com a média de 35.9 °C / 97 F , variando de 21.4 a 59 °C para a classe Subnotebook.
(+) A parte inferior aquece até um máximo de 38.6 °C / 101 F, em comparação com a média de 39.2 °C / 103 F
(+) Em uso inativo, a temperatura média para o lado superior é 25.3 °C / 78 F, em comparação com a média do dispositivo de 30.8 °C / ### class_avg_f### F.
(+) Os apoios para as mãos e o touchpad são mais frios que a temperatura da pele, com um máximo de 28.2 °C / 82.8 F e, portanto, são frios ao toque.
(±) A temperatura média da área do apoio para as mãos de dispositivos semelhantes foi 28.2 °C / 82.8 F (0 °C / 0 F).
| LG Gram 15Z90N Iris Plus Graphics G7 (Ice Lake 64 EU), i5-1035G7, SK Hynix PC401 512GB M.2 (HFS512GD9TNG) | LG Gram 15Z980-B.AA78B UHD Graphics 620, i5-8550U, SK Hynix Canvas SC300 512GB M.2 (HFS512G39TNF) | MSI Modern 15 A10RB GeForce MX250, i7-10510U, WDC PC SN730 SDBPNTY-512G | Schenker Work 15 UHD Graphics 630, i7-8750H, Samsung SSD 970 EVO Plus 500GB | Microsoft Surface Laptop 3 15 Ryzen 5 3580U Vega 9, R5 3580U, SK hynix BC501 HFM256GDGTNG | Schenker Slim 15-RE-E19 UHD Graphics 620, i5-8265U, Samsung SSD 970 EVO Plus 500GB | |
|---|---|---|---|---|---|---|
| Heat | -7% | -29% | -1% | -13% | -6% | |
| Maximum Upper Side * (°C) | 38 | 43 -13% | 54.2 -43% | 40.2 -6% | 43.6 -15% | 40.3 -6% |
| Maximum Bottom * (°C) | 38.6 | 41 -6% | 59.4 -54% | 43 -11% | 49.4 -28% | 47.1 -22% |
| Idle Upper Side * (°C) | 26.5 | 28 -6% | 28 -6% | 24.7 7% | 27.4 -3% | 25 6% |
| Idle Bottom * (°C) | 26.5 | 27 -2% | 30 -13% | 24.4 8% | 27.8 -5% | 26.4 -0% |
* ... menor é melhor
LG Gram 15Z90N análise de áudio
(±) | o volume do alto-falante é médio, mas bom (###valor### dB)
Graves 100 - 315Hz
(-) | quase nenhum baixo - em média 22.5% menor que a mediana
(±) | a linearidade dos graves é média (10.3% delta para a frequência anterior)
Médios 400 - 2.000 Hz
(+) | médios equilibrados - apenas 4.3% longe da mediana
(±) | a linearidade dos médios é média (7.1% delta para frequência anterior)
Altos 2 - 16 kHz
(+) | agudos equilibrados - apenas 1.2% longe da mediana
(+) | os máximos são lineares (3.7% delta da frequência anterior)
Geral 100 - 16.000 Hz
(±) | a linearidade do som geral é média (18.8% diferença em relação à mediana)
Comparado com a mesma classe
» 56% de todos os dispositivos testados nesta classe foram melhores, 7% semelhantes, 37% piores
» O melhor teve um delta de 5%, a média foi 18%, o pior foi 53%
Comparado com todos os dispositivos testados
» 43% de todos os dispositivos testados foram melhores, 8% semelhantes, 49% piores
» O melhor teve um delta de 4%, a média foi 23%, o pior foi 134%
MSI Modern 15 A10RB análise de áudio
(+) | os alto-falantes podem tocar relativamente alto (###valor### dB)
Graves 100 - 315Hz
(-) | quase nenhum baixo - em média 19.1% menor que a mediana
(±) | a linearidade dos graves é média (12.2% delta para a frequência anterior)
Médios 400 - 2.000 Hz
(+) | médios equilibrados - apenas 4.4% longe da mediana
(±) | a linearidade dos médios é média (10.2% delta para frequência anterior)
Altos 2 - 16 kHz
(+) | agudos equilibrados - apenas 1.3% longe da mediana
(+) | os máximos são lineares (6.8% delta da frequência anterior)
Geral 100 - 16.000 Hz
(±) | a linearidade do som geral é média (20.6% diferença em relação à mediana)
Comparado com a mesma classe
» 48% de todos os dispositivos testados nesta classe foram melhores, 9% semelhantes, 43% piores
» O melhor teve um delta de 7%, a média foi 21%, o pior foi 53%
Comparado com todos os dispositivos testados
» 55% de todos os dispositivos testados foram melhores, 8% semelhantes, 37% piores
» O melhor teve um delta de 4%, a média foi 23%, o pior foi 134%
| desligado | |
| Ocioso | |
| Carga |
|
Key:
min: | |
| LG Gram 15Z90N i5-1035G7, Iris Plus Graphics G7 (Ice Lake 64 EU), SK Hynix PC401 512GB M.2 (HFS512GD9TNG), .2 IPS LED, 1920x1080, 15.6" | LG Gram 15Z980-B.AA78B i5-8550U, UHD Graphics 620, SK Hynix Canvas SC300 512GB M.2 (HFS512G39TNF), IPS LED, 1920x1080, 15.6" | MSI Modern 15 A10RB i7-10510U, GeForce MX250, WDC PC SN730 SDBPNTY-512G, IPS, 1920x1080, 15.6" | Schenker Work 15 i7-8750H, UHD Graphics 630, Samsung SSD 970 EVO Plus 500GB, IPS, 1920x1080, 15.6" | Microsoft Surface Laptop 3 15 Ryzen 5 3580U R5 3580U, Vega 9, SK hynix BC501 HFM256GDGTNG, IPS, 2496x1664, 15" | Schenker Slim 15-RE-E19 i5-8265U, UHD Graphics 620, Samsung SSD 970 EVO Plus 500GB, IPS, 2x1, 15.6" | Média Intel Iris Plus Graphics G7 (Ice Lake 64 EU) | Média da turma Subnotebook | |
|---|---|---|---|---|---|---|---|---|
| Power Consumption | -18% | -118% | -35% | -15% | -5% | -18% | -24% | |
| Idle Minimum * (Watt) | 2.9 | 3.7 -28% | 6.6 -128% | 3.7 -28% | 3.3 -14% | 3.2 -10% | 3.91 ? -35% | 3.73 ? -29% |
| Idle Average * (Watt) | 7.7 | 8.5 -10% | 9.9 -29% | 6.4 17% | 7.1 8% | 6.5 16% | 7.33 ? 5% | 6.51 ? 15% |
| Idle Maximum * (Watt) | 11.4 | 10 12% | 14.7 -29% | 7.1 38% | 7.2 37% | 11.3 1% | 9.16 ? 20% | 7.88 ? 31% |
| Load Average * (Watt) | 31.5 | 36 -14% | 82.9 -163% | 42.5 -35% | 44.8 -42% | 32 -2% | 39.2 ? -24% | 42.3 ? -34% |
| Load Maximum * (Watt) | 32 | 48.7 -52% | 109.3 -242% | 86 -169% | 53 -66% | 42.2 -32% | 49.8 ? -56% | 64.8 ? -103% |
| Witcher 3 ultra * (Watt) | 59.4 | 45.1 |
* ... menor é melhor


| LG Gram 15Z90N i5-1035G7, Iris Plus Graphics G7 (Ice Lake 64 EU), 80 Wh | LG Gram 15Z980-B.AA78B i5-8550U, UHD Graphics 620, 72 Wh | MSI Modern 15 A10RB i7-10510U, GeForce MX250, 52 Wh | Schenker Work 15 i7-8750H, UHD Graphics 630, 62 Wh | Microsoft Surface Laptop 3 15 Ryzen 5 3580U R5 3580U, Vega 9, 45 Wh | Schenker Slim 15-RE-E19 i5-8265U, UHD Graphics 620, 36 Wh | Média da turma Subnotebook | |
|---|---|---|---|---|---|---|---|
| Duração da bateria | 26% | -49% | -43% | -37% | -63% | 3% | |
| Reader / Idle (h) | 25.6 | 15.4 -40% | 9.7 -62% | 18.7 -27% | 28.6 ? 12% | ||
| H.264 (h) | 11.2 | 15.8 41% | 5.8 -48% | 15.3 ? 37% | |||
| WiFi v1.3 (h) | 12.1 | 13.4 11% | 6.5 -46% | 8.4 -31% | 9.1 -25% | 4.5 -63% | 14 ? 16% |
| Load (h) | 4.2 | 1.7 -60% | 2.9 -31% | 1.7 -60% | 1.998 ? -52% |
Pro
Contra
Veredicto - LG Gram 15 2020 como um cavalo de trabalho ultraportável
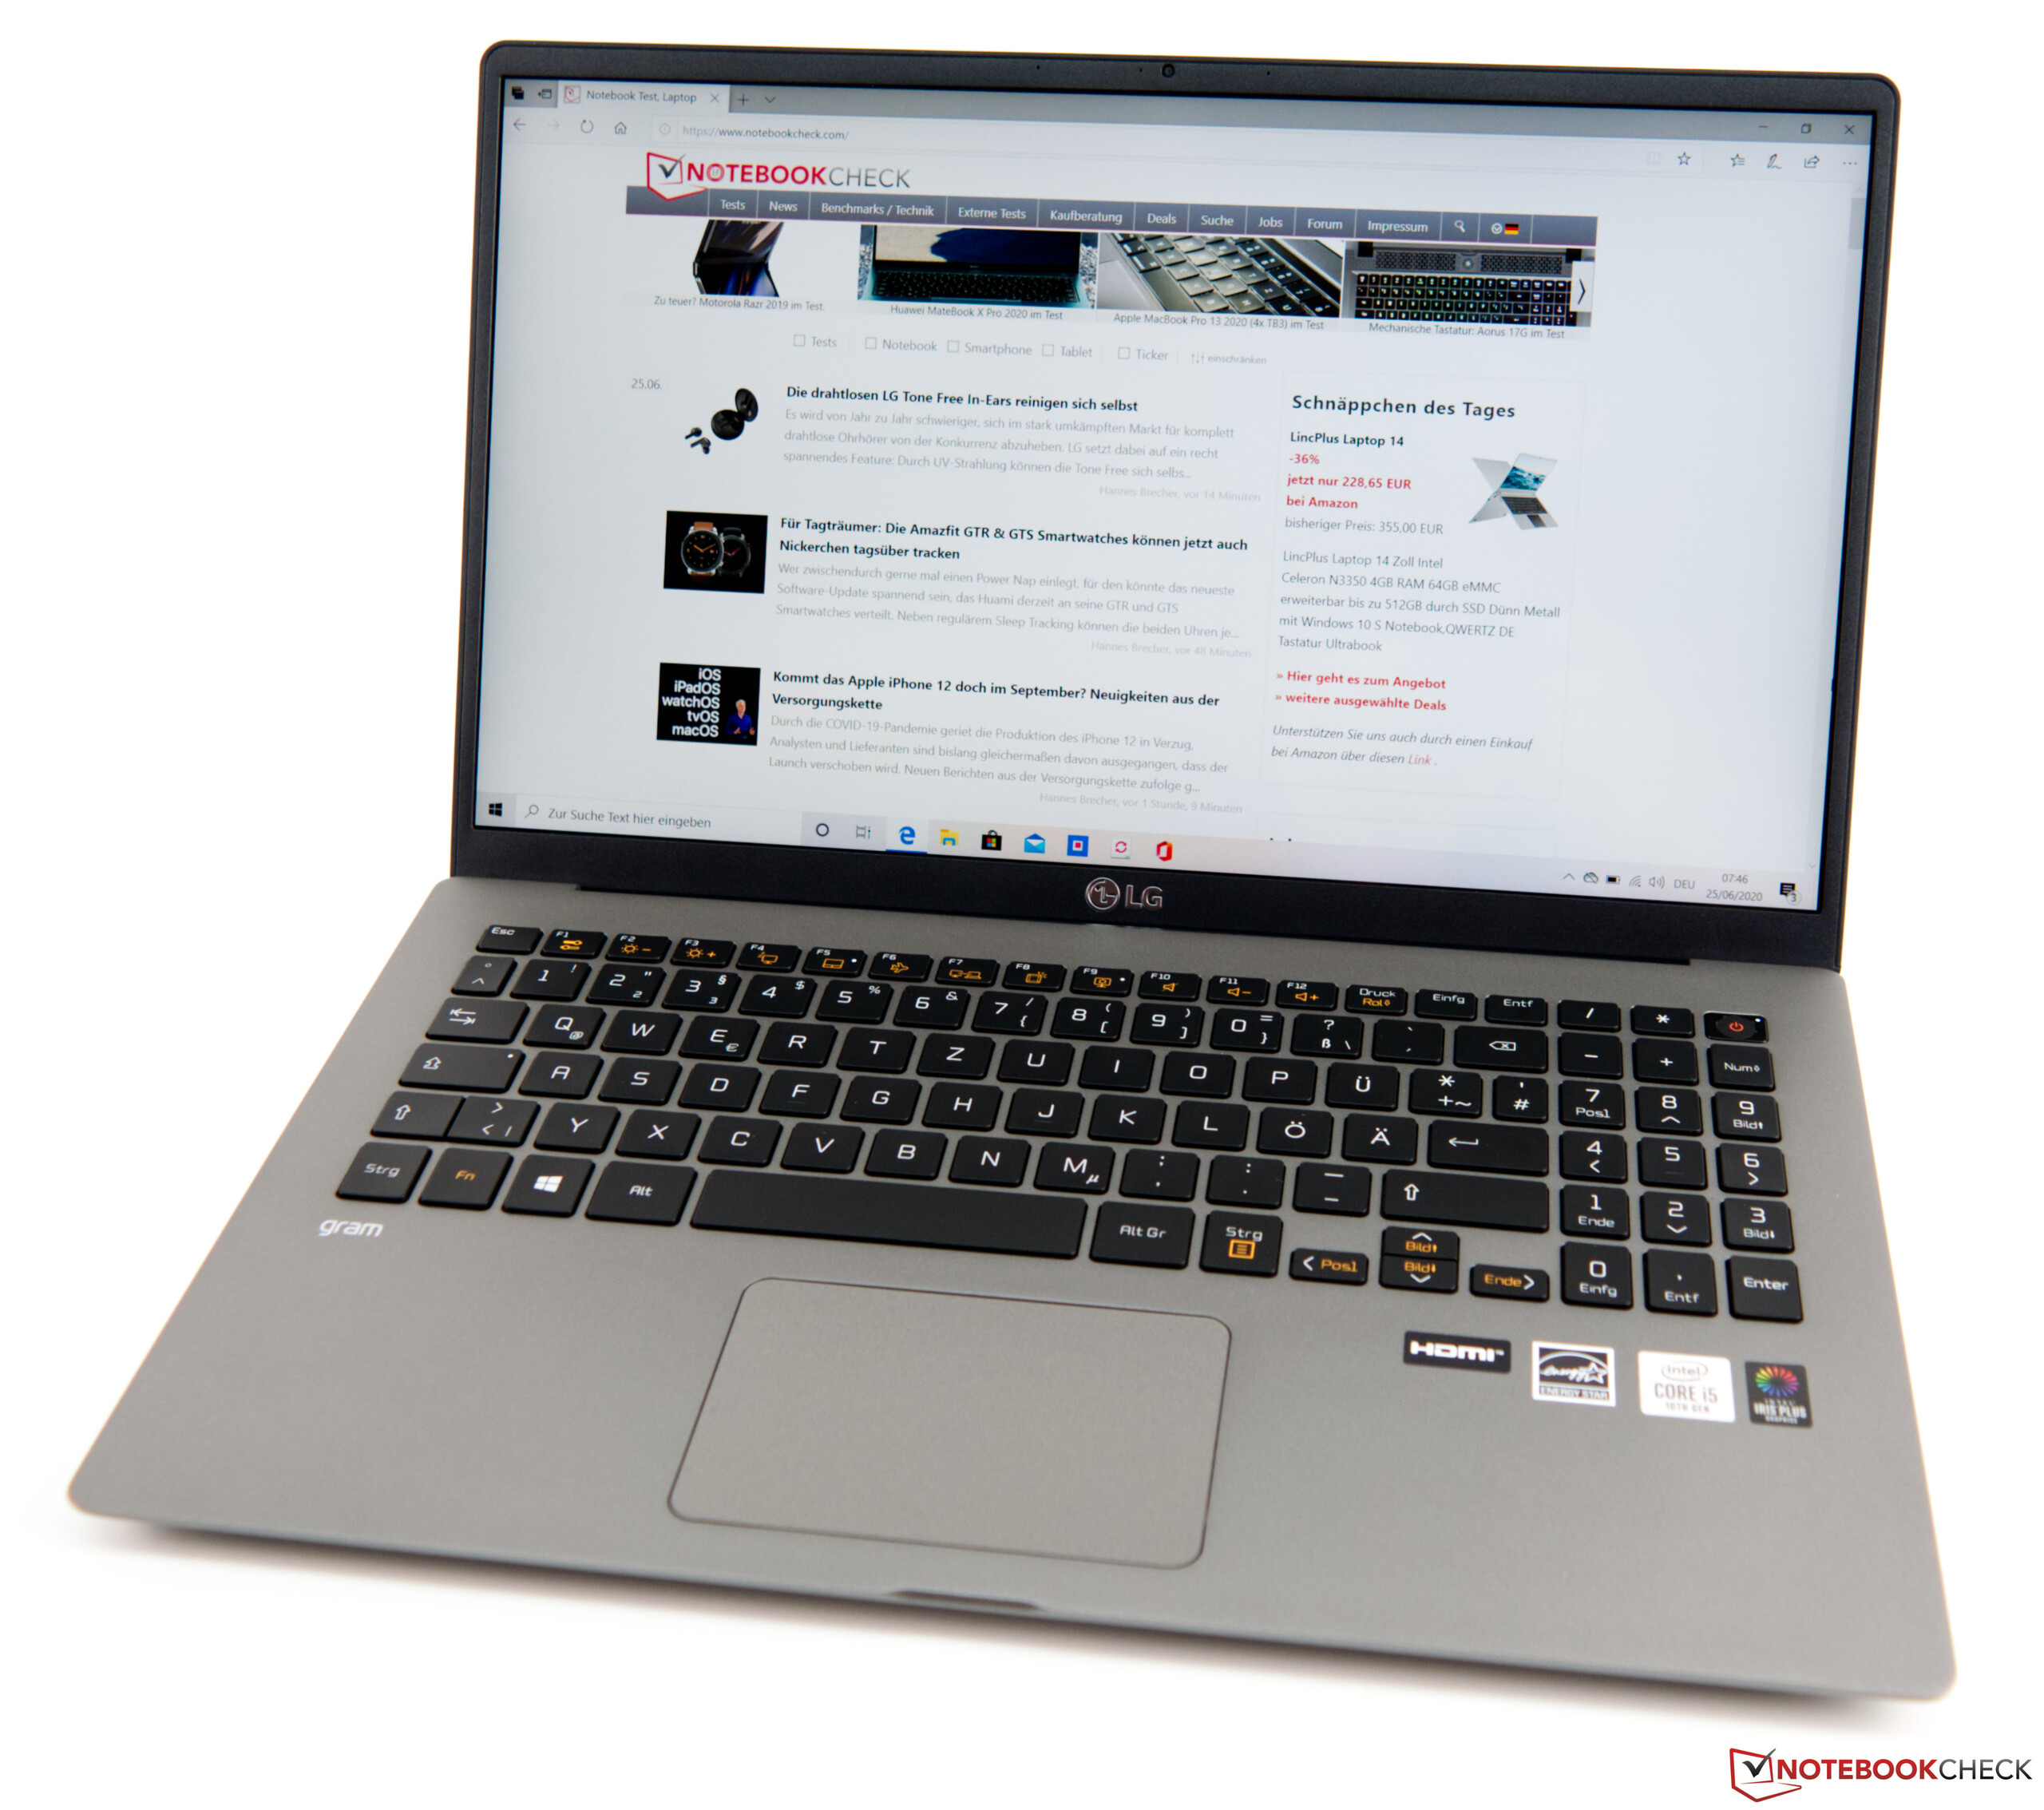
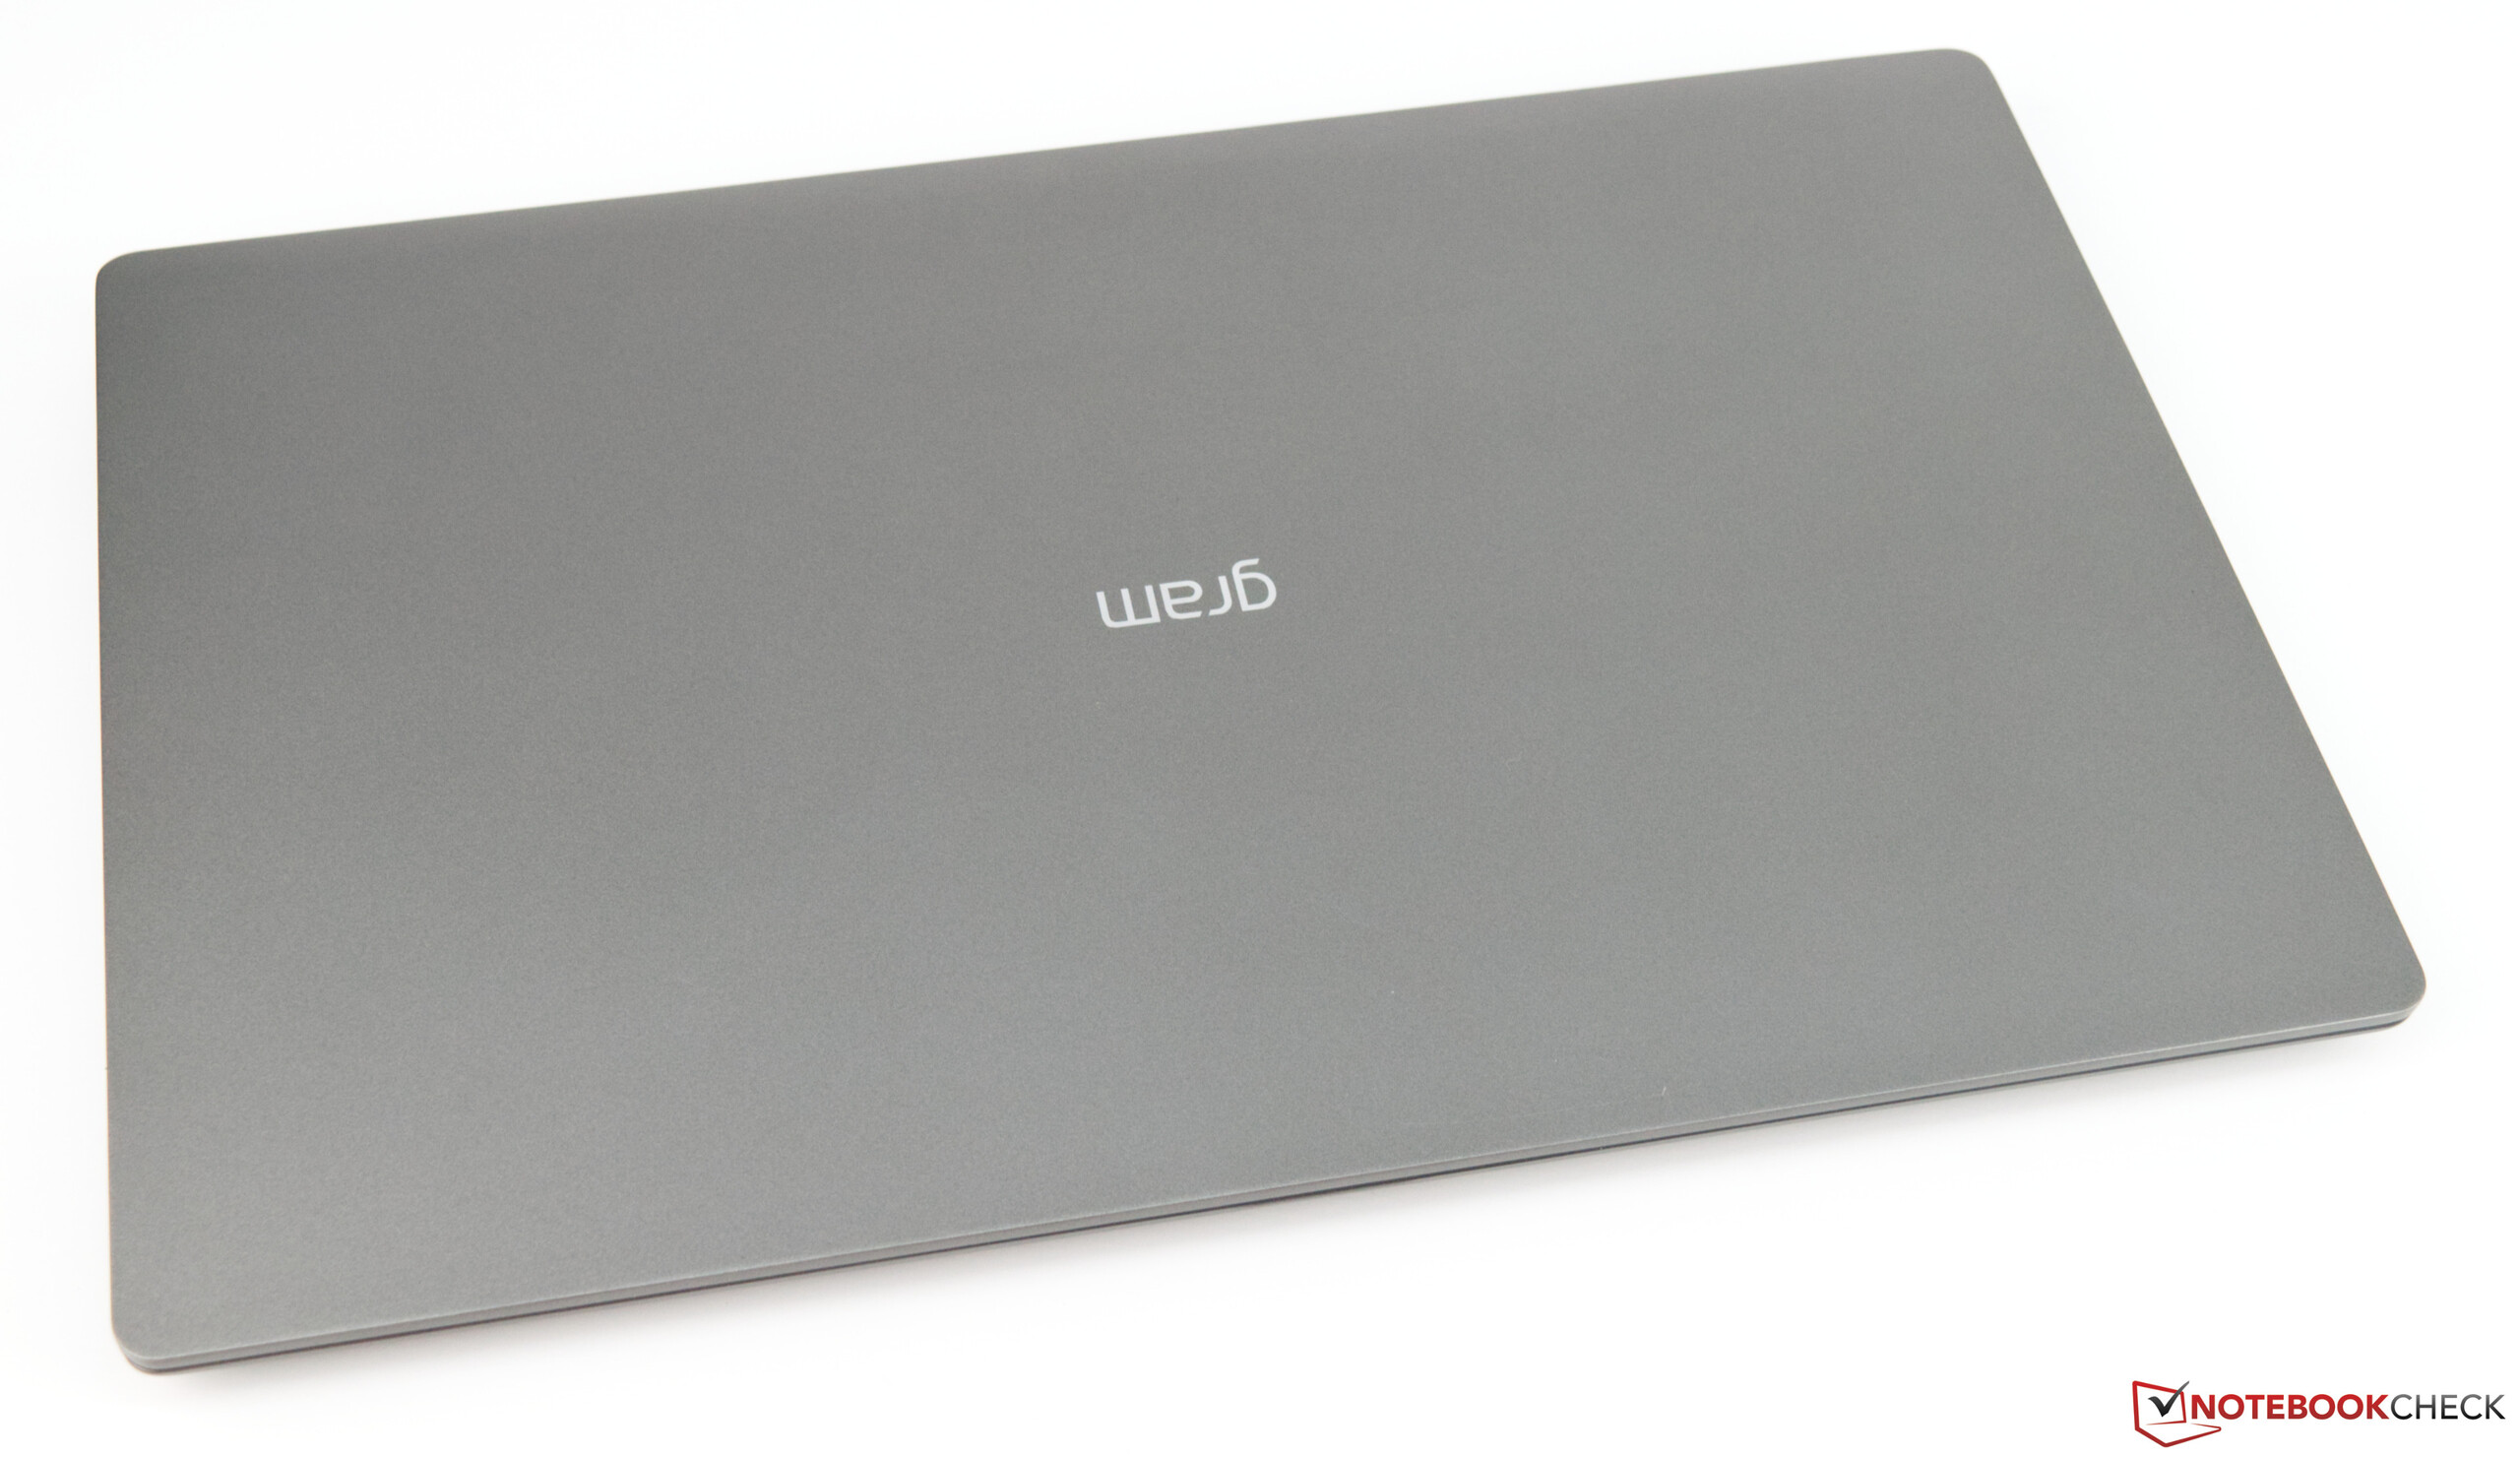
O Gram 15Z90N é outra entrada da série de dispositivos ultraleves da LG. Pesando 1,1 kg (~ 2,4 lb), o dispositivo de 15,6 polegadas é muito leve e não possui concorrentes. O fabricante fez uso de materiais muito premium, que, infelizmente, não se sentem muito premium. Além disso, o chassi e a tampa da tela não são particularmente rígidos, dado que o dispositivo tem um peso tão baixo. A tampa da tela é muito fácil de dobrar. No entanto, o Gram 15 está longe de ser um fracasso, especialmente quando se trata da duração da bateria. A bateria grande permite que o dispositivo funcione um dia inteiro com uma única carga.
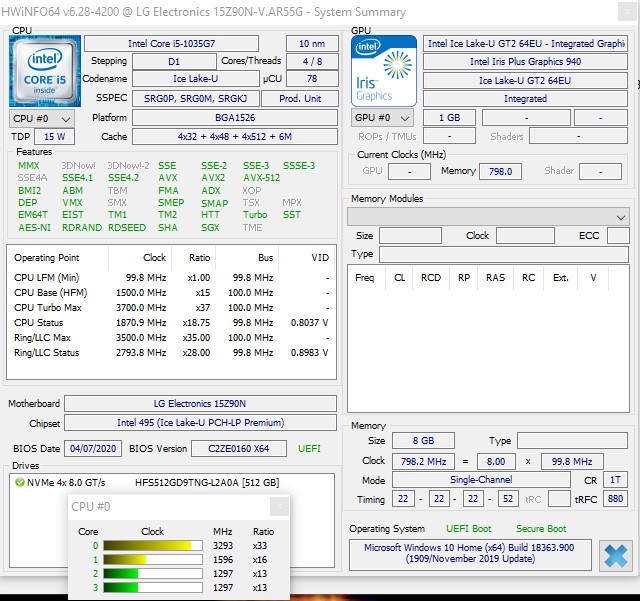
O Intel Core i5-1035G7 no nosso dispositivo de análise, pode acompanhar facilmente o desempenho do Intel Core i7-8550U antecessor em cargas breves. No entanto, o modelo 2020 do Gram 15 perde para seu antecessor direto no loop contínuo do Cinebench R15 de vários núcleos. No entanto, há algum sentid em olhar para o novo modelo com um chip baseado em Ice Lake, porque oferece um aumento significativo no desempenho da GPU.
O baixo peso é o principal ponto de venda do LG Gram 15; além do mais, o Gram 15 oferece excelente duração da bateria.
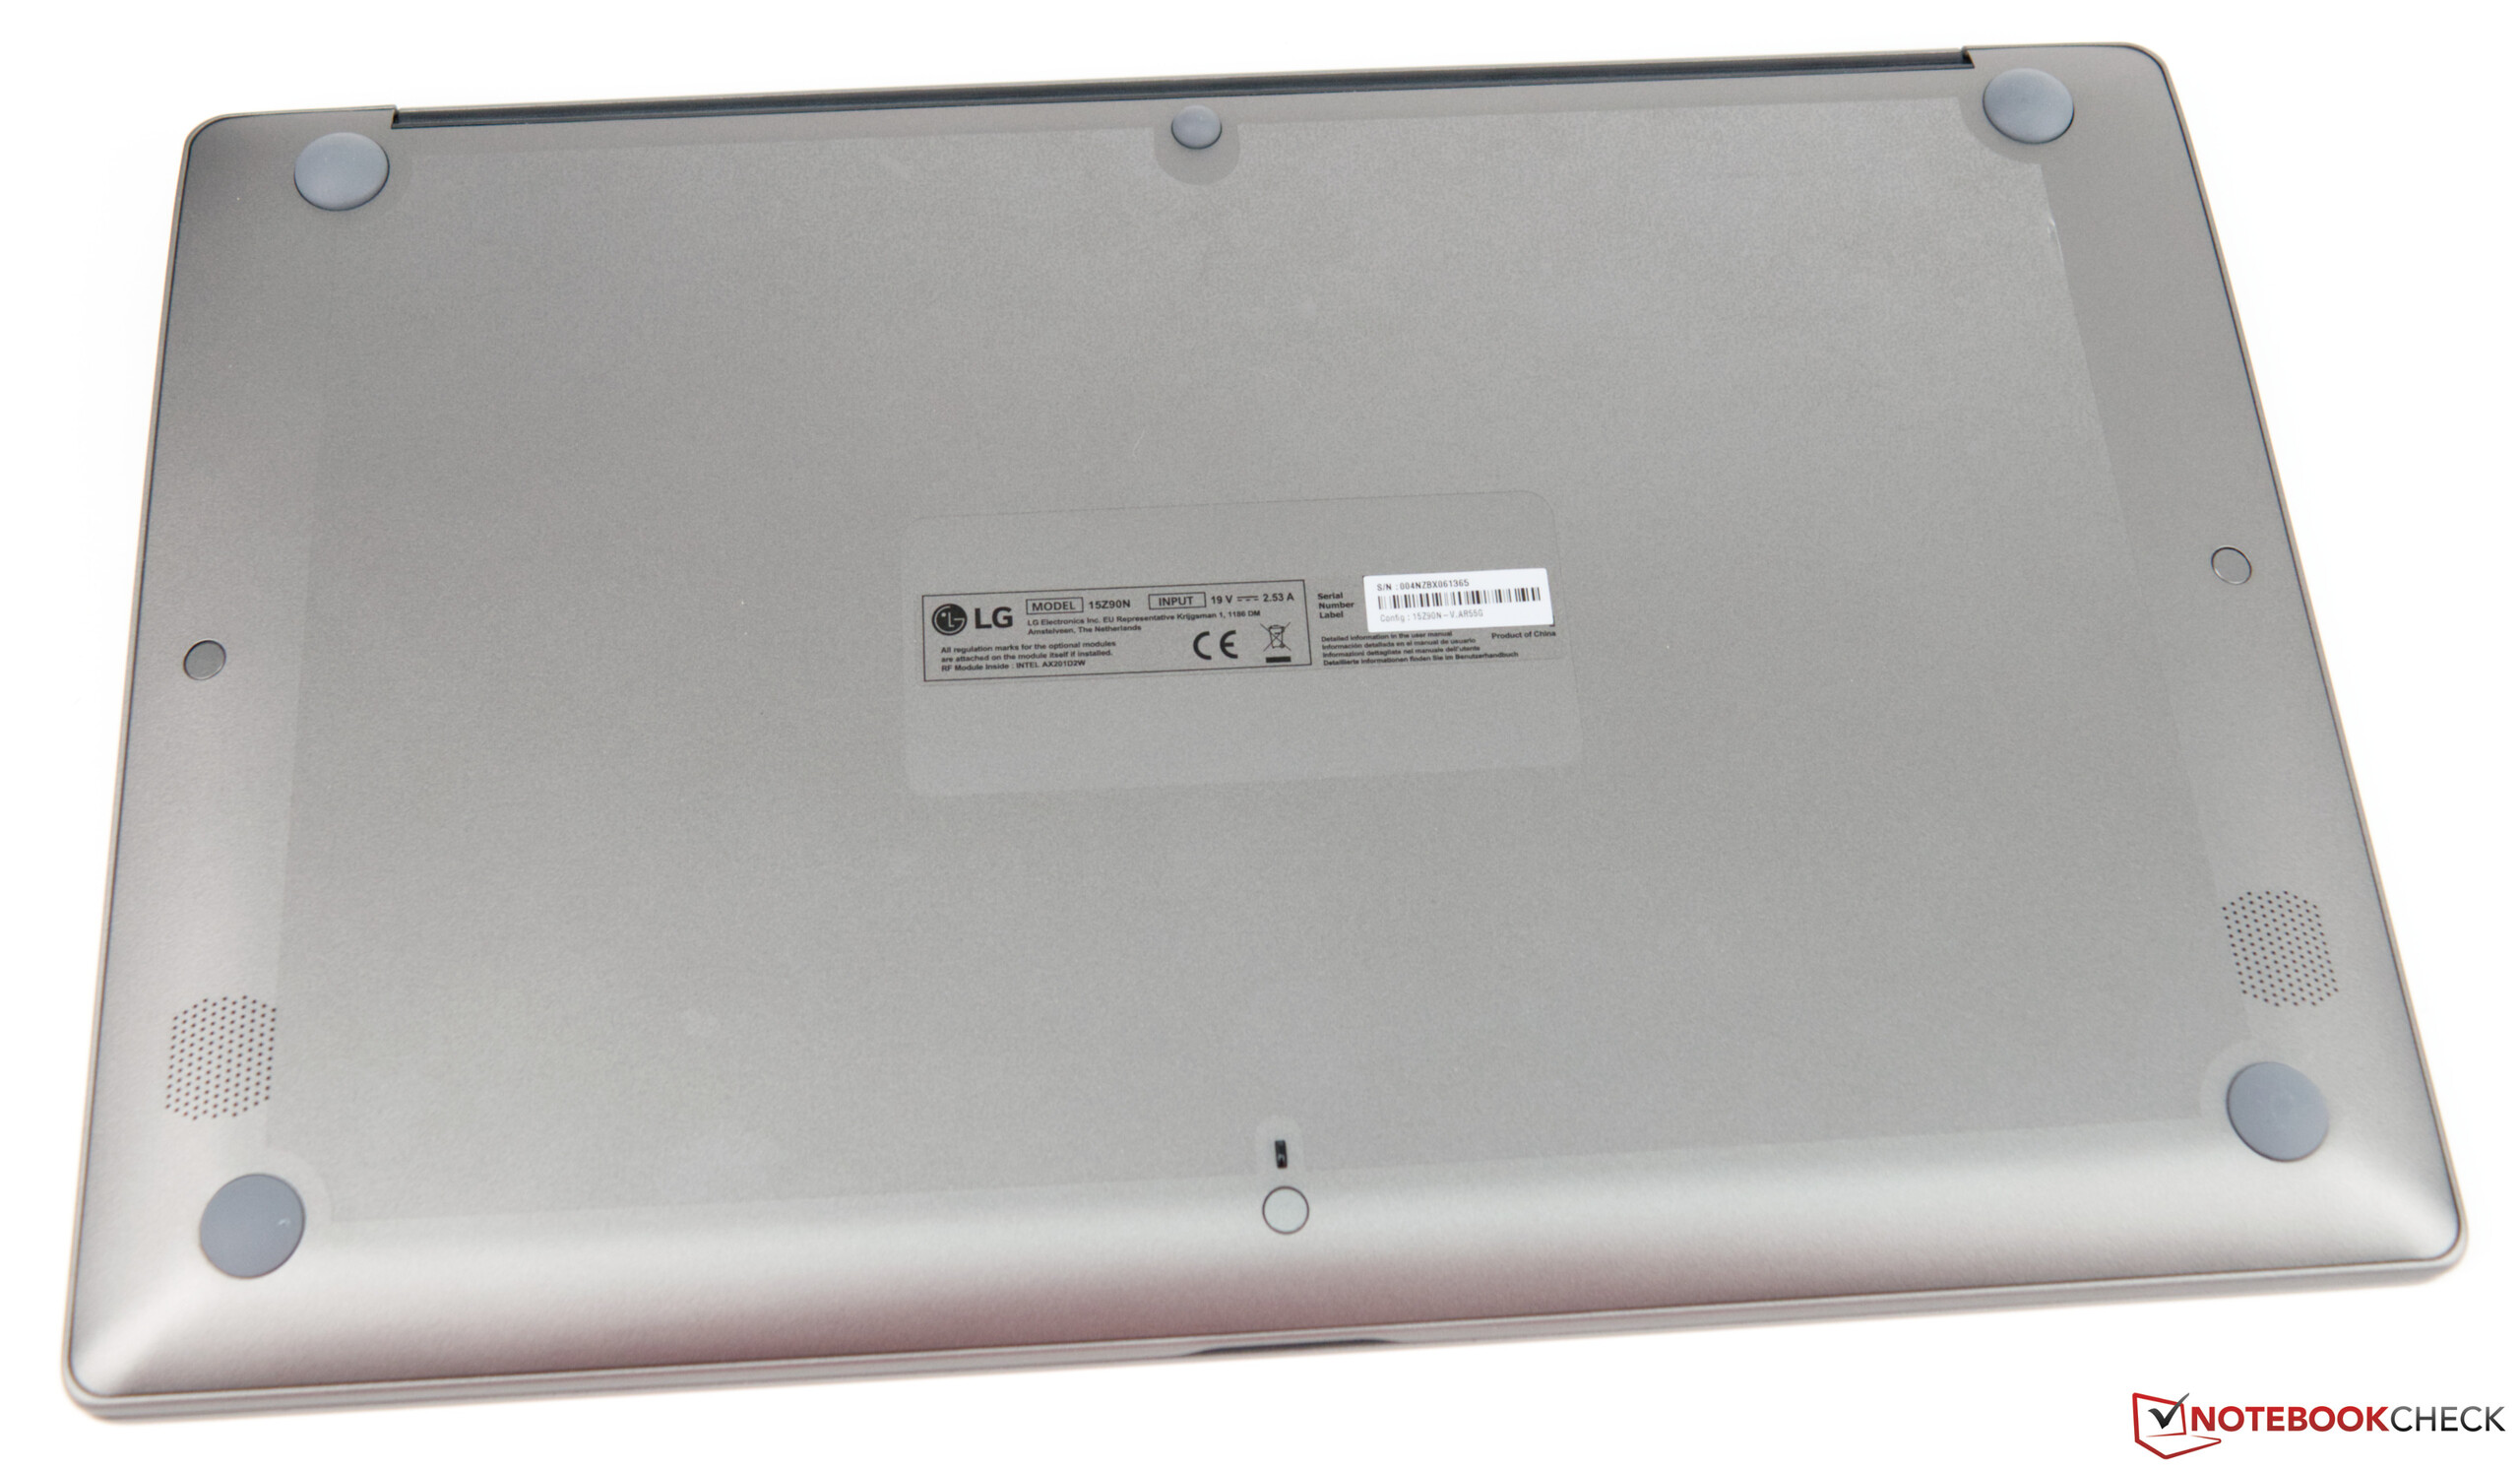
O dispositivo de 1.400 euros (US$ 1.582) com o Intel Core i5-1035G7 oferece desempenho suficiente para tarefas de escritório. More performance is always welcome. No entanto, não temos a impressão de que a CPU esteja diminuindo a velocidade do dispositivo. O mesmo pode ser dito do SSD de 512 GB. Felizmente, os usuários podem adicionar mais espaço de armazenamento e RAM após a compra.
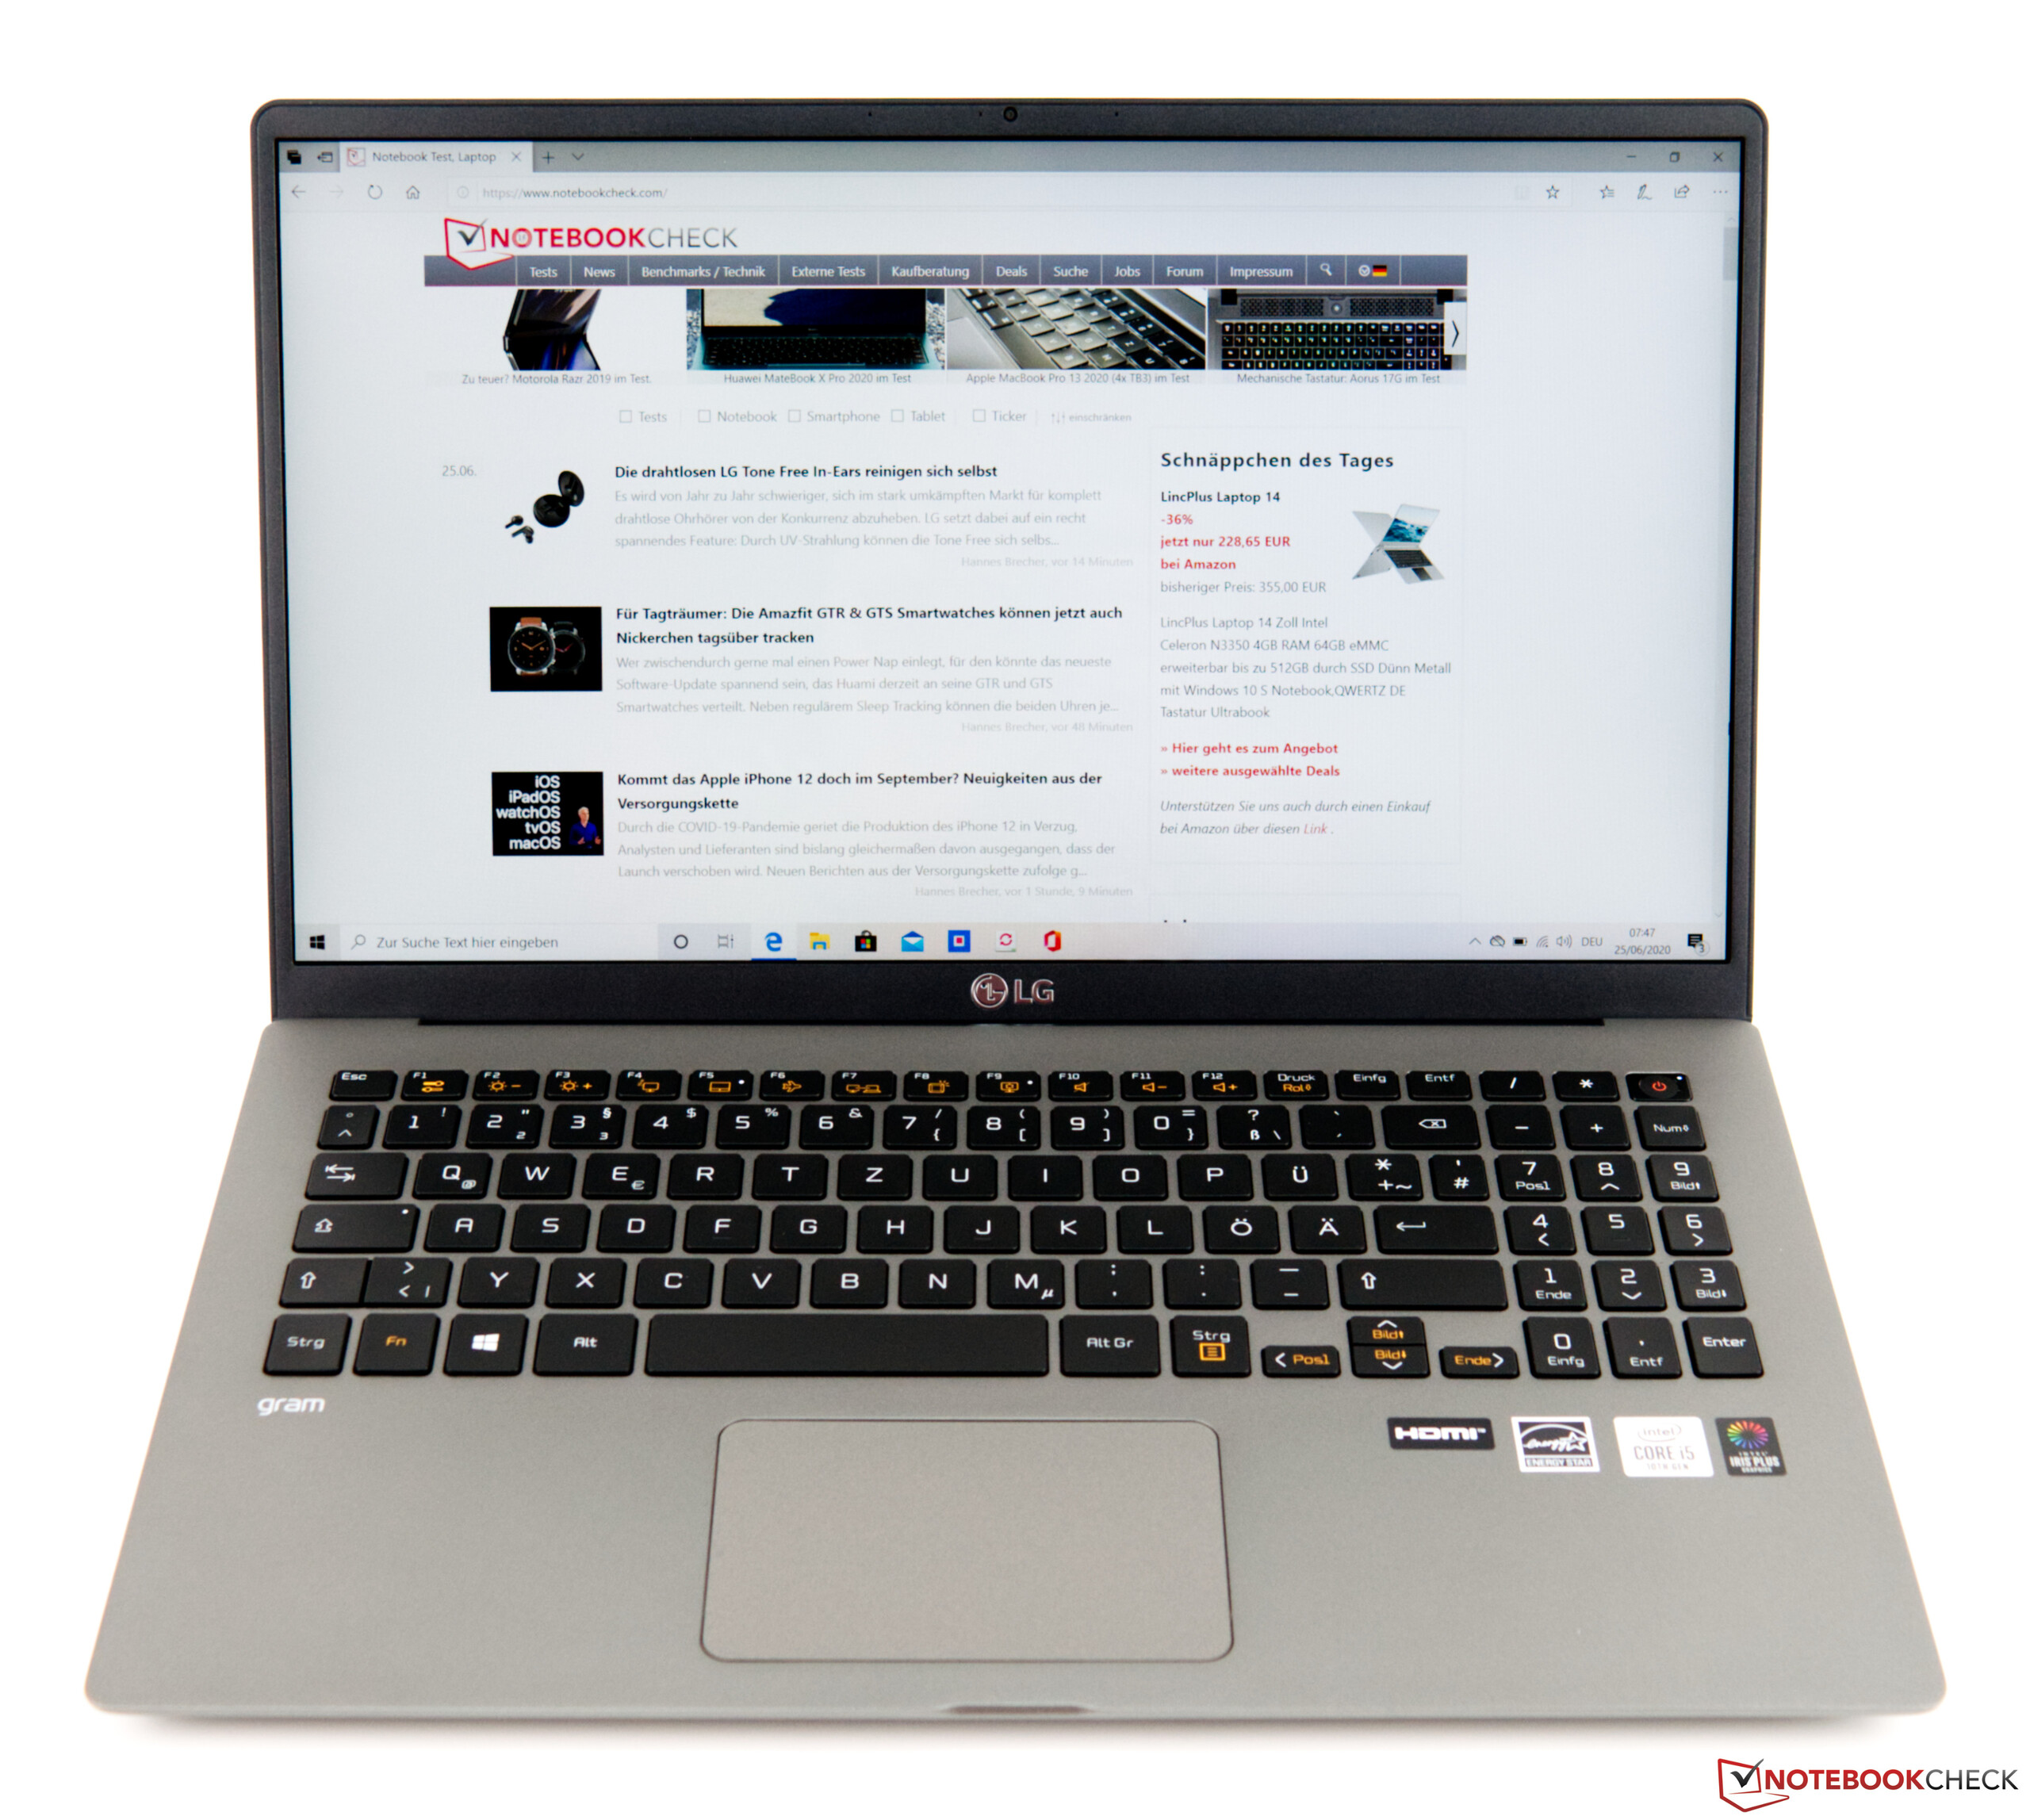
Também gostamos da tela brilhante de 15,6 polegadas, calibrada de fábrica. A boa cobertura do espaço de cores completa o pacote, tornando a tela adequada para edição de imagens e vídeos. Os bons dispositivos de entrada combinam bem com o tema geral do LG Gram 15, porque os usuários de ultraportáteis realmente precisam deles. Além disso, o sistema não produz muito ruído sob uso intenso.
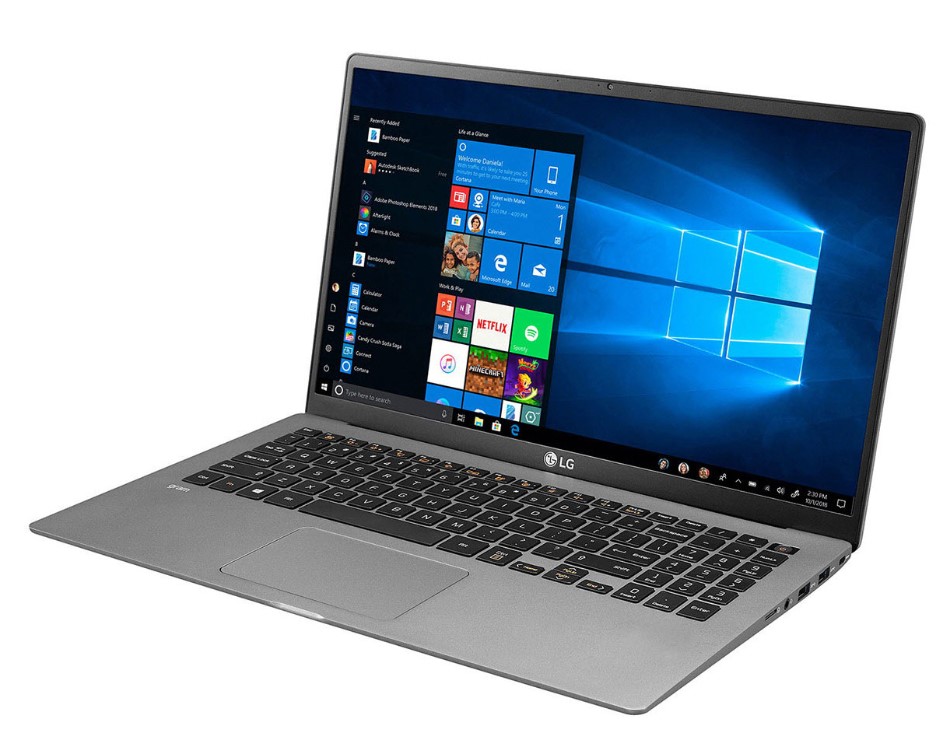
The Gram 15Z90N is another entry in LG’s series of ultralight devices. Weighing in at 1.1 kilograms (~2.4 lb), the 15.6-inch device is very light and has no competitors. The manufacturer made use of very premium materials, which, unfortunately, do not feel very premium. Moreover, both the chassis and the display lid are not particularly rigid since the device has such a low weight. The display lid is very easy to bend. Nevertheless, the Gram 15 is far from being a failure, especially when it comes to battery life. The large battery allows the device to run an entire day on a single charge.
The Intel Core i5-1035G7 in our review device can easily keep up with the predecessor’s Intel Core i7-8550U in short workloads. However, the 2020 model of the Gram 15 loses to its direct predecessor in the multi-core Cinebench R15 continuous loop. Nevertheless, there is some point in looking at the new model with an Ice Lake-based chip, because it offers a significant boost in GPU performance.
The low weight is the main selling point of the LG Gram 15; what is more, the Gram 15 offers great battery life.
The 1400-Euro ($1582) device with the Intel Core i5-1035G7 offers enough performance for office tasks. More performance is always welcome. However, we do not get an impression that the CPU is slowing down the device in any way. The same can be said of the 512 GB SSD. Fortunately, users can add more storage space and RAM after the purchase.
We also liked the bright, factory-calibrated 15.6-inch display. The good colour space coverage rounds off the package, making the display suitable for image and video editing. The good input devices fit well with the overall theme of the LG Gram 15, because users of ultraportable laptops really need them. Moreover, the system does not produce much noise under load.
LG Gram 15Z90N
- 07/09/2020 v7 (old)
Sebastian Bade