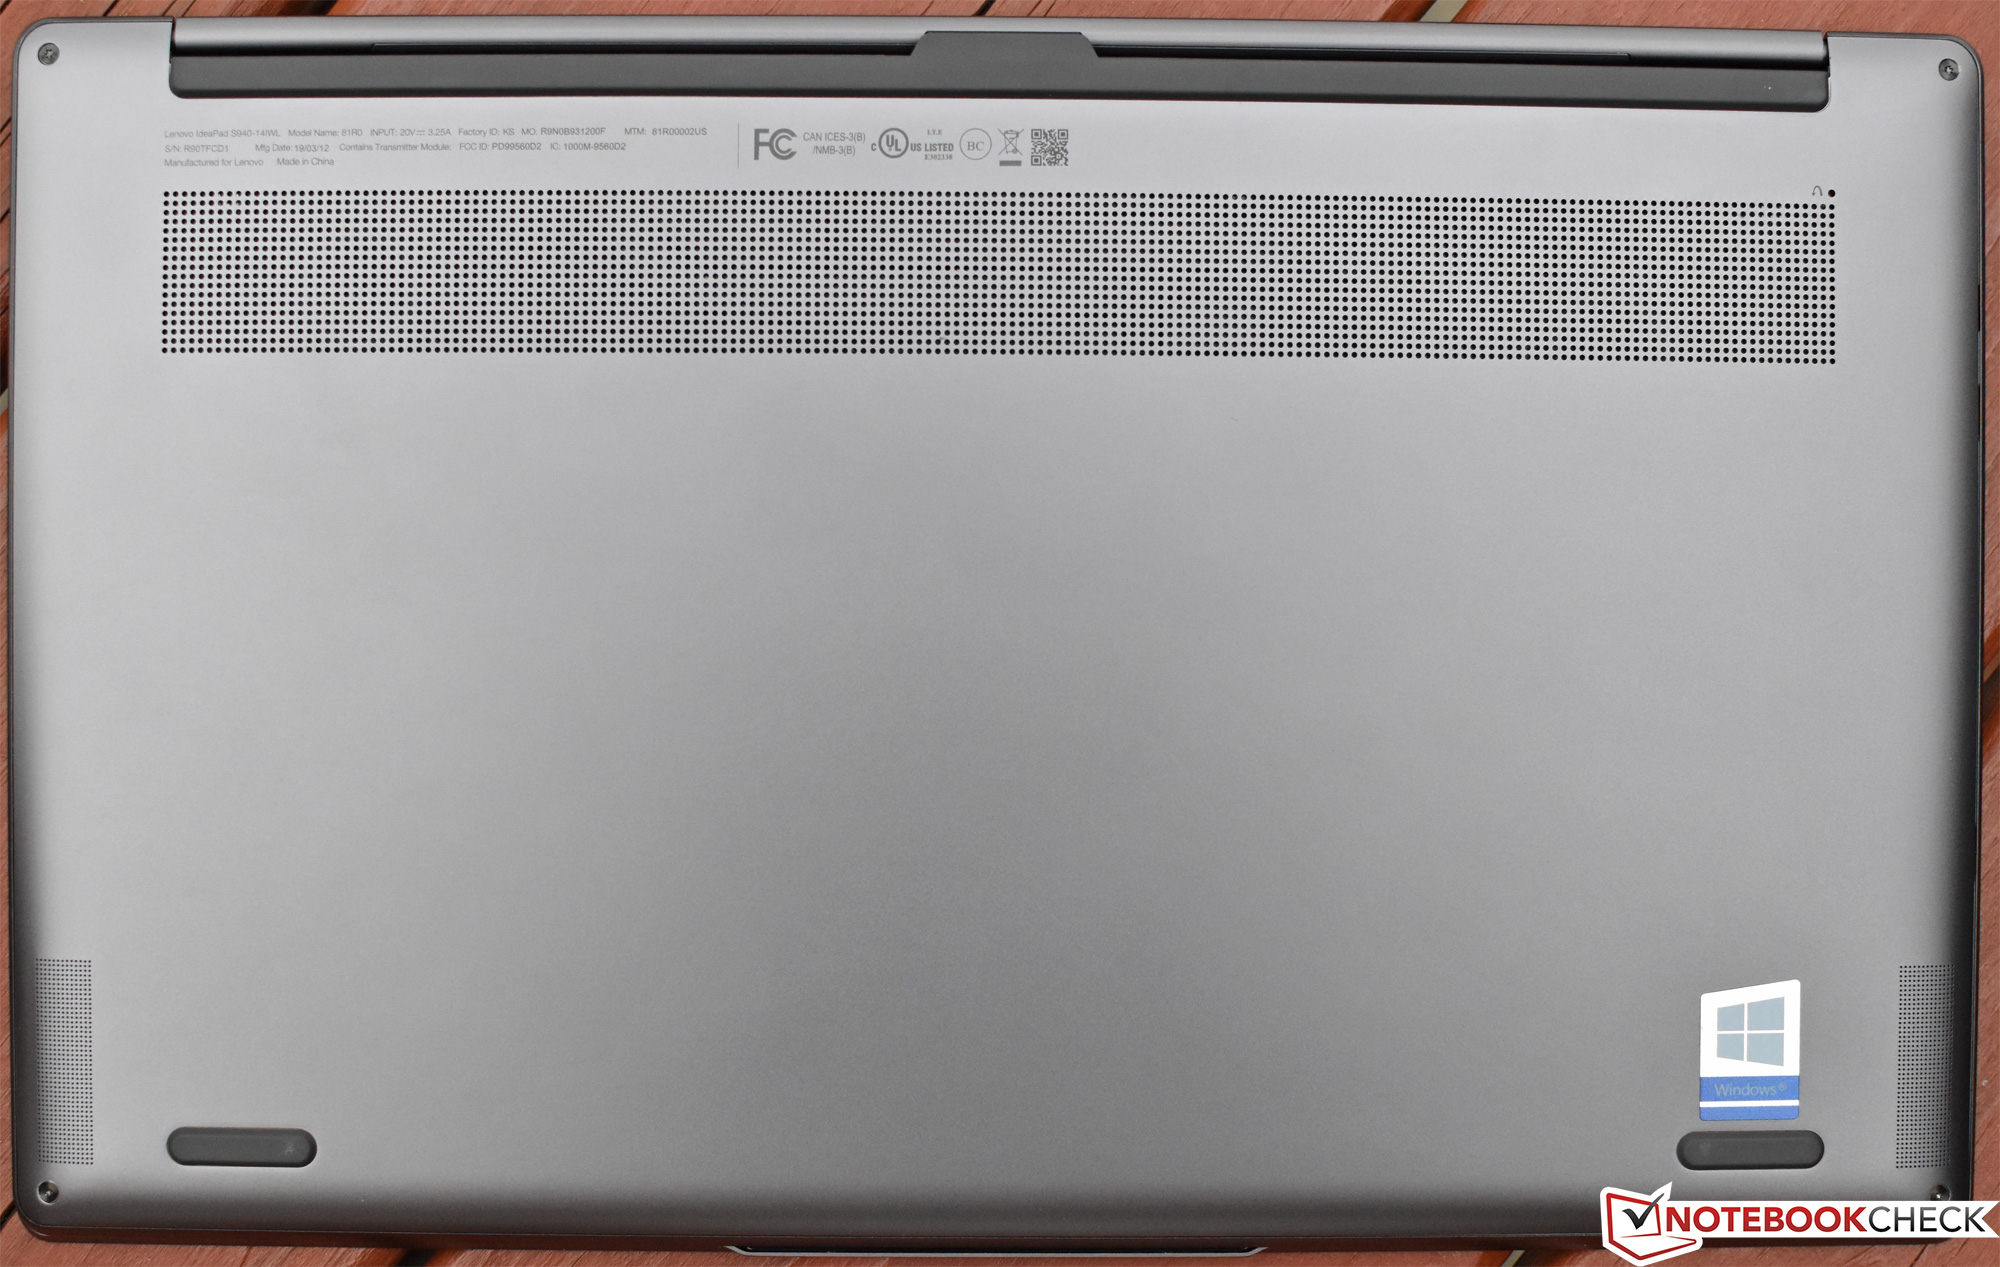
Breve Análise do Portátil Lenovo IdeaPad S940: Mais fino, mais leve, mais elegante
| |||||||||||||||||||||||||
iluminação: 83 %
iluminação com acumulador: 594.5 cd/m²
Contraste: 1383:1 (Preto: 0.43 cd/m²)
ΔE ColorChecker Calman: 4.87 | ∀{0.5-29.43 Ø4.73}
calibrated: 2.83
ΔE Greyscale Calman: 6.7 | ∀{0.09-98 Ø4.97}
100% sRGB (Argyll 1.6.3 3D)
72% AdobeRGB 1998 (Argyll 1.6.3 3D)
81.1% AdobeRGB 1998 (Argyll 3D)
99.7% sRGB (Argyll 3D)
87.5% Display P3 (Argyll 3D)
Gamma: 2.091
CCT: 6891 K
| Lenovo IdeaPad S940-14IWL B140ZAN01.3, IPS, 14", 3840x2160 | Dell XPS 13 9380 i7 4K ID: AUO 282B B133ZAN Dell: 90NTH, IPS, 13.3", 3840x2160 | Apple MacBook Pro 13 2018 Touchbar i5 APPA03E, IPS, 13.3", 2560x1600 | Asus ZenBook 13 UX333FA AU Optronics B133HAN05.C, IPS, 13.3", 1920x1080 | Lenovo ThinkPad X1 Carbon 2018-20KGS5DU00 LP140QH2-SPB1, IPS, 14", 2560x1440 | Lenovo Yoga C930-13IKB 81C4 AUO B139HAN03_0, IPS, 13.9", 1920x1080 | |
|---|---|---|---|---|---|---|
| Display | -17% | 7% | -13% | -9% | -18% | |
| Display P3 Coverage (%) | 87.5 | 64.8 -26% | 98.5 13% | 67.9 -22% | 72.7 -17% | 62.7 -28% |
| sRGB Coverage (%) | 99.7 | 93.6 -6% | 99.9 0% | 97.4 -2% | 97.9 -2% | 92.6 -7% |
| AdobeRGB 1998 Coverage (%) | 81.1 | 65.8 -19% | 87.3 8% | 69.2 -15% | 74.6 -8% | 64.7 -20% |
| Response Times | -16% | 10% | -7% | 27% | 30% | |
| Response Time Grey 50% / Grey 80% * (ms) | 57.2 ? | 64.8 ? -13% | 46 ? 20% | 54.4 ? 5% | 38 ? 34% | 34.4 ? 40% |
| Response Time Black / White * (ms) | 32 ? | 38 ? -19% | 32 ? -0% | 37.6 ? -18% | 26 ? 19% | 25.6 ? 20% |
| PWM Frequency (Hz) | 118000 ? | |||||
| Screen | 11% | 24% | -1% | -10% | -28% | |
| Brightness middle (cd/m²) | 594.5 | 428.3 -28% | 519 -13% | 276 -54% | 316 -47% | 312 -48% |
| Brightness (cd/m²) | 536 | 414 -23% | 504 -6% | 263 -51% | 311 -42% | 295 -45% |
| Brightness Distribution (%) | 83 | 88 6% | 95 14% | 89 7% | 84 1% | 87 5% |
| Black Level * (cd/m²) | 0.43 | 0.27 37% | 0.33 23% | 0.21 51% | 0.35 19% | 0.43 -0% |
| Contrast (:1) | 1383 | 1586 15% | 1573 14% | 1314 -5% | 903 -35% | 726 -48% |
| Colorchecker dE 2000 * | 4.87 | 2.69 45% | 1.4 71% | 4.85 -0% | 4.5 8% | 7.6 -56% |
| Colorchecker dE 2000 max. * | 7.9 | 6.19 22% | 2.8 65% | 8.24 -4% | 10.3 -30% | 15.06 -91% |
| Colorchecker dE 2000 calibrated * | 2.83 | 2.01 29% | 1.6 43% | 1.6 43% | 1.96 31% | |
| Greyscale dE 2000 * | 6.7 | 3.7 45% | 2.2 67% | 5.7 15% | 7.7 -15% | 8.8 -31% |
| Gamma | 2.091 105% | 2.1 105% | 2.22 99% | 2.08 106% | 2.2 100% | 2.01 109% |
| CCT | 6891 94% | 6706 97% | 6908 94% | 7424 88% | 6639 98% | 6874 95% |
| Color Space (Percent of AdobeRGB 1998) (%) | 72 | 60.4 -16% | 77.3 7% | 63 -12% | 68.6 -5% | 59.1 -18% |
| Color Space (Percent of sRGB) (%) | 100 | 93.5 -6% | 99.99 0% | 98 -2% | 97.9 -2% | 92.3 -8% |
| Média Total (Programa/Configurações) | -7% /
3% | 14% /
19% | -7% /
-4% | 3% /
-5% | -5% /
-19% |
* ... menor é melhor
Exibir tempos de resposta
| ↔ Tempo de resposta preto para branco | ||
|---|---|---|
| 32 ms ... ascensão ↗ e queda ↘ combinadas | ↗ 17.2 ms ascensão | 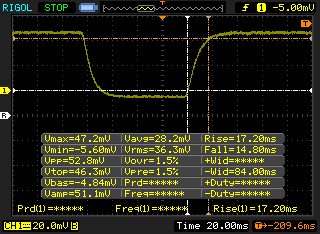 |
| ↘ 14.8 ms queda | ||
| A tela mostra taxas de resposta lentas em nossos testes e será insatisfatória para os jogadores. Em comparação, todos os dispositivos testados variam de 0.1 (mínimo) a 240 (máximo) ms. » 86 % de todos os dispositivos são melhores. Isso significa que o tempo de resposta medido é pior que a média de todos os dispositivos testados (19.9 ms). | ||
| ↔ Tempo de resposta 50% cinza a 80% cinza | ||
| 57.2 ms ... ascensão ↗ e queda ↘ combinadas | ↗ 30 ms ascensão | 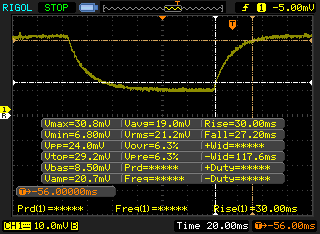 |
| ↘ 27.2 ms queda | ||
| A tela mostra taxas de resposta lentas em nossos testes e será insatisfatória para os jogadores. Em comparação, todos os dispositivos testados variam de 0.165 (mínimo) a 636 (máximo) ms. » 94 % de todos os dispositivos são melhores. Isso significa que o tempo de resposta medido é pior que a média de todos os dispositivos testados (31.1 ms). | ||
Cintilação da tela / PWM (modulação por largura de pulso)
| Tela tremeluzindo / PWM não detectado | 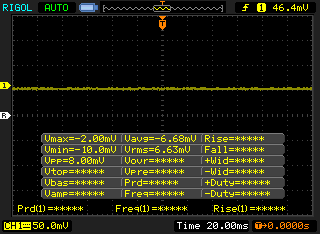 | ||
[pwm_comparison] Em comparação: 52 % de todos os dispositivos testados não usam PWM para escurecer a tela. Se PWM foi detectado, uma média de 7791 (mínimo: 5 - máximo: 343500) Hz foi medida. | |||
| Cinebench R10 | |
| Rendering Multiple CPUs 32Bit | |
| Média da turma Subnotebook (14395 - 51868, n=13, últimos 2 anos) | |
| Média Intel Core i7-8565U (13806 - 23118, n=16) | |
| Lenovo Yoga 530-14ARR-81H9000VGE | |
| Rendering Single 32Bit | |
| Média da turma Subnotebook (2299 - 10697, n=13, últimos 2 anos) | |
| Média Intel Core i7-8565U (2682 - 8906, n=16) | |
| Lenovo Yoga 530-14ARR-81H9000VGE | |
| PCMark 8 | |
| Home Score Accelerated v2 | |
| Lenovo ThinkPad X1 Carbon 2018-20KGS5DU00 | |
| Apple MacBook Pro 13 2018 Touchbar i5 | |
| Lenovo Yoga C930-13IKB 81C4 | |
| Média Intel Core i7-8565U, Intel UHD Graphics 620 (2577 - 4179, n=20) | |
| Lenovo Yoga 530-14ARR-81H9000VGE | |
| Dell XPS 13 9380 i7 4K | |
| Asus ZenBook 13 UX333FA | |
| Lenovo IdeaPad S940-14IWL | |
| Média da turma Subnotebook (1739 - 1828, n=2, últimos 2 anos) | |
| Work Score Accelerated v2 | |
| Lenovo Yoga C930-13IKB 81C4 | |
| Média Intel Core i7-8565U, Intel UHD Graphics 620 (3596 - 5189, n=19) | |
| Lenovo ThinkPad X1 Carbon 2018-20KGS5DU00 | |
| Apple MacBook Pro 13 2018 Touchbar i5 | |
| Asus ZenBook 13 UX333FA | |
| Lenovo Yoga 530-14ARR-81H9000VGE | |
| Dell XPS 13 9380 i7 4K | |
| Lenovo IdeaPad S940-14IWL | |
| Média da turma Subnotebook (1609 - 1656, n=2, últimos 2 anos) | |
| PCMark 8 Home Score Accelerated v2 | 3147 pontos | |
| PCMark 8 Work Score Accelerated v2 | 4209 pontos | |
| PCMark 10 Score | 3870 pontos | |
Ajuda | ||
| Lenovo IdeaPad S940-14IWL Samsung SSD PM981 MZVLB512HAJQ | Dell XPS 13 9380 i7 4K Samsung SSD PM981 MZVLB512HAJQ | Apple MacBook Pro 13 2018 Touchbar i5 | Asus ZenBook 13 UX333FA WDC PC SN520 SDAPNUW-256G | Lenovo Yoga C930-13IKB 81C4 SK hynix PC401 HFS256GD9TNG | |
|---|---|---|---|---|---|
| AS SSD | 14% | -51% | -40% | -263% | |
| Seq Read (MB/s) | 2625 | 1981 -25% | 1442 -45% | 1186 -55% | 1228 -53% |
| Seq Write (MB/s) | 1360 | 1473 8% | 1694 25% | 809 -41% | 544 -60% |
| 4K Read (MB/s) | 47.71 | 53.3 12% | 9.7 -80% | 39.69 -17% | 39.16 -18% |
| 4K Write (MB/s) | 115.5 | 127.4 10% | 20 -83% | 114 -1% | 106.5 -8% |
| 4K-64 Read (MB/s) | 1492 | 1179 -21% | 957 -36% | 618 -59% | 466.4 -69% |
| 4K-64 Write (MB/s) | 1154 | 2105 82% | 162 -86% | 510 -56% | 305.1 -74% |
| Access Time Read * (ms) | 0.045 | 0.036 20% | 0.068 -51% | 0.46 -922% | |
| Access Time Write * (ms) | 0.032 | 0.029 9% | 0.032 -0% | 0.51 -1494% | |
| Score Read (Points) | 1802 | 1430 -21% | 776 -57% | 628 -65% | |
| Score Write (Points) | 1406 | 2379 69% | 705 -50% | 466 -67% | |
| Score Total (Points) | 4069 | 4526 11% | 1870 -54% | 1394 -66% | |
| Copy ISO MB/s (MB/s) | 1294 | 1090 | 628 | ||
| Copy Program MB/s (MB/s) | 503 | 714 | 540 | ||
| Copy Game MB/s (MB/s) | 1148 | 413 | 533 | ||
| CrystalDiskMark 5.2 / 6 | 29% | -38% | -25% | -22% | |
| Write 4K (MB/s) | 105.3 | 139.5 32% | 43.24 -59% | 113.7 8% | 108.7 3% |
| Read 4K (MB/s) | 40.9 | 61.3 50% | 14.07 -66% | 43.18 6% | 40.91 0% |
| Write Seq (MB/s) | 1914 | 1863 -3% | 887 -54% | 970 -49% | 798 -58% |
| Read Seq (MB/s) | 2224 | 2494 12% | 1515 -32% | 1085 -51% | 1610 -28% |
| Write 4K Q32T1 (MB/s) | 419.3 | 772 84% | 225.3 -46% | 396.8 -5% | 385.1 -8% |
| Read 4K Q32T1 (MB/s) | 288.1 | 454.8 58% | 346.5 20% | 317.8 10% | 305.8 6% |
| Write Seq Q32T1 (MB/s) | 1954 | 1869 -4% | 859 -56% | 518 -73% | 779 -60% |
| Read Seq Q32T1 (MB/s) | 3382 | 3480 3% | 2915 -14% | 1741 -49% | 2359 -30% |
| Média Total (Programa/Configurações) | 22% /
20% | -45% /
-44% | -33% /
-34% | -143% /
-162% |
* ... menor é melhor

| 3DMark 11 Performance | 1987 pontos | |
| 3DMark Cloud Gate Standard Score | 8135 pontos | |
| 3DMark Fire Strike Score | 1130 pontos | |
Ajuda | ||
| BioShock Infinite | |
| 1280x720 Very Low Preset | |
| Lenovo Yoga 530-14ARR-81H9000VGE | |
| Dell XPS 13 9380 i7 4K | |
| Lenovo IdeaPad S940-14IWL | |
| Asus ZenBook 13 UX333FA | |
| Média Intel UHD Graphics 620 (18.3 - 90.2, n=187) | |
| Lenovo Yoga C930-13IKB 81C4 | |
| Lenovo ThinkPad X1 Carbon 2018-20KGS5DU00 | |
| 1366x768 Medium Preset | |
| Lenovo Yoga 530-14ARR-81H9000VGE | |
| Dell XPS 13 9380 i7 4K | |
| Lenovo ThinkPad X1 Carbon 2018-20KGS5DU00 | |
| Asus ZenBook 13 UX333FA | |
| Lenovo IdeaPad S940-14IWL | |
| Lenovo Yoga C930-13IKB 81C4 | |
| Média Intel UHD Graphics 620 (11.5 - 45.5, n=187) | |
| 1366x768 High Preset | |
| Lenovo Yoga 530-14ARR-81H9000VGE | |
| Dell XPS 13 9380 i7 4K | |
| Asus ZenBook 13 UX333FA | |
| Lenovo Yoga C930-13IKB 81C4 | |
| Lenovo ThinkPad X1 Carbon 2018-20KGS5DU00 | |
| Média Intel UHD Graphics 620 (8.1 - 35.9, n=187) | |
| Lenovo IdeaPad S940-14IWL | |
| 1920x1080 Ultra Preset, DX11 (DDOF) | |
| Lenovo Yoga 530-14ARR-81H9000VGE | |
| Lenovo ThinkPad X1 Carbon 2018-20KGS5DU00 | |
| Dell XPS 13 9380 i7 4K | |
| Lenovo Yoga C930-13IKB 81C4 | |
| Asus ZenBook 13 UX333FA | |
| Média Intel UHD Graphics 620 (4.5 - 17, n=176) | |
| Lenovo IdeaPad S940-14IWL | |
| baixo | média | alto | ultra | |
|---|---|---|---|---|
| BioShock Infinite (2013) | 70 | 35 | 27 | 8 |
| Metro: Last Light (2013) | 41 | |||
| Rise of the Tomb Raider (2016) | 16 | 11 | 6 |
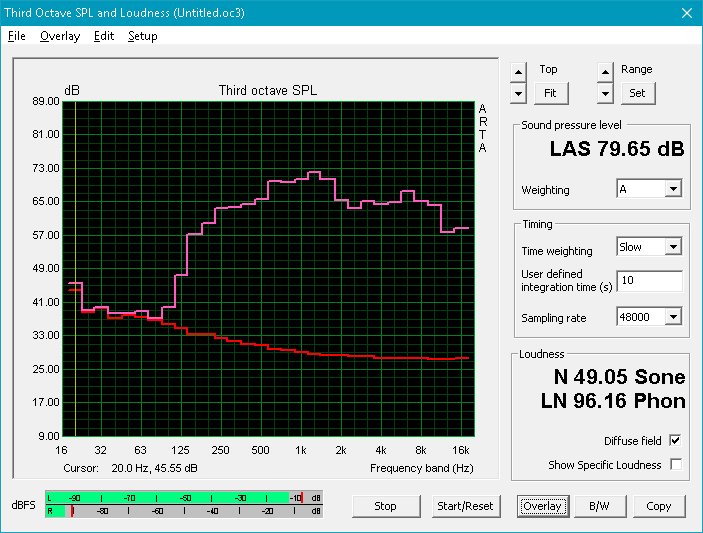
Barulho
| Ocioso |
| 28.3 / 28.3 / 31.3 dB |
| Carga |
| 34.3 / 34.3 dB |
 | ||
30 dB silencioso 40 dB(A) audível 50 dB(A) ruidosamente alto |
||
min: | ||
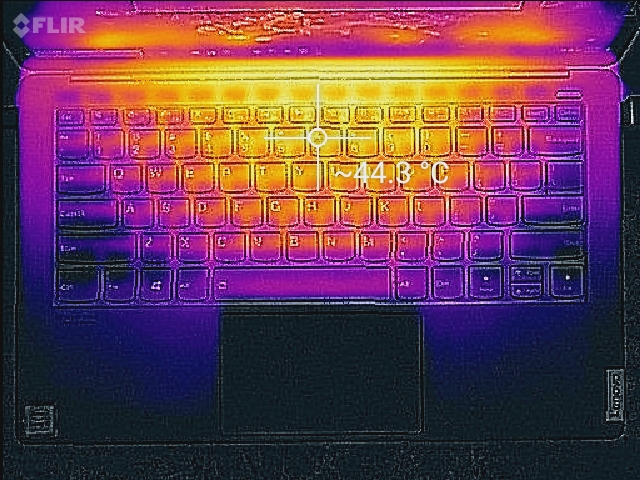
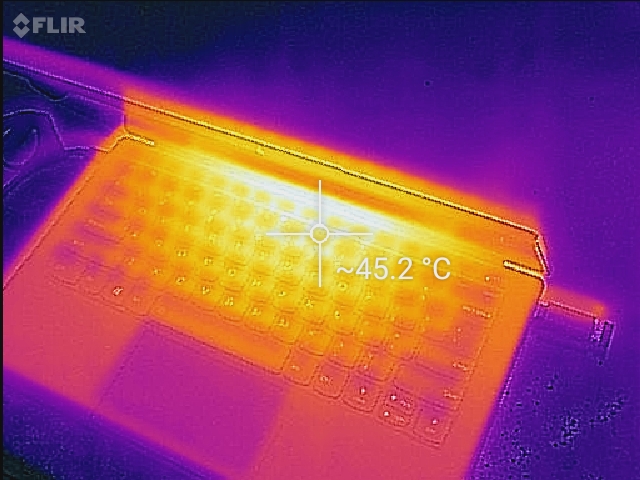
(±) A temperatura máxima no lado superior é 43.8 °C / 111 F, em comparação com a média de 35.9 °C / 97 F , variando de 21.4 a 59 °C para a classe Subnotebook.
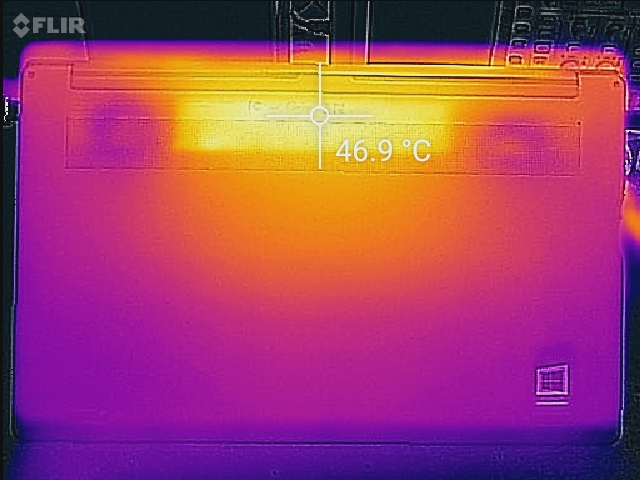
(-) A parte inferior aquece até um máximo de 47 °C / 117 F, em comparação com a média de 39.2 °C / 103 F
(+) Em uso inativo, a temperatura média para o lado superior é 30.9 °C / 88 F, em comparação com a média do dispositivo de 30.8 °C / ### class_avg_f### F.
(+) Os apoios para as mãos e o touchpad estão atingindo a temperatura máxima da pele (34 °C / 93.2 F) e, portanto, não estão quentes.
(-) A temperatura média da área do apoio para as mãos de dispositivos semelhantes foi 28.2 °C / 82.8 F (-5.8 °C / -10.4 F).
Lenovo IdeaPad S940-14IWL análise de áudio
(±) | o volume do alto-falante é médio, mas bom (###valor### dB)
Graves 100 - 315Hz
(±) | graves reduzidos - em média 9.2% menor que a mediana
(±) | a linearidade dos graves é média (12.3% delta para a frequência anterior)
Médios 400 - 2.000 Hz
(+) | médios equilibrados - apenas 4% longe da mediana
(+) | médios são lineares (5.4% delta para frequência anterior)
Altos 2 - 16 kHz
(+) | agudos equilibrados - apenas 0.9% longe da mediana
(+) | os máximos são lineares (4.2% delta da frequência anterior)
Geral 100 - 16.000 Hz
(±) | a linearidade do som geral é média (15.2% diferença em relação à mediana)
Comparado com a mesma classe
» 34% de todos os dispositivos testados nesta classe foram melhores, 5% semelhantes, 61% piores
» O melhor teve um delta de 5%, a média foi 18%, o pior foi 53%
Comparado com todos os dispositivos testados
» 21% de todos os dispositivos testados foram melhores, 4% semelhantes, 74% piores
» O melhor teve um delta de 4%, a média foi 24%, o pior foi 134%
Dell XPS 13 9380 i7 4K análise de áudio
(±) | o volume do alto-falante é médio, mas bom (###valor### dB)
Graves 100 - 315Hz
(-) | quase nenhum baixo - em média 18.5% menor que a mediana
(±) | a linearidade dos graves é média (8.1% delta para a frequência anterior)
Médios 400 - 2.000 Hz
(±) | médios mais altos - em média 7.7% maior que a mediana
(±) | a linearidade dos médios é média (11.5% delta para frequência anterior)
Altos 2 - 16 kHz
(±) | máximos mais altos - em média 6.2% maior que a mediana
(±) | a linearidade dos máximos é média (10.5% delta para frequência anterior)
Geral 100 - 16.000 Hz
(±) | a linearidade do som geral é média (28.5% diferença em relação à mediana)
Comparado com a mesma classe
» 90% de todos os dispositivos testados nesta classe foram melhores, 2% semelhantes, 7% piores
» O melhor teve um delta de 5%, a média foi 18%, o pior foi 53%
Comparado com todos os dispositivos testados
» 86% de todos os dispositivos testados foram melhores, 3% semelhantes, 11% piores
» O melhor teve um delta de 4%, a média foi 24%, o pior foi 134%
| desligado | |
| Ocioso | |
| Carga |
|
Key:
min: | |
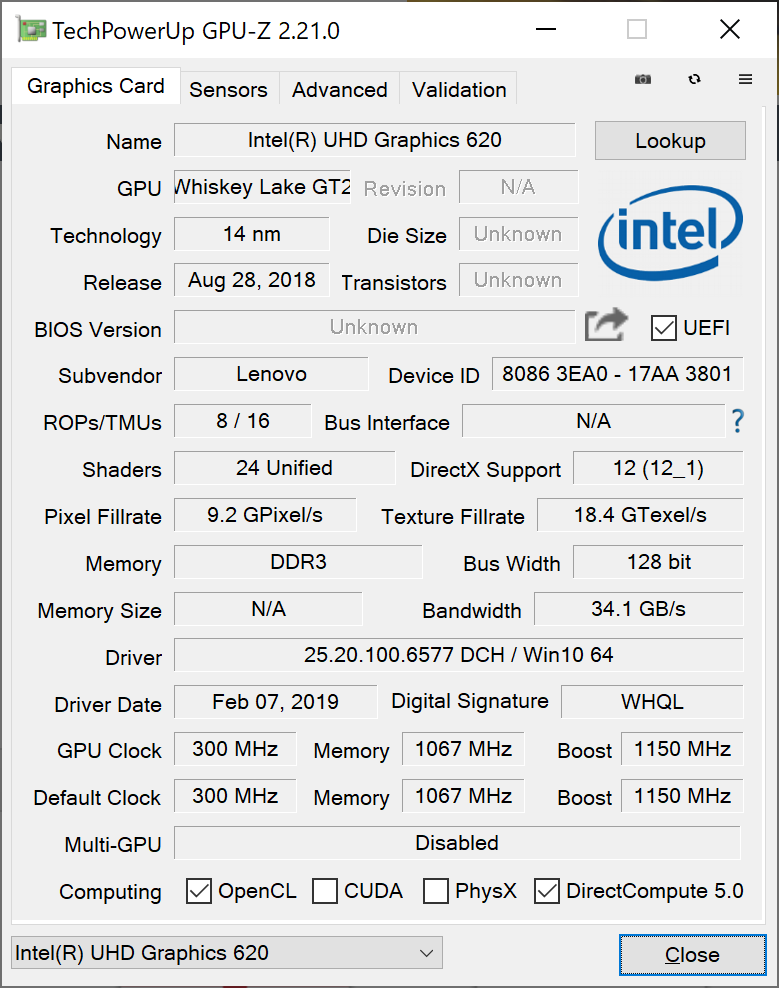
| Lenovo IdeaPad S940-14IWL i7-8565U, UHD Graphics 620, Samsung SSD PM981 MZVLB512HAJQ, IPS, 3840x2160, 14" | Dell XPS 13 9380 i7 4K i7-8565U, UHD Graphics 620, Samsung SSD PM981 MZVLB512HAJQ, IPS, 3840x2160, 13.3" | Apple MacBook Pro 13 2018 Touchbar i5 i5-8259U, Iris Plus Graphics 655, , IPS, 2560x1600, 13.3" | Asus ZenBook 13 UX333FA i5-8265U, UHD Graphics 620, WDC PC SN520 SDAPNUW-256G, IPS, 1920x1080, 13.3" | Lenovo Yoga C930-13IKB 81C4 i5-8550U, UHD Graphics 620, SK hynix PC401 HFS256GD9TNG, IPS, 1920x1080, 13.9" | Lenovo Yoga 530-14ARR-81H9000VGE R7 2700U, Vega 10, SK hynix BC501 HFM256GDHTNG, IPS, 1920x1080, 14" | |
|---|---|---|---|---|---|---|
| Power Consumption | 7% | 4% | 38% | 6% | 24% | |
| Idle Minimum * (Watt) | 5.2 | 5.2 -0% | 2.3 56% | 1.6 69% | 3.4 35% | 4.3 17% |
| Idle Average * (Watt) | 10.2 | 8.6 16% | 8.7 15% | 4.6 55% | 7.5 26% | 6.4 37% |
| Idle Maximum * (Watt) | 11.9 | 10.5 12% | 12.2 -3% | 7.3 39% | 11.8 1% | 7.8 34% |
| Load Average * (Watt) | 42.1 | 44.2 -5% | 53.3 -27% | 37.9 10% | 47.7 -13% | 34 19% |
| Load Maximum * (Watt) | 53.6 | 47.5 11% | 64 -19% | 44.8 16% | 63.2 -18% | 47.8 11% |
* ... menor é melhor
| Lenovo IdeaPad S940-14IWL i7-8565U, UHD Graphics 620, 52 Wh | Dell XPS 13 9380 i7 4K i7-8565U, UHD Graphics 620, 52 Wh | Apple MacBook Pro 13 2018 Touchbar i5 i5-8259U, Iris Plus Graphics 655, 58 Wh | Asus ZenBook 13 UX333FA i5-8265U, UHD Graphics 620, 50 Wh | Lenovo ThinkPad X1 Carbon 2018-20KGS5DU00 i5-8550U, UHD Graphics 620, 57 Wh | Lenovo Yoga C930-13IKB 81C4 i5-8550U, UHD Graphics 620, 60 Wh | Lenovo Yoga 530-14ARR-81H9000VGE R7 2700U, Vega 10, 45 Wh | |
|---|---|---|---|---|---|---|---|
| Duração da bateria | 54% | 94% | 119% | 80% | 122% | 28% | |
| Reader / Idle (h) | 8.4 | 27.8 231% | 11.7 39% | ||||
| WiFi v1.3 (h) | 5 | 7.7 54% | 9.7 94% | 9.9 98% | 9 80% | 11.1 122% | 6.7 34% |
| Load (h) | 1.7 | 2.2 29% | 1.9 12% | ||||
| Witcher 3 ultra (h) | 1.6 |
Pro
Contra
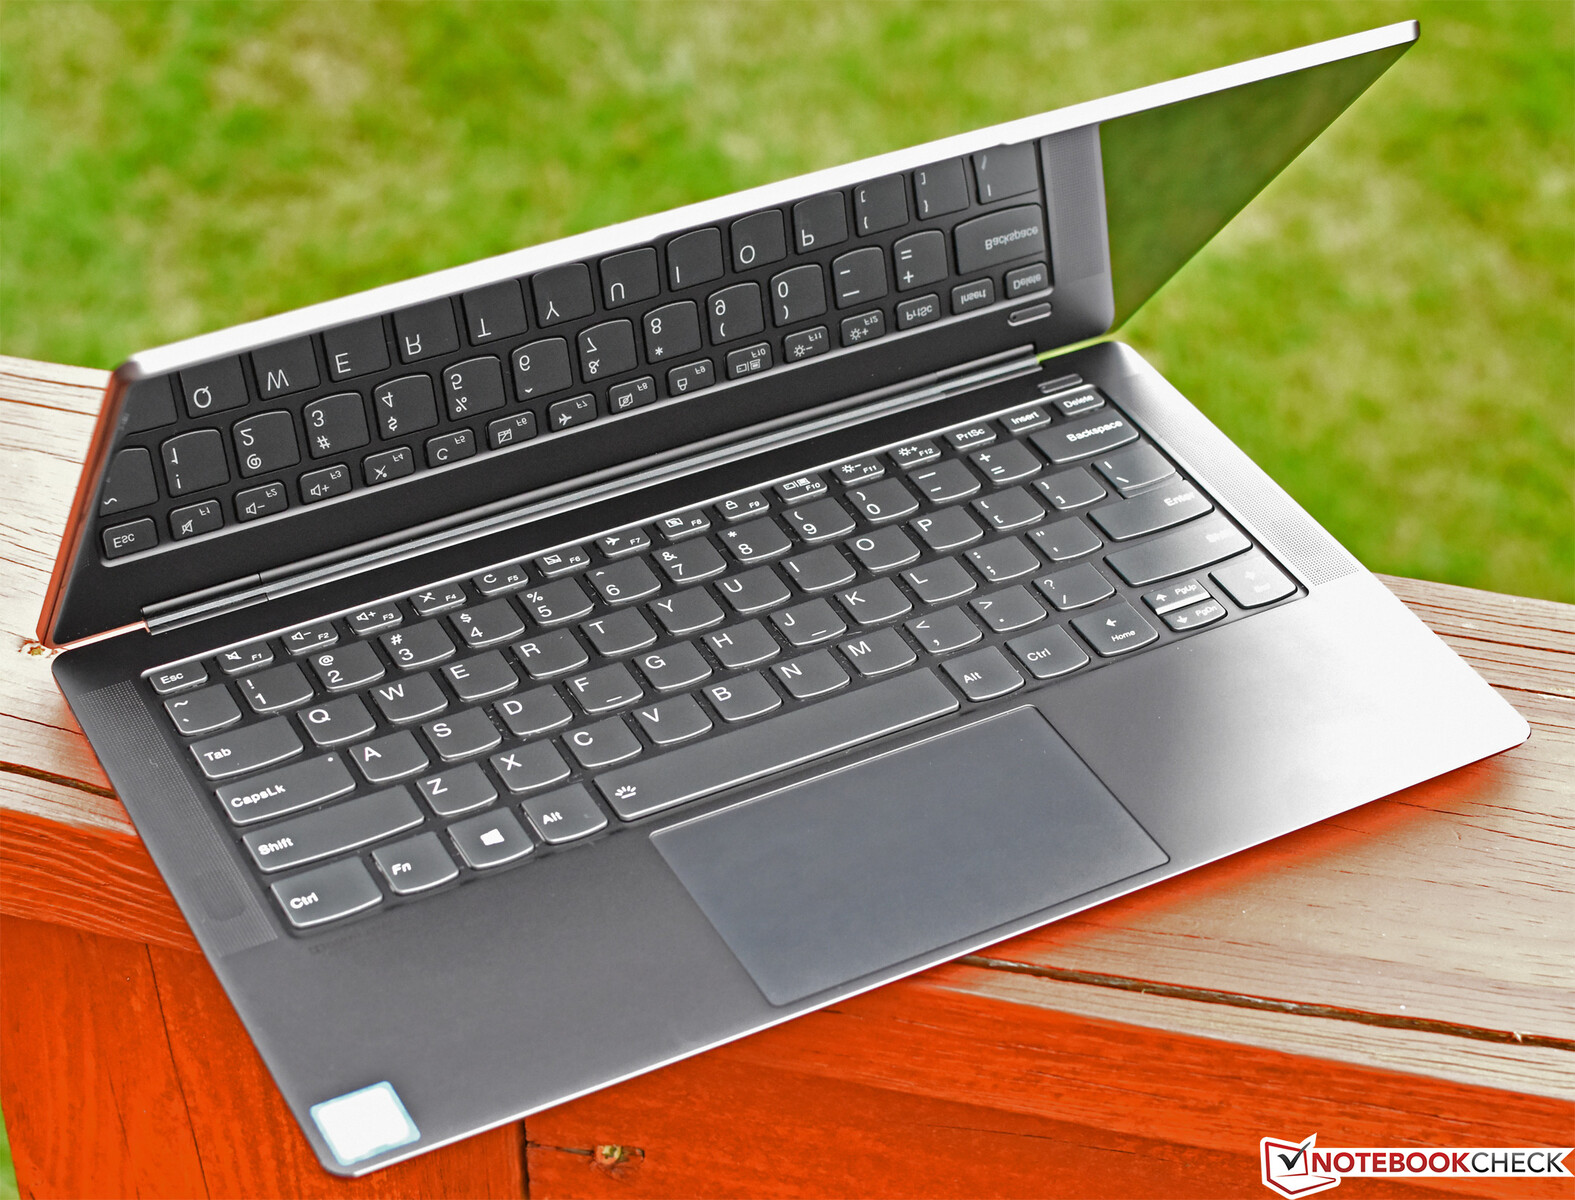
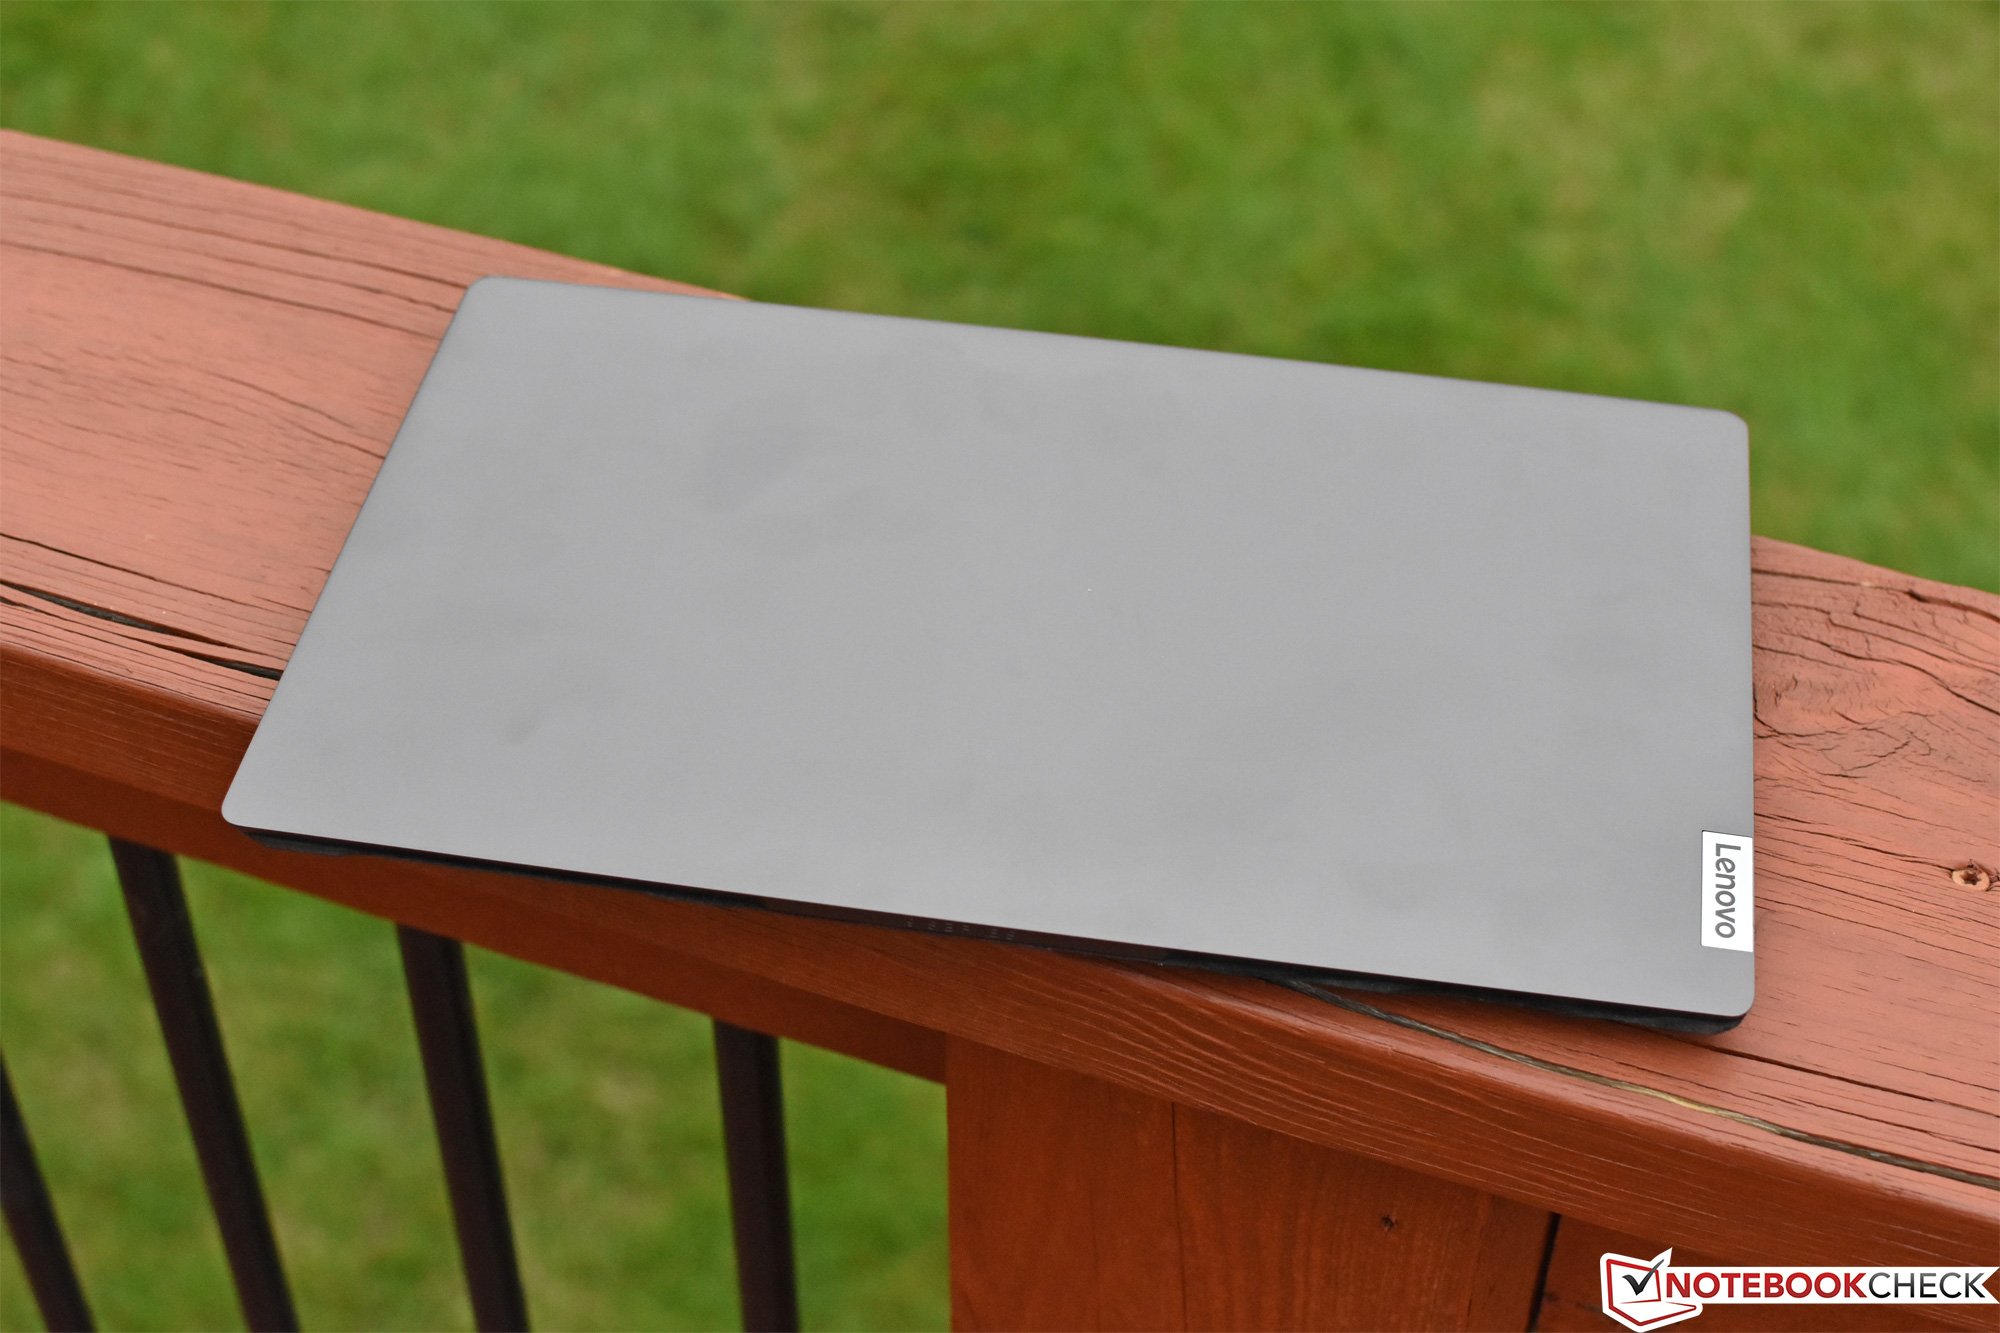
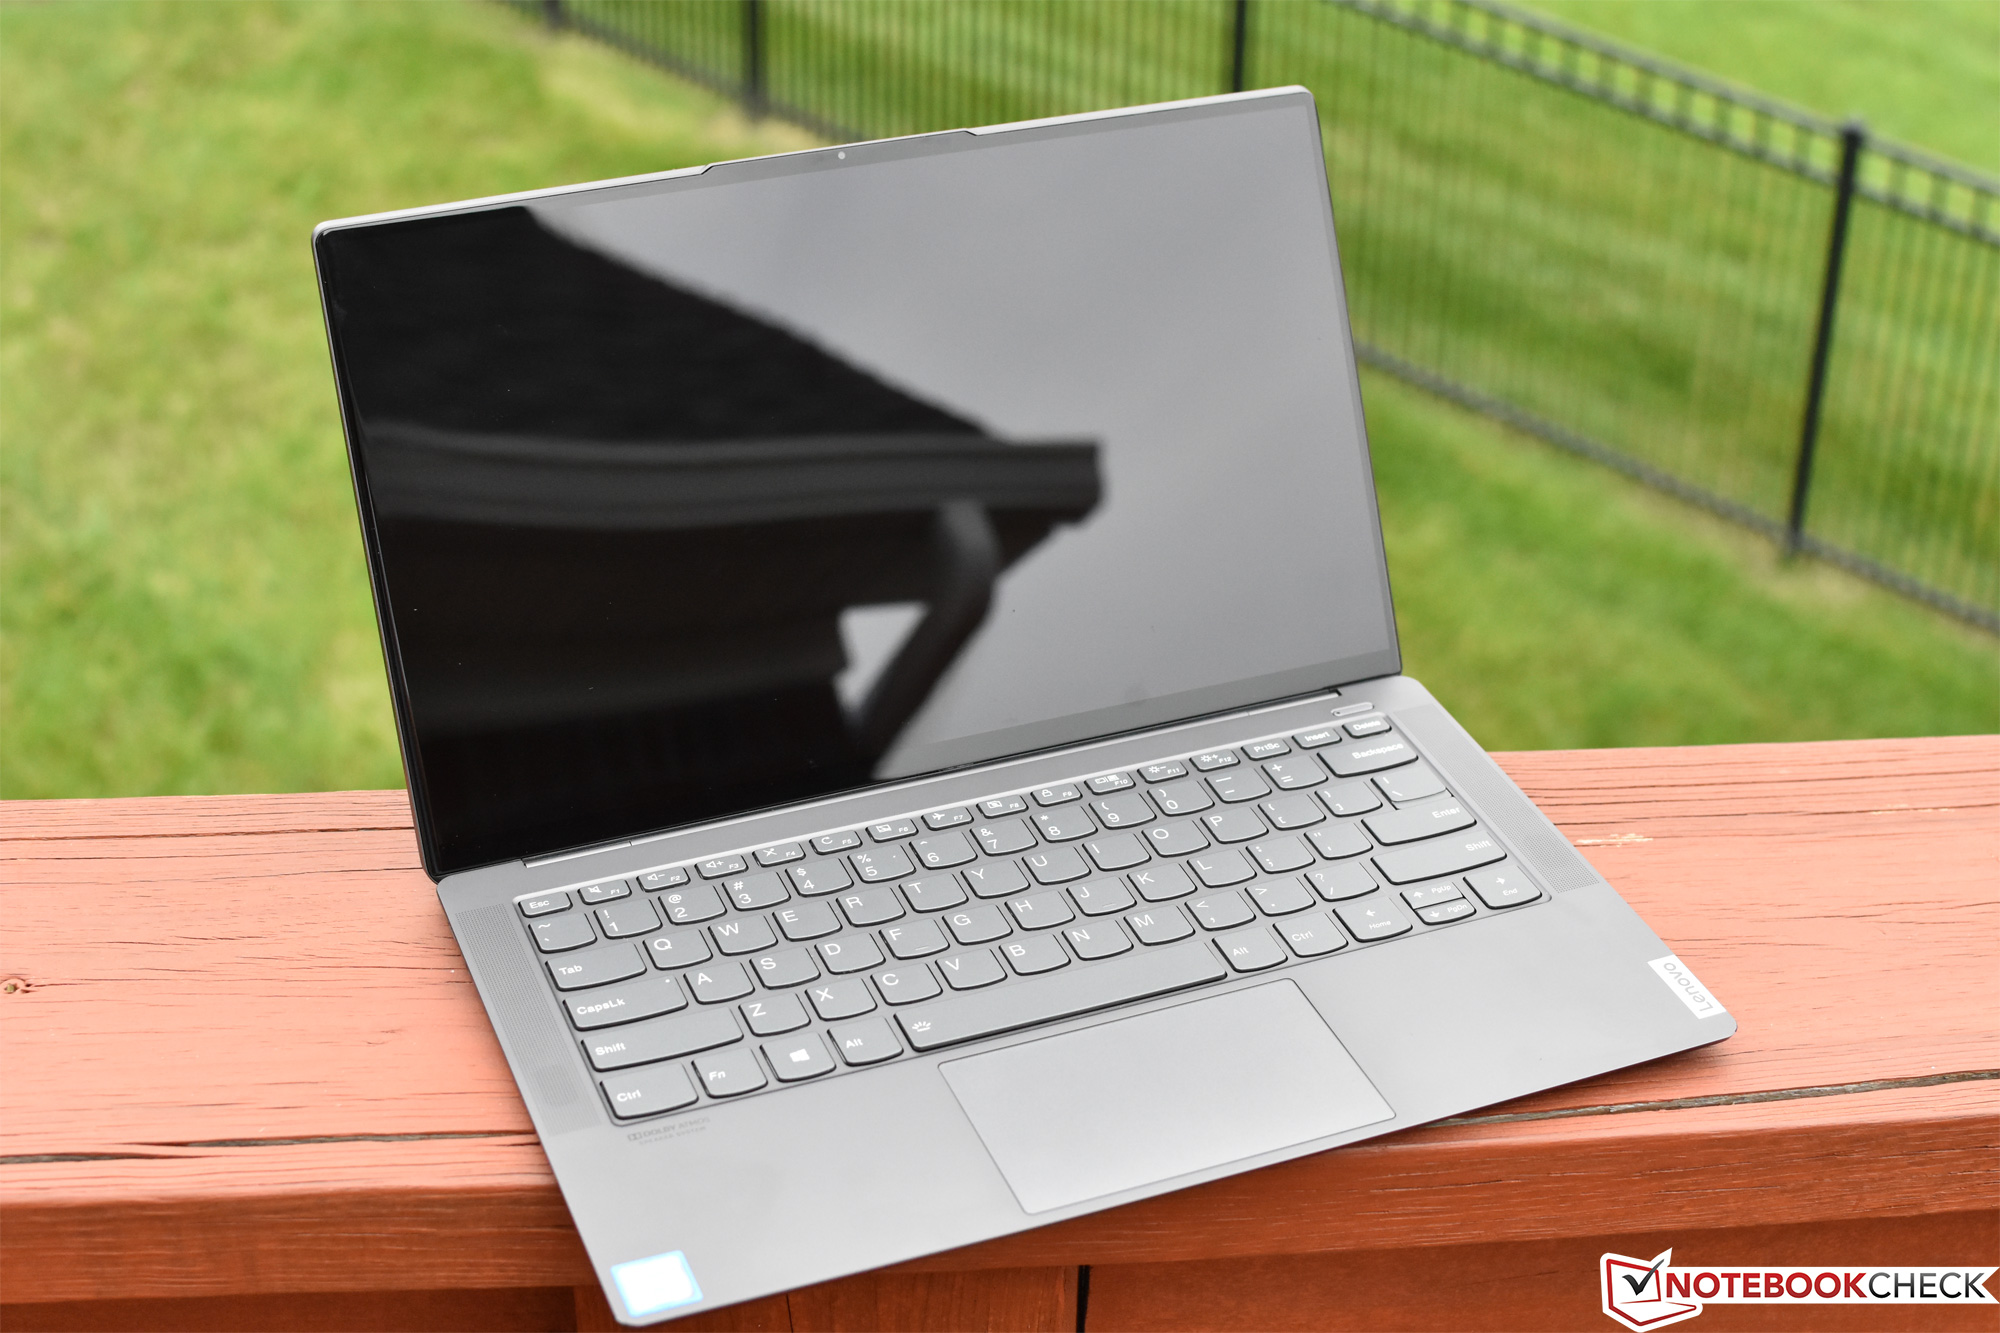
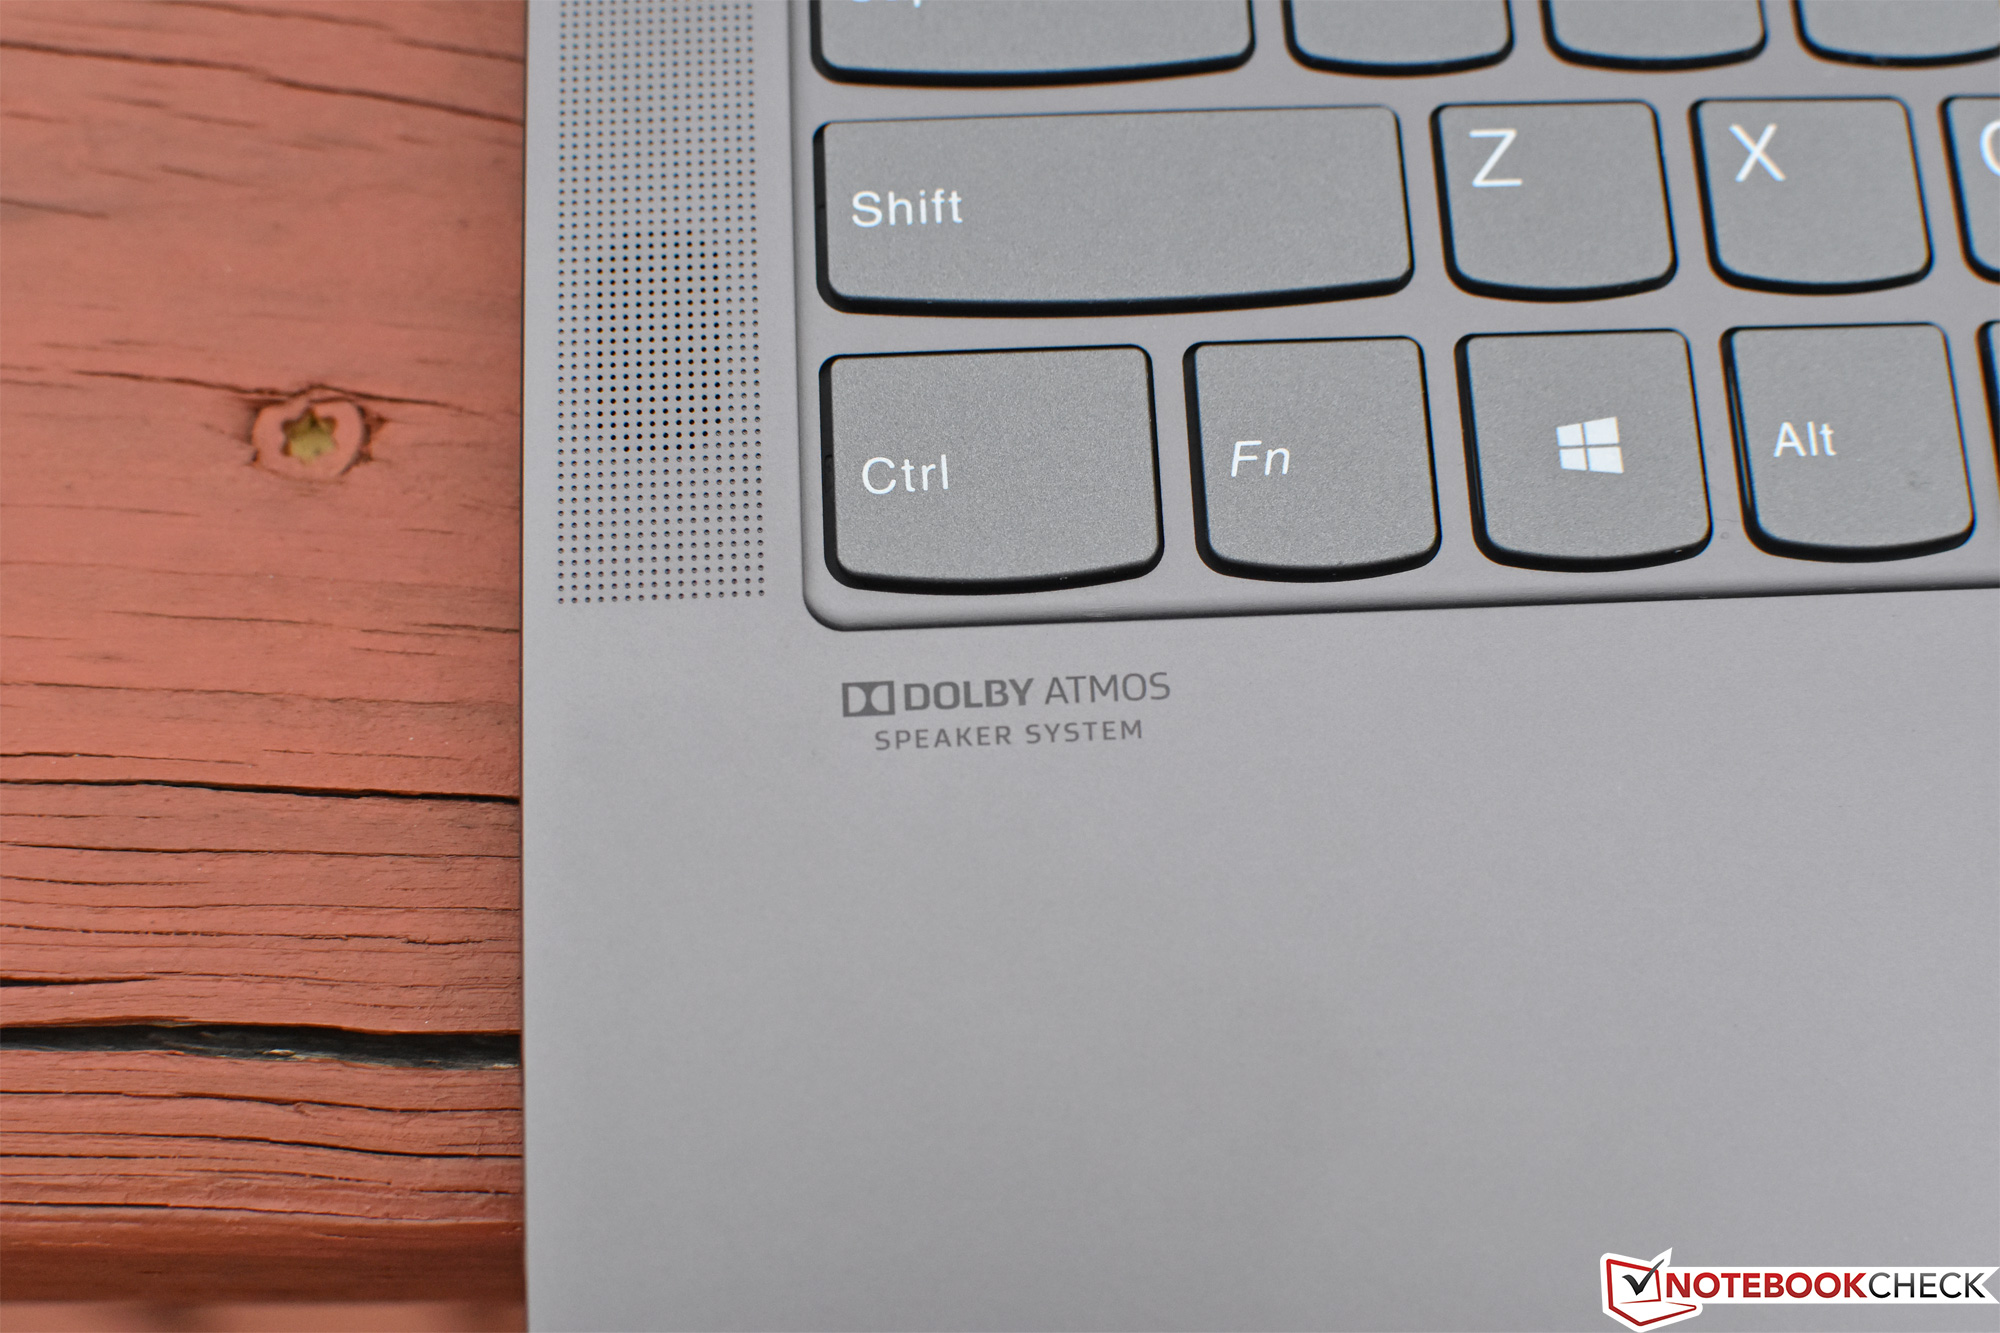
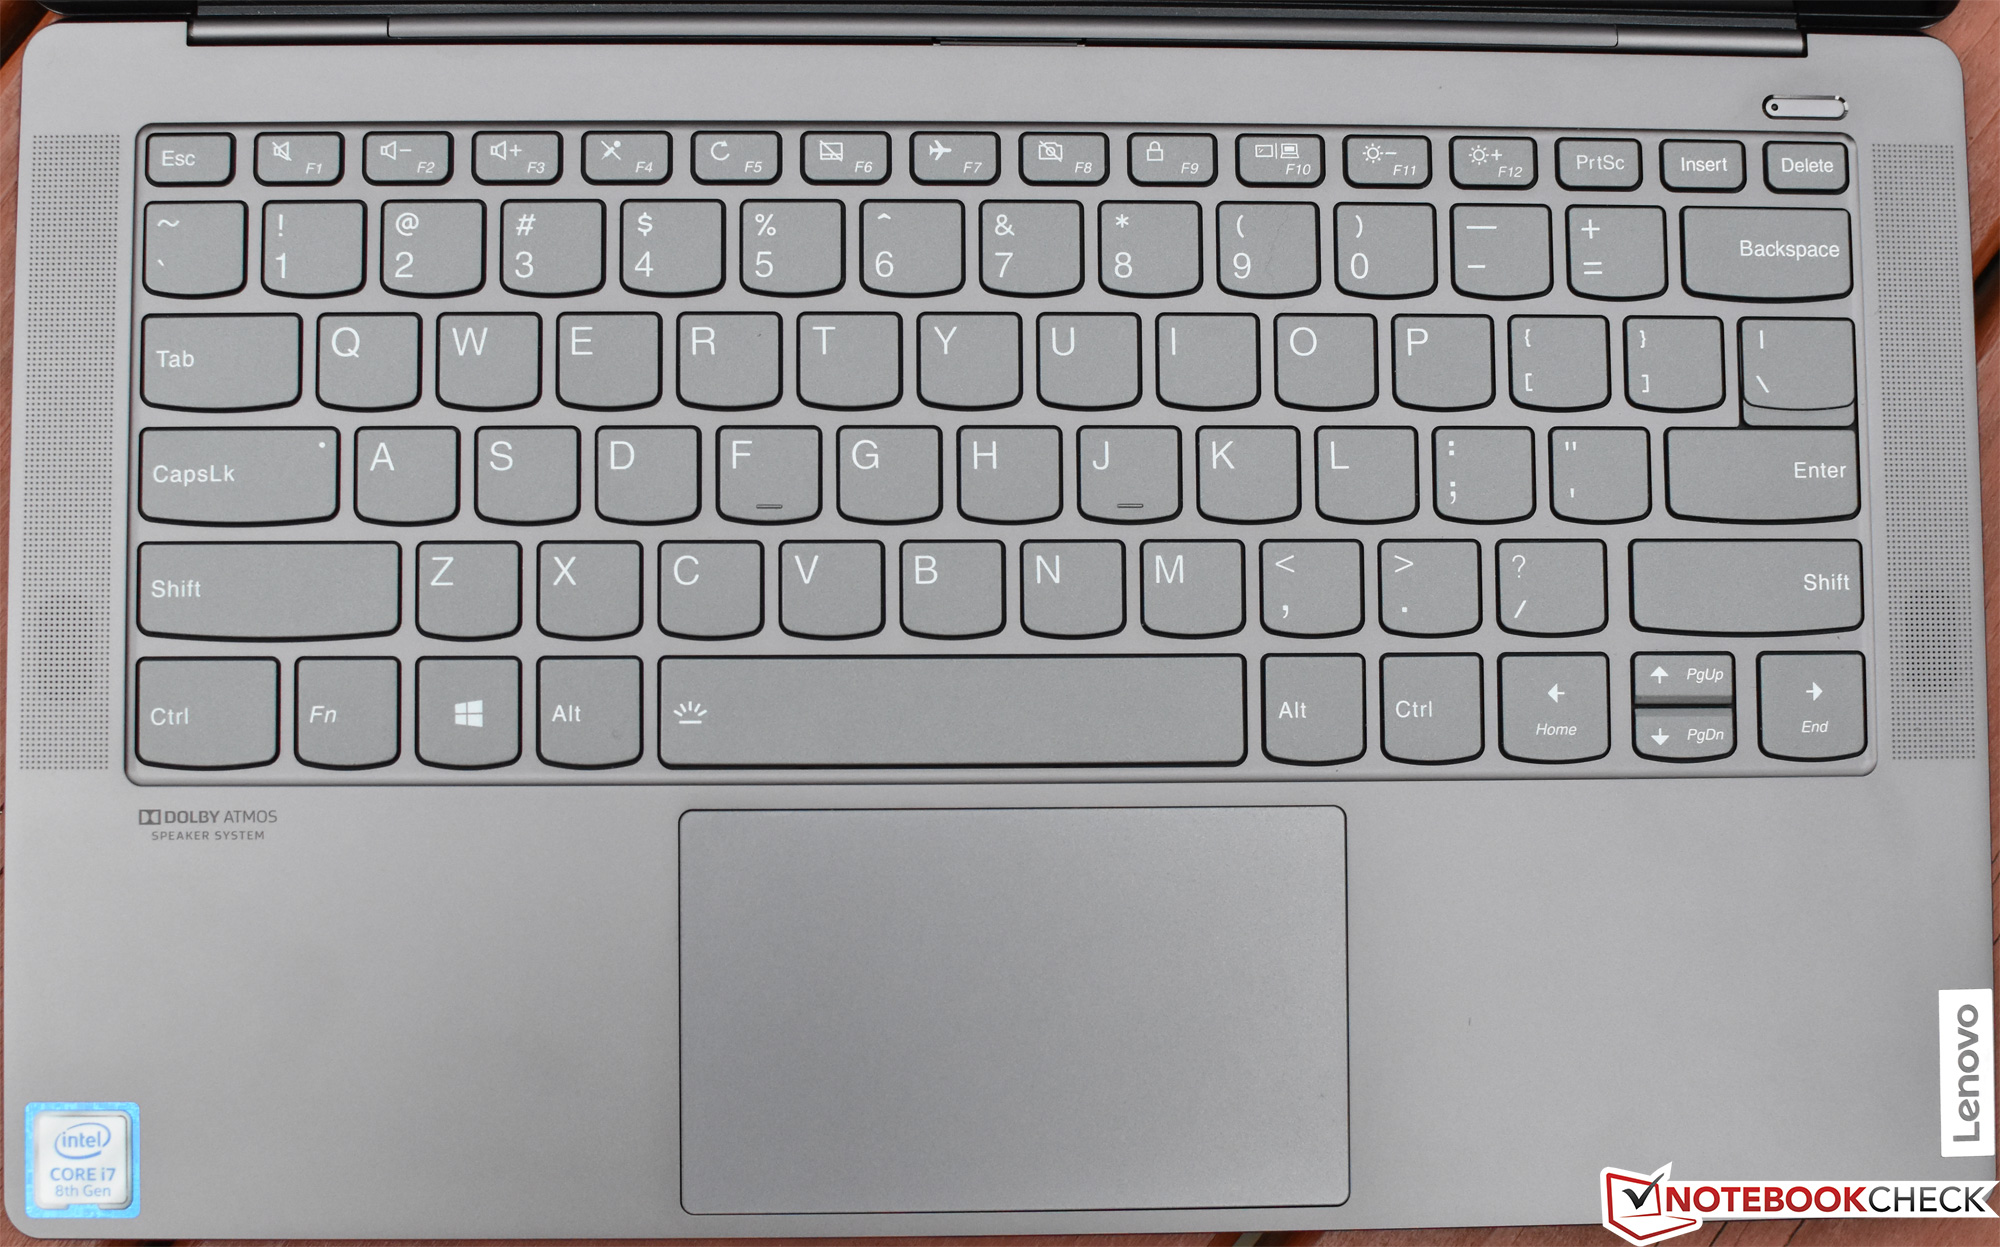
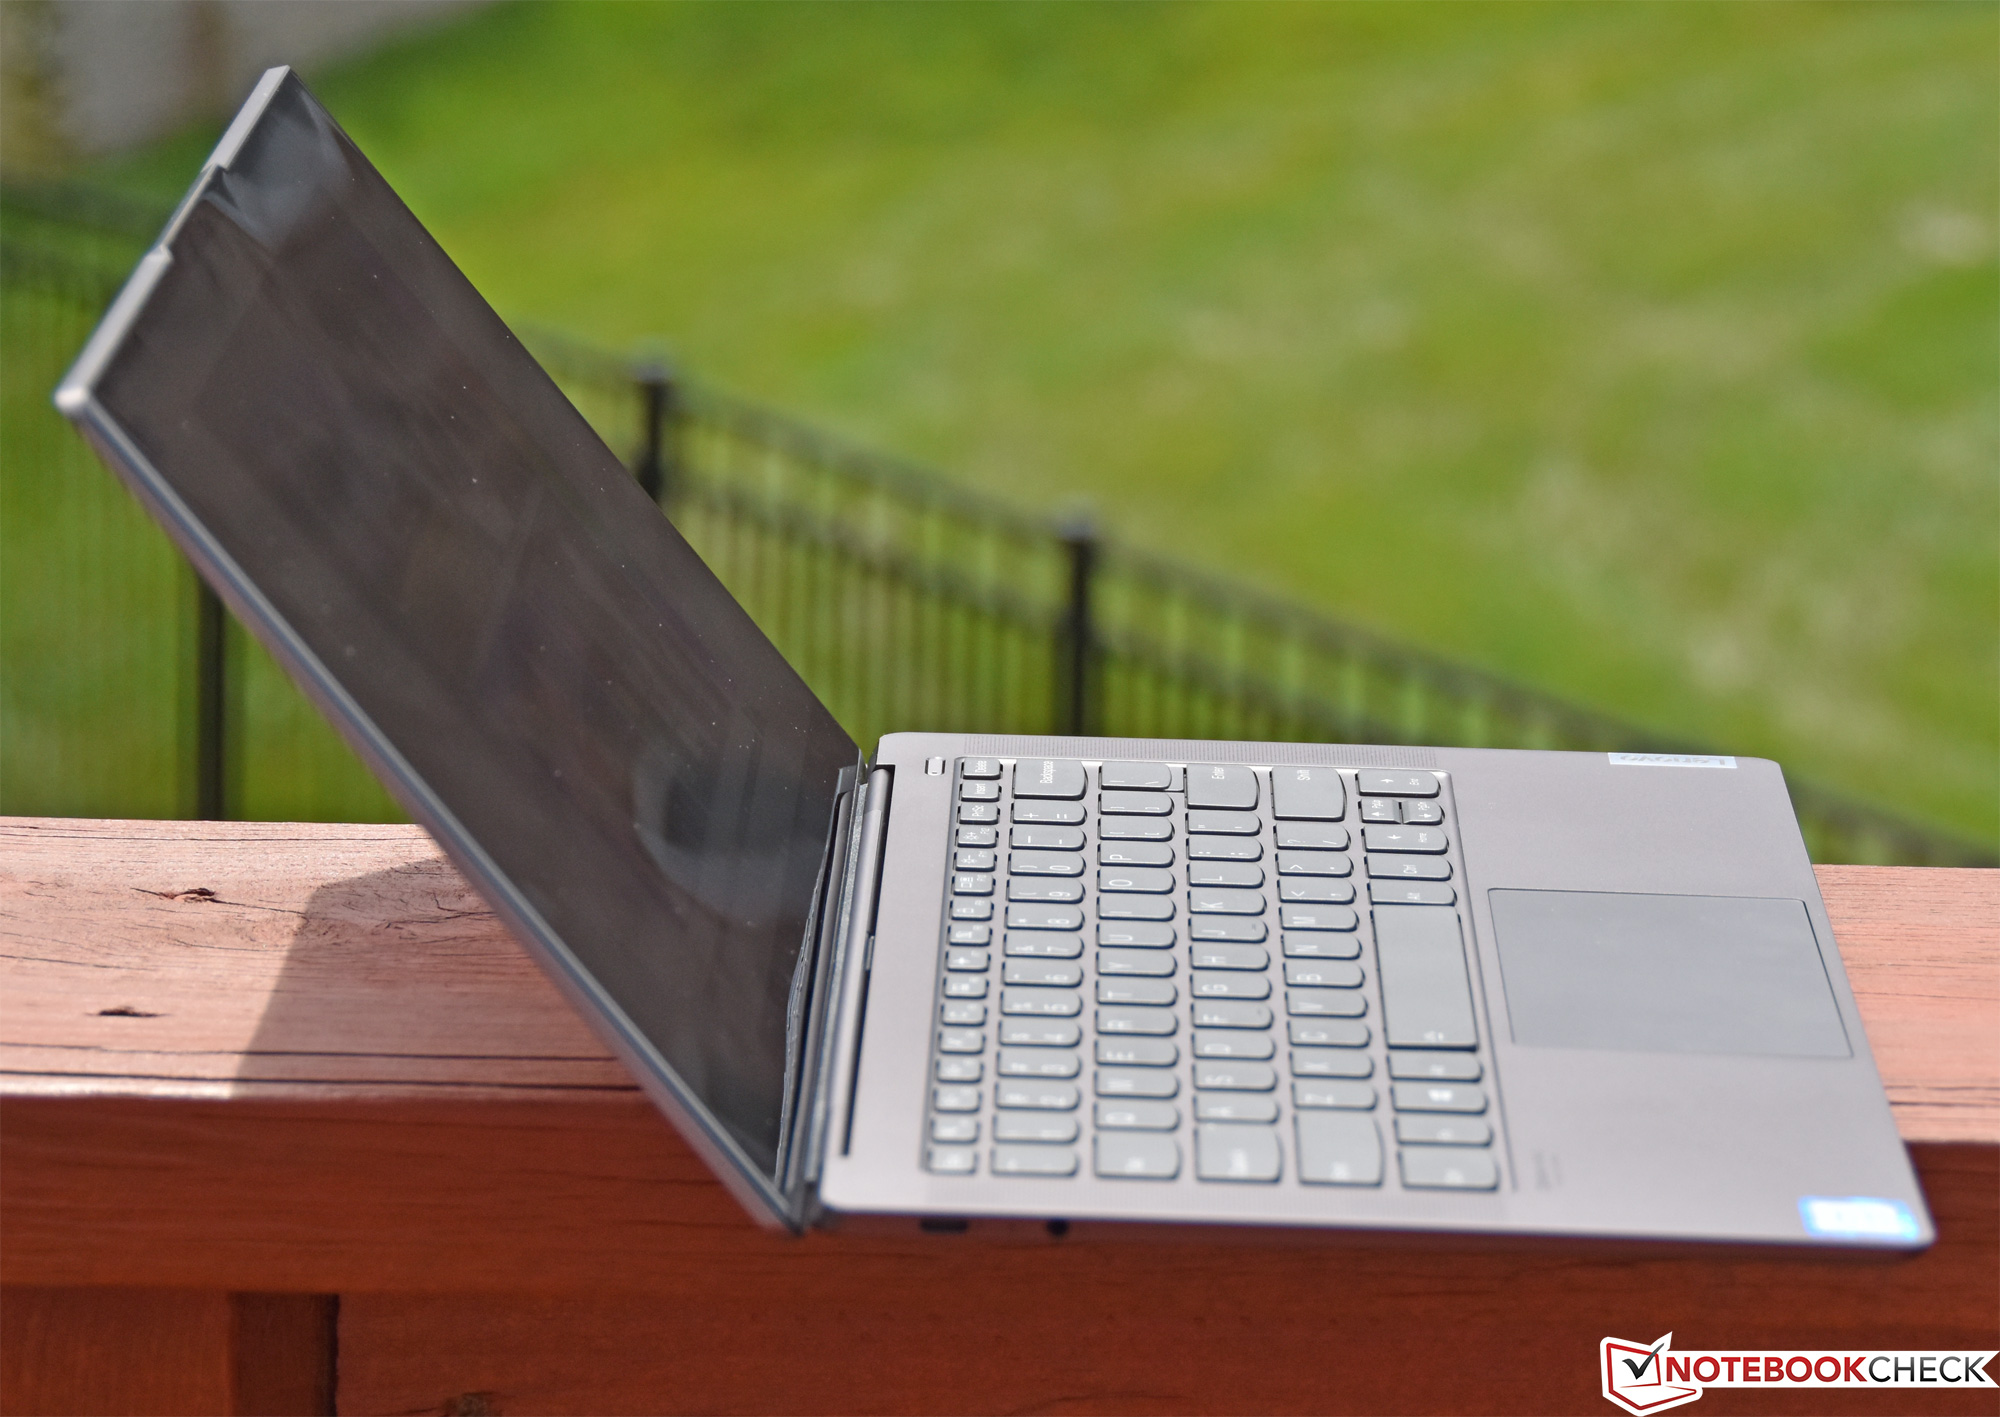
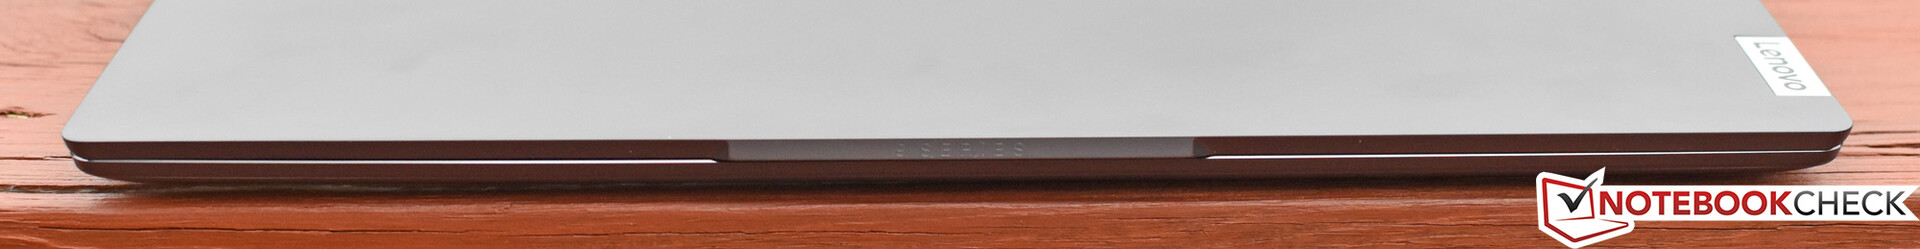
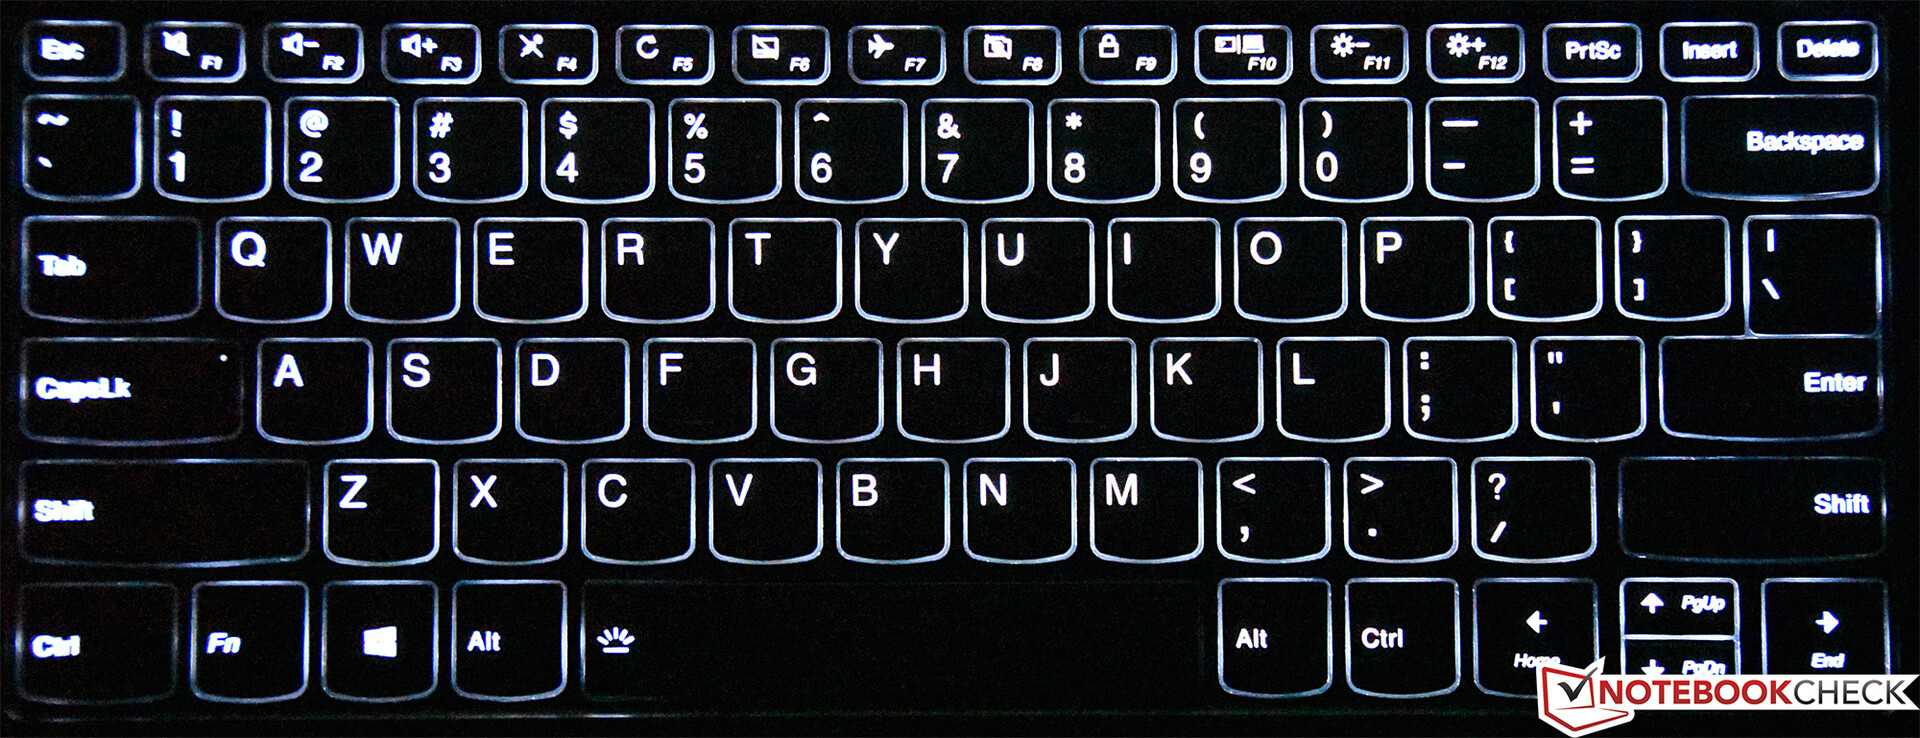
O IdeaPad S940 é um dispositivo absolutamente lindo. É um dos portáteis mais pequenos e mais leves de 14 polegadas que analisamos até à data e ficaria bastante bem em uma mesa de cozinha ou numa sala de reuniões. Mas, embora seja pequeno, ainda se sente relativamente resistente em sua estrutura, com uma tampa de tela rígida, dobradiças perfeitamente ajustadas e muito pouca flexão na da carcaça. Ele também é o anfitrião de uma das mais impressionantes - e incrivelmente brilhantes - telas 4K HDR que vimos em um portátil. Complementando essa tela estão não apenas dois, mas quatro alto-falantes Dolby Atmos enganosamente poderosos também ... e enquanto a física continua sendo uma restrição inevitável, eles fornecem uma experiência de áudio que excede em muito a de praticamente qualquer outro portátil de seu tamanho. É quase silencioso sob quase todas as condições e quase inaudível, mesmo sob uso intenso. E, finalmente, apesar de sua finura, os dispositivos de entrada também são bastante decentes - com um muito bom clickpad de vidro acompanhando um teclado pouco profundo, mas ainda assim, fácil de usar.
O IdeaPad S940 é um portátil bonito que, como configurado (com a tela 4K e CPU Core i7), comete alguns erros críticos que dificultam a recomendação para a maioria dos usos. Estamos ansiosos para avaliar uma configuração FHD com uma CPU Core i5 em algum momento, o qual esperamos que possa resolver algumas dessas decepções.
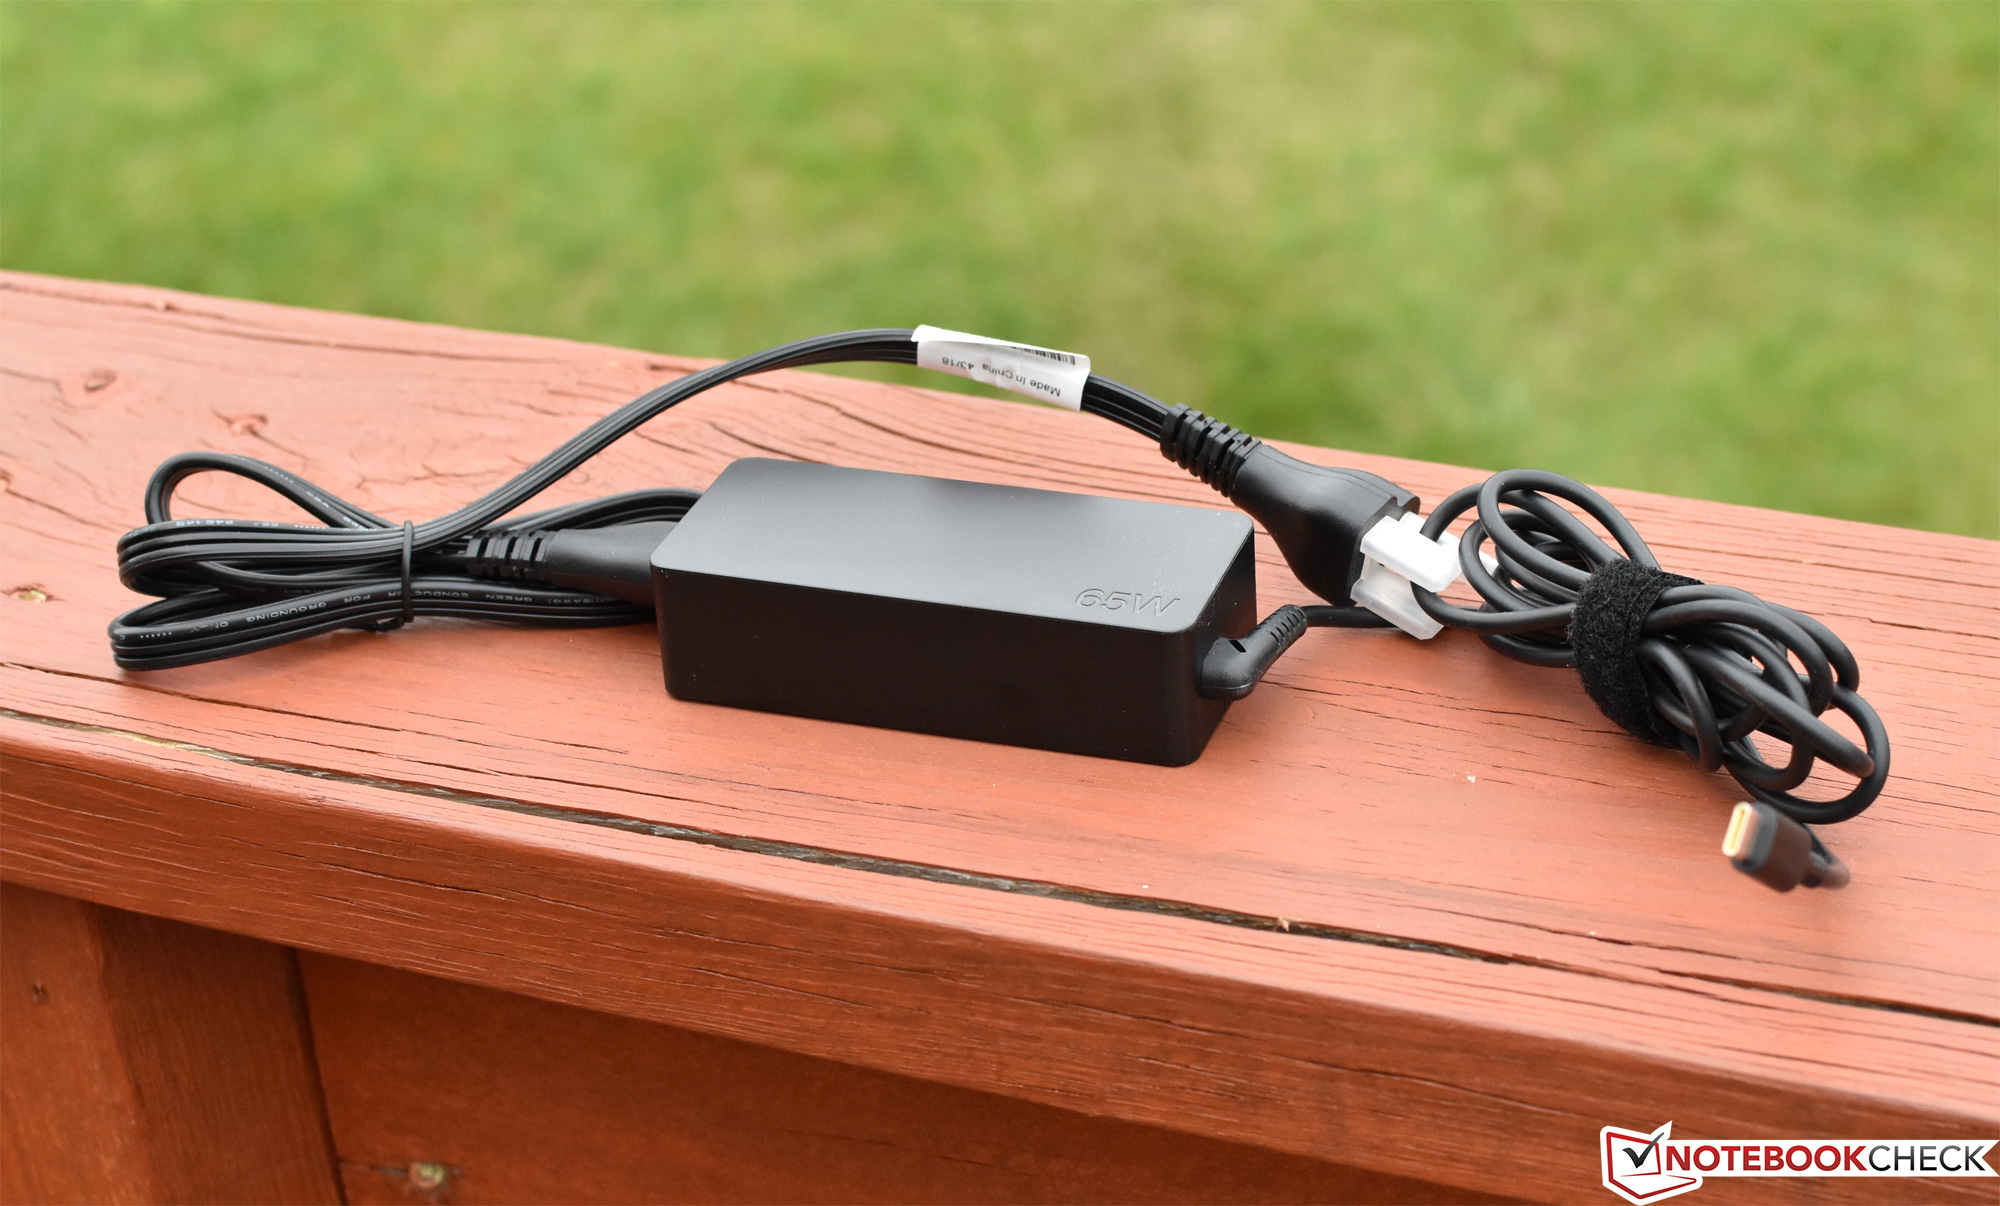
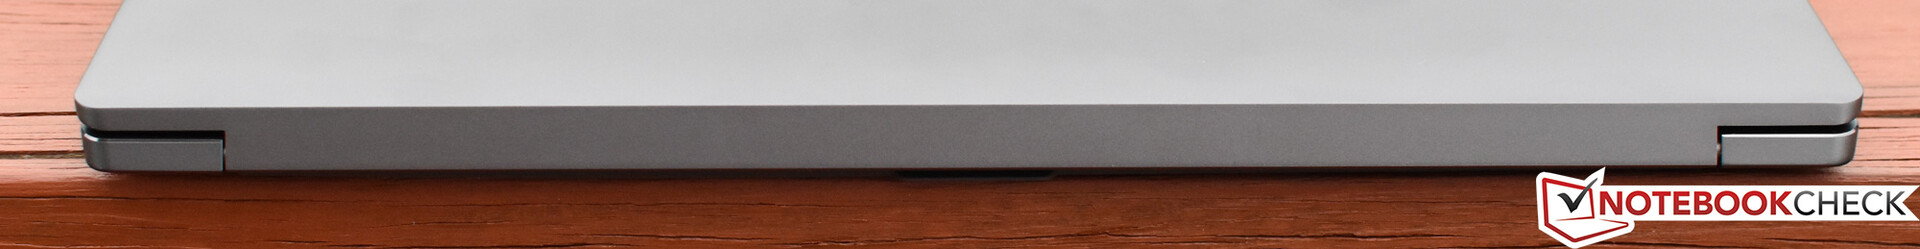
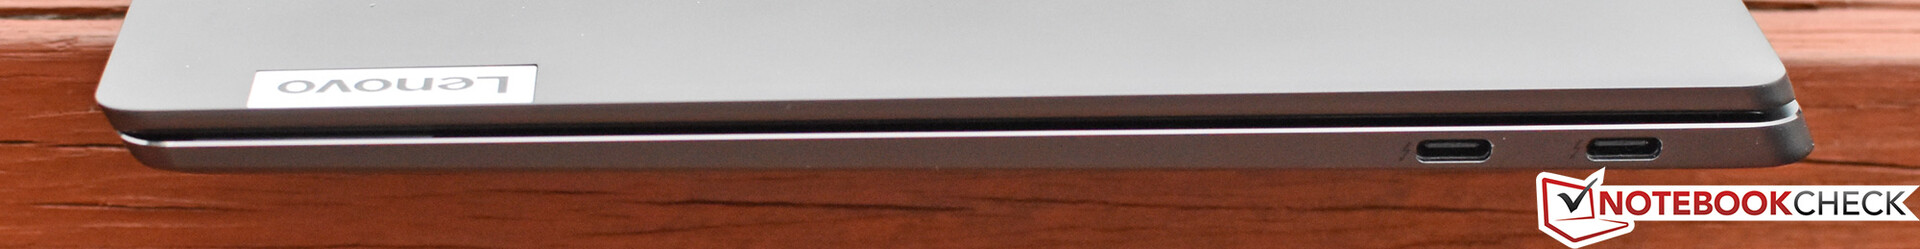
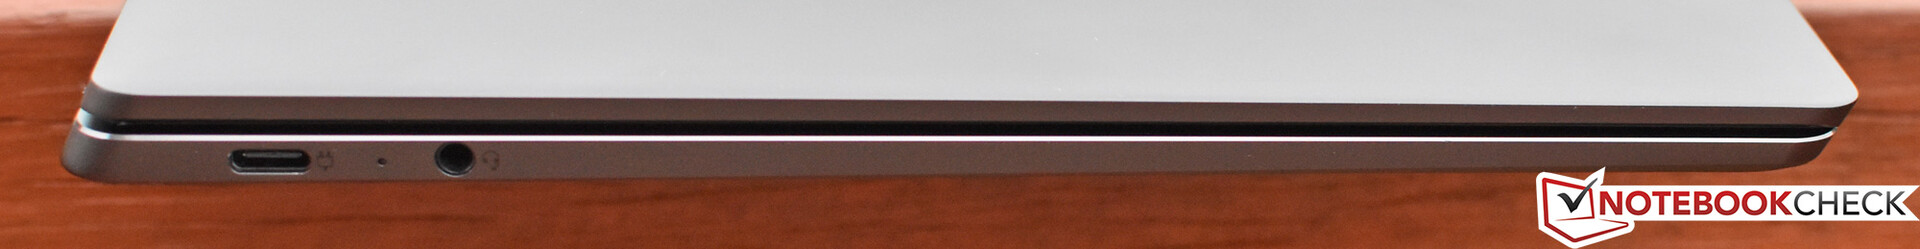
Se apenas todo o pacote fosse tão notável. Infelizmente, desde aqui, as coisas tomam um rumo para o menos impressionante. A seleção de portas é um pouco fina, com duas portas Thunderbolt 3.0 (sem porta de carregamento dedicada), além de uma outra porta USB tipo C e uma entrada para fones de ouvido. O consumo de energia é alto e a duração da bateria é decepcionantemente curta - com menos de 5 horas medidas em nosso benchmark de navegação na web. Mas o mais preocupante de tudo é a falta de vontade da máquina - ou talvez sua incapacidade - de se resfriar adequadamente: cargas sustentadas resultam em temperaturas que sobem rapidamente para os 90 graus centígrados, após o qual nunca se recupera. O resultado está abaixo do desempenho médio da CPU para o chip Core i7 em nossa unidade de análise. Mas o portátil também não tem interesse em se resfriar enquanto está no modo ocioso e sob uso normal - uma negligência que resulta em temperaturas de superfície mais altas do que o normal no modo ocioso, e uso menos confortável do que o normal em muitas situações.
Então, infelizmente, os usos práticos para o S940 - pelo menos, com a impressionante tela UHD - são menos do que poderiam ser. É provável que a opção de tela FHD melhore consideravelmente a duração da bateria, embora ainda não tenhamos testado essa configuração. Por isso, não podemos dizer com certeza. Se o desempenho da CPU não for importante, talvez essa inadequação também possa ser ignorada por alguns - ou, novamente, talvez o Core i5 funcione tão bem a um custo muito menor. Isso também pode ajudar um pouco na área de temperatura, o que poderia melhorar a situação geral. No entanto, como configurado, apesar de sua construção leve e tela absolutamente linda, é difícil recomendar o S940 de US $ 2.000 por cima do carro-chefe da empresa, X1 Carbon, ou qualquer outro concorrente próximo (todos com melhor desempenho na maioria dessas categorias), como o Dell XPS 13 ou MacBook Pro 13.
Lenovo IdeaPad S940-14IWL
- 06/27/2019 v6 (old)
Steve Schardein
Price comparison
