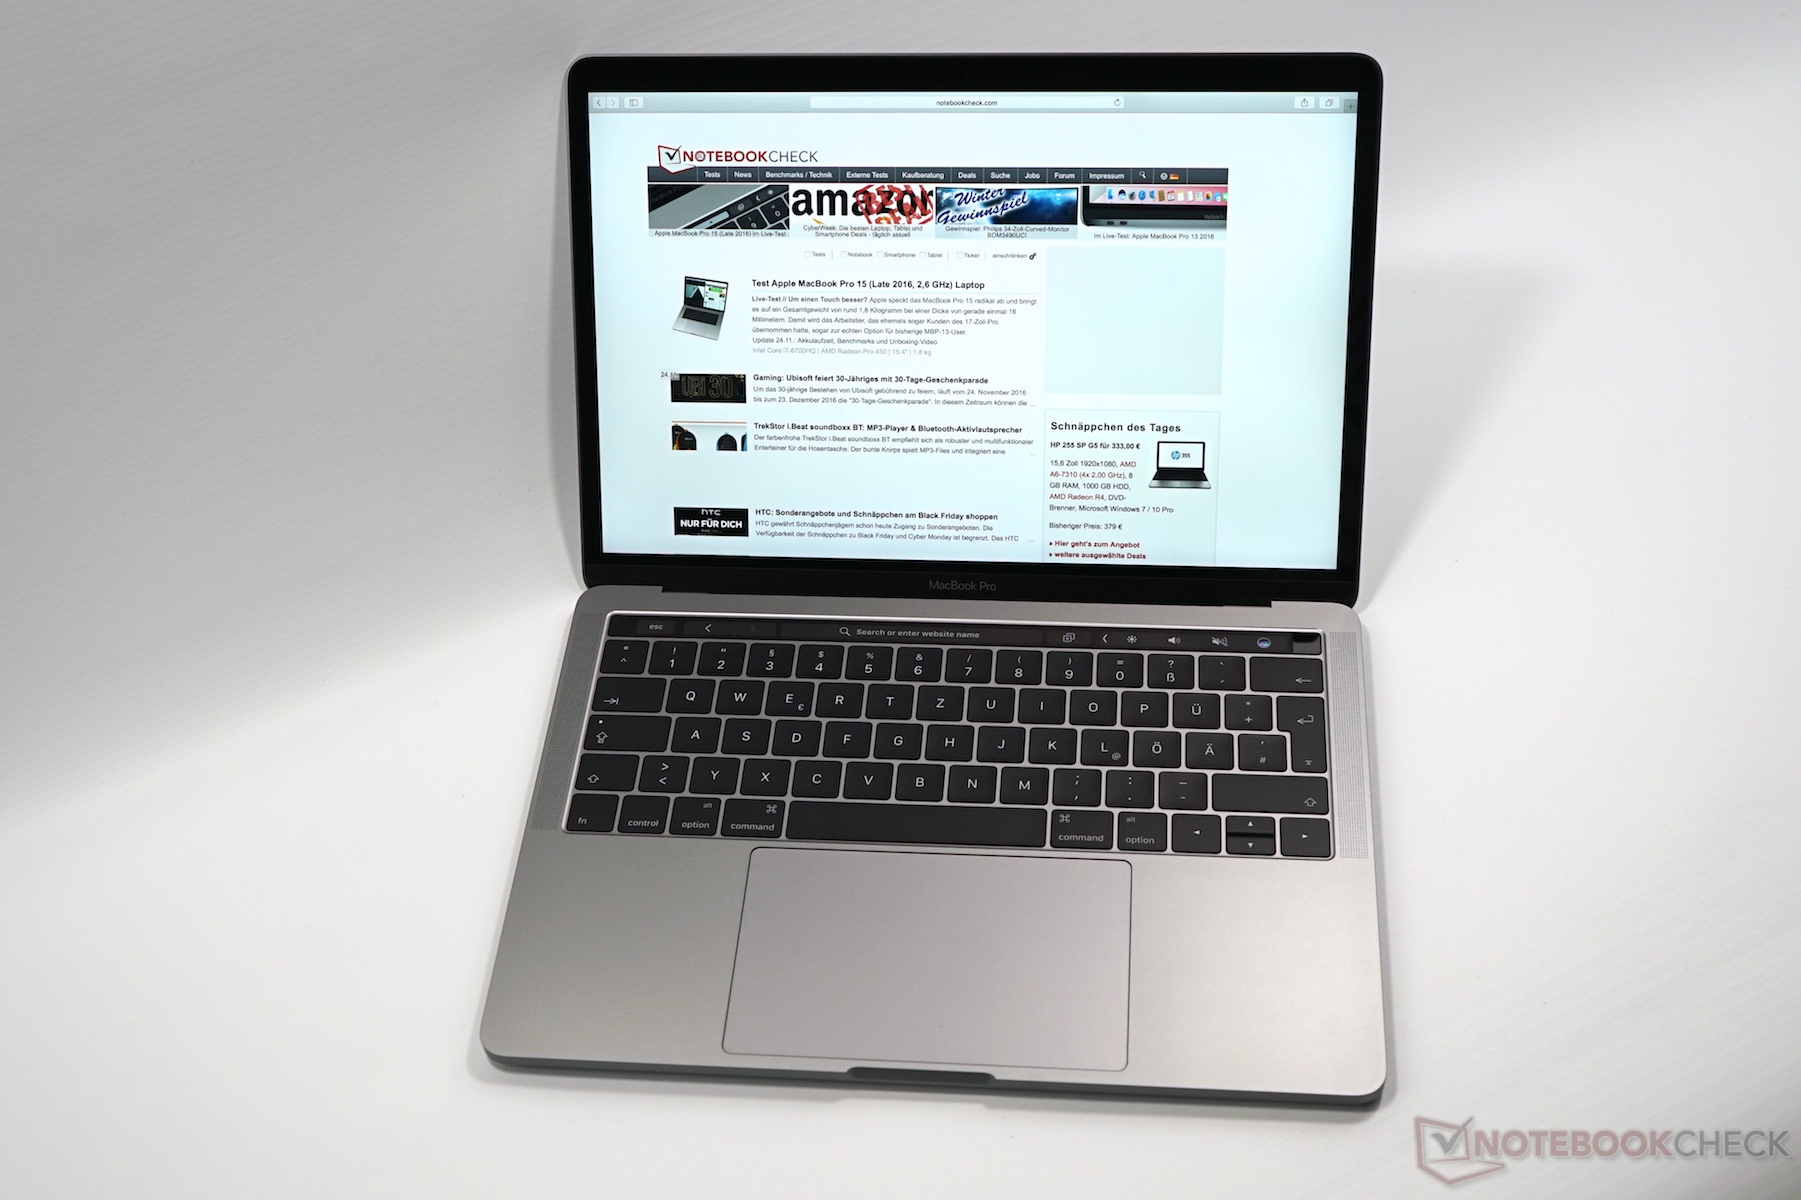
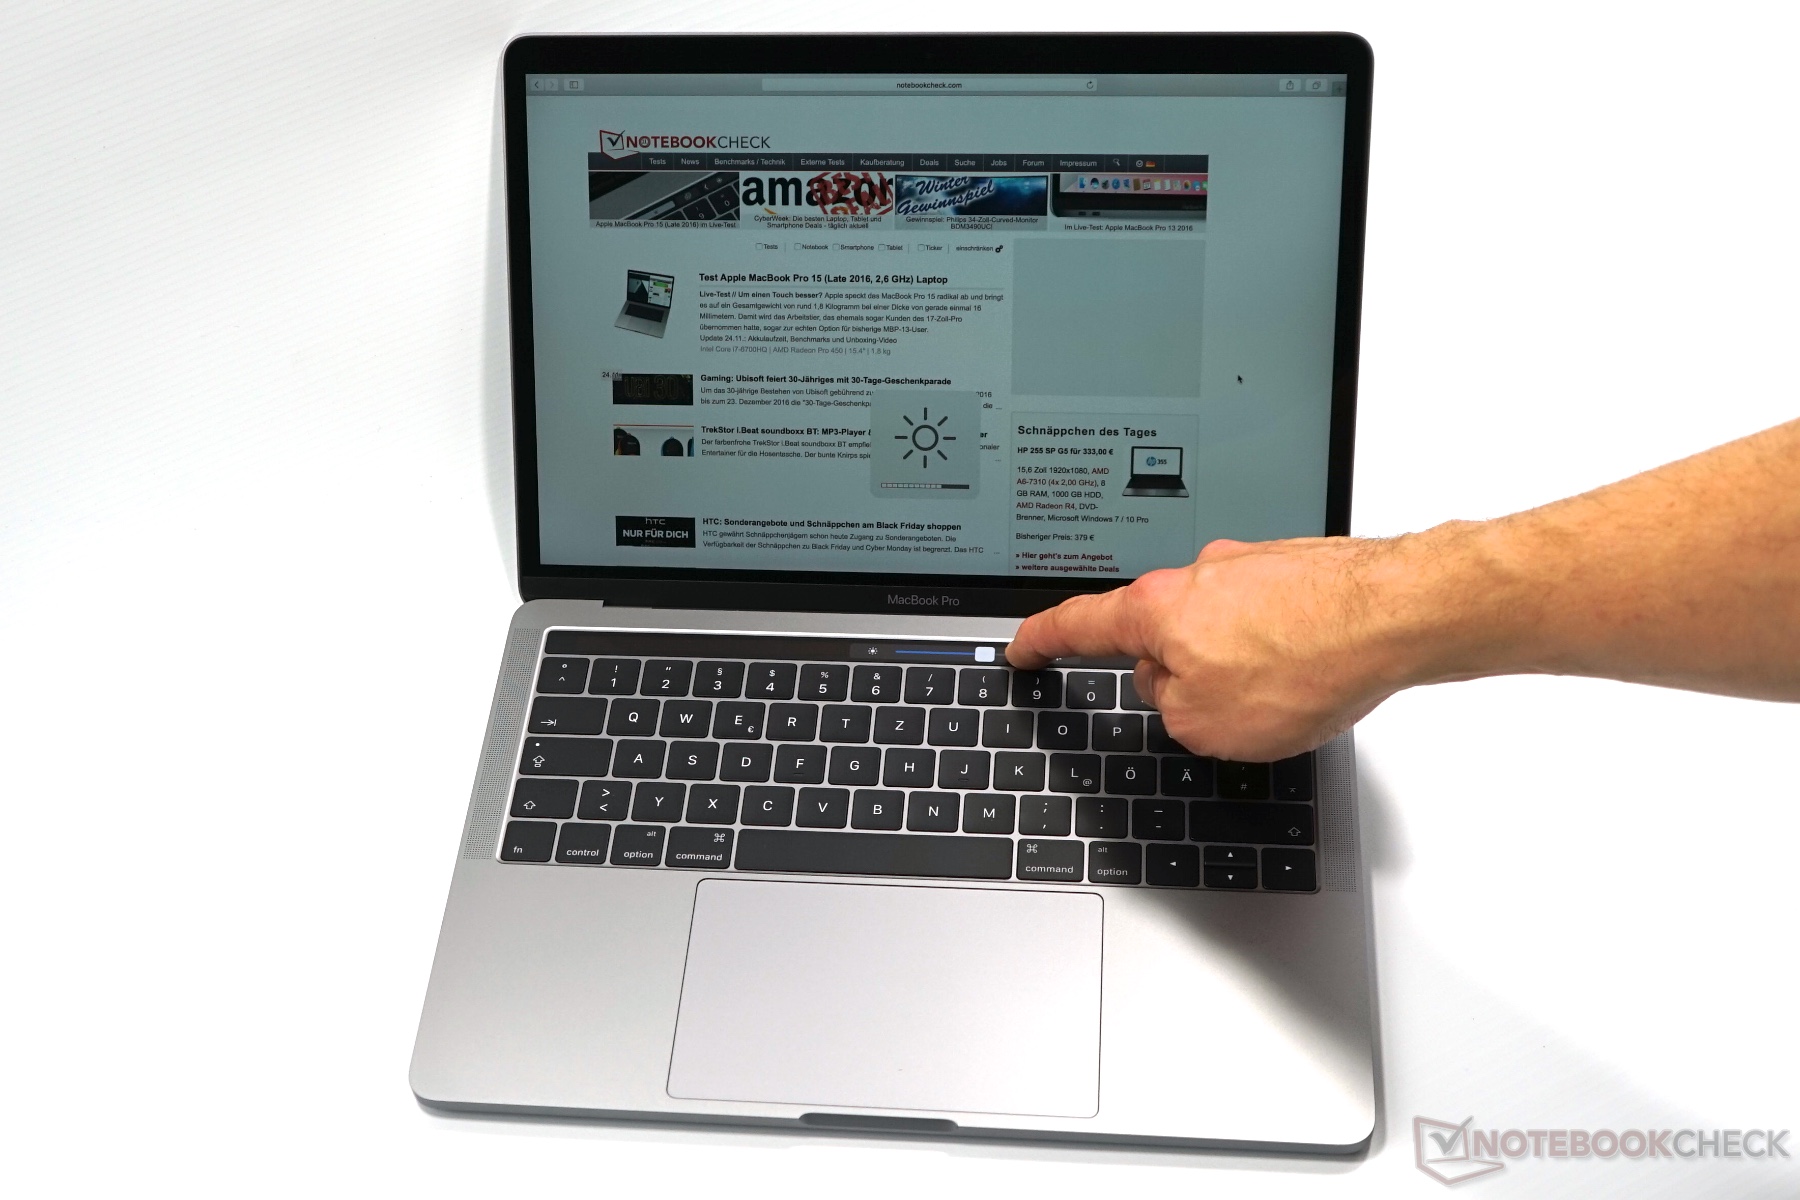
Breve Análise do Portátil Apple MacBook Pro 13 2018 (Touch Bar, i5)
Apple MacBook Pro 13 2018 Touchbar i5 (MacBook Pro 13 2018 Serie)
Processador
Intel Core i5-8259U 4c/8t 4 x 2.3 - 3.8 GHz, Coffee Lake-U
Placa gráfica
Intel Iris Plus Graphics 655, Análises do: 1050 MHz
Memória
8 GB
, LPDDR3-2133, soldada
Pantalha
13.30 polegadas 16:10, 2560 x 1600 pixel 227 PPI, APPA03E, IPS, TrueTone, Brilhante: sim
peso
1.37 kg, Suprimento de energia: 269 g
Preço
1999 Euro
Links
Nota: O fabricante pode utilizar componentes de diferentes fornecedores, incluindo painéis de exibição, unidades ou cartões de memória com especificações semelhantes.
| |||||||||||||||||||||||||
APPA03E testado com X-Rite i1Pro 2
Máximo: 519 cd/m² (Nits) Médio: 504.4 cd/m² Minimum: 4.6 cd/m²iluminação: 95 %
iluminação com acumulador: 524 cd/m²
Contraste: 1573:1 (Preto: 0.33 cd/m²)
ΔE ColorChecker Calman: 1.4 | ∀{0.5-29.43 Ø4.71}
ΔE Greyscale Calman: 2.2 | ∀{0.09-98 Ø4.96}
99.99% sRGB (Argyll 1.6.3 3D)
77.3% AdobeRGB 1998 (Argyll 1.6.3 3D)
87.3% AdobeRGB 1998 (Argyll 3D)
99.9% sRGB (Argyll 3D)
98.5% Display P3 (Argyll 3D)
Gamma: 2.22
CCT: 6908 K
| Apple MacBook Pro 13 2018 Touchbar i5 APPA03E, , 2560x1600, 13.3" | Apple MacBook Pro 13 2017 Touchbar i5 APPA034, , 2560x1600, 13.3" | Apple MacBook Pro 13 2017 APPA033, , 2560x1600, 13.3" | Lenovo ThinkPad X1 Carbon 2018-20KGS03900 B140QAN02.0, , 2560x1440, 14" | Dell XPS 13 9370 i7 UHD ID: Sharp SHP148B, Name: LQ133D1, Dell P/N: 8XDHY, , 3840x2160, 13.3" | Huawei Matebook X Pro i5 Tianma XM, , 3000x2000, 13.9" | |
|---|---|---|---|---|---|---|
| Display | -0% | 0% | 1% | -17% | -20% | |
| Display P3 Coverage (%) | 98.5 | 98.6 0% | 99.2 1% | 87.7 -11% | 68.9 -30% | 65.9 -33% |
| sRGB Coverage (%) | 99.9 | 100 0% | 99.9 0% | 100 0% | 98.4 -2% | 95.2 -5% |
| AdobeRGB 1998 Coverage (%) | 87.3 | 86.5 -1% | 87.1 0% | 99.9 14% | 69.5 -20% | 67.6 -23% |
| Response Times | -5% | 9% | -19% | -45% | 16% | |
| Response Time Grey 50% / Grey 80% * (ms) | 46 ? | 48 ? -4% | 42.8 ? 7% | 59.2 ? -29% | 69.6 ? -51% | 40.4 ? 12% |
| Response Time Black / White * (ms) | 32 ? | 33.6 ? -5% | 28.8 ? 10% | 34.4 ? -8% | 44 ? -38% | 25.6 ? 20% |
| PWM Frequency (Hz) | 118000 ? | 119000 ? | 3759 ? | |||
| Screen | 10% | -6% | -11% | -34% | -63% | |
| Brightness middle (cd/m²) | 519 | 551 6% | 588 13% | 578 11% | 478.5 -8% | 442.7 -15% |
| Brightness (cd/m²) | 504 | 514 2% | 561 11% | 533 6% | 466 -8% | 428 -15% |
| Brightness Distribution (%) | 95 | 88 -7% | 92 -3% | 84 -12% | 86 -9% | 84 -12% |
| Black Level * (cd/m²) | 0.33 | 0.48 -45% | 0.45 -36% | 0.38 -15% | 0.43 -30% | 0.31 6% |
| Contrast (:1) | 1573 | 1148 -27% | 1307 -17% | 1521 -3% | 1113 -29% | 1428 -9% |
| Colorchecker dE 2000 * | 1.4 | 0.8 43% | 1.7 -21% | 1.9 -36% | 3.09 -121% | 2.24 -60% |
| Colorchecker dE 2000 max. * | 2.8 | 1.4 50% | 3.5 -25% | 3.8 -36% | 5.94 -112% | 7.19 -157% |
| Greyscale dE 2000 * | 2.2 | 1 55% | 1.9 14% | 3 -36% | 2.4 -9% | 9.7 -341% |
| Gamma | 2.22 99% | 2.16 102% | 2.33 94% | 2.14 103% | 2.063 107% | 1.42 155% |
| CCT | 6908 94% | 6672 97% | 6738 96% | 6377 102% | 6883 94% | 6227 104% |
| Color Space (Percent of AdobeRGB 1998) (%) | 77.3 | 77.92 1% | 88.8 15% | 69.47 -10% | 61.6 -20% | |
| Color Space (Percent of sRGB) (%) | 99.99 | 99.94 0% | 100 0% | 98.36 -2% | 95 -5% | |
| Colorchecker dE 2000 calibrated * | 0.8 | 2.06 | 1.11 | |||
| Média Total (Programa/Configurações) | 2% /
5% | 1% /
-3% | -10% /
-9% | -32% /
-32% | -22% /
-44% |
* ... menor é melhor
Cinebench R15 CPU Multi 64-bit macOS

O suporte para o recurso TrueTone é certamente uma boa adição, mas o componente mais importante da atualização do MBP 13 2018 é o novo processador quad-core. Os resultados após os nossos benchmarks iniciais são, no entanto, preocupantes e ficam aquém das nossas expectativas. O chip Coffee Lake-U consome mais energia que os processadores Kaby Lake-R e o MacBook Pro 13 atinge o limite de temperatura da CPU após alguns segundos. A vantagem de desempenho parece estar limitada ao adaptador gráfico integrado, mas vamos verificar isso cuidadosamente nos próximos dias.
Price comparison
