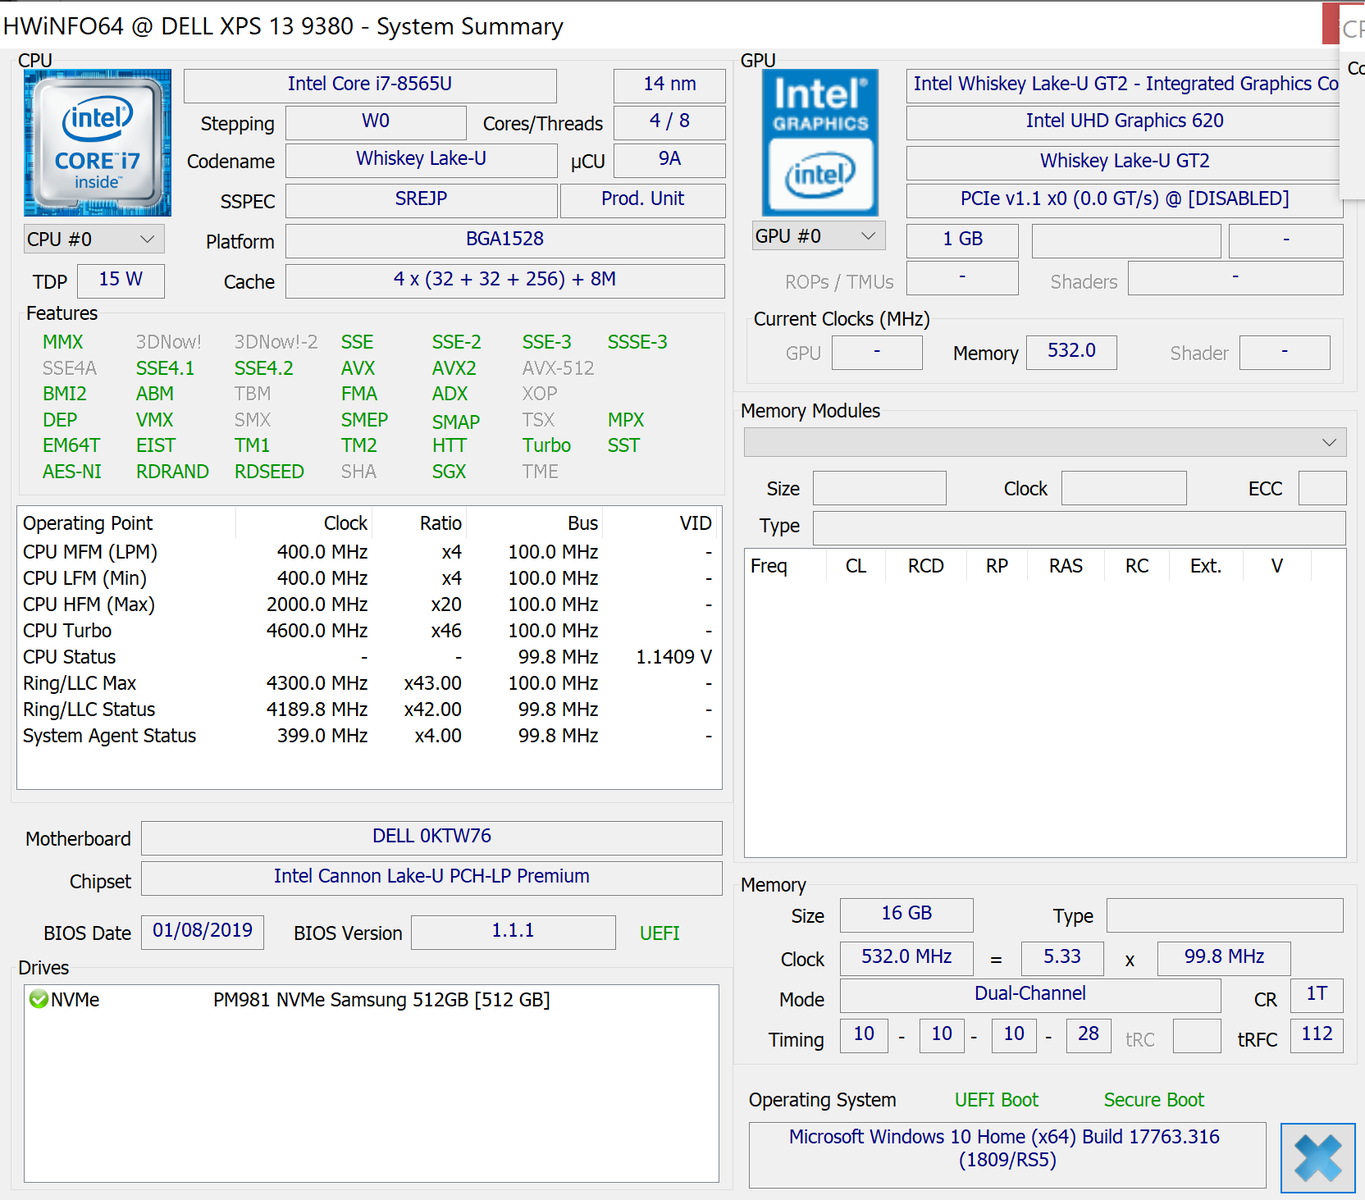
Breve Análise do Portátil Dell XPS 13 9380 (i7-8565U, 4K UHD)
| SD Card Reader | |
| average JPG Copy Test (av. of 3 runs) | |
| Dell XPS 15 9570 Core i9 UHD (Toshiba Exceria Pro SDXC 64 GB UHS-II) | |
| Dell XPS 13 9380 i7 4K (Toshiba Exceria Pro M501 64 GB UHS-II) | |
| HP Spectre x360 15-ch011nr (Toshiba Exceria Pro SDXC 64 GB UHS-II) | |
| Samsung Notebook 9 NP930QAA (Toshiba Exceria Pro M501 microSDXC 64GB) | |
| Asus ZenBook 13 UX333FA (Toshiba Exceria Pro M501 microSDXC 64GB) | |
| maximum AS SSD Seq Read Test (1GB) | |
| HP Spectre x360 15-ch011nr (Toshiba Exceria Pro SDXC 64 GB UHS-II) | |
| Dell XPS 15 9570 Core i9 UHD (Toshiba Exceria Pro SDXC 64 GB UHS-II) | |
| Dell XPS 13 9380 i7 4K (Toshiba Exceria Pro M501 64 GB UHS-II) | |
| Samsung Notebook 9 NP930QAA (Toshiba Exceria Pro M501 microSDXC 64GB) | |
| Asus ZenBook 13 UX333FA (Toshiba Exceria Pro M501 microSDXC 64GB) | |
| |||||||||||||||||||||||||
iluminação: 88 %
iluminação com acumulador: 370.2 cd/m²
Contraste: 1586:1 (Preto: 0.27 cd/m²)
ΔE ColorChecker Calman: 2.69 | ∀{0.5-29.43 Ø4.71}
calibrated: 2.01
ΔE Greyscale Calman: 3.7 | ∀{0.09-98 Ø4.96}
93.5% sRGB (Argyll 1.6.3 3D)
60.4% AdobeRGB 1998 (Argyll 1.6.3 3D)
65.8% AdobeRGB 1998 (Argyll 3D)
93.6% sRGB (Argyll 3D)
64.8% Display P3 (Argyll 3D)
Gamma: 2.1
CCT: 6706 K
| Dell XPS 13 9380 i7 4K ID: AUO 282B B133ZAN Dell: 90NTH, IPS, 13.3", 3840x2160 | Apple MacBook Pro 13 2018 Touchbar i5 APPA03E, IPS, 13.3", 2560x1600 | Asus ZenBook 13 UX333FA AU Optronics B133HAN05.C, IPS, 13.3", 1920x1080 | Dell XPS 13 9370 i7 UHD ID: Sharp SHP148B, Name: LQ133D1, Dell P/N: 8XDHY, IPS, 13.3", 3840x2160 | Dell XPS 13 9370 FHD i5 SHP1484, IPS, 13.3", 1920x1080 | Huawei MateBook 13 i7 Chi Mei CMN8201, IPS, 13", 2160x1440 | |
|---|---|---|---|---|---|---|
| Display | 31% | 5% | 6% | 5% | 5% | |
| Display P3 Coverage (%) | 64.8 | 98.5 52% | 67.9 5% | 68.9 6% | 68.9 6% | 68.1 5% |
| sRGB Coverage (%) | 93.6 | 99.9 7% | 97.4 4% | 98.4 5% | 96.6 3% | 97.7 4% |
| AdobeRGB 1998 Coverage (%) | 65.8 | 87.3 33% | 69.2 5% | 69.5 6% | 69.6 6% | 69.2 5% |
| Response Times | 23% | 9% | -12% | -8% | 25% | |
| Response Time Grey 50% / Grey 80% * (ms) | 64.8 ? | 46 ? 29% | 54.4 ? 16% | 69.6 ? -7% | 62.4 ? 4% | 43.2 ? 33% |
| Response Time Black / White * (ms) | 38 ? | 32 ? 16% | 37.6 ? 1% | 44 ? -16% | 45.6 ? -20% | 32 ? 16% |
| PWM Frequency (Hz) | 118000 ? | 3759 ? | 1008 ? | |||
| Screen | 21% | -19% | -2% | -6% | -8% | |
| Brightness middle (cd/m²) | 428.3 | 519 21% | 276 -36% | 478.5 12% | 428 0% | 366.6 -14% |
| Brightness (cd/m²) | 414 | 504 22% | 263 -36% | 466 13% | 405 -2% | 360 -13% |
| Brightness Distribution (%) | 88 | 95 8% | 89 1% | 86 -2% | 87 -1% | 93 6% |
| Black Level * (cd/m²) | 0.27 | 0.33 -22% | 0.21 22% | 0.43 -59% | 0.26 4% | 0.39 -44% |
| Contrast (:1) | 1586 | 1573 -1% | 1314 -17% | 1113 -30% | 1646 4% | 940 -41% |
| Colorchecker dE 2000 * | 2.69 | 1.4 48% | 4.85 -80% | 3.09 -15% | 3.8 -41% | 2.76 -3% |
| Colorchecker dE 2000 max. * | 6.19 | 2.8 55% | 8.24 -33% | 5.94 4% | 7.2 -16% | 6.19 -0% |
| Colorchecker dE 2000 calibrated * | 2.01 | 1.6 20% | 2.06 -2% | 1.53 24% | ||
| Greyscale dE 2000 * | 3.7 | 2.2 41% | 5.7 -54% | 2.4 35% | 4.4 -19% | 4.2 -14% |
| Gamma | 2.1 105% | 2.22 99% | 2.08 106% | 2.063 107% | 2.21 100% | 2.22 99% |
| CCT | 6706 97% | 6908 94% | 7424 88% | 6883 94% | 7067 92% | 6271 104% |
| Color Space (Percent of AdobeRGB 1998) (%) | 60.4 | 77.3 28% | 63 4% | 69.47 15% | 62.8 4% | 63.2 5% |
| Color Space (Percent of sRGB) (%) | 93.5 | 99.99 7% | 98 5% | 98.36 5% | 96.4 3% | 97.6 4% |
| Média Total (Programa/Configurações) | 25% /
23% | -2% /
-11% | -3% /
-2% | -3% /
-4% | 7% /
-2% |
* ... menor é melhor
Exibir tempos de resposta
| ↔ Tempo de resposta preto para branco | ||
|---|---|---|
| 38 ms ... ascensão ↗ e queda ↘ combinadas | ↗ 19.2 ms ascensão | 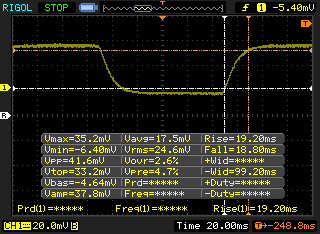 |
| ↘ 18.8 ms queda | ||
| A tela mostra taxas de resposta lentas em nossos testes e será insatisfatória para os jogadores. Em comparação, todos os dispositivos testados variam de 0.1 (mínimo) a 240 (máximo) ms. » 96 % de todos os dispositivos são melhores. Isso significa que o tempo de resposta medido é pior que a média de todos os dispositivos testados (19.8 ms). | ||
| ↔ Tempo de resposta 50% cinza a 80% cinza | ||
| 64.8 ms ... ascensão ↗ e queda ↘ combinadas | ↗ 31.6 ms ascensão | 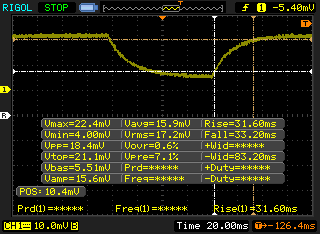 |
| ↘ 33.2 ms queda | ||
| A tela mostra taxas de resposta lentas em nossos testes e será insatisfatória para os jogadores. Em comparação, todos os dispositivos testados variam de 0.165 (mínimo) a 636 (máximo) ms. » 98 % de todos os dispositivos são melhores. Isso significa que o tempo de resposta medido é pior que a média de todos os dispositivos testados (30.9 ms). | ||
Cintilação da tela / PWM (modulação por largura de pulso)
| Tela tremeluzindo / PWM não detectado | 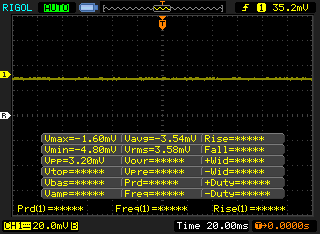 | ||
[pwm_comparison] Em comparação: 52 % de todos os dispositivos testados não usam PWM para escurecer a tela. Se PWM foi detectado, uma média de 7747 (mínimo: 5 - máximo: 343500) Hz foi medida. | |||
| Cinebench R15 | |
| CPU Single 64Bit | |
| Dell XPS 15 9570 Core i9 UHD | |
| Dell XPS 13 9380 i7 4K | |
| Média Intel Core i7-8565U (138.3 - 193, n=51) | |
| Dell G3 15 3579 | |
| Dell XPS 13 9370 i7 UHD | |
| Dell XPS 13 9380 2019 | |
| HP EliteBook 735 G5 3UN62EA | |
| Lenovo ThinkPad 13 20J1005TPB | |
| Dell Latitude 3490 | |
| CPU Multi 64Bit | |
| Dell XPS 15 9570 Core i9 UHD | |
| Dell G3 15 3579 | |
| Dell XPS 13 9380 i7 4K | |
| Dell XPS 13 9380 i7 4K | |
| Dell XPS 13 9380 2019 | |
| Dell Latitude 3490 | |
| HP EliteBook 735 G5 3UN62EA | |
| Dell XPS 13 9370 i7 UHD | |
| Média Intel Core i7-8565U (452 - 815, n=52) | |
| Lenovo ThinkPad 13 20J1005TPB | |
| PCMark 8 Home Score Accelerated v2 | 3296 pontos | |
| PCMark 8 Work Score Accelerated v2 | 4304 pontos | |
| PCMark 10 Score | 4172 pontos | |
Ajuda | ||
| Dell XPS 13 9380 i7 4K Samsung SSD PM981 MZVLB512HAJQ | Samsung Notebook 9 NP930QAA Samsung PM961 MZVLW256HEHP | Asus ZenBook 13 UX333FA WDC PC SN520 SDAPNUW-256G | Huawei MateBook 13 i7 Samsung SSD PM981 MZVLB512HAJQ | Dell XPS 15 9570 Core i9 UHD Samsung SSD PM981 MZVLB1T0HALR | HP Spectre x360 15-ch011nr SK hynix PC401 NVMe 500 GB | |
|---|---|---|---|---|---|---|
| AS SSD | -29% | -40% | -4% | -8% | -34% | |
| Seq Read (MB/s) | 1981 | 1824 -8% | 1186 -40% | 1889 -5% | 1320 -33% | 1739 -12% |
| Seq Write (MB/s) | 1473 | 986 -33% | 809 -45% | 1812 23% | 1500 2% | 1189 -19% |
| 4K Read (MB/s) | 53.3 | 41.84 -22% | 39.69 -26% | 55.5 4% | 30.73 -42% | 38.76 -27% |
| 4K Write (MB/s) | 127.4 | 104.1 -18% | 114 -11% | 118.4 -7% | 94.4 -26% | 93.2 -27% |
| 4K-64 Read (MB/s) | 1179 | 1196 1% | 618 -48% | 1257 7% | 1453 23% | 646 -45% |
| 4K-64 Write (MB/s) | 2105 | 739 -65% | 510 -76% | 1571 -25% | 1815 -14% | 545 -74% |
| Access Time Read * (ms) | 0.036 | 0.061 -69% | 0.068 -89% | 0.041 -14% | 0.061 -69% | 0.054 -50% |
| Access Time Write * (ms) | 0.029 | 0.036 -24% | 0.032 -10% | 0.032 -10% | 0.044 -52% | 0.051 -76% |
| Score Read (Points) | 1430 | 1420 -1% | 776 -46% | 1502 5% | 1616 13% | 859 -40% |
| Score Write (Points) | 2379 | 941 -60% | 705 -70% | 1871 -21% | 2059 -13% | 757 -68% |
| Score Total (Points) | 4526 | 3051 -33% | 1870 -59% | 4147 -8% | 4507 0% | 2037 -55% |
| Copy ISO MB/s (MB/s) | 1294 | 1103 -15% | 1090 -16% | 1800 39% | 2577 99% | 1668 29% |
| Copy Program MB/s (MB/s) | 503 | 541 8% | 714 42% | 385.6 -23% | 515 2% | 486.8 -3% |
| Copy Game MB/s (MB/s) | 1148 | 418.6 -64% | 413 -64% | 982 -14% | 1120 -2% | 1042 -9% |
* ... menor é melhor

| 3DMark - 1280x720 Cloud Gate Standard Graphics | |
| Dell XPS 15 9570 Core i9 UHD | |
| Huawei MateBook 13 i7 | |
| Acer TravelMate X3410-M-50DD | |
| Dell XPS 13 9360 FHD i7 Iris | |
| Dell XPS 13 9380 2019 | |
| Dell XPS 13 9380 i7 4K | |
| Lenovo Ideapad 720S-13ARR | |
| Média Intel UHD Graphics 620 (6205 - 16400, n=225) | |
| Apple MacBook 12 (Early 2016) 1.1 GHz | |
| 3DMark 11 Performance | 2117 pontos | |
| 3DMark Cloud Gate Standard Score | 9160 pontos | |
Ajuda | ||
| baixo | média | alto | ultra | |
|---|---|---|---|---|
| BioShock Infinite (2013) | 81.5 | 39.1 | 32.5 | 10 |
| Dell XPS 13 9380 i7 4K UHD Graphics 620, i7-8565U, Samsung SSD PM981 MZVLB512HAJQ | Huawei Matebook X Pro i5 GeForce MX150, i5-8250U, Samsung PM961 MZVLW256HEHP | Dell XPS 13 9370 i7 UHD UHD Graphics 620, i5-8550U, Toshiba XG5 KXG50ZNV512G | Apple MacBook Pro 13 2018 Touchbar i5 Iris Plus Graphics 655, i5-8259U | Razer Blade Stealth i7-8565U GeForce MX150, i7-8565U, Lite-On CA3-8D256-Q11 | Dell XPS 13 9380 2019 UHD Graphics 620, i5-8265U, SK hynix PC401 HFS256GD9TNG | |
|---|---|---|---|---|---|---|
| Noise | 3% | 5% | -2% | -1% | 2% | |
| desligado / ambiente * (dB) | 28.4 | 27.9 2% | 28 1% | 29.6 -4% | 28.4 -0% | 30.4 -7% |
| Idle Minimum * (dB) | 29.4 | 27.9 5% | 28 5% | 29.6 -1% | 28.5 3% | 30.4 -3% |
| Idle Average * (dB) | 29.4 | 27.9 5% | 28 5% | 29.6 -1% | 29 1% | 30.4 -3% |
| Idle Maximum * (dB) | 29.4 | 27.9 5% | 28 5% | 29.6 -1% | 29.1 1% | 30.4 -3% |
| Load Average * (dB) | 34.6 | 36.2 -5% | 32.5 6% | 36.7 -6% | 42.8 -24% | 31.7 8% |
| Load Maximum * (dB) | 46.8 | 45.2 3% | 42.2 10% | 46.7 -0% | 41.6 11% | 38.1 19% |
| Witcher 3 ultra * (dB) | 45 | 32.5 | 41.4 |
* ... menor é melhor
Barulho
| Ocioso |
| 29.4 / 29.4 / 29.4 dB |
| Carga |
| 34.6 / 46.8 dB |
 | ||
30 dB silencioso 40 dB(A) audível 50 dB(A) ruidosamente alto |
||
min: | ||
(-) A temperatura máxima no lado superior é 46.2 °C / 115 F, em comparação com a média de 35.9 °C / 97 F , variando de 21.4 a 59 °C para a classe Subnotebook.
(-) A parte inferior aquece até um máximo de 46.2 °C / 115 F, em comparação com a média de 39.2 °C / 103 F
(+) Em uso inativo, a temperatura média para o lado superior é 23.3 °C / 74 F, em comparação com a média do dispositivo de 30.8 °C / ### class_avg_f### F.
(+) Os apoios para as mãos e o touchpad são mais frios que a temperatura da pele, com um máximo de 26 °C / 78.8 F e, portanto, são frios ao toque.
(+) A temperatura média da área do apoio para as mãos de dispositivos semelhantes foi 28.2 °C / 82.8 F (+2.2 °C / 4 F).
Dell XPS 13 9380 i7 4K análise de áudio
(±) | o volume do alto-falante é médio, mas bom (###valor### dB)
Graves 100 - 315Hz
(-) | quase nenhum baixo - em média 18.5% menor que a mediana
(±) | a linearidade dos graves é média (8.1% delta para a frequência anterior)
Médios 400 - 2.000 Hz
(±) | médios mais altos - em média 7.7% maior que a mediana
(±) | a linearidade dos médios é média (11.5% delta para frequência anterior)
Altos 2 - 16 kHz
(±) | máximos mais altos - em média 6.2% maior que a mediana
(±) | a linearidade dos máximos é média (10.5% delta para frequência anterior)
Geral 100 - 16.000 Hz
(±) | a linearidade do som geral é média (28.5% diferença em relação à mediana)
Comparado com a mesma classe
» 90% de todos os dispositivos testados nesta classe foram melhores, 2% semelhantes, 7% piores
» O melhor teve um delta de 5%, a média foi 18%, o pior foi 53%
Comparado com todos os dispositivos testados
» 86% de todos os dispositivos testados foram melhores, 3% semelhantes, 11% piores
» O melhor teve um delta de 4%, a média foi 23%, o pior foi 134%
Apple MacBook 12 (Early 2016) 1.1 GHz análise de áudio
(+) | os alto-falantes podem tocar relativamente alto (###valor### dB)
Graves 100 - 315Hz
(±) | graves reduzidos - em média 11.3% menor que a mediana
(±) | a linearidade dos graves é média (14.2% delta para a frequência anterior)
Médios 400 - 2.000 Hz
(+) | médios equilibrados - apenas 2.4% longe da mediana
(+) | médios são lineares (5.5% delta para frequência anterior)
Altos 2 - 16 kHz
(+) | agudos equilibrados - apenas 2% longe da mediana
(+) | os máximos são lineares (4.5% delta da frequência anterior)
Geral 100 - 16.000 Hz
(+) | o som geral é linear (10.2% diferença em relação à mediana)
Comparado com a mesma classe
» 7% de todos os dispositivos testados nesta classe foram melhores, 2% semelhantes, 90% piores
» O melhor teve um delta de 5%, a média foi 18%, o pior foi 53%
Comparado com todos os dispositivos testados
» 5% de todos os dispositivos testados foram melhores, 1% semelhantes, 94% piores
» O melhor teve um delta de 4%, a média foi 23%, o pior foi 134%
| desligado | |
| Ocioso | |
| Carga |
|
Key:
min: | |
| Dell XPS 13 9380 i7 4K i7-8565U, UHD Graphics 620, Samsung SSD PM981 MZVLB512HAJQ, IPS, 3840x2160, 13.3" | Samsung Notebook 9 NP930QAA i5-8550U, UHD Graphics 620, Samsung PM961 MZVLW256HEHP, IPS, 1920x1080, 13.3" | Asus ZenBook 13 UX333FA i5-8265U, UHD Graphics 620, WDC PC SN520 SDAPNUW-256G, IPS, 1920x1080, 13.3" | Dell XPS 13 9370 i7 UHD i5-8550U, UHD Graphics 620, Toshiba XG5 KXG50ZNV512G, IPS, 3840x2160, 13.3" | Huawei MateBook 13 i7 i7-8565U, GeForce MX150, Samsung SSD PM981 MZVLB512HAJQ, IPS, 2160x1440, 13" | Apple MacBook Pro 13 2018 Touchbar i5 i5-8259U, Iris Plus Graphics 655, , IPS, 2560x1600, 13.3" | |
|---|---|---|---|---|---|---|
| Power Consumption | -8% | 33% | 3% | -11% | -3% | |
| Idle Minimum * (Watt) | 5.2 | 4.4 15% | 1.6 69% | 5 4% | 3.5 33% | 2.3 56% |
| Idle Average * (Watt) | 8.6 | 11.8 -37% | 4.6 47% | 8.3 3% | 7.5 13% | 8.7 -1% |
| Idle Maximum * (Watt) | 10.5 | 15.5 -48% | 7.3 30% | 8.8 16% | 12.4 -18% | 12.2 -16% |
| Load Average * (Watt) | 44.2 | 38 14% | 37.9 14% | 46.4 -5% | 64.2 -45% | 53.3 -21% |
| Load Maximum * (Watt) | 47.5 | 39.8 16% | 44.8 6% | 48.6 -2% | 65.7 -38% | 64 -35% |
| Witcher 3 ultra * (Watt) | 52.5 |
* ... menor é melhor
| Dell XPS 13 9380 i7 4K i7-8565U, UHD Graphics 620, 52 Wh | Asus ZenBook 13 UX333FA i5-8265U, UHD Graphics 620, 50 Wh | Huawei MateBook 13 i7 i7-8565U, GeForce MX150, 41.7 Wh | Apple MacBook Pro 13 2018 Touchbar i5 i5-8259U, Iris Plus Graphics 655, 58 Wh | Dell XPS 13 9370 i7 UHD i5-8550U, UHD Graphics 620, 52 Wh | Samsung Notebook 9 NP930QAA i5-8550U, UHD Graphics 620, 39 Wh | |
|---|---|---|---|---|---|---|
| Duração da bateria | 29% | -1% | 26% | 1% | -14% | |
| WiFi v1.3 (h) | 7.7 | 9.9 29% | 7.6 -1% | 9.7 26% | 7.8 1% | 6.6 -14% |
| Reader / Idle (h) | 27.8 | 15.4 | 13.7 | 14.6 | ||
| Load (h) | 2.2 | 0.9 | 1.8 | 1.2 | ||
| Witcher 3 ultra (h) | 1.6 |
Pro
Contra
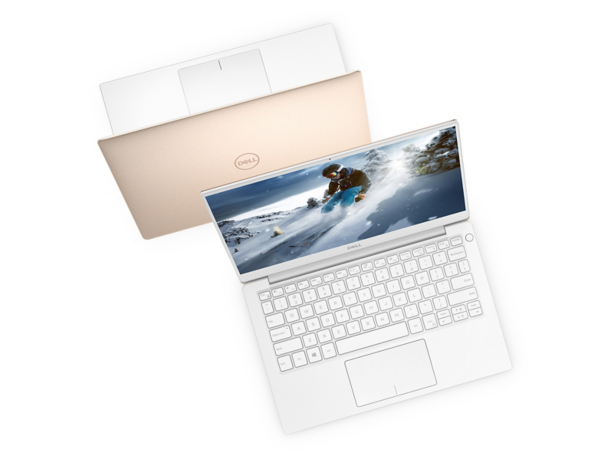
O XPS 13 9380 é um subportátil sólido que atende diretamente às reclamações de webcam das séries 9360 e 9370. Tudo o que gostamos e não gostamos sobre a série 9370permanece em vigor aqui. Em vez disso, estamos interessados em responder a pergunta: Será que o SKU Core i7 vale a pena sobre o SKU Core i5?
Optar pela configuração do Core i7 trará um aumento de desempenho médio de apenas 10% em relação à configuração do Core i5, por $ 250 a mais. Isso não teria sido tão ruim se a Dell também tivesse dobrado a memória RAM e/ou o armazenamento entre os dois preços, mas esse não é o caso. É altamente recomendável optar pelo SKU Core i5 e, em seguida, investir em uma garantia mais longa ou mais RAM, se possível.
Os usuários que preferirem o SKU Core i7, de qualquer maneira, perceberão que a duração da bateria e as temperaturas não são tão diferentes quando comparadas ao SKU Core i5. O ruído do ventilador é mais alto, embora isso só se torne aparente quando sob cargas mais altas. Assim, o pequeno aumento no desempenho da CPU, felizmente, não apresenta grandes desvantagens.
A configuração XPS 13 mais cara é mais rápida do que a configuração de gama média, mas o delta é relativamente pequeno, em contraste com o diferencial de preço entre os dois SKUs. Recomendamos investir esses dólares em atributos mais tangíveis para o sistema, como memória RAM adicional, armazenamento ou a tela táctil 4K UHD.
Dell XPS 13 9380 i7 4K
- 03/12/2019 v6 (old)
Allen Ngo
Price comparison
