Breve Análise do Portátil Lenovo ThinkBook 15: Um dispositivo de escritório acessível com um processador Comet Lake
Avaliação | Data | Modelo | Peso | Altura | Size | Resolução | Preço |
|---|---|---|---|---|---|---|---|
| 81.8 % v7 (old) | 02/2020 | Lenovo ThinkBook 15 i5-10210U, UHD Graphics 620 | 1.9 kg | 18.9 mm | 15.60" | 1920x1080 | |
| 88.4 % v6 (old) | 10/2024 | Lenovo ThinkPad E595-20NF0000GE R7 3700U, Vega 10 | 1.9 kg | 19.9 mm | 15.60" | 1920x1080 | |
| 83.2 % v7 (old) | 11/2019 | Lenovo ThinkPad L590-20Q70019GE i5-8265U, UHD Graphics 620 | 2 kg | 23 mm | 15.60" | 1920x1080 | |
| 82.1 % v7 (old) | Schenker Slim 15 L19 i5-10210U, UHD Graphics 620 | 1.6 kg | 19.9 mm | 15.60" | 1920x1080 | ||
| 84.6 % v6 (old) | 03/2019 | HP ProBook 450 G6-5TJ93EA i7-8565U, GeForce MX130 | 2 kg | 20 mm | 15.60" | 1920x1080 | |
| 79.6 % v6 (old) | Dell Latitude 15 3590 i5-8250U, UHD Graphics 620 | 2.1 kg | 22 mm | 15.60" | 1920x1080 |


| SD Card Reader | |
| average JPG Copy Test (av. of 3 runs) | |
| Lenovo ThinkBook 15 (Toshiba Exceria Pro SDXC 64 GB UHS-II) | |
| Lenovo ThinkPad E595-20NF0000GE (Toshiba Exceria Pro M501 64 GB UHS-II) | |
| HP ProBook 450 G6-5TJ93EA (Toshiba Exceria Pro SDXC 64 GB UHS-II) | |
| Lenovo ThinkPad L590-20Q70019GE (Toshiba Exceria Pro M501 64 GB UHS-II) | |
| Schenker Slim 15 L19 (Toshiba Exceria Pro SDXC 64 GB UHS-II) | |
| Média da turma Office (19.8 - 198.5, n=22, últimos 2 anos) | |
| Dell Latitude 15 3590 (Toshiba Exceria Pro SDXC 64 GB UHS-II) | |
| maximum AS SSD Seq Read Test (1GB) | |
| Lenovo ThinkPad E595-20NF0000GE (Toshiba Exceria Pro M501 64 GB UHS-II) | |
| Lenovo ThinkBook 15 (Toshiba Exceria Pro SDXC 64 GB UHS-II) | |
| Lenovo ThinkPad L590-20Q70019GE (Toshiba Exceria Pro M501 64 GB UHS-II) | |
| Schenker Slim 15 L19 (Toshiba Exceria Pro SDXC 64 GB UHS-II) | |
| HP ProBook 450 G6-5TJ93EA (Toshiba Exceria Pro SDXC 64 GB UHS-II) | |
| Média da turma Office (27.4 - 249, n=21, últimos 2 anos) | |
| Dell Latitude 15 3590 (Toshiba Exceria Pro SDXC 64 GB UHS-II) | |
| Networking | |
| iperf3 transmit AX12 | |
| Schenker Slim 15 L19 | |
| Lenovo ThinkBook 15 | |
| HP ProBook 450 G6-5TJ93EA | |
| Lenovo ThinkPad L590-20Q70019GE | |
| Lenovo ThinkPad E595-20NF0000GE | |
| Dell Latitude 15 3590 | |
| iperf3 receive AX12 | |
| Schenker Slim 15 L19 | |
| Lenovo ThinkBook 15 | |
| Lenovo ThinkPad E595-20NF0000GE | |
| HP ProBook 450 G6-5TJ93EA | |
| Lenovo ThinkPad L590-20Q70019GE | |
| Dell Latitude 15 3590 | |
| |||||||||||||||||||||||||
iluminação: 82 %
iluminação com acumulador: 245 cd/m²
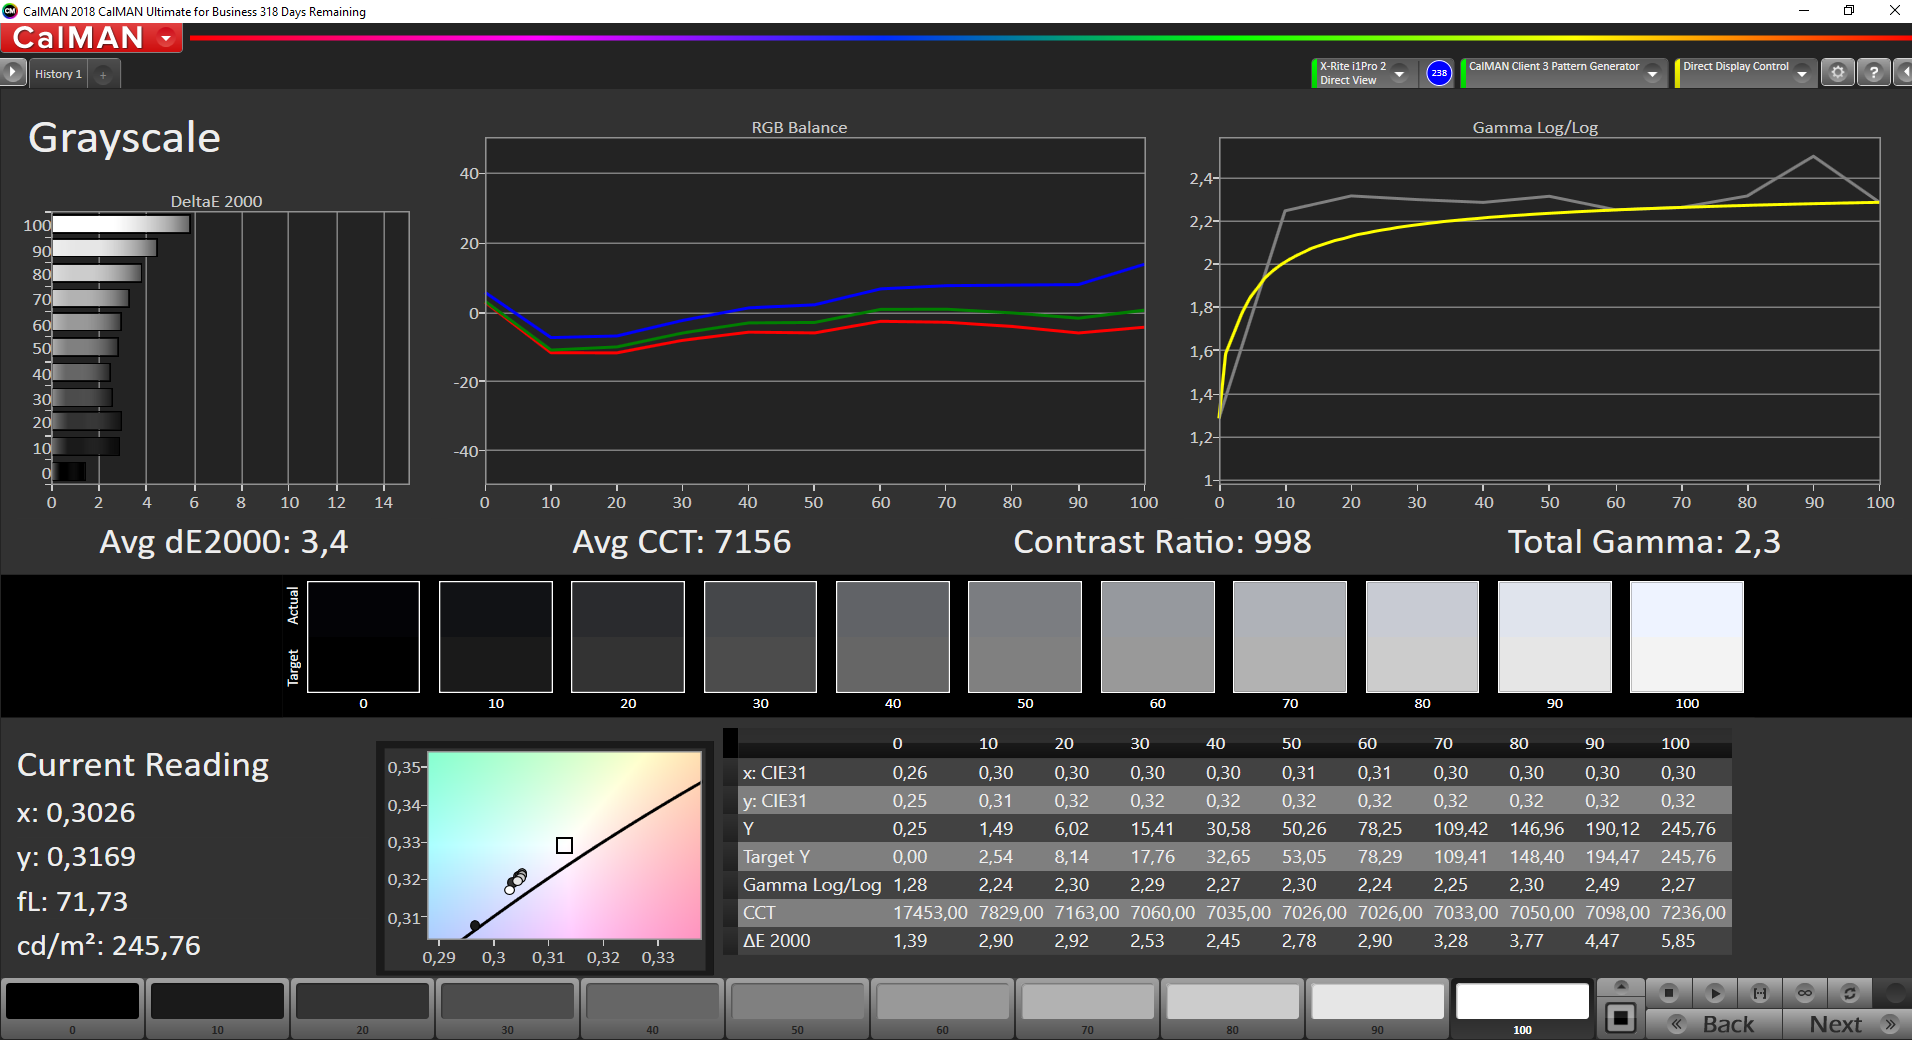
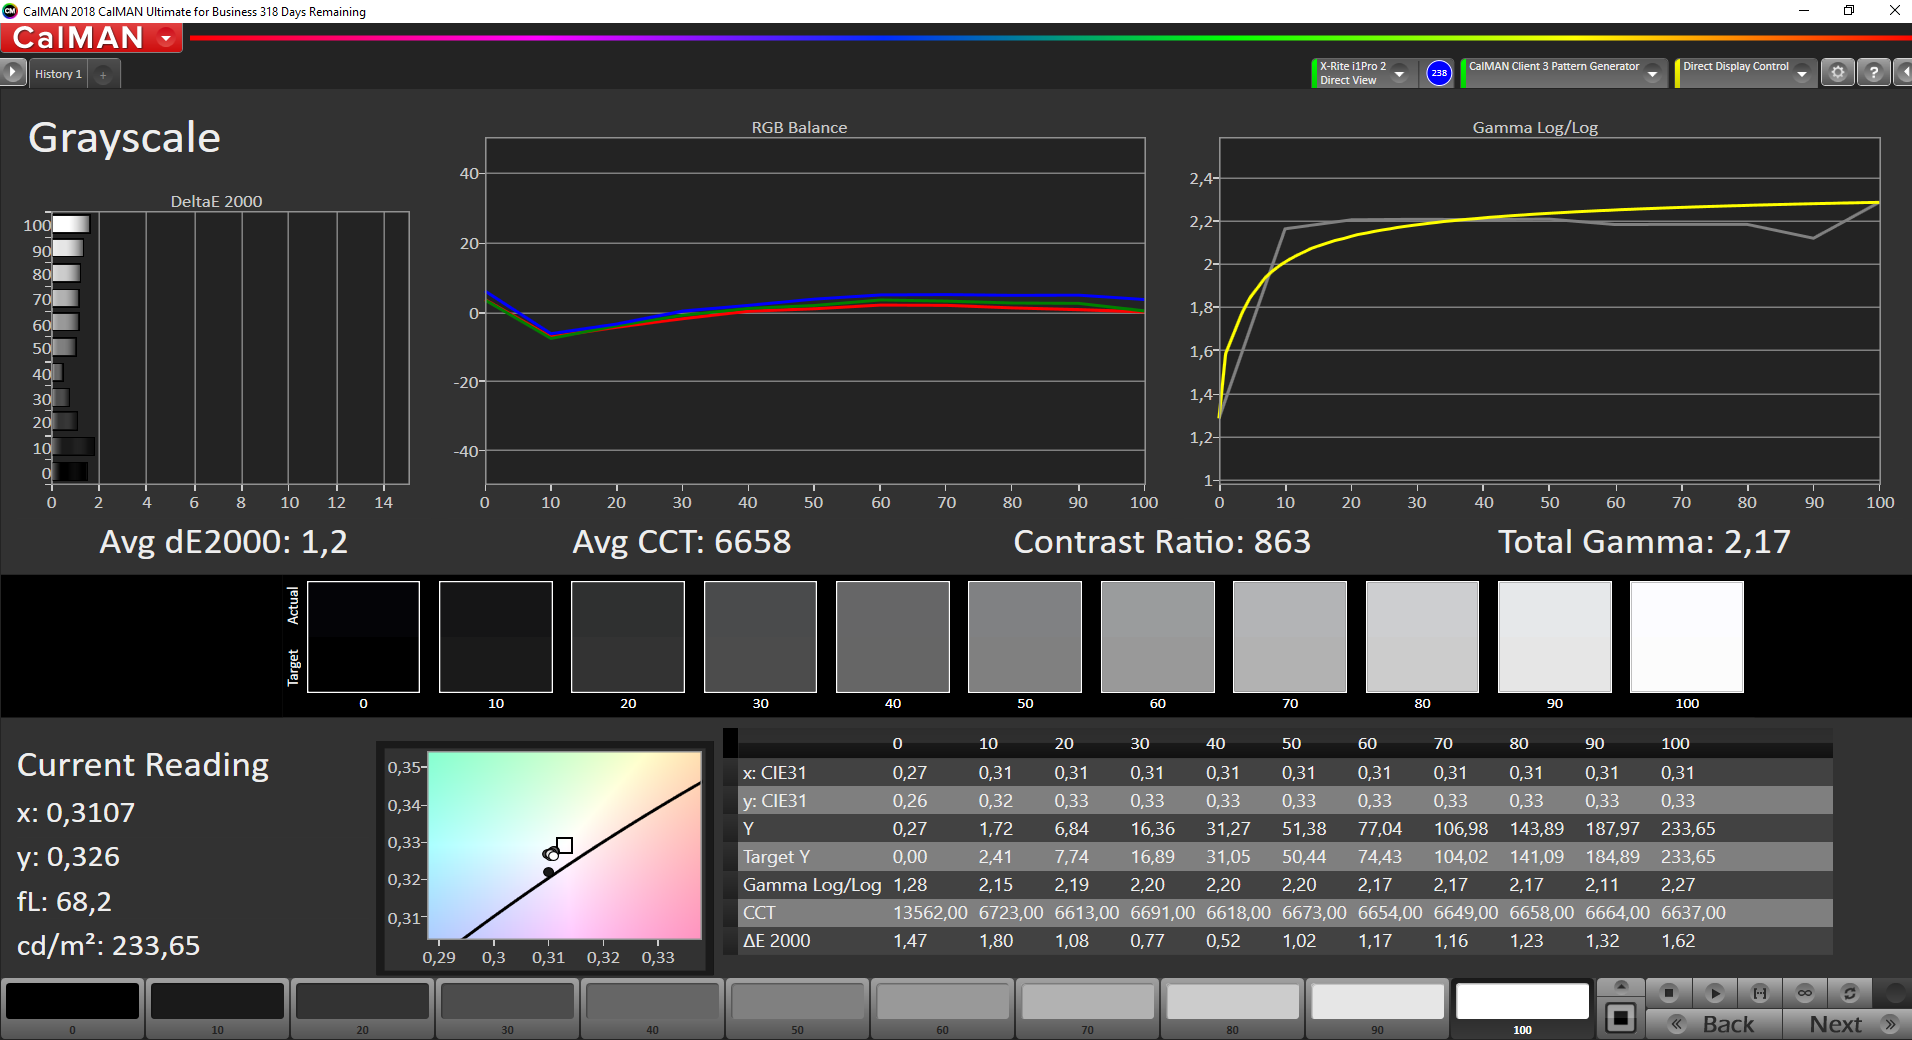
Contraste: 980:1 (Preto: 0.25 cd/m²)
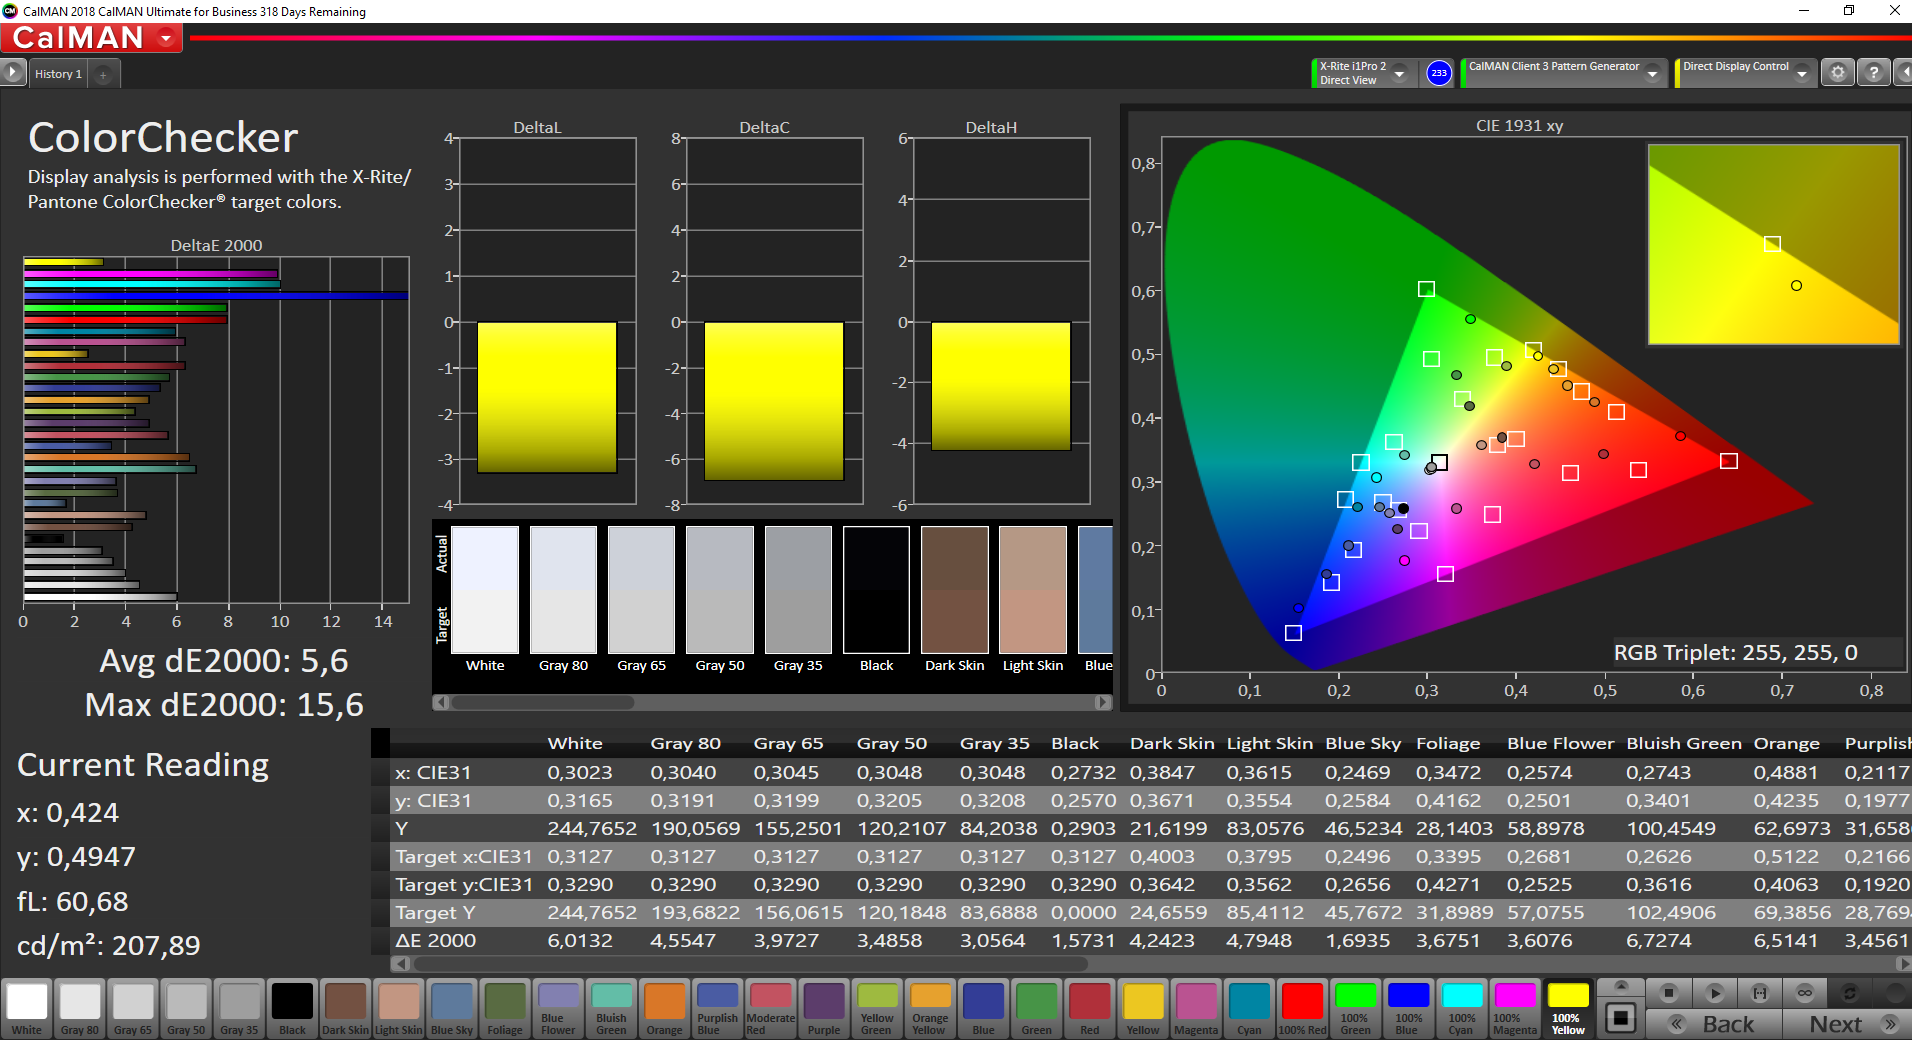
ΔE ColorChecker Calman: 5.6 | ∀{0.5-29.43 Ø4.72}
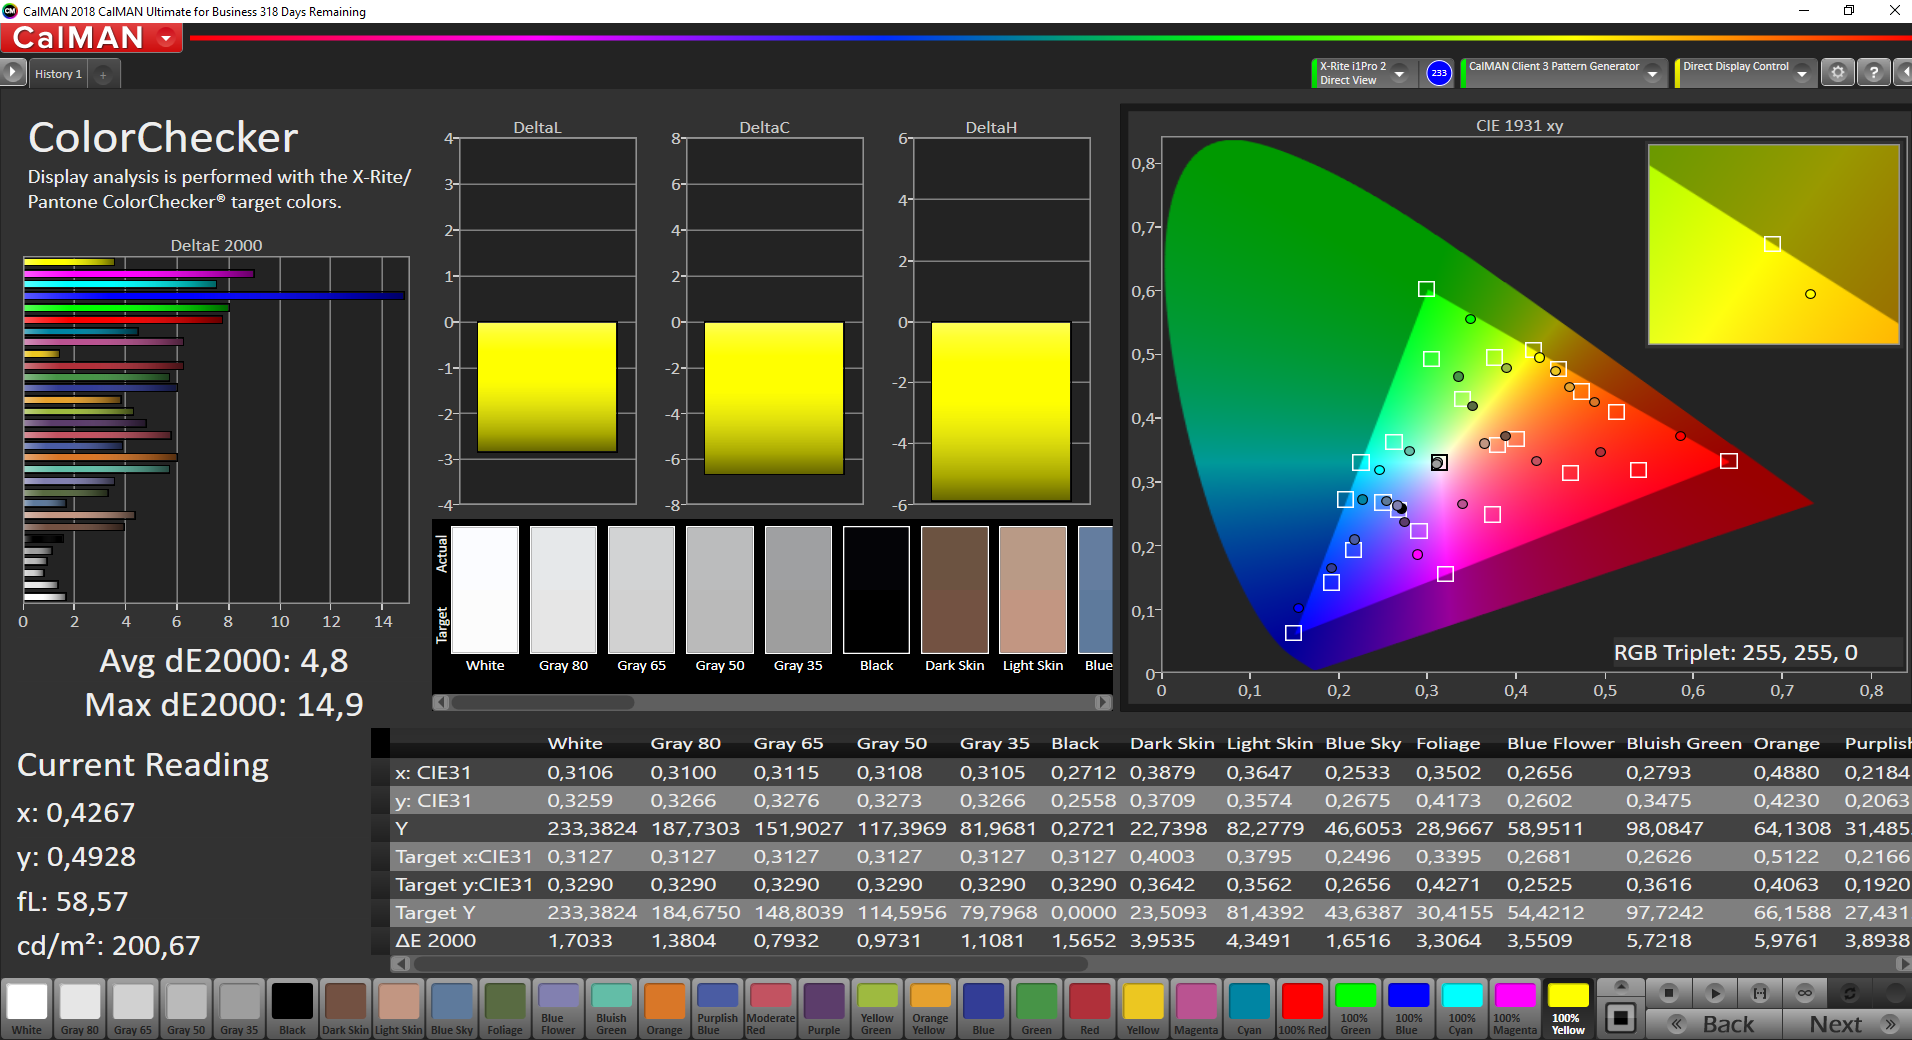
calibrated: 4.8
ΔE Greyscale Calman: 3.4 | ∀{0.09-98 Ø4.97}
57.5% sRGB (Argyll 1.6.3 3D)
36.5% AdobeRGB 1998 (Argyll 1.6.3 3D)
39.67% AdobeRGB 1998 (Argyll 3D)
57.7% sRGB (Argyll 3D)
38.38% Display P3 (Argyll 3D)
Gamma: 2.3
CCT: 7156 K
| Lenovo ThinkBook 15 LP156WFC-SPD1, IPS, 1920x1080, 15.6" | Lenovo ThinkPad E595-20NF0000GE NV156FHM-N49, IPS, 1920x1080, 15.6" | Lenovo ThinkPad L590-20Q70019GE N156HCE-EAA, IPS, 1920x1080, 15.6" | Schenker Slim 15 L19 BOE CQ NV156FHM-N61, , 1920x1080, 15.6" | HP ProBook 450 G6-5TJ93EA Chi Mei CMN15FE, IPS, 1920x1080, 15.6" | Dell Latitude 15 3590 BOE0802 / NT15N41 / Dell: M9P74, TN LED, 1920x1080, 15.6" | |
|---|---|---|---|---|---|---|
| Display | 3% | 13% | 62% | 12% | 3% | |
| Display P3 Coverage (%) | 38.38 | 39.88 4% | 43.3 13% | 66.8 74% | 42.83 12% | 39.67 3% |
| sRGB Coverage (%) | 57.7 | 58.6 2% | 64.4 12% | 87.1 51% | 64.2 11% | 59.7 3% |
| AdobeRGB 1998 Coverage (%) | 39.67 | 41.2 4% | 44.81 13% | 63.7 61% | 44.29 12% | 40.99 3% |
| Response Times | -14% | -12% | -16% | 11% | 24% | |
| Response Time Grey 50% / Grey 80% * (ms) | 37.6 ? | 41.2 ? -10% | 42.8 ? -14% | 45 ? -20% | 34.4 ? 9% | 41 ? -9% |
| Response Time Black / White * (ms) | 28 ? | 32.8 ? -17% | 30.8 ? -10% | 31 ? -11% | 24.4 ? 13% | 12 ? 57% |
| PWM Frequency (Hz) | 1220 ? | 24510 ? | 250 ? | 26040 ? | 250 ? | |
| Screen | 18% | -1% | 13% | 8% | -40% | |
| Brightness middle (cd/m²) | 245 | 318 30% | 247 1% | 315 29% | 242 -1% | 215 -12% |
| Brightness (cd/m²) | 239 | 297 24% | 228 -5% | 294 23% | 226 -5% | 214 -10% |
| Brightness Distribution (%) | 82 | 89 9% | 81 -1% | 83 1% | 88 7% | 91 11% |
| Black Level * (cd/m²) | 0.25 | 0.17 32% | 0.18 28% | 0.29 -16% | 0.21 16% | 0.385 -54% |
| Contrast (:1) | 980 | 1871 91% | 1372 40% | 1086 11% | 1152 18% | 558 -43% |
| Colorchecker dE 2000 * | 5.6 | 5.5 2% | 5.9 -5% | 6 -7% | 4.7 16% | 10.31 -84% |
| Colorchecker dE 2000 max. * | 15.6 | 21 -35% | 22.9 -47% | 10.2 35% | 18.5 -19% | 20.44 -31% |
| Colorchecker dE 2000 calibrated * | 4.8 | 5.1 -6% | 4.7 2% | 3.1 35% | 4 17% | 3.88 19% |
| Greyscale dE 2000 * | 3.4 | 1.8 47% | 5.1 -50% | 6 -76% | 2.7 21% | 11.84 -248% |
| Gamma | 2.3 96% | 2.12 104% | 2.21 100% | 2.16 102% | 2.26 97% | 2.67 82% |
| CCT | 7156 91% | 6257 104% | 6398 102% | 8038 81% | 6442 101% | 13398 49% |
| Color Space (Percent of AdobeRGB 1998) (%) | 36.5 | 37.6 3% | 41.2 13% | 57 56% | 40.8 12% | 39 7% |
| Color Space (Percent of sRGB) (%) | 57.5 | 58.2 1% | 64.1 11% | 87 51% | 64 11% | 61 6% |
| Média Total (Programa/Configurações) | 2% /
11% | 0% /
0% | 20% /
19% | 10% /
9% | -4% /
-24% |
* ... menor é melhor

Exibir tempos de resposta
| ↔ Tempo de resposta preto para branco | ||
|---|---|---|
| 28 ms ... ascensão ↗ e queda ↘ combinadas | ↗ 16.4 ms ascensão | 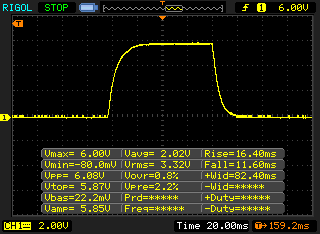 |
| ↘ 11.6 ms queda | ||
| A tela mostra taxas de resposta relativamente lentas em nossos testes e pode ser muito lenta para os jogadores. Em comparação, todos os dispositivos testados variam de 0.1 (mínimo) a 240 (máximo) ms. » 71 % de todos os dispositivos são melhores. Isso significa que o tempo de resposta medido é pior que a média de todos os dispositivos testados (19.8 ms). | ||
| ↔ Tempo de resposta 50% cinza a 80% cinza | ||
| 37.6 ms ... ascensão ↗ e queda ↘ combinadas | ↗ 19.6 ms ascensão | 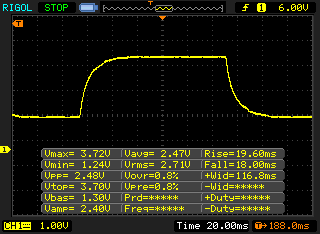 |
| ↘ 18 ms queda | ||
| A tela mostra taxas de resposta lentas em nossos testes e será insatisfatória para os jogadores. Em comparação, todos os dispositivos testados variam de 0.165 (mínimo) a 636 (máximo) ms. » 54 % de todos os dispositivos são melhores. Isso significa que o tempo de resposta medido é pior que a média de todos os dispositivos testados (31 ms). | ||
Cintilação da tela / PWM (modulação por largura de pulso)
| Tela tremeluzindo / PWM não detectado | 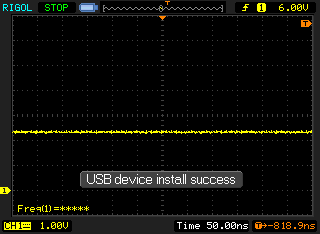 | ||
[pwm_comparison] Em comparação: 52 % de todos os dispositivos testados não usam PWM para escurecer a tela. Se PWM foi detectado, uma média de 7781 (mínimo: 5 - máximo: 343500) Hz foi medida. | |||
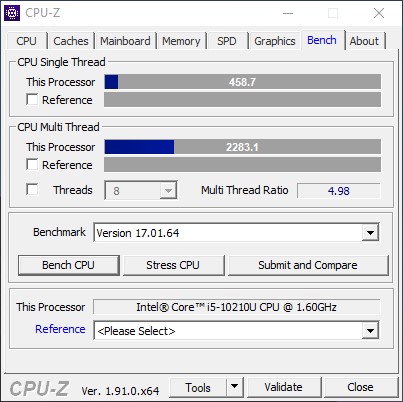
| Cinebench R15 | |
| CPU Single 64Bit | |
| Média da turma Office (99.5 - 312, n=75, últimos 2 anos) | |
| Schenker Slim 15 L19 | |
| Média Intel Core i5-10210U (134 - 174, n=35) | |
| Lenovo ThinkBook 15 | |
| Lenovo ThinkPad L590-20Q70019GE | |
| Dell Latitude 15 3590 | |
| Lenovo ThinkPad E595-20NF0000GE | |
| HP ProBook 450 G6-5TJ93EA | |
| CPU Multi 64Bit | |
| Média da turma Office (250 - 3380, n=75, últimos 2 anos) | |
| Schenker Slim 15 L19 | |
| Lenovo ThinkBook 15 | |
| Lenovo ThinkPad E595-20NF0000GE | |
| Média Intel Core i5-10210U (320 - 790, n=35) | |
| Dell Latitude 15 3590 | |
| Dell Latitude 15 3590 | |
| HP ProBook 450 G6-5TJ93EA | |
| Lenovo ThinkPad L590-20Q70019GE | |
* ... menor é melhor
| PCMark 8 | |
| Home Score Accelerated v2 | |
| Média da turma Office (n=1últimos 2 anos) | |
| Lenovo ThinkBook 15 | |
| Média Intel Core i5-10210U, Intel UHD Graphics 620 (3182 - 4284, n=21) | |
| Dell Latitude 15 3590 | |
| HP ProBook 450 G6-5TJ93EA | |
| Lenovo ThinkPad E595-20NF0000GE | |
| Lenovo ThinkPad L590-20Q70019GE | |
| Work Score Accelerated v2 | |
| Média da turma Office (n=1últimos 2 anos) | |
| Lenovo ThinkBook 15 | |
| HP ProBook 450 G6-5TJ93EA | |
| Média Intel Core i5-10210U, Intel UHD Graphics 620 (4286 - 5114, n=21) | |
| Dell Latitude 15 3590 | |
| Lenovo ThinkPad E595-20NF0000GE | |
| Lenovo ThinkPad L590-20Q70019GE | |
| PCMark 8 Home Score Accelerated v2 | 4227 pontos | |
| PCMark 8 Creative Score Accelerated v2 | 5312 pontos | |
| PCMark 8 Work Score Accelerated v2 | 5102 pontos | |
| PCMark 10 Score | 4248 pontos | |
Ajuda | ||
| Lenovo ThinkBook 15 Samsung SSD PM981 MZVLB512HAJQ | Lenovo ThinkPad E595-20NF0000GE SK Hynix BC501 HFM512GDJTNG | Lenovo ThinkPad L590-20Q70019GE Toshiba XG6 KXG6AZNV512G | Schenker Slim 15 L19 Samsung SSD 970 EVO Plus 500GB | HP ProBook 450 G6-5TJ93EA Samsung SSD PM981 MZVLB512HAJQ | Dell Latitude 15 3590 Samsung SSD PM871b MZ7LN256HAJQ | Média Samsung SSD PM981 MZVLB512HAJQ | |
|---|---|---|---|---|---|---|---|
| CrystalDiskMark 5.2 / 6 | -38% | -27% | 1% | -12% | -60% | -12% | |
| Write 4K (MB/s) | 176.3 | 129.5 -27% | 115.3 -35% | 188.7 7% | 126.1 -28% | 79.5 -55% | 126.7 ? -28% |
| Read 4K (MB/s) | 48.98 | 41.23 -16% | 43.34 -12% | 51.9 6% | 43.92 -10% | 32.72 -33% | 44 ? -10% |
| Write Seq (MB/s) | 1789 | 811 -55% | 1014 -43% | 1566 -12% | 1669 -7% | 472.5 -74% | 1617 ? -10% |
| Read Seq (MB/s) | 1671 | 1145 -31% | 1481 -11% | 1452 -13% | 2224 33% | 504 -70% | 1716 ? 3% |
| Write 4K Q32T1 (MB/s) | 433.5 | 314.1 -28% | 495.4 14% | 444 2% | 410.4 -5% | 322.6 -26% | 413 ? -5% |
| Read 4K Q32T1 (MB/s) | 526 | 356.2 -32% | 332.6 -37% | 566 8% | 338.1 -36% | 249.9 -52% | 420 ? -20% |
| Write Seq Q32T1 (MB/s) | 2983 | 839 -72% | 1654 -45% | 3279 10% | 1979 -34% | 531 -82% | 2076 ? -30% |
| Read Seq Q32T1 (MB/s) | 3555 | 2042 -43% | 1746 -51% | 3558 0% | 3368 -5% | 544 -85% | 3130 ? -12% |
| Write 4K Q8T8 (MB/s) | 1688 | 1033 -39% | 1264 ? -25% | ||||
| Read 4K Q8T8 (MB/s) | 1036 | 892 -14% | 1193 ? 15% | ||||
| AS SSD | -43% | -33% | -66% | -71% | -31% | ||
| Seq Read (MB/s) | 2564 | 1698 -34% | 1383 -46% | 2063 -20% | 498.7 -81% | 1976 ? -23% | |
| Seq Write (MB/s) | 2268 | 740 -67% | 852 -62% | 1163 -49% | 361.7 -84% | 1637 ? -28% | |
| 4K Read (MB/s) | 57 | 39.18 -31% | 45.72 -20% | 50.6 -11% | 34.65 -39% | 50.5 ? -11% | |
| 4K Write (MB/s) | 141.4 | 87.7 -38% | 120.2 -15% | 125.4 -11% | 79.8 -44% | 112 ? -21% | |
| 4K-64 Read (MB/s) | 1175 | 764 -35% | 1344 14% | 1352 15% | 372.5 -68% | 1203 ? 2% | |
| 4K-64 Write (MB/s) | 1665 | 669 -60% | 926 -44% | 1023 -39% | 247.7 -85% | 1504 ? -10% | |
| Access Time Read * (ms) | 0.032 | 0.04 -25% | 0.063 -97% | 0.044 -38% | 0.06 -88% | 0.05092 ? -59% | |
| Access Time Write * (ms) | 0.025 | 0.036 -44% | 0.036 -44% | 0.182 -628% | 0.042 -68% | 0.08337 ? -233% | |
| Score Read (Points) | 1488 | 973 -35% | 1528 3% | 1608 8% | 457 -69% | 1451 ? -2% | |
| Score Write (Points) | 2033 | 831 -59% | 1132 -44% | 1265 -38% | 364 -82% | 1780 ? -12% | |
| Score Total (Points) | 4279 | 2261 -47% | 3420 -20% | 3658 -15% | 1060 -75% | 3966 ? -7% | |
| Copy ISO MB/s (MB/s) | 2118 | 1147 -46% | 1382 -35% | 1755 ? -17% | |||
| Copy Program MB/s (MB/s) | 495.6 | 419.8 -15% | 414.3 -16% | 454 ? -8% | |||
| Copy Game MB/s (MB/s) | 1174 | 928 -21% | 660 -44% | 1057 ? -10% | |||
| Média Total (Programa/Configurações) | -41% /
-41% | -30% /
-30% | 1% /
1% | -39% /
-46% | -66% /
-66% | -22% /
-23% |
* ... menor é melhor

| 3DMark 11 - 1280x720 Performance GPU | |
| Média da turma Office (2551 - 18313, n=68, últimos 2 anos) | |
| Lenovo ThinkPad E595-20NF0000GE | |
| HP ProBook 450 G6-5TJ93EA | |
| Lenovo ThinkBook 15 | |
| Schenker Slim 15 L19 | |
| Média Intel UHD Graphics 620 (1144 - 3432, n=244) | |
| Lenovo ThinkPad L590-20Q70019GE | |
| Dell Latitude 15 3590 | |
| 3DMark | |
| 1280x720 Cloud Gate Standard Graphics | |
| Média da turma Office (11640 - 118515, n=37, últimos 2 anos) | |
| Lenovo ThinkPad E595-20NF0000GE | |
| HP ProBook 450 G6-5TJ93EA | |
| Lenovo ThinkBook 15 | |
| Schenker Slim 15 L19 | |
| Média Intel UHD Graphics 620 (6205 - 16400, n=225) | |
| Lenovo ThinkPad L590-20Q70019GE | |
| Dell Latitude 15 3590 | |
| 1920x1080 Fire Strike Graphics | |
| Média da turma Office (736 - 21871, n=73, últimos 2 anos) | |
| HP ProBook 450 G6-5TJ93EA | |
| Lenovo ThinkPad E595-20NF0000GE | |
| Lenovo ThinkBook 15 | |
| Schenker Slim 15 L19 | |
| Média Intel UHD Graphics 620 (557 - 2608, n=213) | |
| Lenovo ThinkPad L590-20Q70019GE | |
| Dell Latitude 15 3590 | |
| 2560x1440 Time Spy Graphics | |
| Média da turma Office (493 - 6679, n=68, últimos 2 anos) | |
| Lenovo ThinkBook 15 | |
| Schenker Slim 15 L19 | |
| Média Intel UHD Graphics 620 (299 - 797, n=88) | |
| Lenovo ThinkPad L590-20Q70019GE | |
| 3DMark 11 Performance | 2165 pontos | |
| 3DMark Ice Storm Standard Score | 68444 pontos | |
| 3DMark Cloud Gate Standard Score | 8887 pontos | |
| 3DMark Fire Strike Score | 1182 pontos | |
| 3DMark Fire Strike Extreme Score | 528 pontos | |
| 3DMark Time Spy Score | 484 pontos | |
Ajuda | ||
| baixo | média | alto | ultra | |
|---|---|---|---|---|
| BioShock Infinite (2013) | 81.9 | 40.3 | 33.2 | 10.8 |
| Dota 2 Reborn (2015) | 84.6 | 53.7 | 21.9 | 19.6 |
| Rise of the Tomb Raider (2016) | 23.6 | 15.6 | 8.03 | |
| X-Plane 11.11 (2018) | 11.5 | 13.4 | 12.4 |
Barulho
| Ocioso |
| 29.2 / 29.2 / 29.9 dB |
| Carga |
| 30.6 / 33.8 dB |
 | ||
30 dB silencioso 40 dB(A) audível 50 dB(A) ruidosamente alto |
||
min: | ||
| Lenovo ThinkBook 15 UHD Graphics 620, i5-10210U, Samsung SSD PM981 MZVLB512HAJQ | Lenovo ThinkPad E595-20NF0000GE Vega 10, R7 3700U, SK Hynix BC501 HFM512GDJTNG | Lenovo ThinkPad L590-20Q70019GE UHD Graphics 620, i5-8265U, Toshiba XG6 KXG6AZNV512G | Schenker Slim 15 L19 UHD Graphics 620, i5-10210U, Samsung SSD 970 EVO Plus 500GB | HP ProBook 450 G6-5TJ93EA GeForce MX130, i7-8565U, Samsung SSD PM981 MZVLB512HAJQ | Dell Latitude 15 3590 UHD Graphics 620, i5-8250U, Samsung SSD PM871b MZ7LN256HAJQ | |
|---|---|---|---|---|---|---|
| Noise | -1% | 2% | -13% | -3% | -12% | |
| desligado / ambiente * (dB) | 29.2 | 29.3 -0% | 29 1% | 30.6 -5% | 29 1% | 30.6 -5% |
| Idle Minimum * (dB) | 29.2 | 29.3 -0% | 29 1% | 30.6 -5% | 29 1% | 30.6 -5% |
| Idle Average * (dB) | 29.2 | 29.3 -0% | 29 1% | 30.6 -5% | 29 1% | 31.9 -9% |
| Idle Maximum * (dB) | 29.9 | 30.1 -1% | 29 3% | 30.6 -2% | 29 3% | 31.9 -7% |
| Load Average * (dB) | 30.6 | 30.9 -1% | 29 5% | 40.5 -32% | 34.2 -12% | 39 -27% |
| Load Maximum * (dB) | 33.8 | 35.2 -4% | 33.8 -0% | 42.7 -26% | 38.4 -14% | 39.1 -16% |
| Witcher 3 ultra * (dB) | 34.2 |
* ... menor é melhor
(+) A temperatura máxima no lado superior é 38 °C / 100 F, em comparação com a média de 34.3 °C / 94 F , variando de 21.2 a 62.5 °C para a classe Office.
(±) A parte inferior aquece até um máximo de 43.9 °C / 111 F, em comparação com a média de 36.8 °C / 98 F
(+) Em uso inativo, a temperatura média para o lado superior é 23.5 °C / 74 F, em comparação com a média do dispositivo de 29.5 °C / ### class_avg_f### F.
(+) Os apoios para as mãos e o touchpad são mais frios que a temperatura da pele, com um máximo de 27.8 °C / 82 F e, portanto, são frios ao toque.
(±) A temperatura média da área do apoio para as mãos de dispositivos semelhantes foi 27.5 °C / 81.5 F (-0.3 °C / -0.5 F).
| Lenovo ThinkBook 15 UHD Graphics 620, i5-10210U, Samsung SSD PM981 MZVLB512HAJQ | Lenovo ThinkPad E595-20NF0000GE Vega 10, R7 3700U, SK Hynix BC501 HFM512GDJTNG | Lenovo ThinkPad L590-20Q70019GE UHD Graphics 620, i5-8265U, Toshiba XG6 KXG6AZNV512G | Schenker Slim 15 L19 UHD Graphics 620, i5-10210U, Samsung SSD 970 EVO Plus 500GB | HP ProBook 450 G6-5TJ93EA GeForce MX130, i7-8565U, Samsung SSD PM981 MZVLB512HAJQ | Dell Latitude 15 3590 UHD Graphics 620, i5-8250U, Samsung SSD PM871b MZ7LN256HAJQ | |
|---|---|---|---|---|---|---|
| Heat | -20% | -11% | 1% | -2% | 1% | |
| Maximum Upper Side * (°C) | 38 | 48.8 -28% | 42.7 -12% | 37 3% | 39.4 -4% | 40.6 -7% |
| Maximum Bottom * (°C) | 43.9 | 48.4 -10% | 51 -16% | 43.1 2% | 50.2 -14% | 37.5 15% |
| Idle Upper Side * (°C) | 24.5 | 29.1 -19% | 25.9 -6% | 25.1 -2% | 22.9 7% | 26.3 -7% |
| Idle Bottom * (°C) | 25.4 | 31 -22% | 28.3 -11% | 25.1 1% | 24.1 5% | 25.2 1% |
* ... menor é melhor
Lenovo ThinkBook 15 análise de áudio
(-) | alto-falantes não muito altos (###valor### dB)
Graves 100 - 315Hz
(-) | quase nenhum baixo - em média 18.4% menor que a mediana
(±) | a linearidade dos graves é média (7.3% delta para a frequência anterior)
Médios 400 - 2.000 Hz
(±) | médios mais altos - em média 8.1% maior que a mediana
(±) | a linearidade dos médios é média (12.5% delta para frequência anterior)
Altos 2 - 16 kHz
(±) | máximos mais altos - em média 6.1% maior que a mediana
(±) | a linearidade dos máximos é média (13.1% delta para frequência anterior)
Geral 100 - 16.000 Hz
(-) | o som geral não é linear (38.1% diferença em relação à mediana)
Comparado com a mesma classe
» 98% de todos os dispositivos testados nesta classe foram melhores, 1% semelhantes, 1% piores
» O melhor teve um delta de 7%, a média foi 21%, o pior foi 53%
Comparado com todos os dispositivos testados
» 95% de todos os dispositivos testados foram melhores, 1% semelhantes, 5% piores
» O melhor teve um delta de 4%, a média foi 24%, o pior foi 134%
Schenker Slim 15 L19 análise de áudio
(-) | alto-falantes não muito altos (###valor### dB)
Graves 100 - 315Hz
(-) | quase nenhum baixo - em média 30.1% menor que a mediana
(+) | o baixo é linear (6.4% delta para a frequência anterior)
Médios 400 - 2.000 Hz
(±) | médios mais altos - em média 8.7% maior que a mediana
(±) | a linearidade dos médios é média (11.6% delta para frequência anterior)
Altos 2 - 16 kHz
(+) | agudos equilibrados - apenas 4.6% longe da mediana
(+) | os máximos são lineares (6.5% delta da frequência anterior)
Geral 100 - 16.000 Hz
(-) | o som geral não é linear (32.4% diferença em relação à mediana)
Comparado com a mesma classe
» 95% de todos os dispositivos testados nesta classe foram melhores, 1% semelhantes, 4% piores
» O melhor teve um delta de 7%, a média foi 21%, o pior foi 53%
Comparado com todos os dispositivos testados
» 91% de todos os dispositivos testados foram melhores, 1% semelhantes, 7% piores
» O melhor teve um delta de 4%, a média foi 24%, o pior foi 134%
| desligado | |
| Ocioso | |
| Carga |
|
Key:
min: | |
| Lenovo ThinkBook 15 i5-10210U, UHD Graphics 620, Samsung SSD PM981 MZVLB512HAJQ, IPS, 1920x1080, 15.6" | Lenovo ThinkPad E595-20NF0000GE R7 3700U, Vega 10, SK Hynix BC501 HFM512GDJTNG, IPS, 1920x1080, 15.6" | Lenovo ThinkPad L590-20Q70019GE i5-8265U, UHD Graphics 620, Toshiba XG6 KXG6AZNV512G, IPS, 1920x1080, 15.6" | Schenker Slim 15 L19 i5-10210U, UHD Graphics 620, Samsung SSD 970 EVO Plus 500GB, , 1920x1080, 15.6" | HP ProBook 450 G6-5TJ93EA i7-8565U, GeForce MX130, Samsung SSD PM981 MZVLB512HAJQ, IPS, 1920x1080, 15.6" | Dell Latitude 15 3590 i5-8250U, UHD Graphics 620, Samsung SSD PM871b MZ7LN256HAJQ, TN LED, 1920x1080, 15.6" | Média Intel UHD Graphics 620 | Média da turma Office | |
|---|---|---|---|---|---|---|---|---|
| Power Consumption | 5% | 3% | -23% | -11% | 3% | 4% | -10% | |
| Idle Minimum * (Watt) | 3.5 | 4.2 -20% | 3.96 -13% | 5.5 -57% | 3.12 11% | 4.3 -23% | 3.81 ? -9% | 4.41 ? -26% |
| Idle Average * (Watt) | 7.1 | 7.92 -12% | 6.9 3% | 8.9 -25% | 6.3 11% | 7.2 -1% | 6.94 ? 2% | 7.37 ? -4% |
| Idle Maximum * (Watt) | 7.8 | 8.16 -5% | 9.8 -26% | 9.1 -17% | 9.78 -25% | 9.8 -26% | 8.75 ? -12% | 8.58 ? -10% |
| Load Average * (Watt) | 38.9 | 29 25% | 31.4 19% | 47 -21% | 57.6 -48% | 38 2% | 35 ? 10% | 43 ? -11% |
| Load Maximum * (Watt) | 65.4 | 42.2 35% | 45.4 31% | 61.2 6% | 67.3 -3% | 24 63% | 47.5 ? 27% | 64.6 ? 1% |
| Witcher 3 ultra * (Watt) | 42 |
* ... menor é melhor


| Lenovo ThinkBook 15 i5-10210U, UHD Graphics 620, 45 Wh | Lenovo ThinkPad E595-20NF0000GE R7 3700U, Vega 10, 45 Wh | Lenovo ThinkPad L590-20Q70019GE i5-8265U, UHD Graphics 620, 45 Wh | Schenker Slim 15 L19 i5-10210U, UHD Graphics 620, Wh | HP ProBook 450 G6-5TJ93EA i7-8565U, GeForce MX130, 45 Wh | Dell Latitude 15 3590 i5-8250U, UHD Graphics 620, 56 Wh | Média da turma Office | |
|---|---|---|---|---|---|---|---|
| Duração da bateria | 6% | 30% | -9% | 21% | 35% | 64% | |
| Reader / Idle (h) | 17.9 | 15.7 -12% | 17.4 -3% | 14.6 -18% | 20.2 13% | 23.7 ? 32% | |
| H.264 (h) | 7 | 8.6 23% | 9 29% | 7.7 10% | 10.3 47% | 15 ? 114% | |
| WiFi v1.3 (h) | 6.8 | 7.7 13% | 7.2 6% | 6.2 -9% | 9.7 43% | 9.1 34% | 12.9 ? 90% |
| Load (h) | 1.5 | 1.5 0% | 2.8 87% | 2.2 47% | 2.2 47% | 1.794 ? 20% |
Pro
Contra
Verdict - A solid work tool in a modern guise
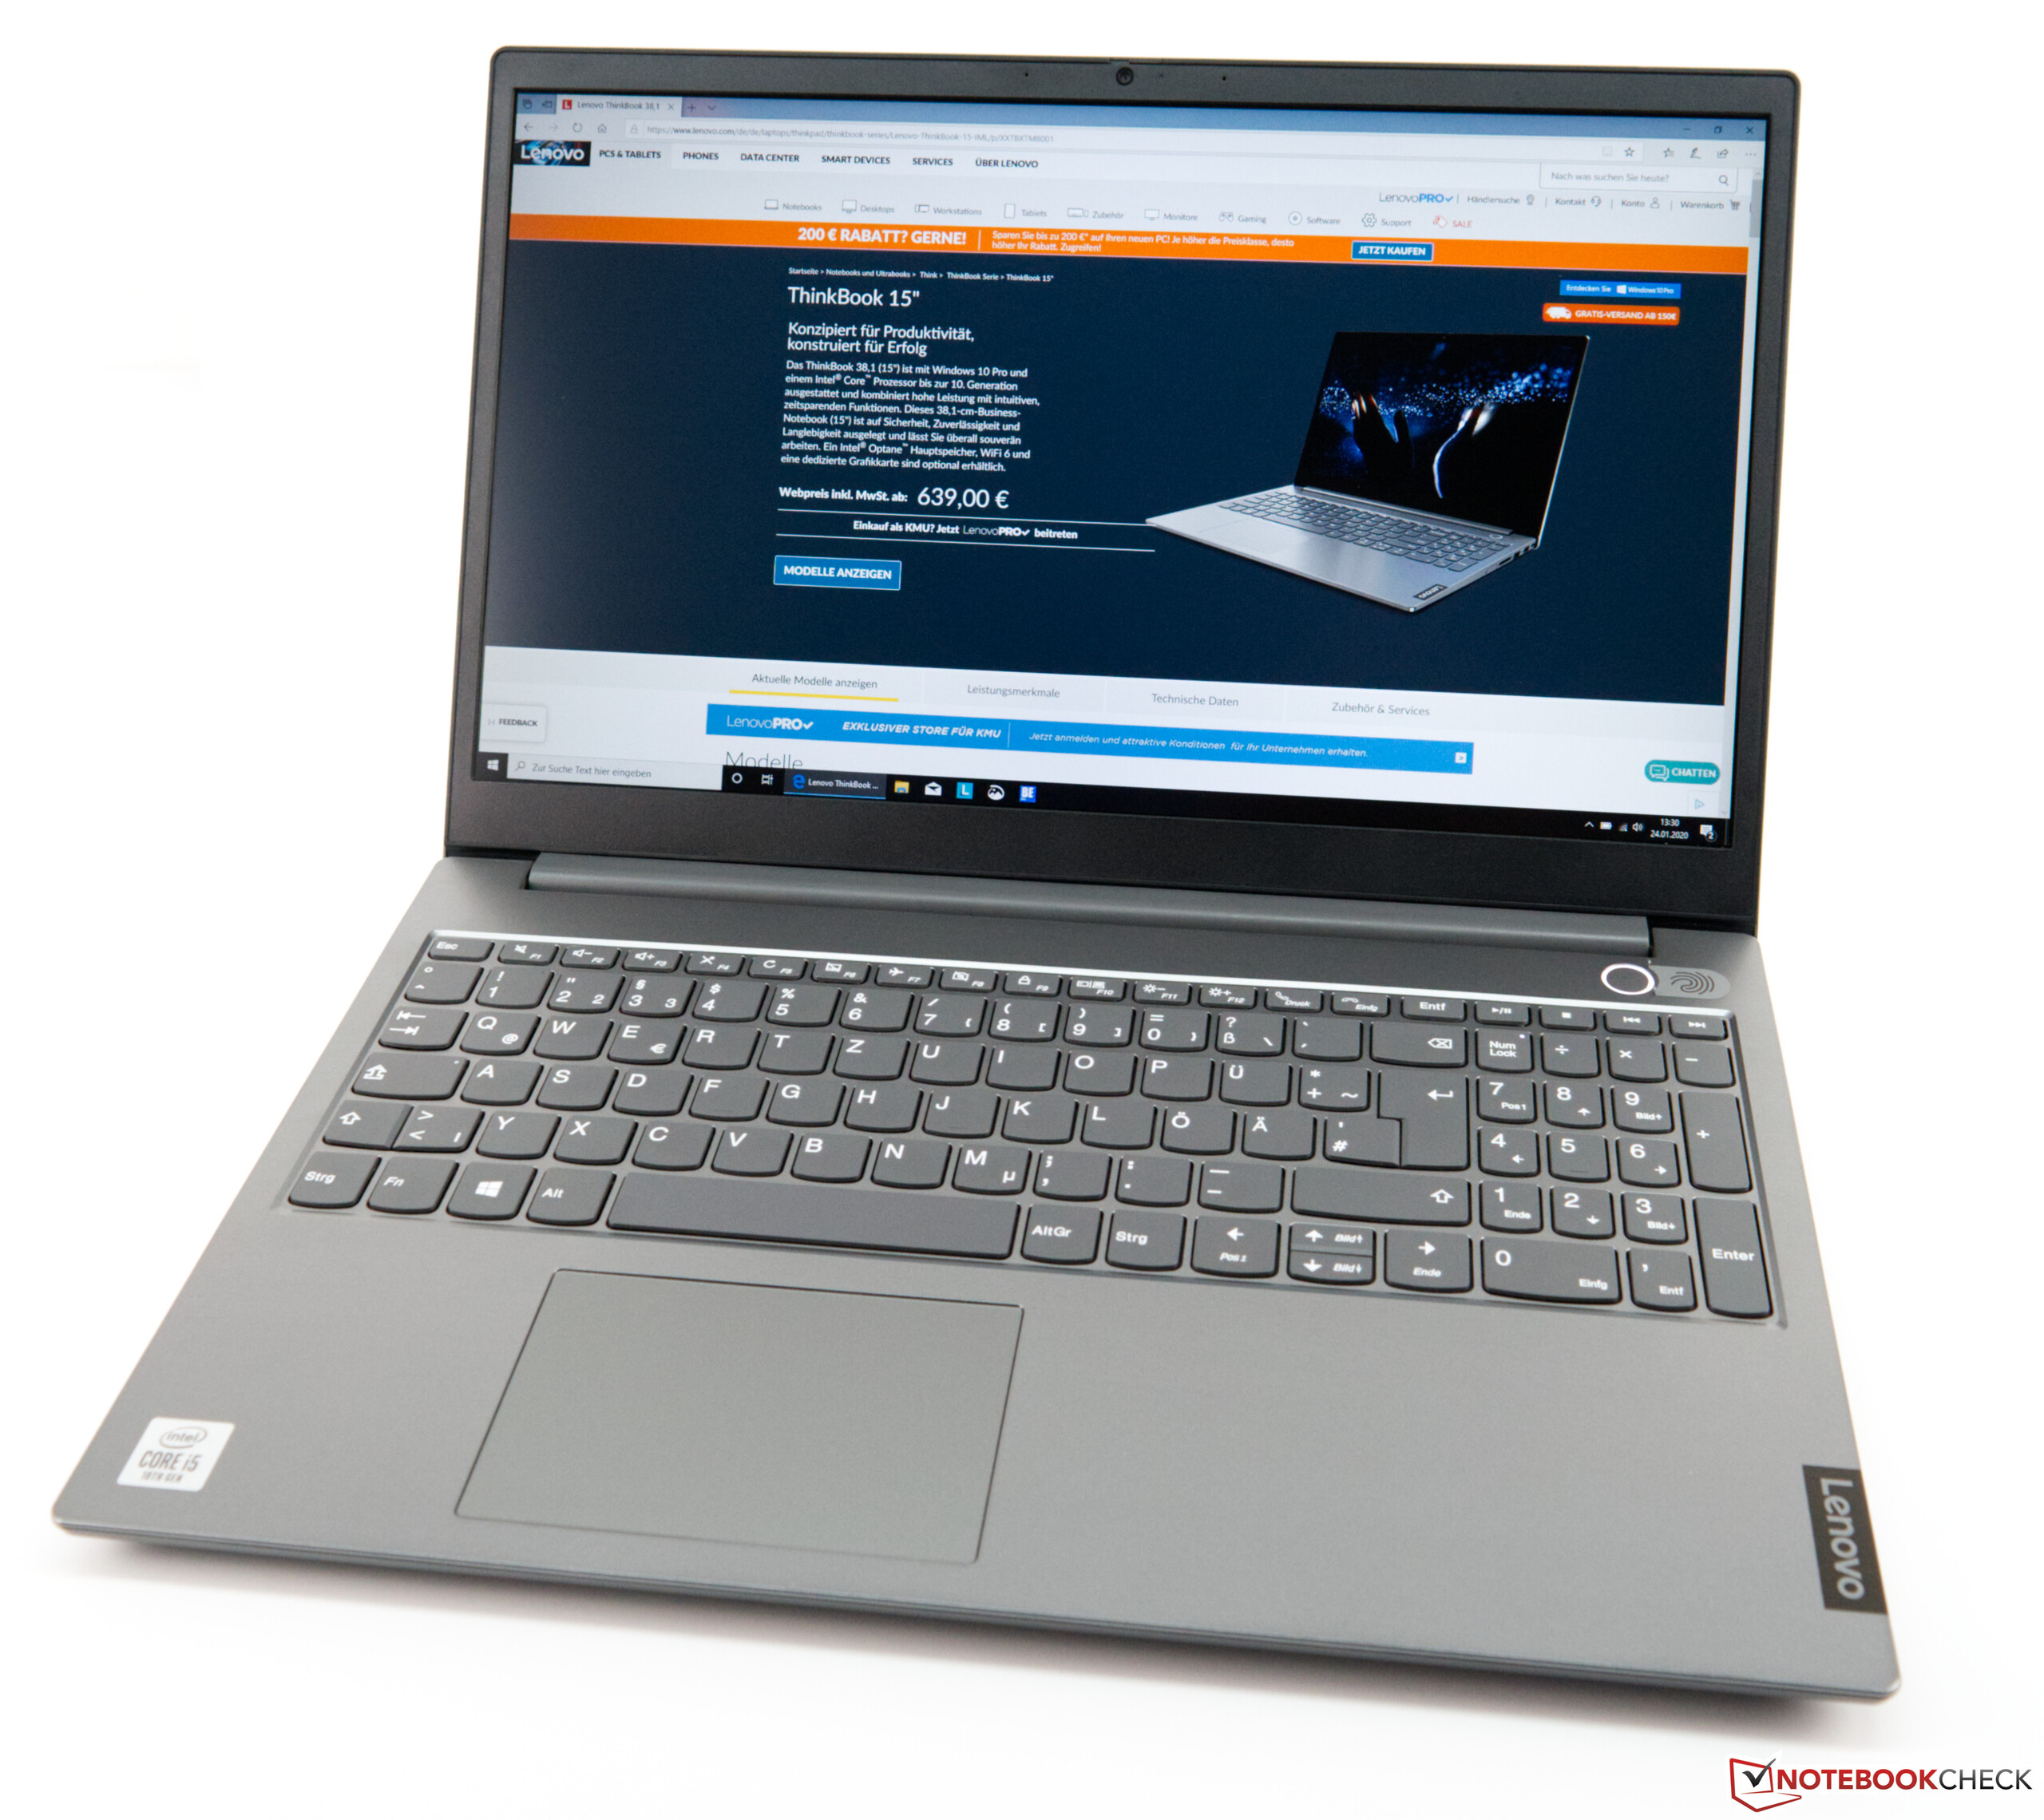
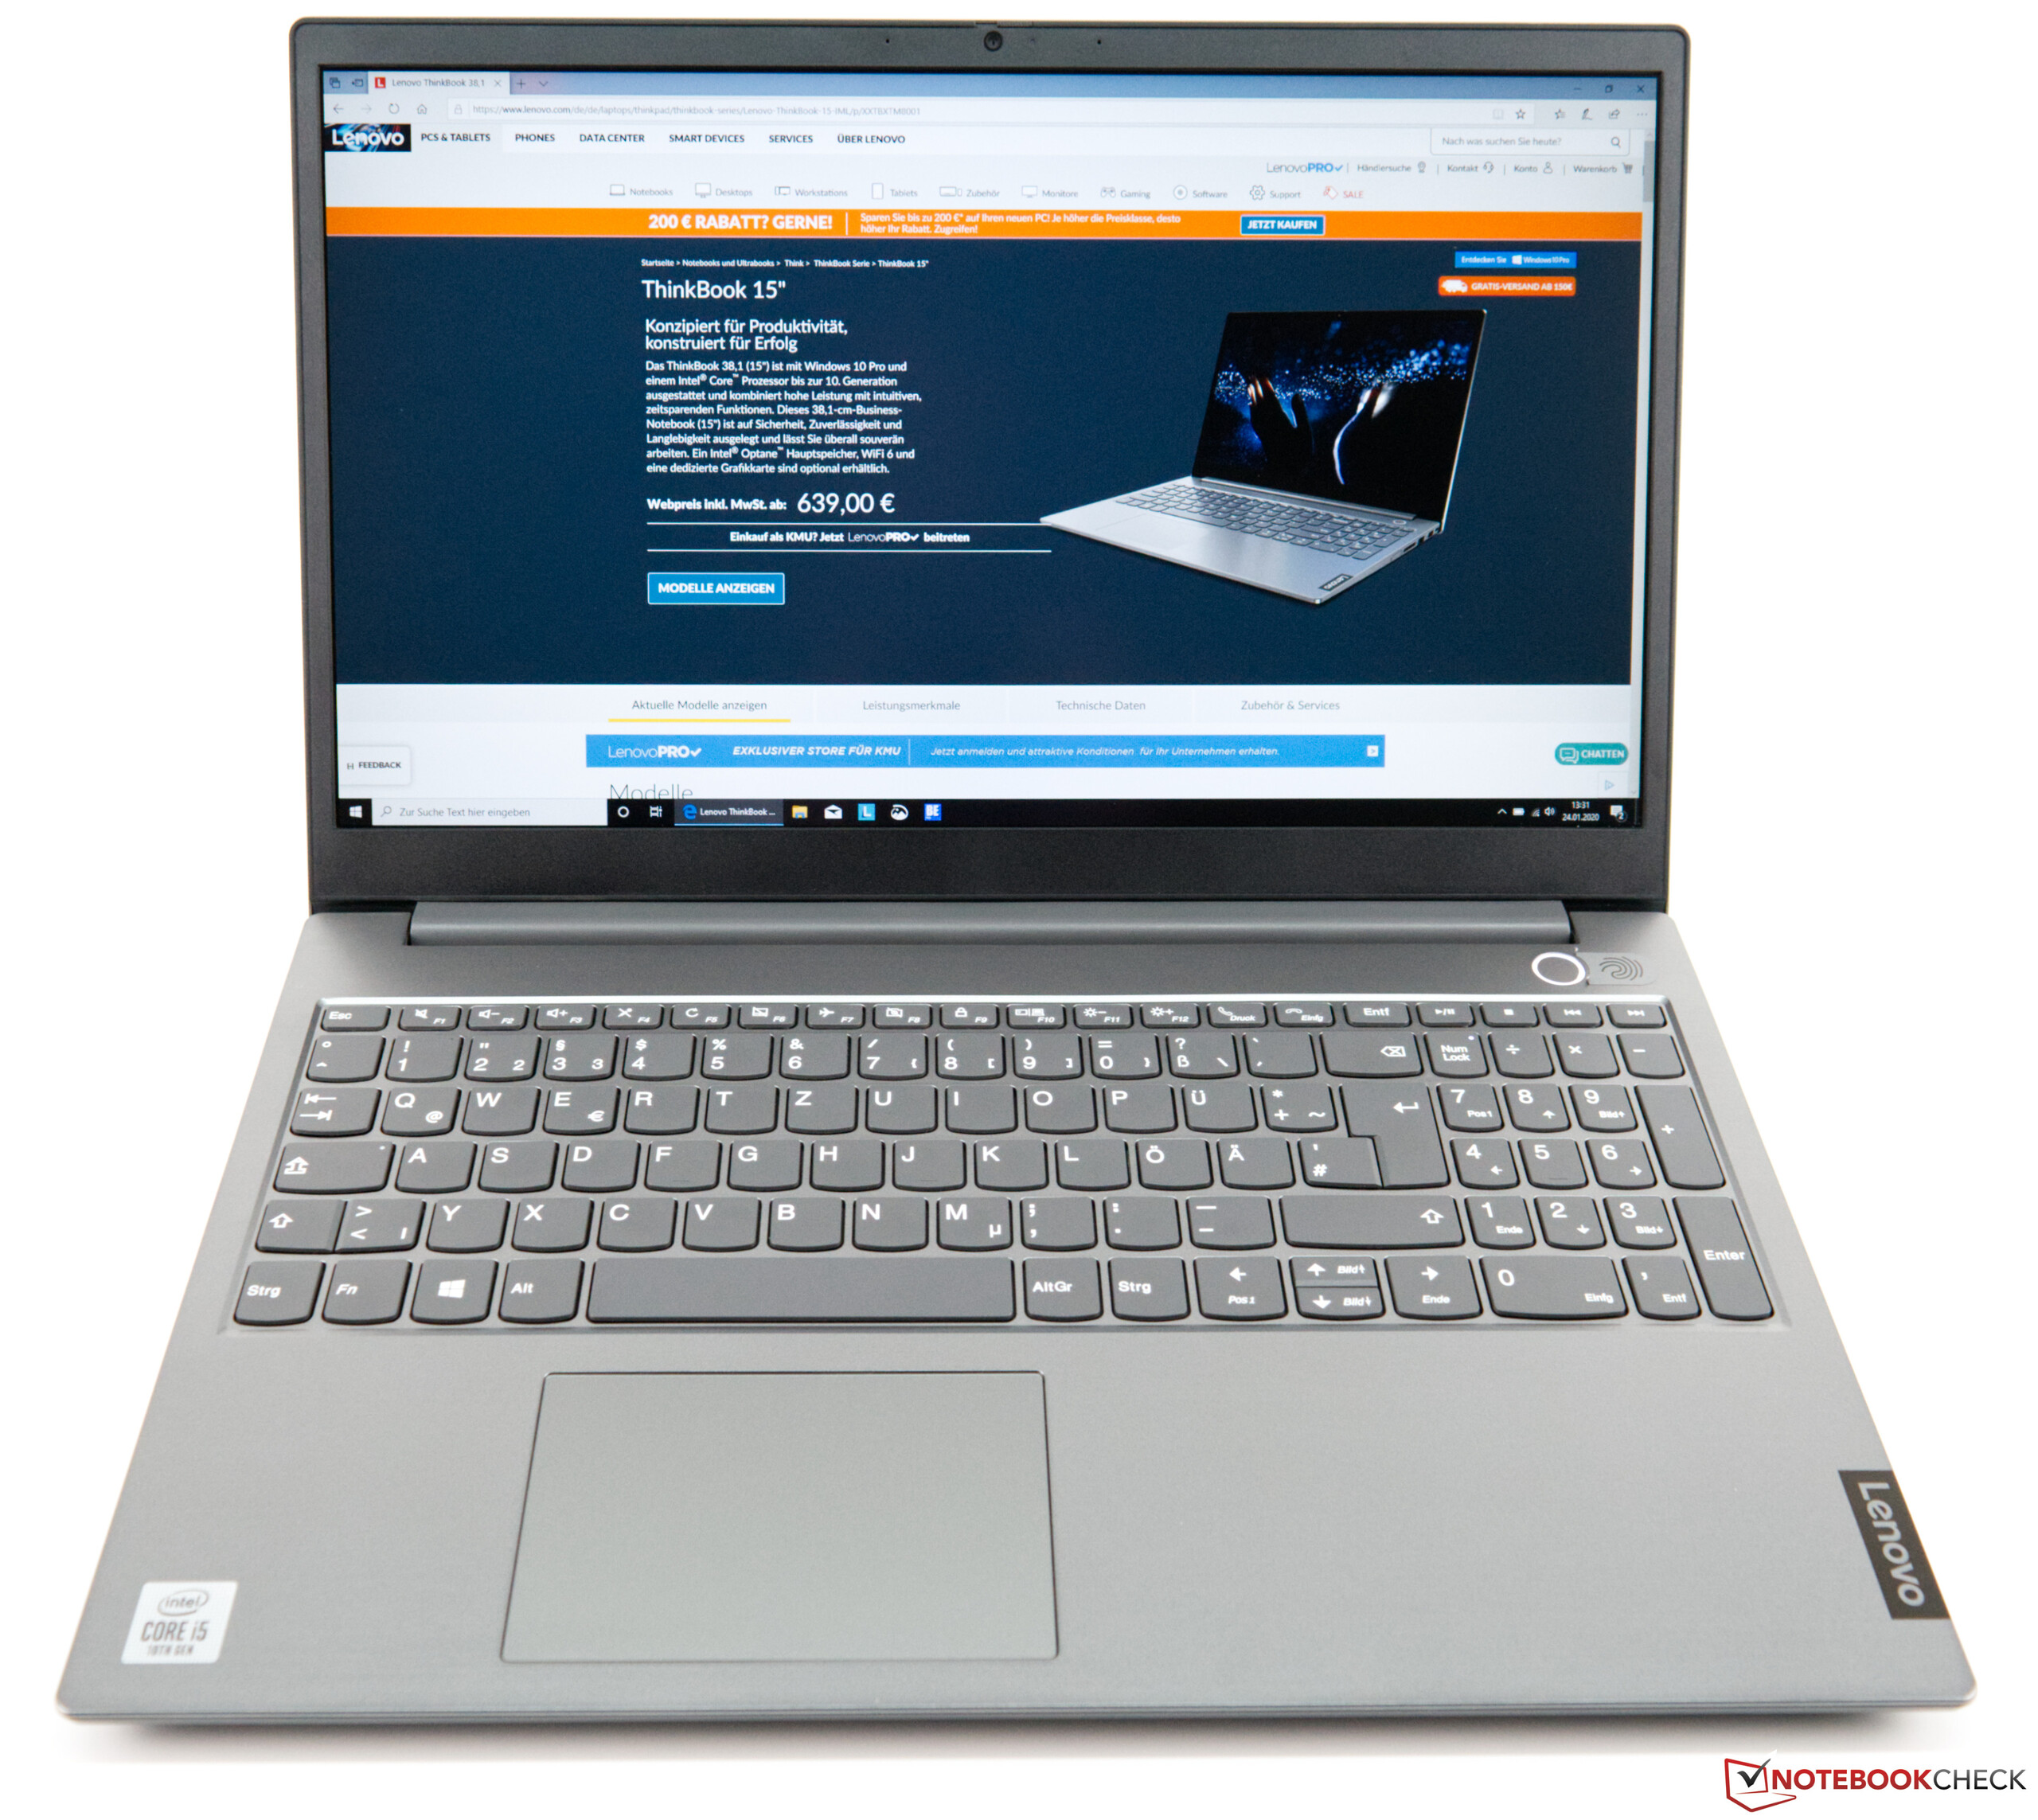
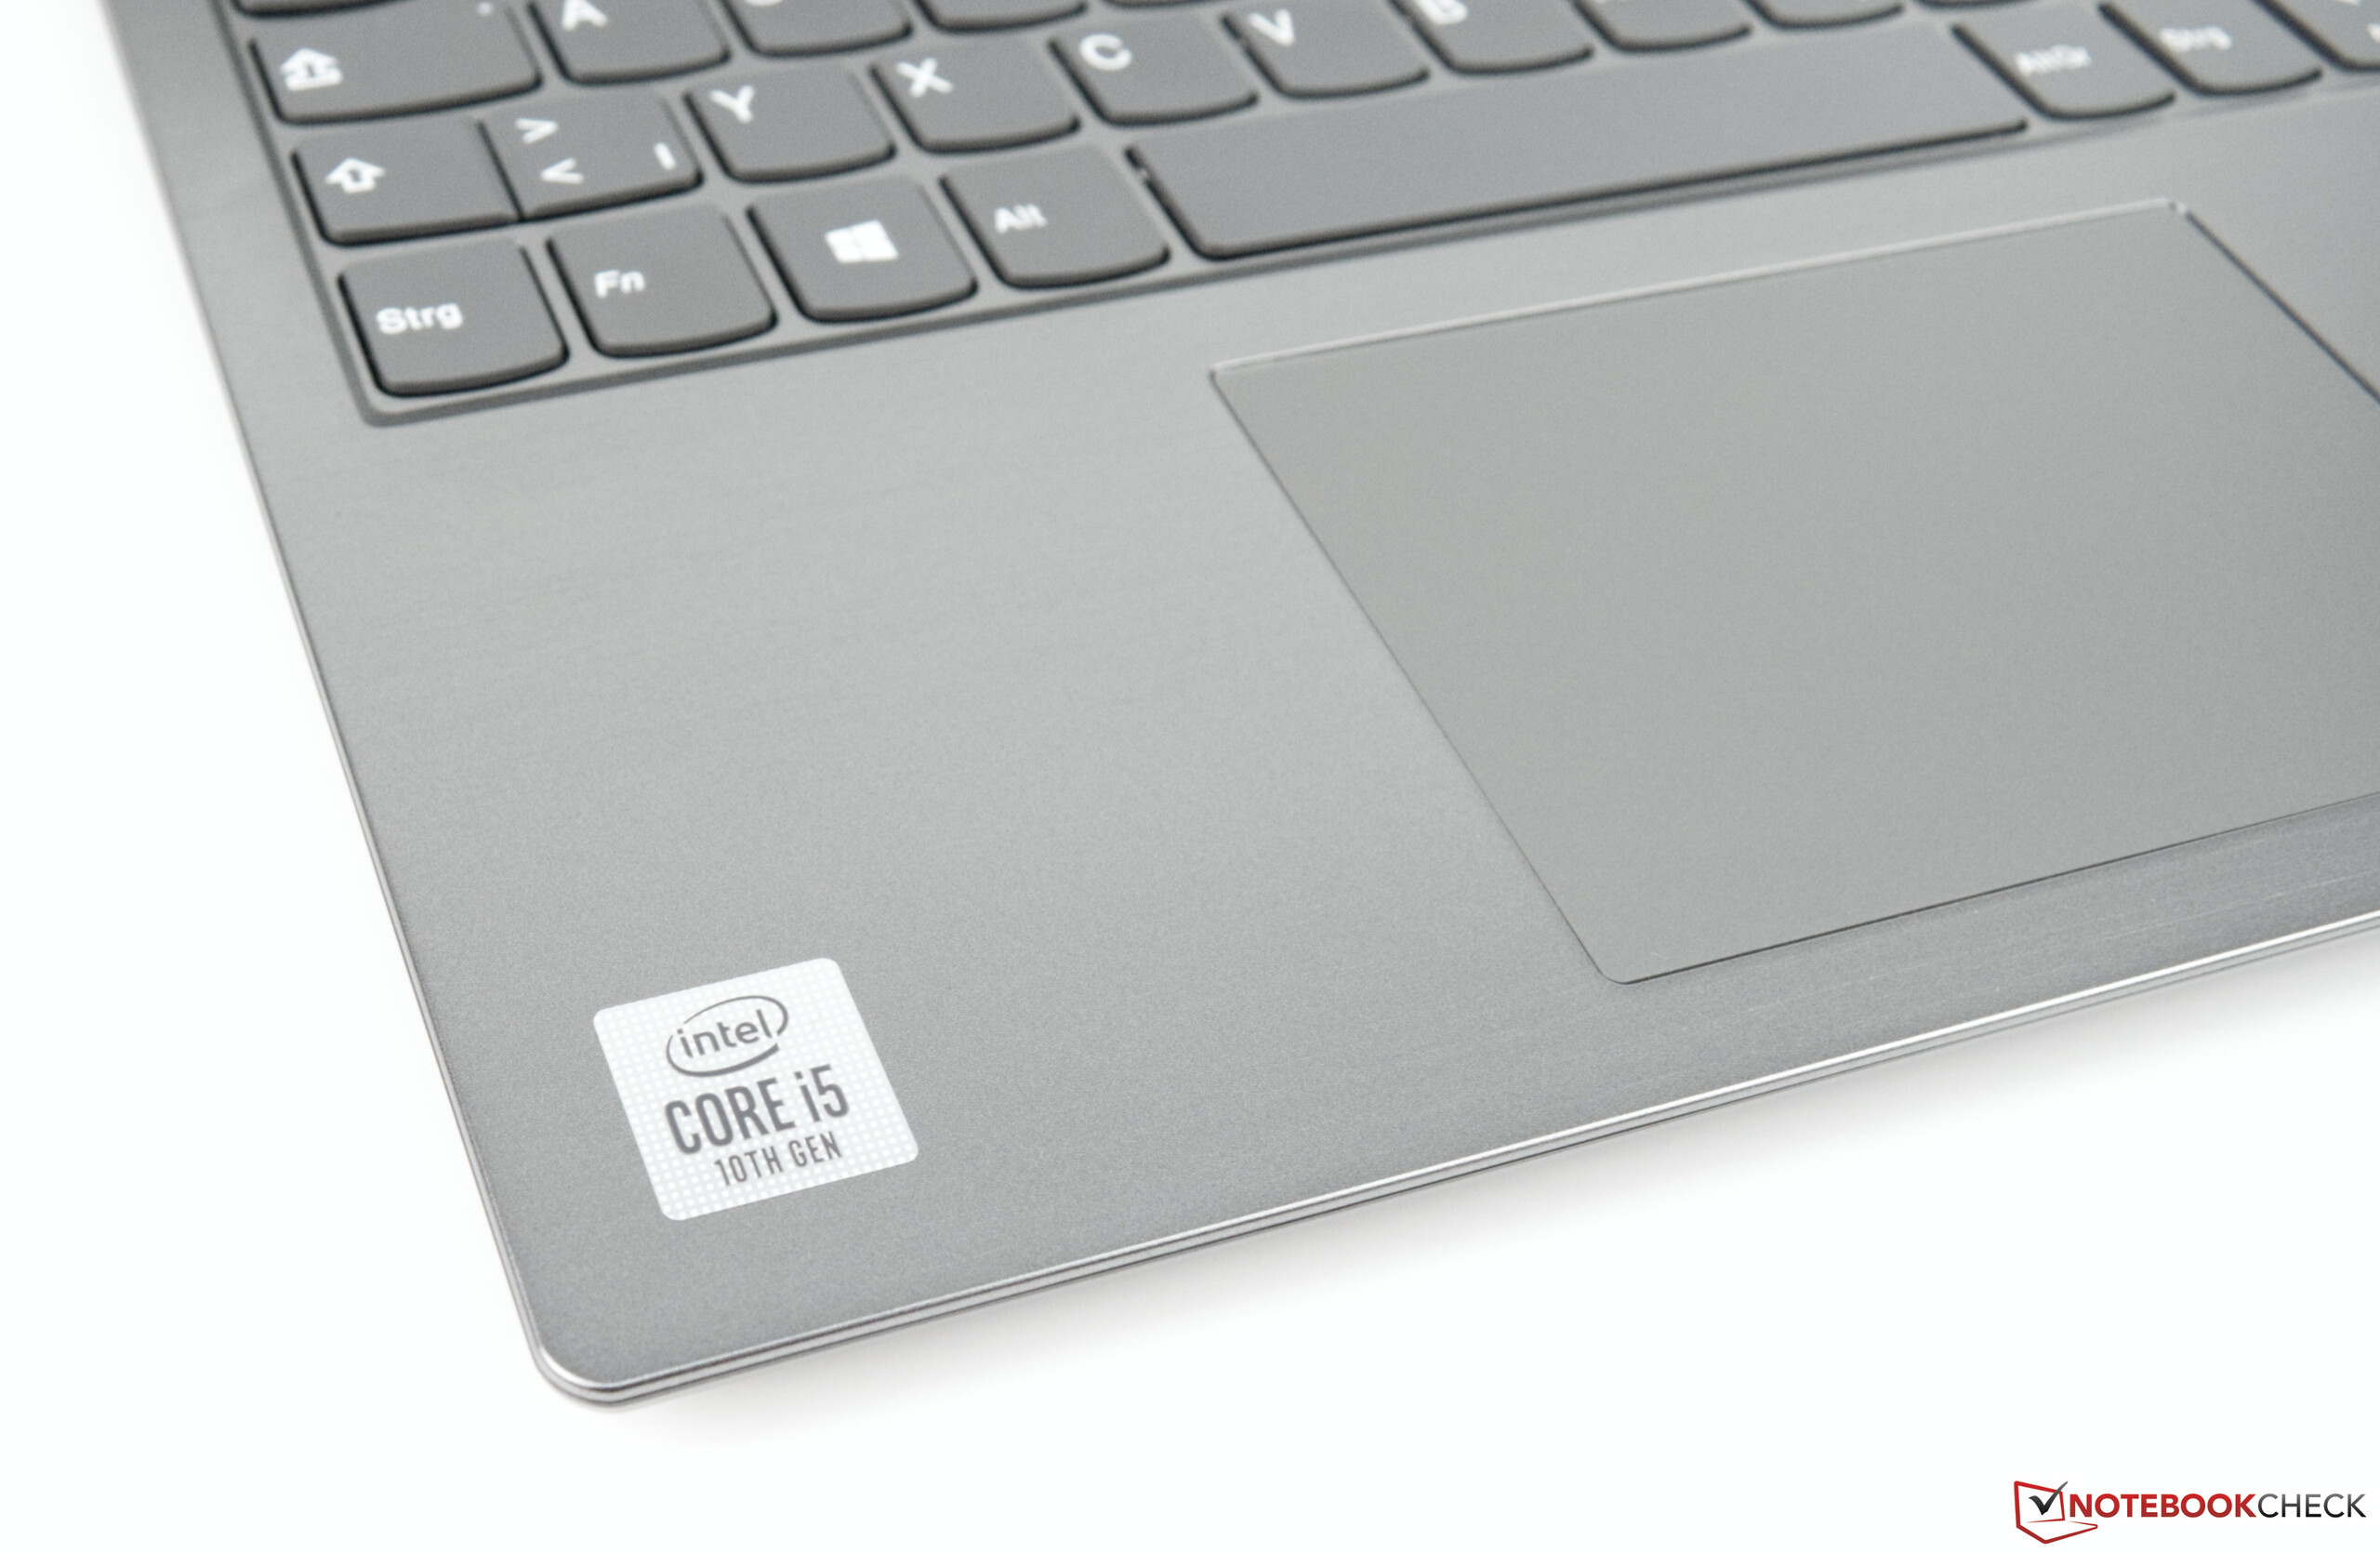
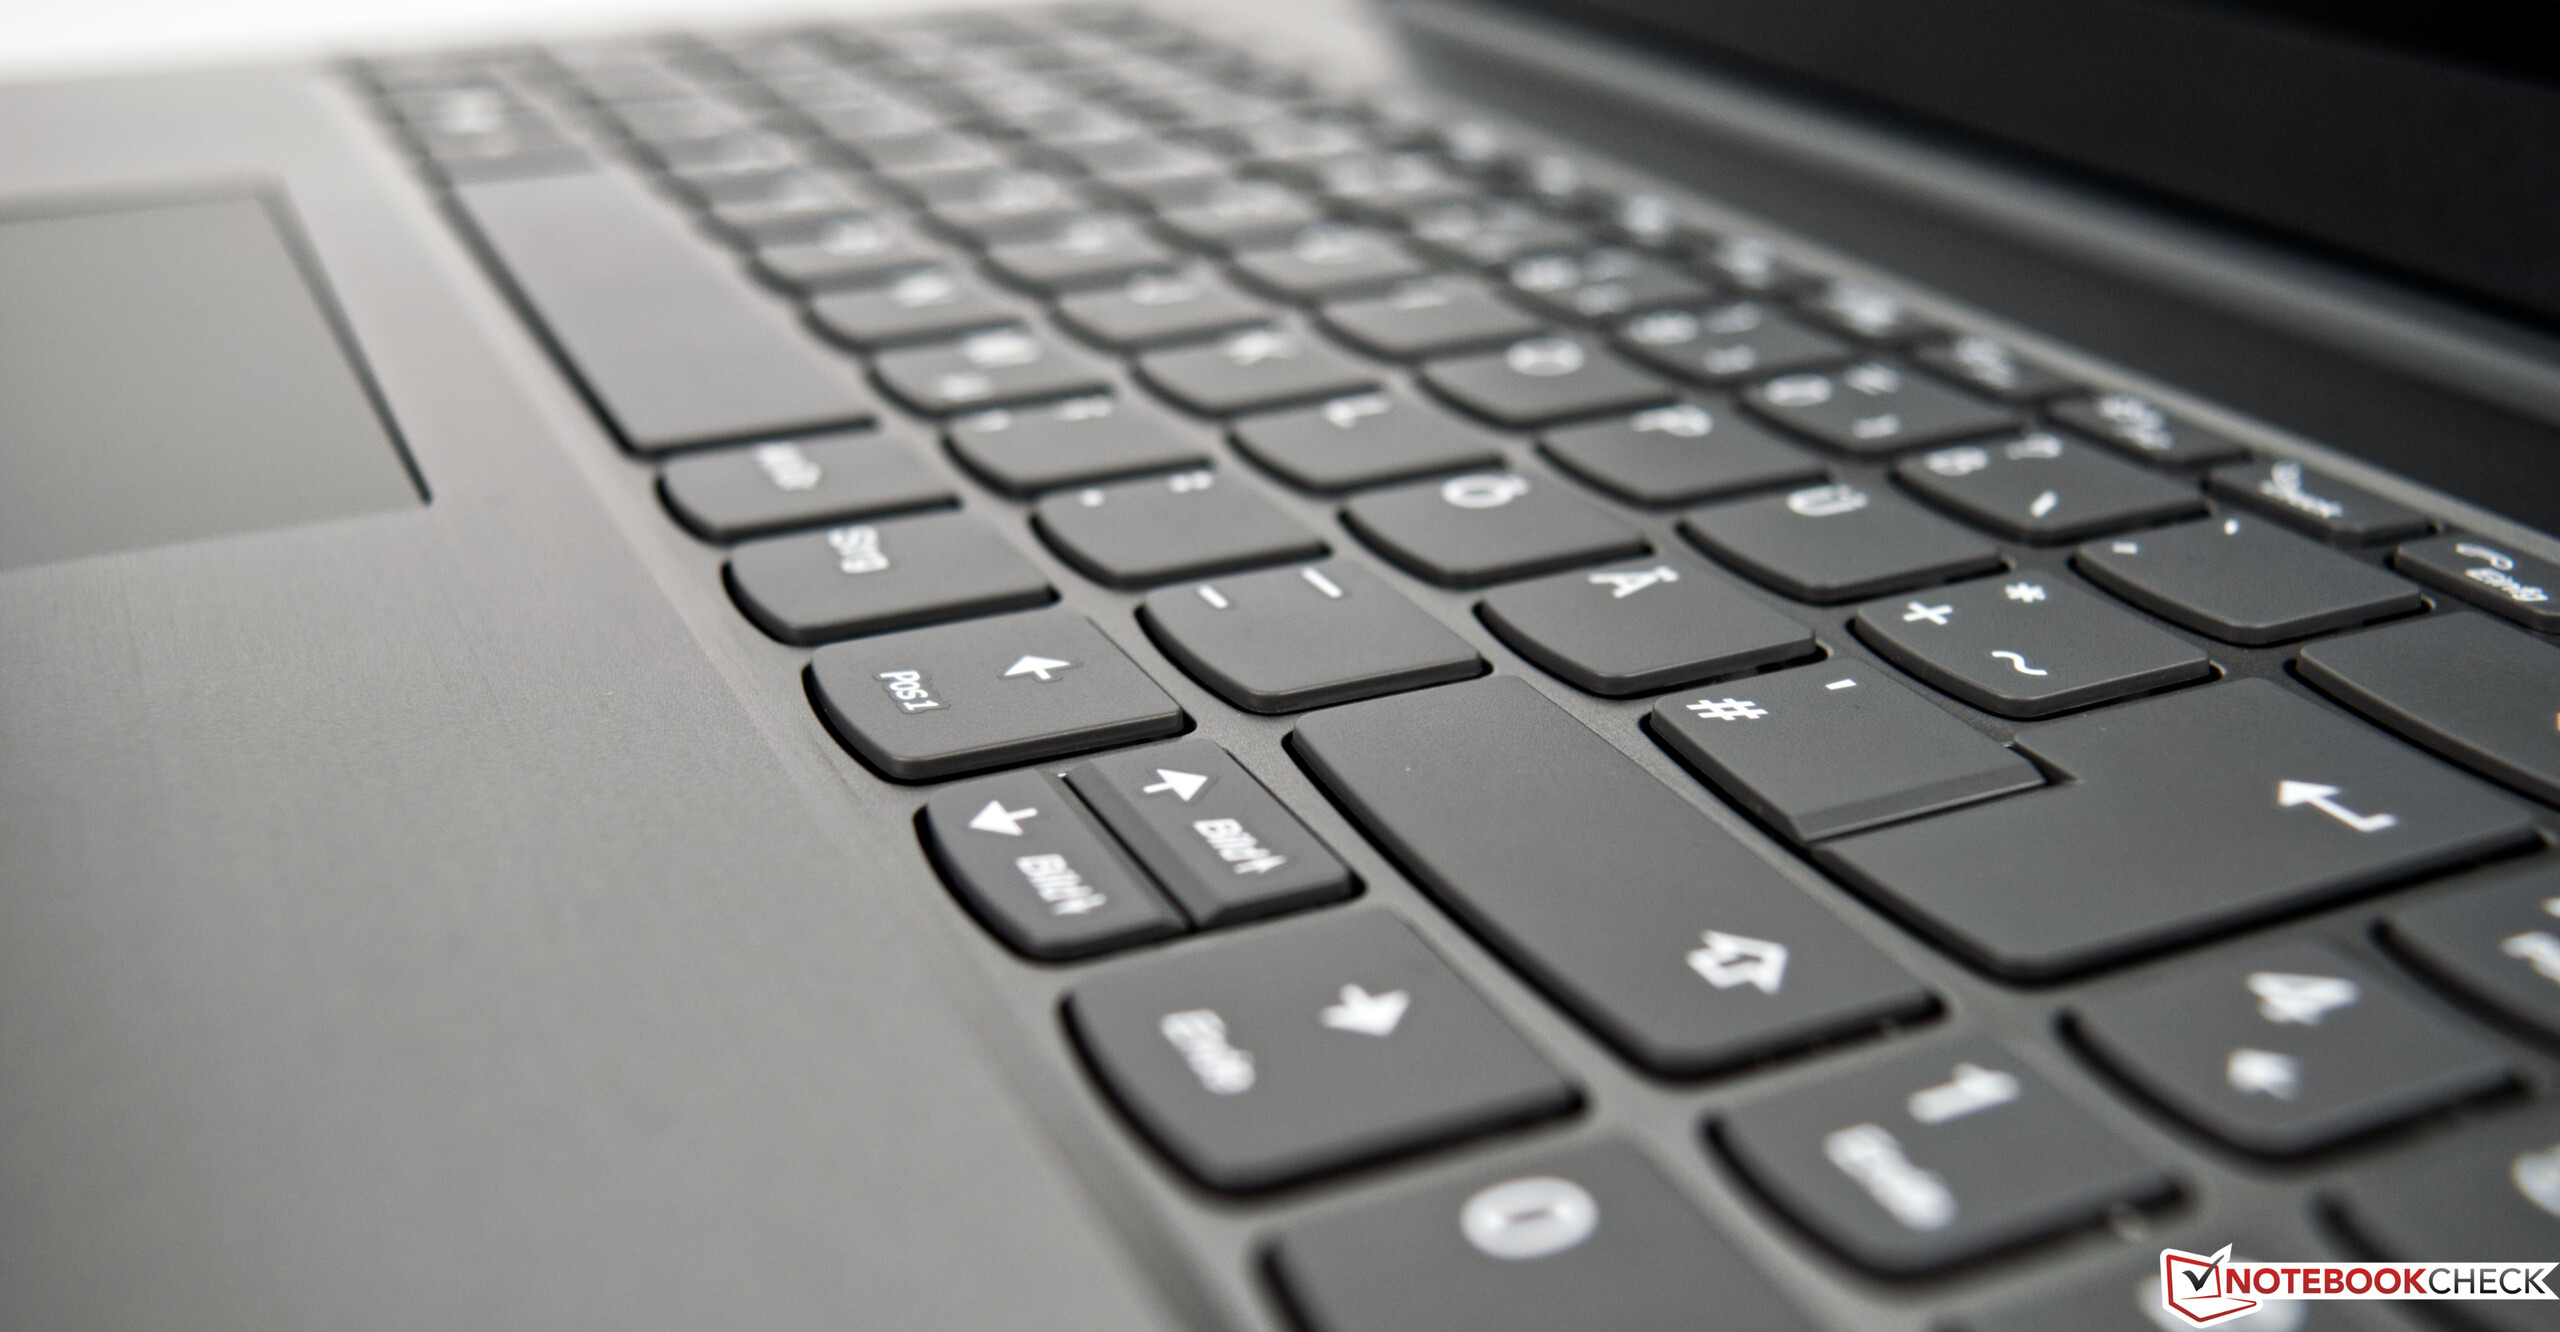
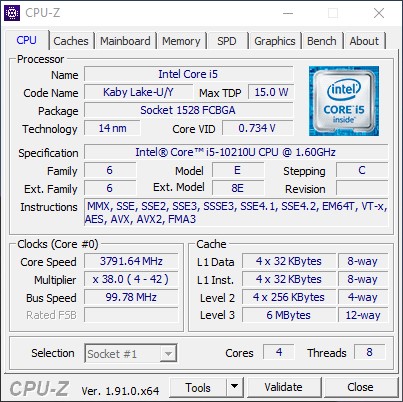
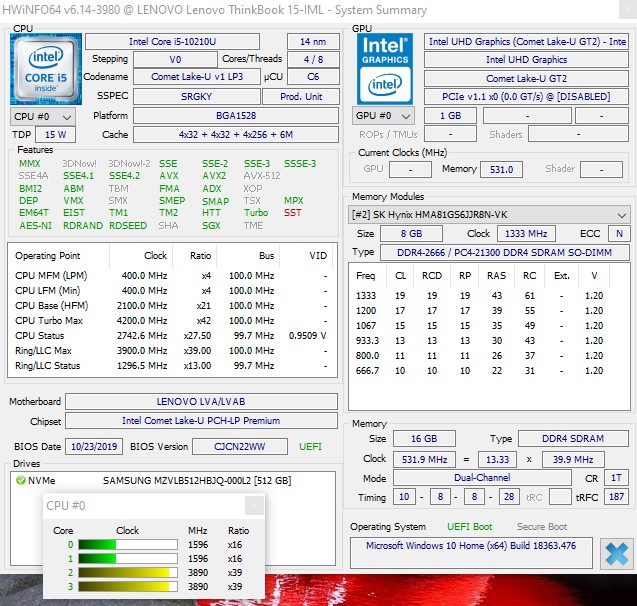
O ThinkBook 15 é um portátil de escritório simples, com boa pontuação pelo seu design moderno e bons dispositivos de entrada. Seu processador Comet Lake também oferece um pequeno aumento no desempenho em relação aos antecessores Kaby Lake e Whiskey Lake, com o Core i5-10210U em nossa unidade de teste sempre disponível para executar tarefas gerais. Em resumo, a CPU torna o ThinkBook 15 adequado para uso como portátil de escritório doméstico, por exemplo. Os abundantes 16 GB de RAM e o rápido SSD NVMe de 512 GB também mantêm as coisas funcionando.
A tela dividirá a opinião, no entanto. Embora classifiquemos seu acabamento mate e bons ângulos de visão, sua baixa cobertura de espaço de cores torna o ThinkBook 15 pouco atraente para edição de fotos ou vídeos.
O Lenovo ThinkBook 15 é um portátil de escritório de baixo custo que não apresenta deficiências sérias.
No geral, o ThinkBook 15 tem um bom preço em torno de 810 Euros (~ $ 889). No entanto, sua bateria de 45 Wh não aguenta uma jornada de trabalho completa. Esperávamos pelo menos oito horas ou mais, aqui.
Lenovo ThinkBook 15
- 02/06/2020 v7 (old)
Sebastian Bade
Price comparison
