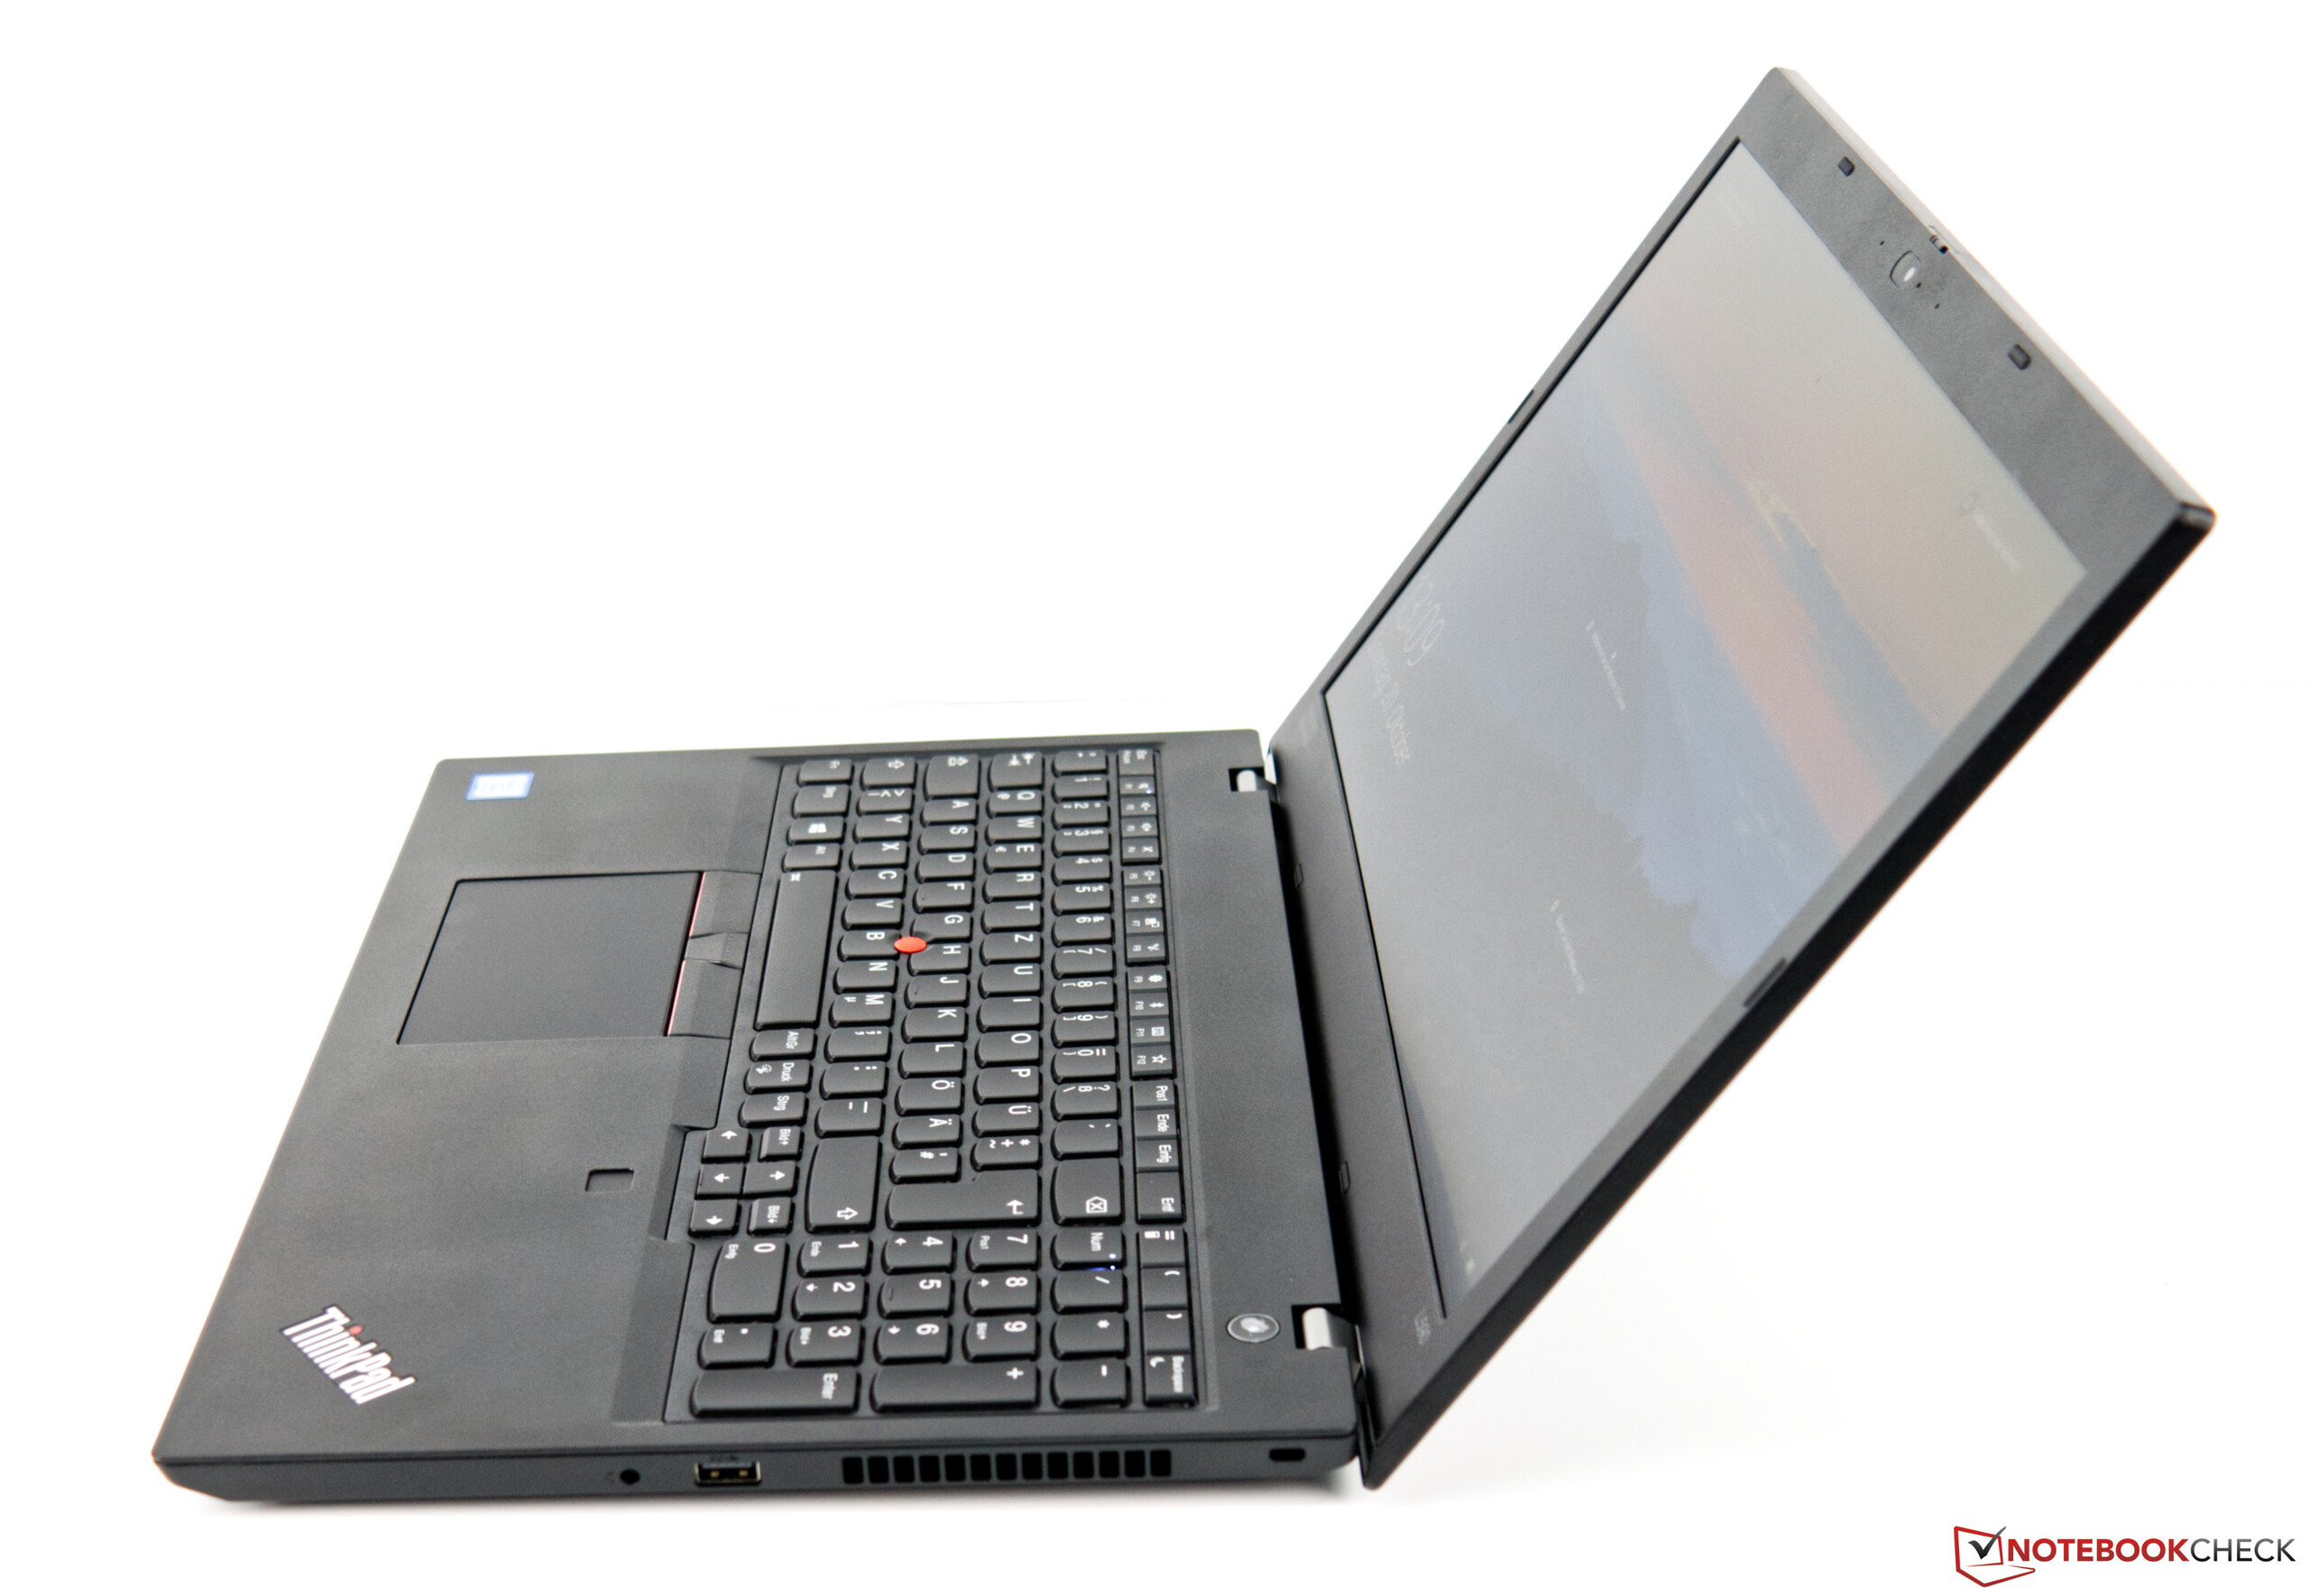
Breve Análise do Portátil Lenovo ThinkPad L590: Um portátil empresarial com bons dispositivos de entrada
Avaliação | Data | Modelo | Peso | Altura | Size | Resolução | Preço |
|---|---|---|---|---|---|---|---|
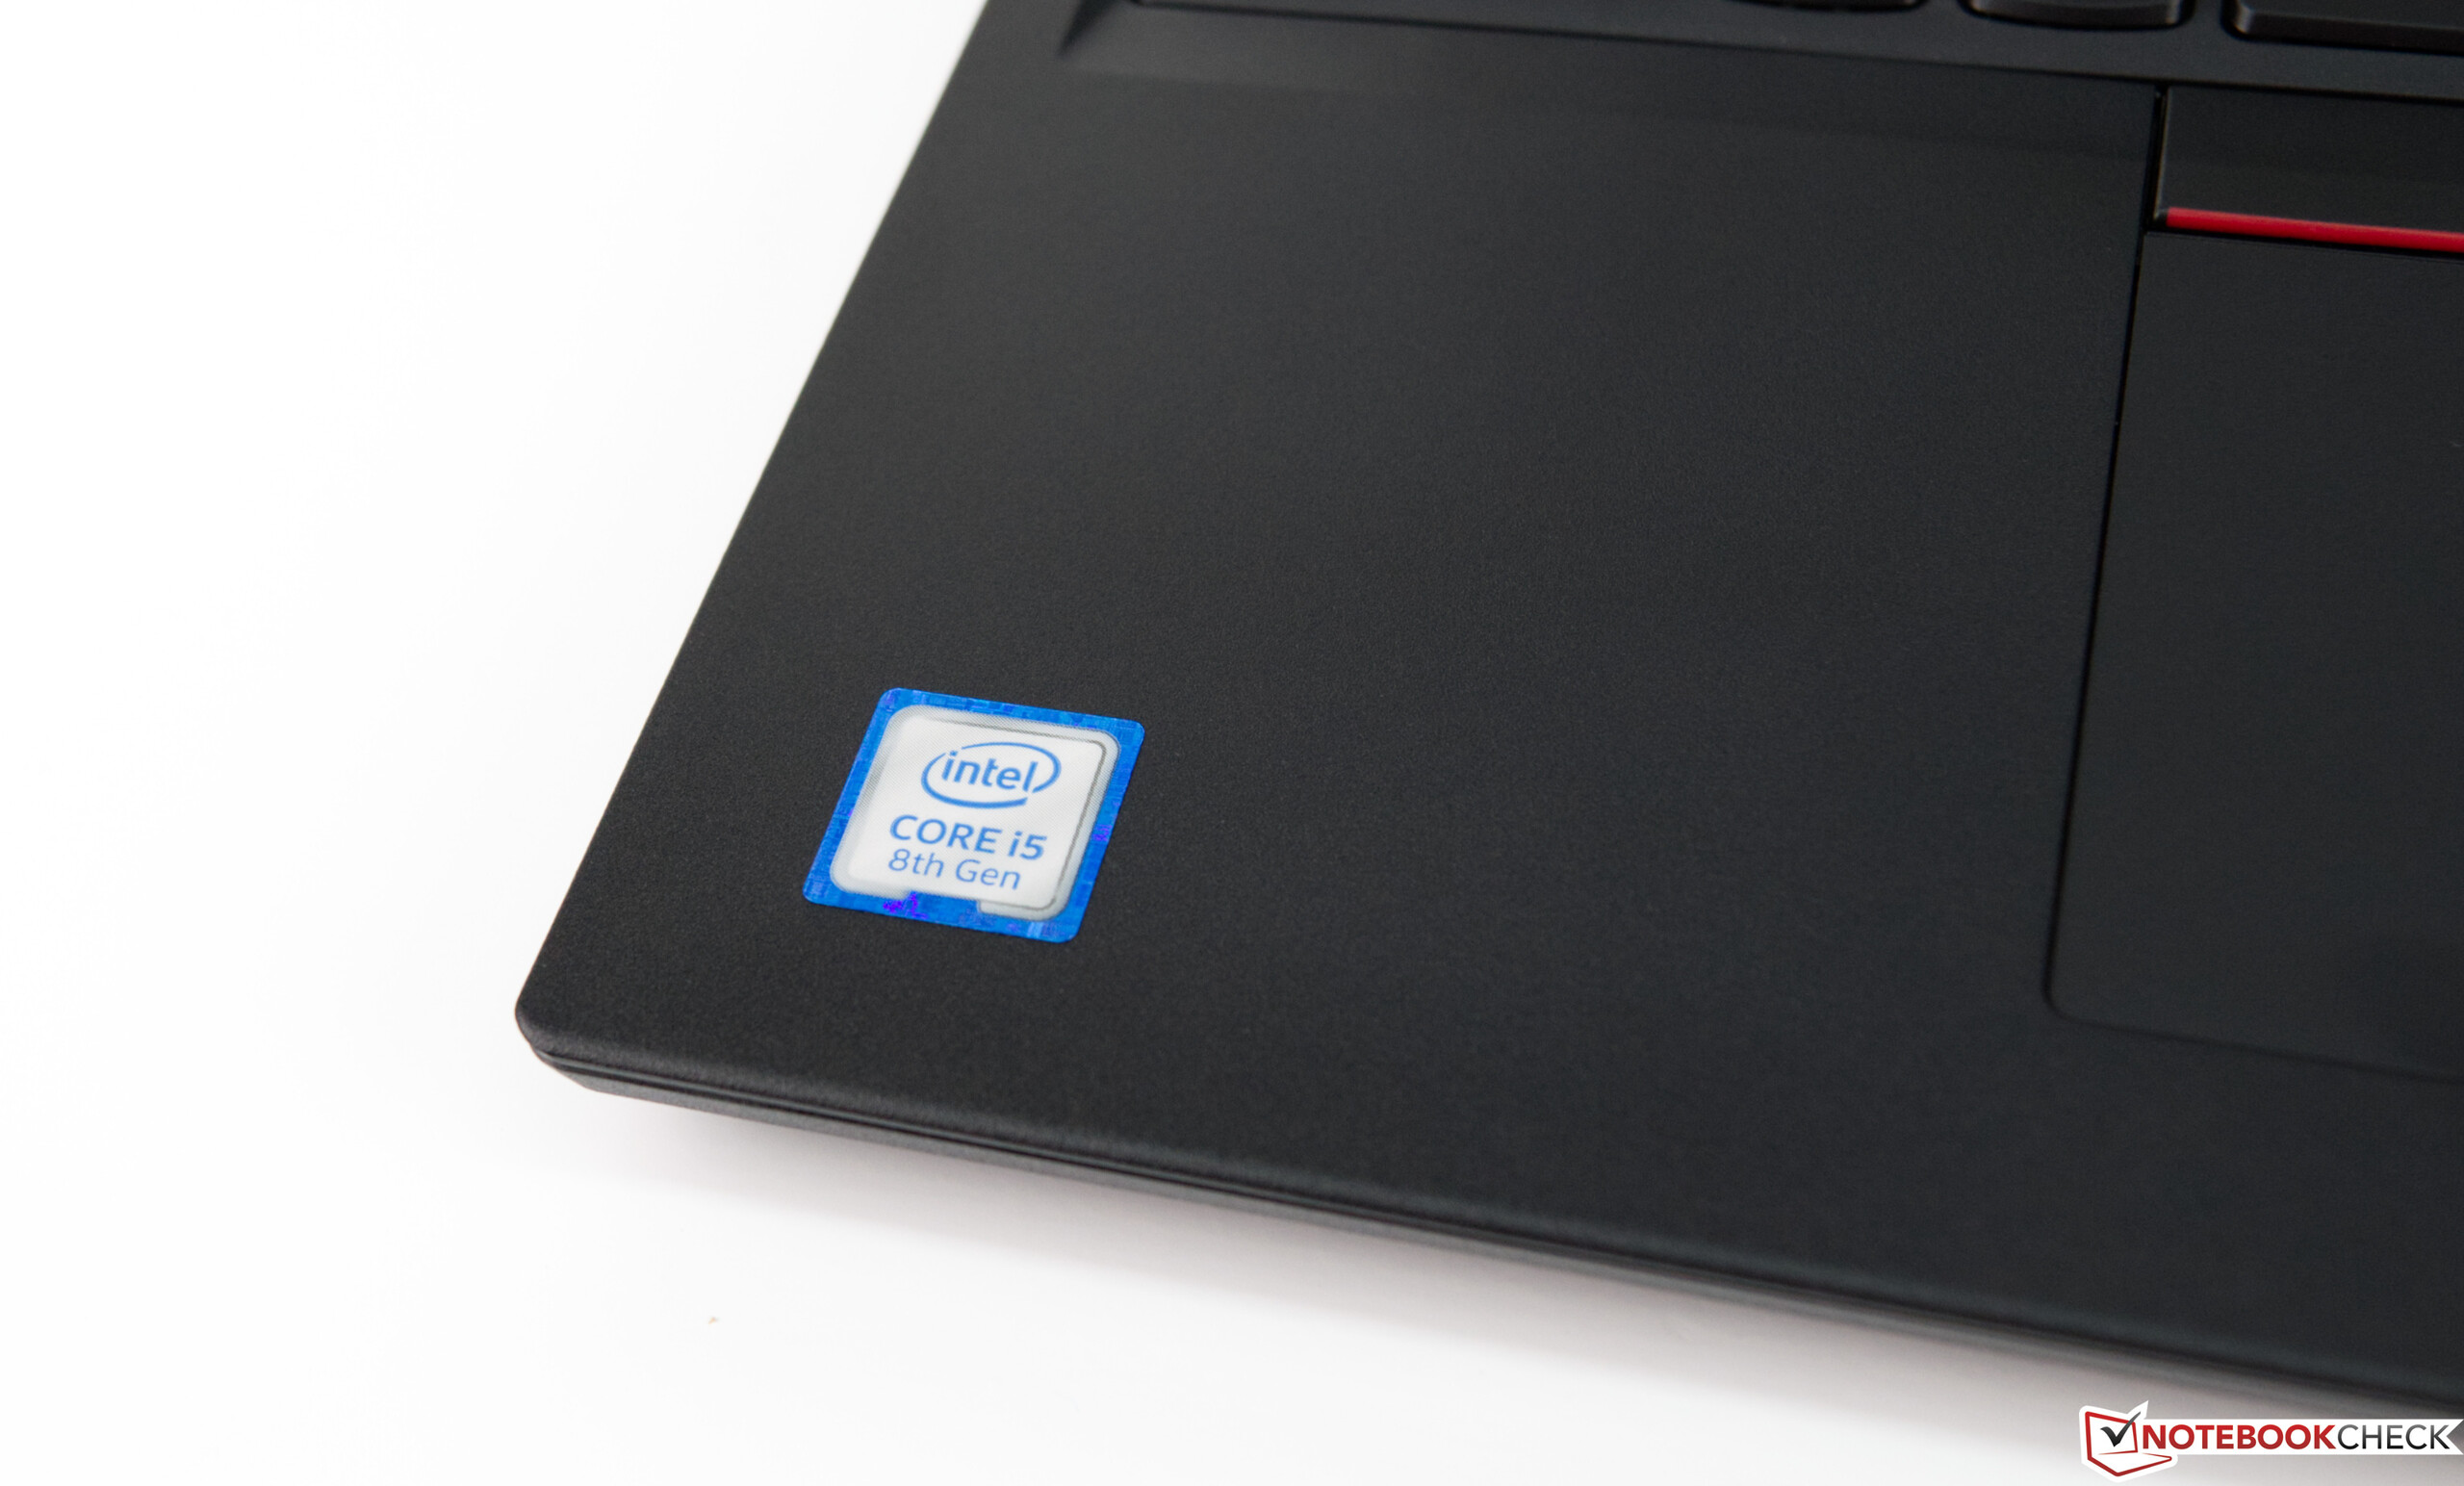
| 83.2 % v7 (old) | 11/2019 | Lenovo ThinkPad L590-20Q70019GE i5-8265U, UHD Graphics 620 | 2 kg | 23 mm | 15.60" | 1920x1080 | |
| 84.3 % v7 (old) | 07/2018 | Lenovo ThinkPad L580-20LW000VGE i5-8250U, UHD Graphics 620 | 2 kg | 23 mm | 15.60" | 1920x1080 | |
| 82.6 % v6 (old) | Schenker Slim 15-RE-E19 i5-8265U, UHD Graphics 620 | 1.5 kg | 19.9 mm | 15.60" | 2x1 | ||
| 83.4 % v7 (old) | 03/2019 | Lenovo ThinkPad E590-20NC0003GE i7-8565U, UHD Graphics 620 | 1.9 kg | 19.9 mm | 15.60" | 1920x1080 | |
| 83.9 % v6 (old) | Tuxedo Book BU1307 i5-8550U, UHD Graphics 620 | 1.4 kg | 21 mm | 13.30" | 1920x1080 | ||
| 84 % v7 (old) | 01/2019 | Acer TravelMate X3410-M-50DD i5-8550U, GeForce MX130 | 1.7 kg | 19.9 mm | 14.00" | 1920x1080 |


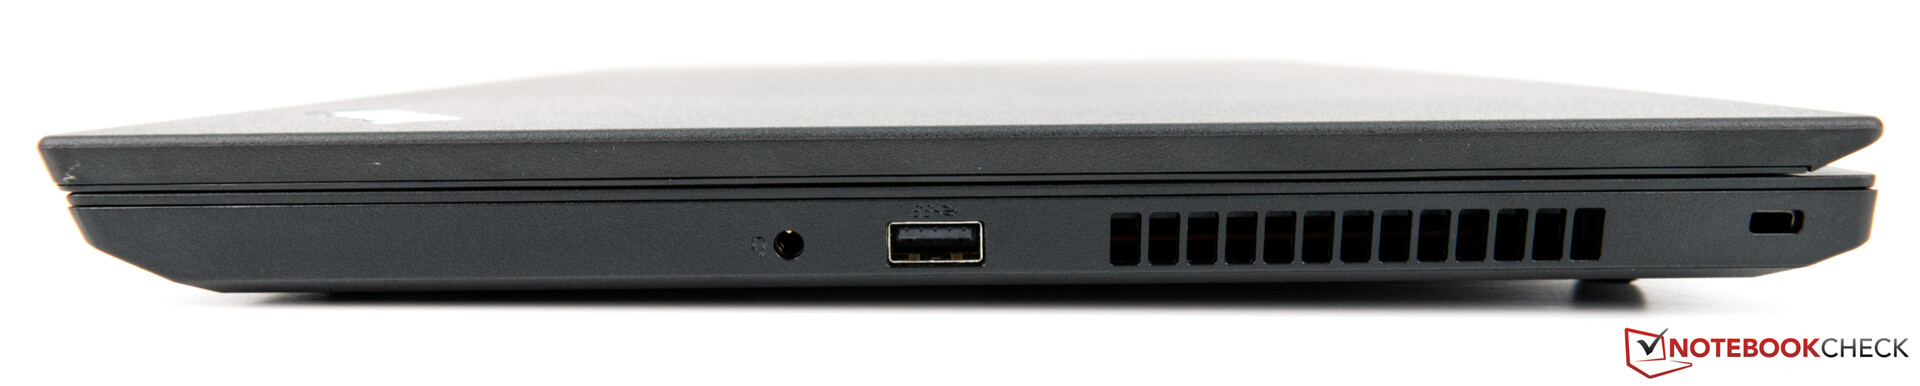
| SD Card Reader | |
| average JPG Copy Test (av. of 3 runs) | |
| Lenovo ThinkPad E590-20NC0003GE (Toshiba Exceria Pro M501 64 GB UHS-II) | |
| Lenovo ThinkPad L580-20LW000VGE (Toshiba Exceria Pro M501) | |
| Lenovo ThinkPad L590-20Q70019GE (Toshiba Exceria Pro M501 64 GB UHS-II) | |
| Schenker Slim 15-RE-E19 (Toshiba Exceria Pro SDXC 64 GB UHS-II) | |
| Média da turma Office (22.4 - 198.5, n=22, últimos 2 anos) | |
| Tuxedo Book BU1307 (Toshiba Exceria Pro SDXC 64 GB UHS-II) | |
| Acer TravelMate X3410-M-50DD (Toshiba Exceria Pro SDXC 64 GB UHS-II) | |
| maximum AS SSD Seq Read Test (1GB) | |
| Lenovo ThinkPad L580-20LW000VGE (Toshiba Exceria Pro M501) | |
| Lenovo ThinkPad E590-20NC0003GE (Toshiba Exceria Pro M501 64 GB UHS-II) | |
| Lenovo ThinkPad L590-20Q70019GE (Toshiba Exceria Pro M501 64 GB UHS-II) | |
| Schenker Slim 15-RE-E19 (Toshiba Exceria Pro SDXC 64 GB UHS-II) | |
| Média da turma Office (27.4 - 249, n=20, últimos 2 anos) | |
| Acer TravelMate X3410-M-50DD (Toshiba Exceria Pro SDXC 64 GB UHS-II) | |
| Networking | |
| iperf3 transmit AX12 | |
| Lenovo ThinkPad E590-20NC0003GE | |
| Schenker Slim 15-RE-E19 | |
| Lenovo ThinkPad L590-20Q70019GE | |
| Acer TravelMate X3410-M-50DD | |
| Lenovo ThinkPad L580-20LW000VGE | |
| iperf3 receive AX12 | |
| Lenovo ThinkPad L590-20Q70019GE | |
| Lenovo ThinkPad L580-20LW000VGE | |
| Lenovo ThinkPad E590-20NC0003GE | |
| Schenker Slim 15-RE-E19 | |
| Acer TravelMate X3410-M-50DD | |
| |||||||||||||||||||||||||
iluminação: 81 %
iluminação com acumulador: 245 cd/m²
Contraste: 1372:1 (Preto: 0.18 cd/m²)
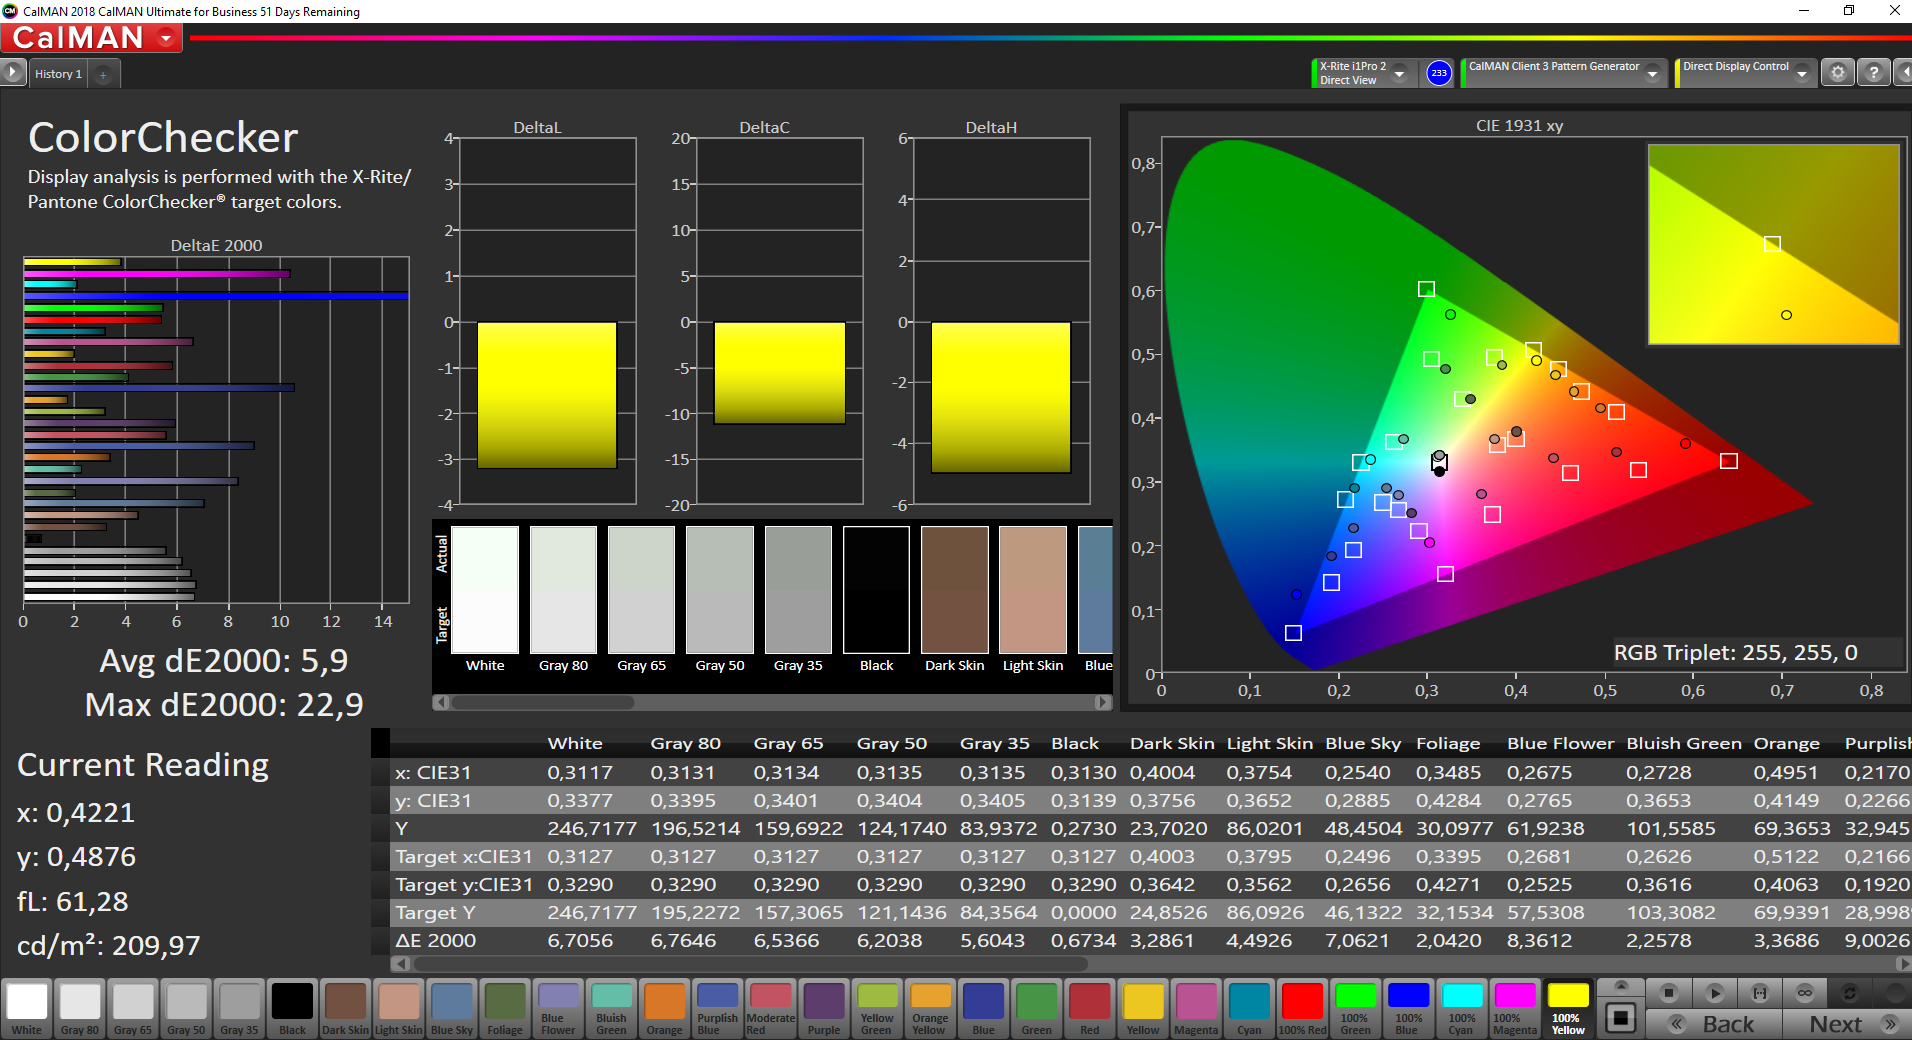
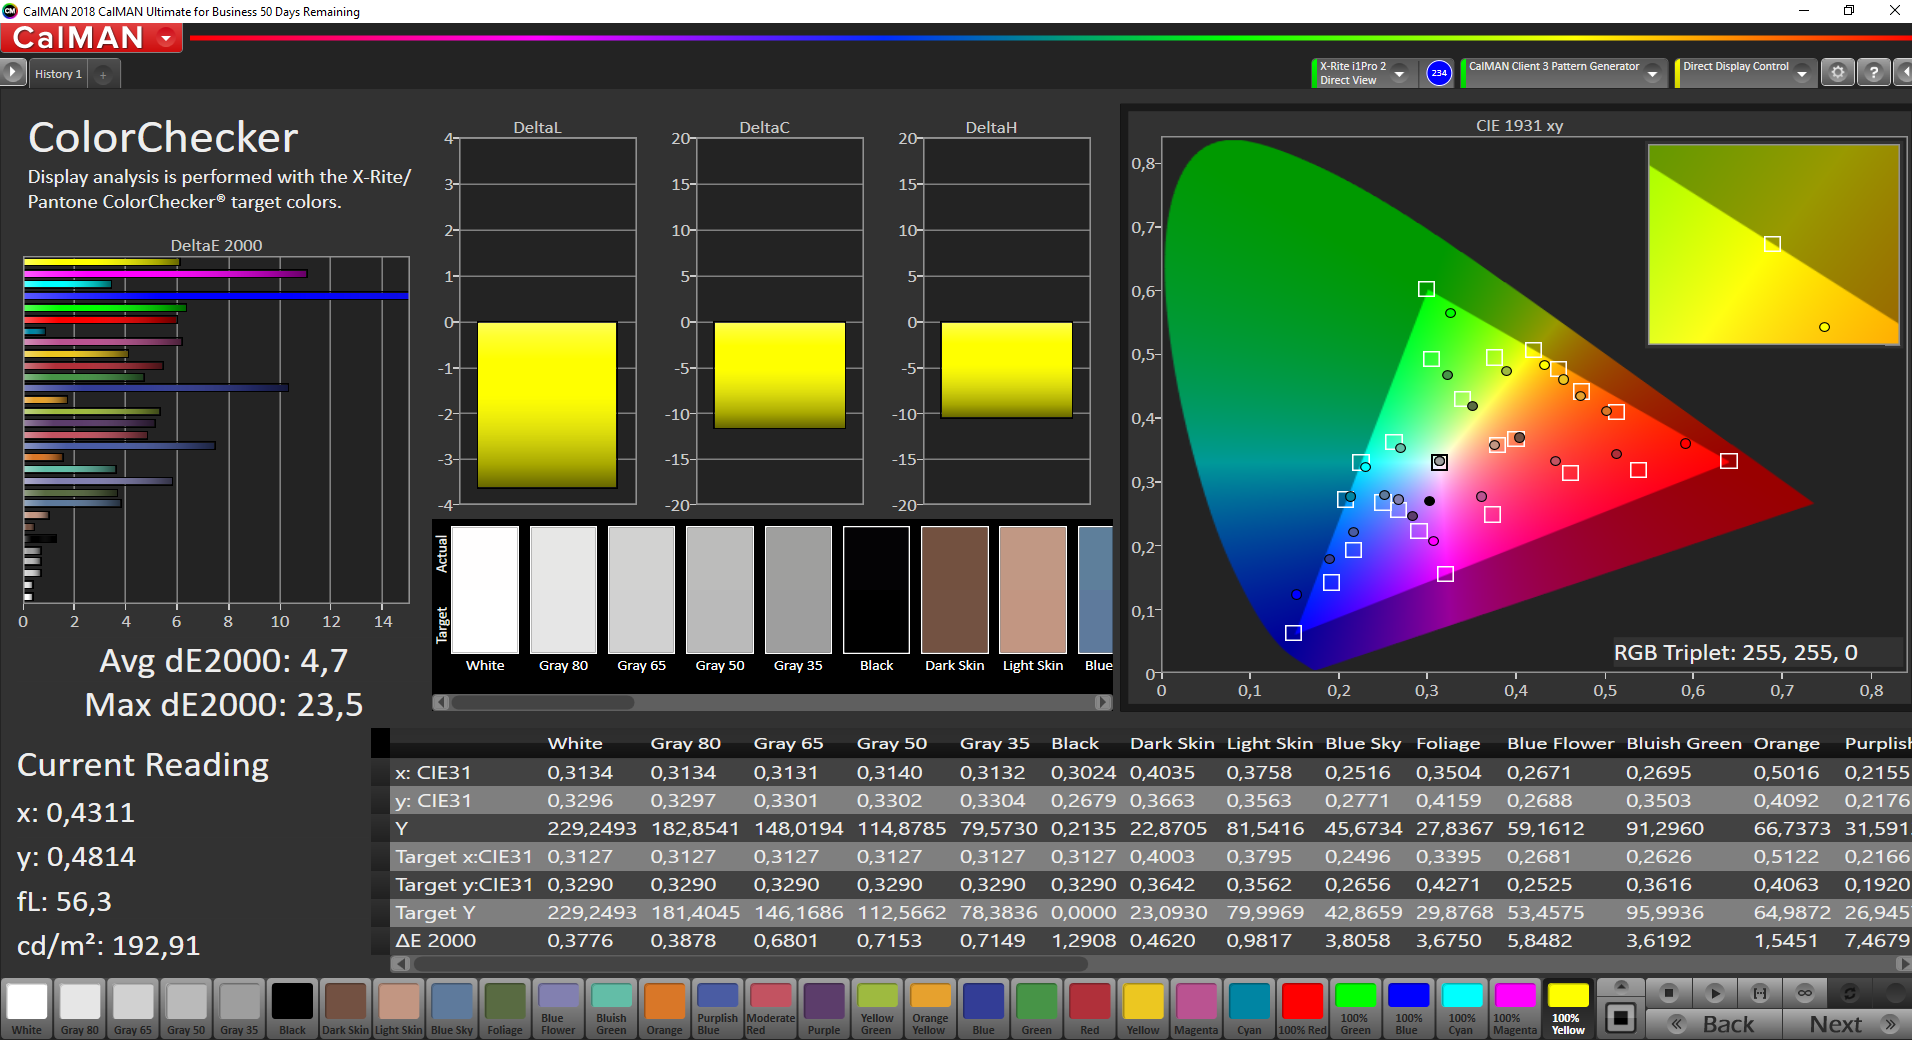
ΔE ColorChecker Calman: 5.9 | ∀{0.5-29.43 Ø4.73}
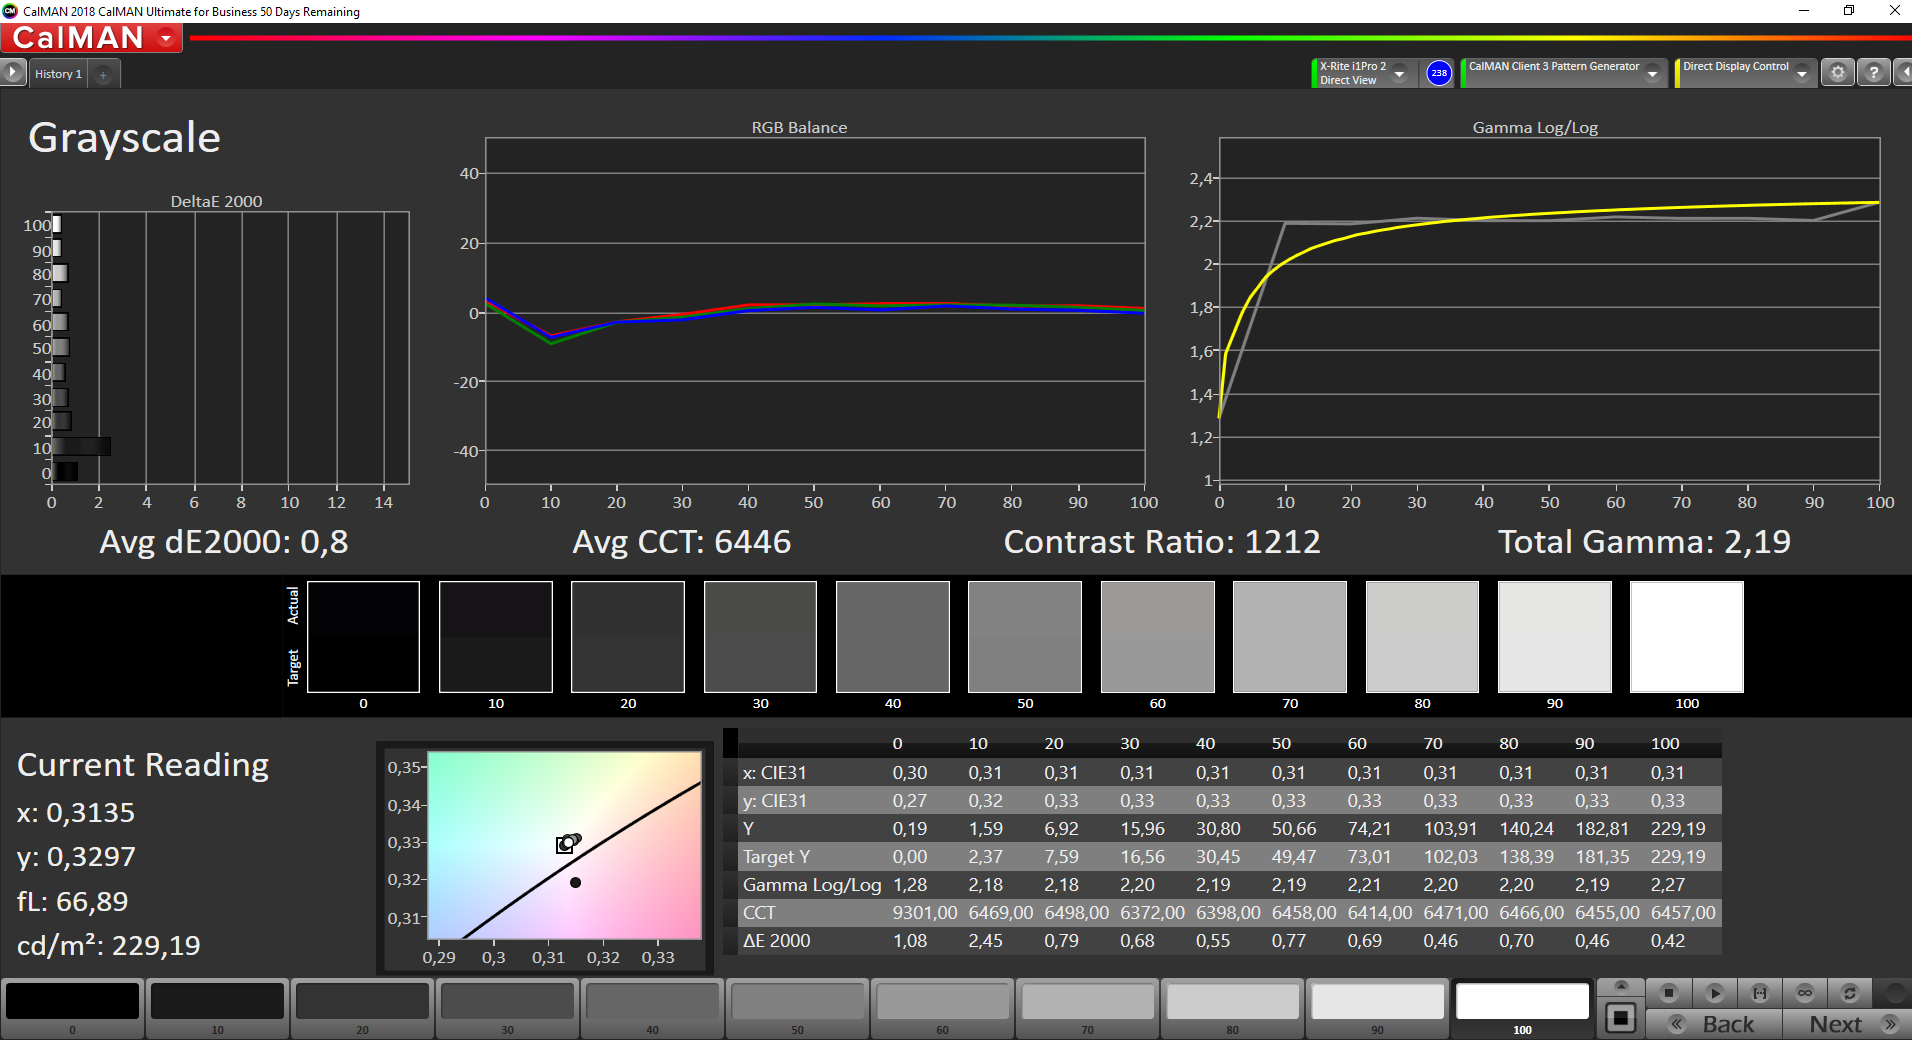
calibrated: 4.7
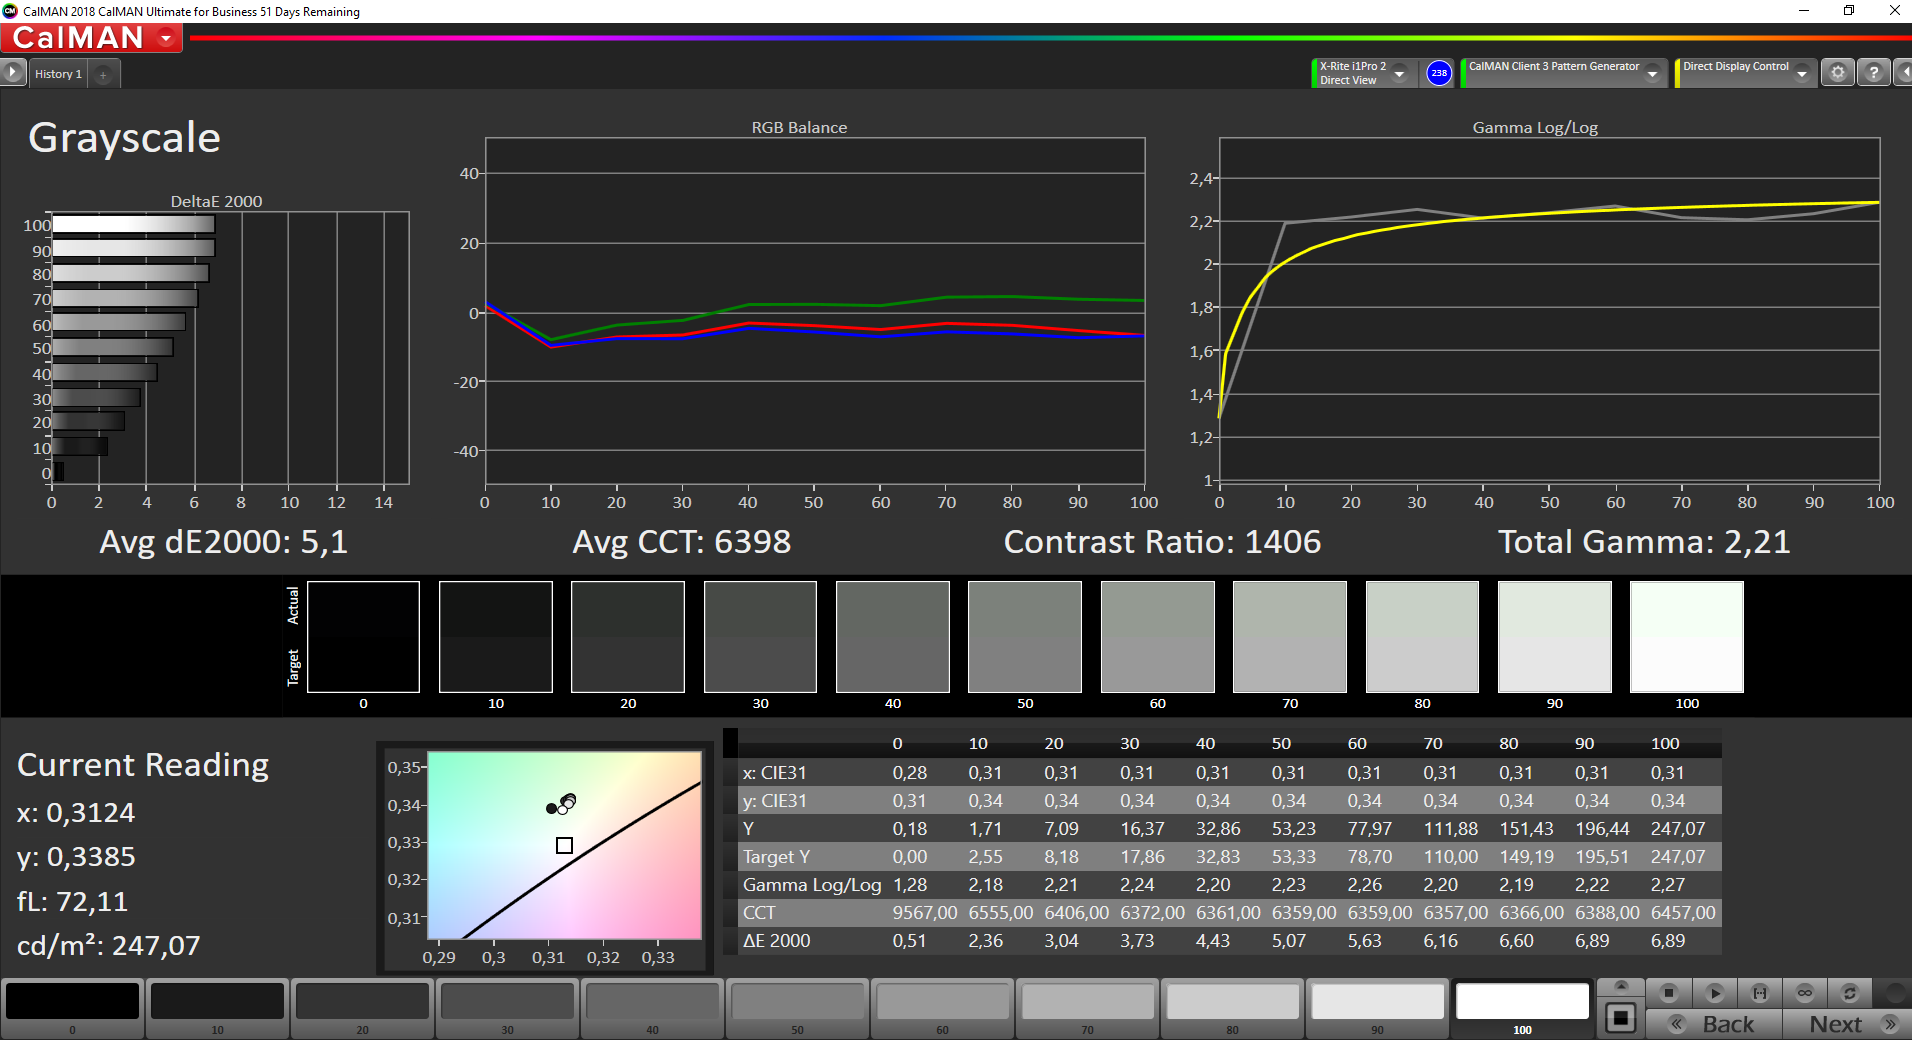
ΔE Greyscale Calman: 5.1 | ∀{0.09-98 Ø4.97}
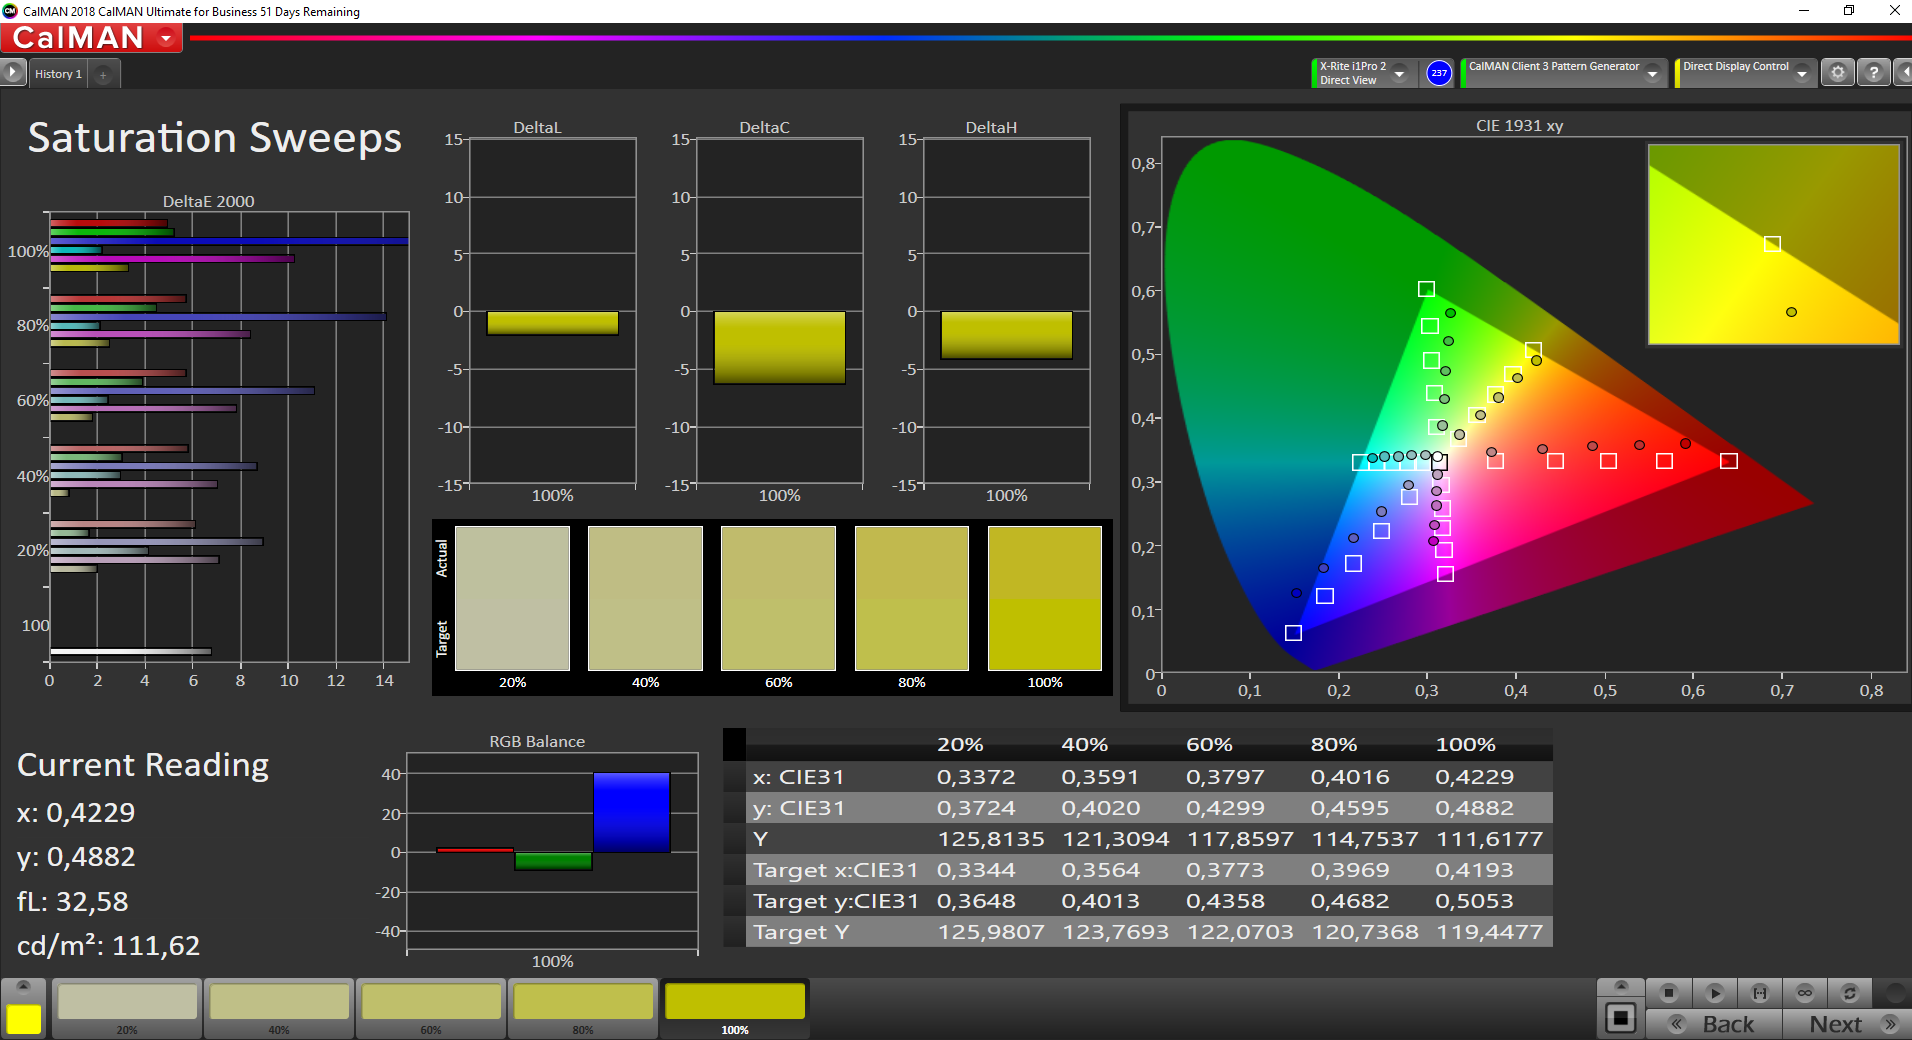
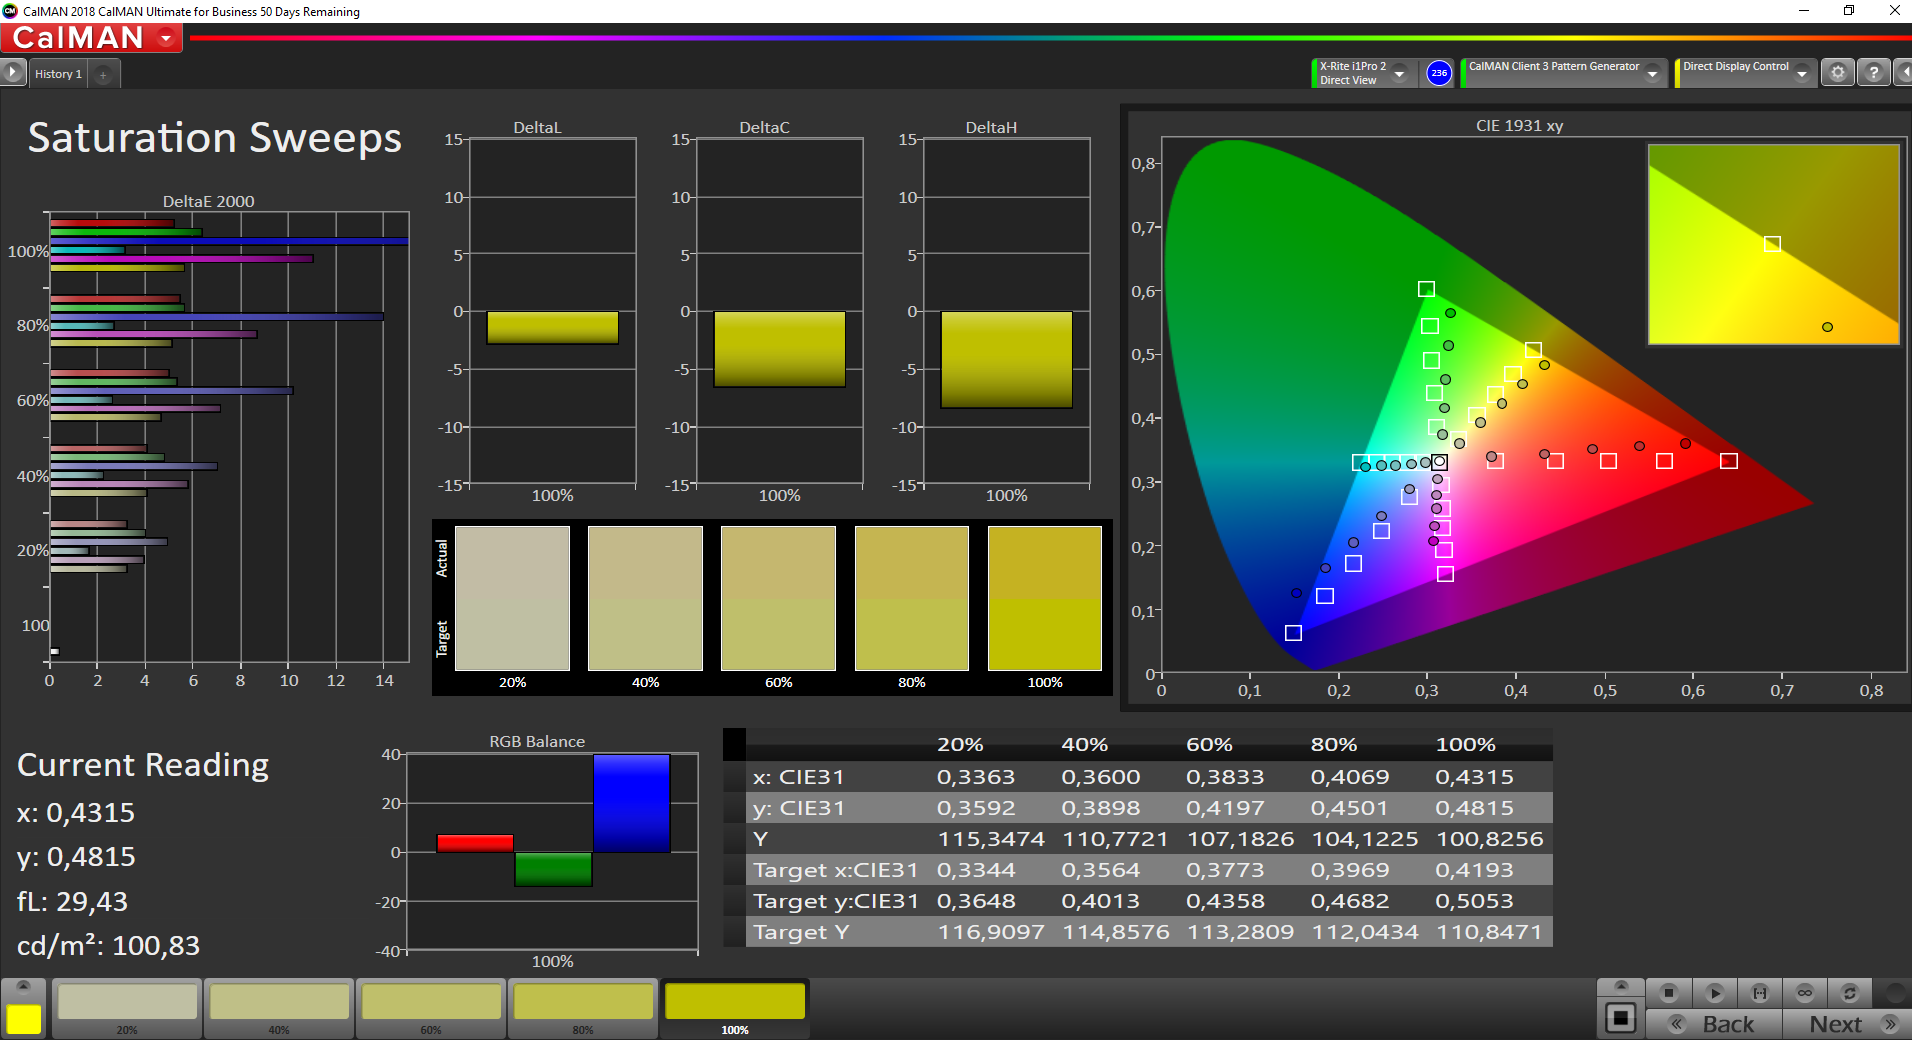
64.1% sRGB (Argyll 1.6.3 3D)
41.2% AdobeRGB 1998 (Argyll 1.6.3 3D)
44.81% AdobeRGB 1998 (Argyll 3D)
64.4% sRGB (Argyll 3D)
43.3% Display P3 (Argyll 3D)
Gamma: 2.21
CCT: 6398 K
| Lenovo ThinkPad L590-20Q70019GE N156HCE-EAA, IPS, 1920x1080, 15.6" | Lenovo ThinkPad L580-20LW000VGE N156HCE-EAA, IPS, 1920x1080, 15.6" | Schenker Slim 15-RE-E19 Chi Mei CMN15E8, IPS, 2x1, 15.6" | Lenovo ThinkPad E590-20NC0003GE LP156WFC-SPDB, IPS LED, 1920x1080, 15.6" | Tuxedo Book BU1307 AUO272D, IPS, 1920x1080, 13.3" | Acer TravelMate X3410-M-50DD N140HCA-EAC, IPS LED, 1920x1080, 14" | |
|---|---|---|---|---|---|---|
| Display | -1% | 42% | -12% | -3% | ||
| Display P3 Coverage (%) | 43.3 | 42.86 -1% | 63.7 47% | 38.21 -12% | 41.96 -3% | |
| sRGB Coverage (%) | 64.4 | 64.4 0% | 87.7 36% | 57.5 -11% | 63 -2% | |
| AdobeRGB 1998 Coverage (%) | 44.81 | 44.29 -1% | 63.9 43% | 39.47 -12% | 43.37 -3% | |
| Response Times | 16% | 18% | 9% | 27% | 3% | |
| Response Time Grey 50% / Grey 80% * (ms) | 42.8 ? | 33.6 ? 21% | 37 ? 14% | 40 ? 7% | 34 ? 21% | 42 ? 2% |
| Response Time Black / White * (ms) | 30.8 ? | 27.6 ? 10% | 24 ? 22% | 27.6 ? 10% | 21 ? 32% | 30 ? 3% |
| PWM Frequency (Hz) | 24510 ? | 24750 ? | 25000 ? | 400 ? | 24500 ? | |
| Screen | 13% | 11% | 5% | -9% | 24% | |
| Brightness middle (cd/m²) | 247 | 269 9% | 289 17% | 254 3% | 333 35% | 255 3% |
| Brightness (cd/m²) | 228 | 237 4% | 280 23% | 251 10% | 319 40% | 218 -4% |
| Brightness Distribution (%) | 81 | 80 -1% | 87 7% | 90 11% | 83 2% | 72 -11% |
| Black Level * (cd/m²) | 0.18 | 0.21 -17% | 0.36 -100% | 0.2 -11% | 0.3 -67% | 0.08 56% |
| Contrast (:1) | 1372 | 1281 -7% | 803 -41% | 1270 -7% | 1110 -19% | 3188 132% |
| Colorchecker dE 2000 * | 5.9 | 3.9 34% | 3.93 33% | 5.6 5% | 5.01 15% | |
| Colorchecker dE 2000 max. * | 22.9 | 16.3 29% | 6.98 70% | 15.4 33% | 17.44 24% | |
| Colorchecker dE 2000 calibrated * | 4.7 | 3.7 21% | 4.9 -4% | 4.06 14% | ||
| Greyscale dE 2000 * | 5.1 | 1.5 71% | 3.73 27% | 3.1 39% | 7.35 -44% | 3 41% |
| Gamma | 2.21 100% | 2.21 100% | 2.42 91% | 2.22 99% | 2.35 94% | 2.26 97% |
| CCT | 6398 102% | 6332 103% | 6802 96% | 6450 101% | 7156 91% | 6185 105% |
| Color Space (Percent of AdobeRGB 1998) (%) | 41.2 | 40.8 -1% | 57 38% | 36.3 -12% | 40 -3% | |
| Color Space (Percent of sRGB) (%) | 64.1 | 64.3 0% | 87 36% | 57.1 -11% | 63 -2% | |
| Média Total (Programa/Configurações) | 9% /
11% | 24% /
18% | 1% /
2% | 9% /
0% | 8% /
16% |
* ... menor é melhor
Exibir tempos de resposta
| ↔ Tempo de resposta preto para branco | ||
|---|---|---|
| 30.8 ms ... ascensão ↗ e queda ↘ combinadas | ↗ 18 ms ascensão | 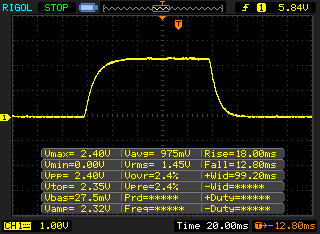 |
| ↘ 12.8 ms queda | ||
| A tela mostra taxas de resposta lentas em nossos testes e será insatisfatória para os jogadores. Em comparação, todos os dispositivos testados variam de 0.1 (mínimo) a 240 (máximo) ms. » 83 % de todos os dispositivos são melhores. Isso significa que o tempo de resposta medido é pior que a média de todos os dispositivos testados (19.9 ms). | ||
| ↔ Tempo de resposta 50% cinza a 80% cinza | ||
| 42.8 ms ... ascensão ↗ e queda ↘ combinadas | ↗ 22.8 ms ascensão | 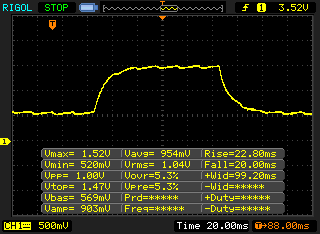 |
| ↘ 20 ms queda | ||
| A tela mostra taxas de resposta lentas em nossos testes e será insatisfatória para os jogadores. Em comparação, todos os dispositivos testados variam de 0.165 (mínimo) a 636 (máximo) ms. » 70 % de todos os dispositivos são melhores. Isso significa que o tempo de resposta medido é pior que a média de todos os dispositivos testados (31.1 ms). | ||
Cintilação da tela / PWM (modulação por largura de pulso)
| Tela tremeluzindo/PWM detectado | 24510 Hz | ≤ 40 % configuração de brilho | 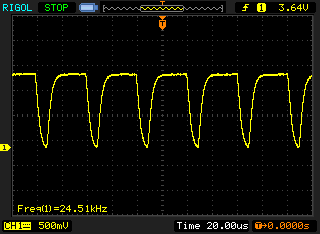 |
A luz de fundo da tela pisca em 24510 Hz (pior caso, por exemplo, utilizando PWM) Cintilação detectada em uma configuração de brilho de 40 % e abaixo. Não deve haver cintilação ou PWM acima desta configuração de brilho. A frequência de 24510 Hz é bastante alta, então a maioria dos usuários sensíveis ao PWM não deve notar nenhuma oscilação. [pwm_comparison] Em comparação: 52 % de todos os dispositivos testados não usam PWM para escurecer a tela. Se PWM foi detectado, uma média de 7798 (mínimo: 5 - máximo: 343500) Hz foi medida. | |||

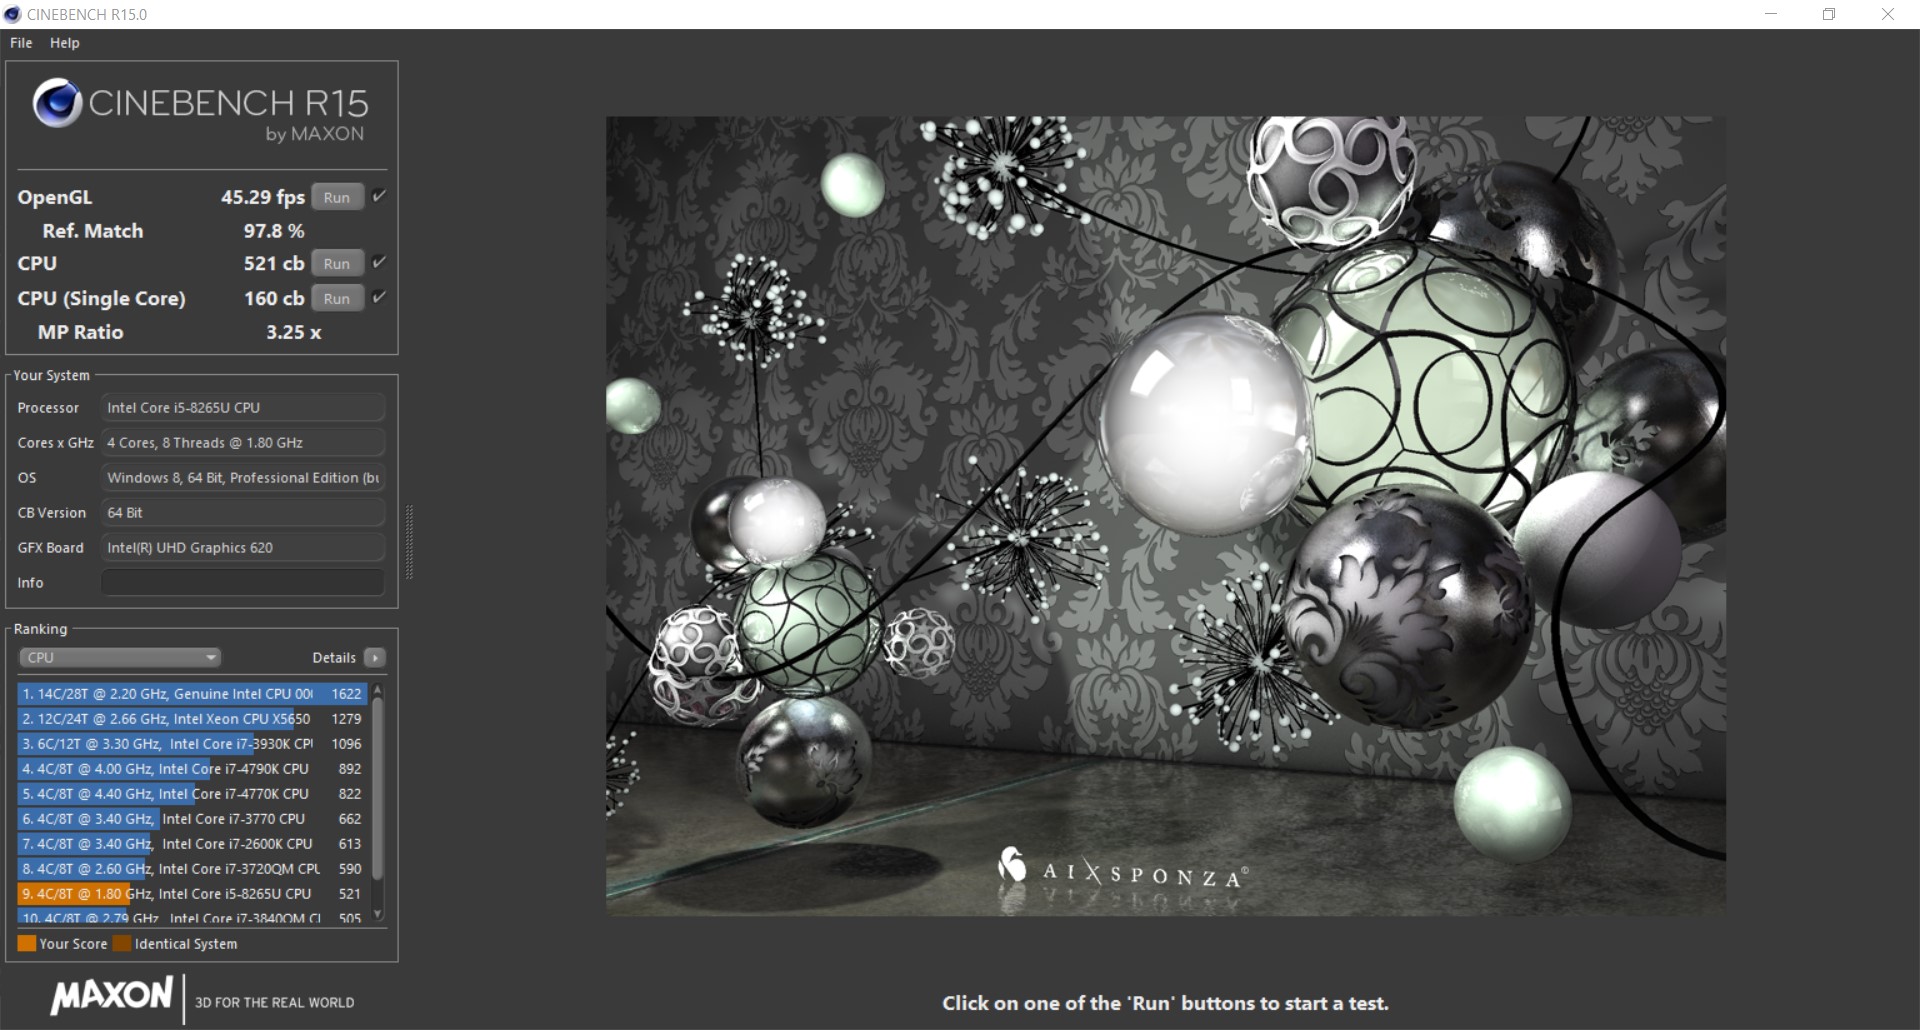
| Cinebench R15 | |
| CPU Single 64Bit | |
| Lenovo ThinkPad E590-20NC0003GE | |
| Acer TravelMate X3410-M-50DD | |
| Schenker Slim 15-RE-E19 | |
| Lenovo ThinkPad L590-20Q70019GE | |
| Média Intel Core i5-8265U (111 - 164, n=35) | |
| Tuxedo Book BU1307 | |
| Lenovo ThinkPad L580-20LW000VGE | |
| CPU Multi 64Bit | |
| Média Intel Core i5-8265U (457 - 750, n=38) | |
| Lenovo ThinkPad L580-20LW000VGE | |
| Schenker Slim 15-RE-E19 | |
| Lenovo ThinkPad E590-20NC0003GE | |
| Tuxedo Book BU1307 | |
| Acer TravelMate X3410-M-50DD | |
| Lenovo ThinkPad L590-20Q70019GE | |
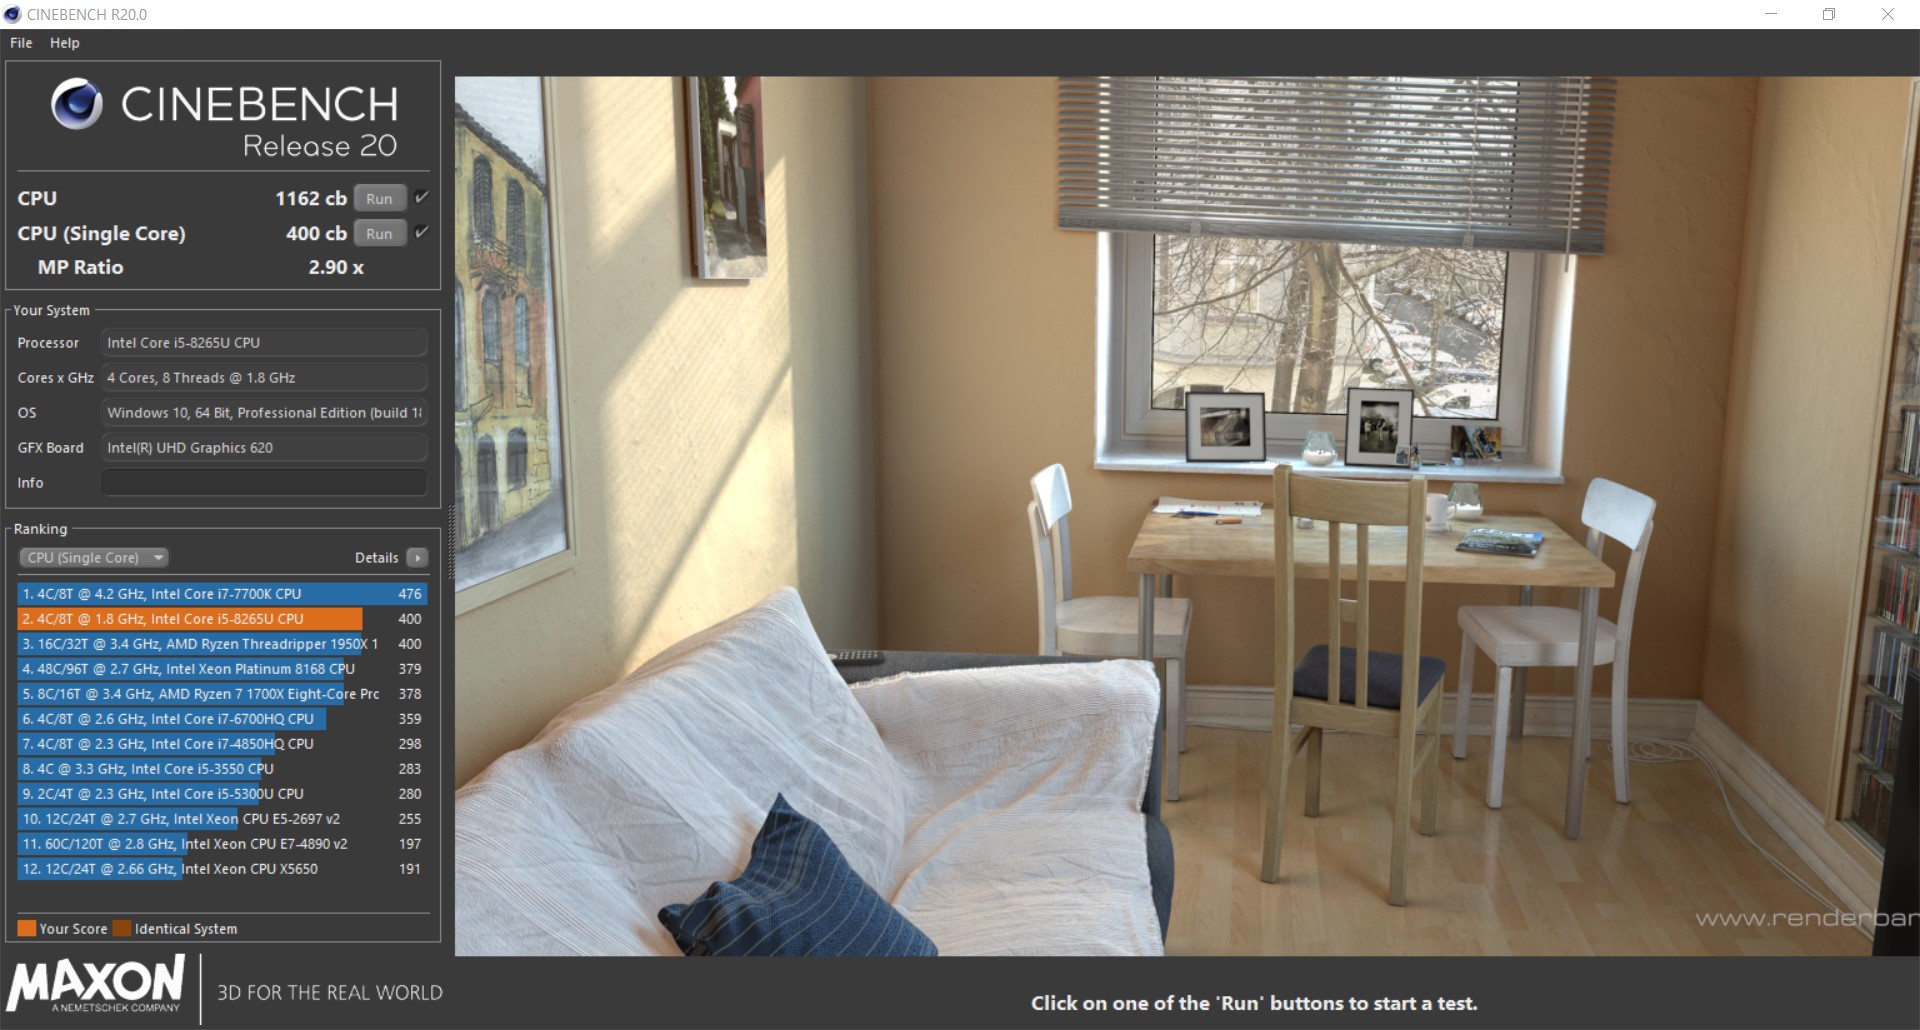
| Cinebench R20 | |
| CPU (Single Core) | |
| Lenovo ThinkPad L590-20Q70019GE | |
| Média Intel Core i5-8265U (325 - 403, n=16) | |
| CPU (Multi Core) | |
| Média Intel Core i5-8265U (972 - 1564, n=16) | |
| Lenovo ThinkPad L590-20Q70019GE | |
| 3DMark 11 - 1280x720 Performance Physics | |
| Schenker Slim 15-RE-E19 | |
| Média Intel Core i5-8265U (4154 - 8443, n=35) | |
| Lenovo ThinkPad L580-20LW000VGE | |
| Tuxedo Book BU1307 | |
| Acer TravelMate X3410-M-50DD | |
| Lenovo ThinkPad E590-20NC0003GE | |
| Lenovo ThinkPad L590-20Q70019GE | |
| Blender - v2.79 BMW27 CPU | |
| Lenovo ThinkPad L590-20Q70019GE | |
| Média Intel Core i5-8265U (769 - 1098, n=15) | |
| Geekbench 4.4 | |
| 64 Bit Single-Core Score | |
| Média Intel Core i5-8265U (2106 - 4830, n=19) | |
| Lenovo ThinkPad L590-20Q70019GE | |
| Lenovo ThinkPad L590-20Q70019GE | |
| 64 Bit Multi-Core Score | |
| Média Intel Core i5-8265U (7144 - 16249, n=19) | |
| Lenovo ThinkPad L590-20Q70019GE | |
| Lenovo ThinkPad L590-20Q70019GE | |
| 7-Zip 18.03 | |
| 7z b 4 | |
| Média Intel Core i5-8265U (13731 - 18802, n=15) | |
| Lenovo ThinkPad L590-20Q70019GE | |
| 7z b 4 -mmt1 | |
| Média Intel Core i5-8265U (3780 - 4195, n=15) | |
| Lenovo ThinkPad L590-20Q70019GE | |
* ... menor é melhor
| PCMark 8 | |
| Home Score Accelerated v2 | |
| Média da turma Office (n=1últimos 2 anos) | |
| Acer TravelMate X3410-M-50DD | |
| Tuxedo Book BU1307 | |
| Schenker Slim 15-RE-E19 | |
| Média Intel Core i5-8265U, Intel UHD Graphics 620 (2747 - 4244, n=24) | |
| Lenovo ThinkPad L580-20LW000VGE | |
| Lenovo ThinkPad L590-20Q70019GE | |
| Lenovo ThinkPad E590-20NC0003GE | |
| Work Score Accelerated v2 | |
| Média da turma Office (n=1últimos 2 anos) | |
| Acer TravelMate X3410-M-50DD | |
| Média Intel Core i5-8265U, Intel UHD Graphics 620 (3132 - 4927, n=23) | |
| Lenovo ThinkPad L580-20LW000VGE | |
| Lenovo ThinkPad E590-20NC0003GE | |
| Lenovo ThinkPad L590-20Q70019GE | |
| PCMark 8 Home Score Accelerated v2 | 2747 pontos | |
| PCMark 8 Creative Score Accelerated v2 | 3504 pontos | |
| PCMark 8 Work Score Accelerated v2 | 3132 pontos | |
| PCMark 10 Score | 2247 pontos | |
Ajuda | ||
| Lenovo ThinkPad L590-20Q70019GE Toshiba XG6 KXG6AZNV512G | Lenovo ThinkPad L580-20LW000VGE Samsung PM961 MZVLW256HEHP | Schenker Slim 15-RE-E19 Samsung SSD 970 EVO Plus 500GB | Lenovo ThinkPad E590-20NC0003GE Toshiba KBG30ZMT512G | Tuxedo Book BU1307 Samsung SSD 970 EVO 250GB | Acer TravelMate X3410-M-50DD Micron 1100 MTFDDAV256TBN | Média Toshiba XG6 KXG6AZNV512G | |
|---|---|---|---|---|---|---|---|
| CrystalDiskMark 5.2 / 6 | -0% | 45% | -45% | 16% | -58% | 31% | |
| Write 4K (MB/s) | 115.3 | 117 1% | 187.2 62% | 53.4 -54% | 158.2 37% | 85.4 -26% | 139 ? 21% |
| Read 4K (MB/s) | 43.34 | 41.47 -4% | 51.8 20% | 33.03 -24% | 38.78 -11% | 26.4 -39% | 45.8 ? 6% |
| Write Seq (MB/s) | 1014 | 791 -22% | 1438 42% | 624 -38% | 1487 47% | 402.5 -60% | 1628 ? 61% |
| Read Seq (MB/s) | 1481 | 1390 -6% | 1347 -9% | 835 -44% | 913 -38% | 461.2 -69% | 1647 ? 11% |
| Write 4K Q32T1 (MB/s) | 495.4 | 651 31% | 396.7 -20% | 87.4 -82% | 330.5 -33% | 175.8 -65% | 547 ? 10% |
| Read 4K Q32T1 (MB/s) | 332.6 | 408.9 23% | 534 61% | 135.9 -59% | 423.8 27% | 228.8 -31% | 436 ? 31% |
| Write Seq Q32T1 (MB/s) | 1654 | 1227 -26% | 3280 98% | 784 -53% | 1540 -7% | 442.9 -73% | 2522 ? 52% |
| Read Seq Q32T1 (MB/s) | 1746 | 1779 2% | 3556 104% | 1623 -7% | 3556 104% | 522 -70% | 2739 ? 57% |
| Write 4K Q8T8 (MB/s) | 1033 | 309 -70% | 1266 ? 23% | ||||
| Read 4K Q8T8 (MB/s) | 892 | 247.1 -72% | 1212 ? 36% | ||||
| AS SSD | -10% | 52% | -58% | -723% | -50% | 18% | |
| Seq Read (MB/s) | 1383 | 1315 -5% | 2661 92% | 1348 -3% | 2406 74% | 492.9 -64% | 2383 ? 72% |
| Seq Write (MB/s) | 852 | 741 -13% | 2426 185% | 789 -7% | 435.1 -49% | 462.2 -46% | 1459 ? 71% |
| 4K Read (MB/s) | 45.72 | 45.28 -1% | 59 29% | 38.82 -15% | 50.2 10% | 26.89 -41% | 46.8 ? 2% |
| 4K Write (MB/s) | 120.2 | 119.9 0% | 166 38% | 81.8 -32% | 1.45 -99% | 85.1 -29% | 125.1 ? 4% |
| 4K-64 Read (MB/s) | 1344 | 1186 -12% | 1314 -2% | 825 -39% | 818 -39% | 234.2 -83% | 1294 ? -4% |
| 4K-64 Write (MB/s) | 926 | 456.3 -51% | 1494 61% | 488 -47% | 145.6 -84% | 312.8 -66% | 1276 ? 38% |
| Access Time Read * (ms) | 0.063 | 0.043 32% | 0.046 27% | 0.081 -29% | 0.047 25% | 0.0825 ? -31% | |
| Access Time Write * (ms) | 0.036 | 0.029 19% | 0.023 36% | 0.188 -422% | 2.784 -7633% | 0.056 -56% | 0.0335 ? 7% |
| Score Read (Points) | 1528 | 1363 -11% | 1639 7% | 999 -35% | 1108 -27% | 310 -80% | 1580 ? 3% |
| Score Write (Points) | 1132 | 650 -43% | 1902 68% | 649 -43% | 191 -83% | 444 -61% | 1547 ? 37% |
| Score Total (Points) | 3420 | 2689 -21% | 4379 28% | 2139 -37% | 1780 -48% | 922 -73% | 3893 ? 14% |
| Copy ISO MB/s (MB/s) | 1147 | 876 -24% | 923 -20% | 1645 ? 43% | |||
| Copy Program MB/s (MB/s) | 419.8 | 209.7 -50% | 453.6 8% | 425 ? 1% | |||
| Copy Game MB/s (MB/s) | 928 | 599 -35% | 523 -44% | 933 ? 1% | |||
| Média Total (Programa/Configurações) | -5% /
-6% | 49% /
49% | -52% /
-54% | -354% /
-412% | -54% /
-53% | 25% /
24% |
* ... menor é melhor

| 3DMark 11 - 1280x720 Performance GPU | |
| Média da turma Office (2551 - 18313, n=68, últimos 2 anos) | |
| Acer TravelMate X3410-M-50DD | |
| Lenovo ThinkPad E590-20NC0003GE | |
| Schenker Slim 15-RE-E19 | |
| Média Intel UHD Graphics 620 (1144 - 3432, n=244) | |
| Lenovo ThinkPad L590-20Q70019GE | |
| Lenovo ThinkPad L580-20LW000VGE | |
| Tuxedo Book BU1307 | |
| 3DMark 11 Performance | 1846 pontos | |
| 3DMark Ice Storm Standard Score | 41848 pontos | |
| 3DMark Cloud Gate Standard Score | 6555 pontos | |
| 3DMark Fire Strike Score | 1043 pontos | |
| 3DMark Fire Strike Extreme Score | 501 pontos | |
| 3DMark Time Spy Score | 412 pontos | |
Ajuda | ||
| baixo | média | alto | ultra | |
|---|---|---|---|---|
| BioShock Infinite (2013) | 56 | 31 | 24 | 8 |
| Dota 2 Reborn (2015) | 60.4 | 36.7 | 18 | 16.2 |
| Rise of the Tomb Raider (2016) | 16.6 | 12.3 | 6.5 | |
| X-Plane 11.11 (2018) | 17.6 | 12.8 | 11.1 |
Barulho
| Ocioso |
| 29 / 29 / 29 dB |
| Carga |
| 29 / 33.8 dB |
 | ||
30 dB silencioso 40 dB(A) audível 50 dB(A) ruidosamente alto |
||
min: | ||
| Lenovo ThinkPad L590-20Q70019GE UHD Graphics 620, i5-8265U, Toshiba XG6 KXG6AZNV512G | Lenovo ThinkPad L580-20LW000VGE UHD Graphics 620, i5-8250U, Samsung PM961 MZVLW256HEHP | Schenker Slim 15-RE-E19 UHD Graphics 620, i5-8265U, Samsung SSD 970 EVO Plus 500GB | Lenovo ThinkPad E590-20NC0003GE UHD Graphics 620, i7-8565U, Toshiba KBG30ZMT512G | Tuxedo Book BU1307 UHD Graphics 620, i5-8550U, Samsung SSD 970 EVO 250GB | Acer TravelMate X3410-M-50DD GeForce MX130, i5-8550U, Micron 1100 MTFDDAV256TBN | |
|---|---|---|---|---|---|---|
| Noise | -7% | -19% | -0% | -7% | -9% | |
| desligado / ambiente * (dB) | 29 | 29.9 -3% | 30.4 -5% | 29.3 -1% | 30.5 -5% | 30.2 -4% |
| Idle Minimum * (dB) | 29 | 29.9 -3% | 30.4 -5% | 29.3 -1% | 30.5 -5% | 30.2 -4% |
| Idle Average * (dB) | 29 | 29.9 -3% | 30.4 -5% | 29.3 -1% | 30.8 -6% | 30.2 -4% |
| Idle Maximum * (dB) | 29 | 31.6 -9% | 31.6 -9% | 29.3 -1% | 30.8 -6% | 30.2 -4% |
| Load Average * (dB) | 29 | 33.1 -14% | 44.8 -54% | 30.6 -6% | 34.3 -18% | 36.8 -27% |
| Load Maximum * (dB) | 33.8 | 36 -7% | 44.8 -33% | 30.6 9% | 34.3 -1% | 36.8 -9% |
* ... menor é melhor
(±) A temperatura máxima no lado superior é 42.7 °C / 109 F, em comparação com a média de 34.3 °C / 94 F , variando de 21.2 a 62.5 °C para a classe Office.
(-) A parte inferior aquece até um máximo de 51 °C / 124 F, em comparação com a média de 36.8 °C / 98 F
(+) Em uso inativo, a temperatura média para o lado superior é 24.8 °C / 77 F, em comparação com a média do dispositivo de 29.5 °C / ### class_avg_f### F.
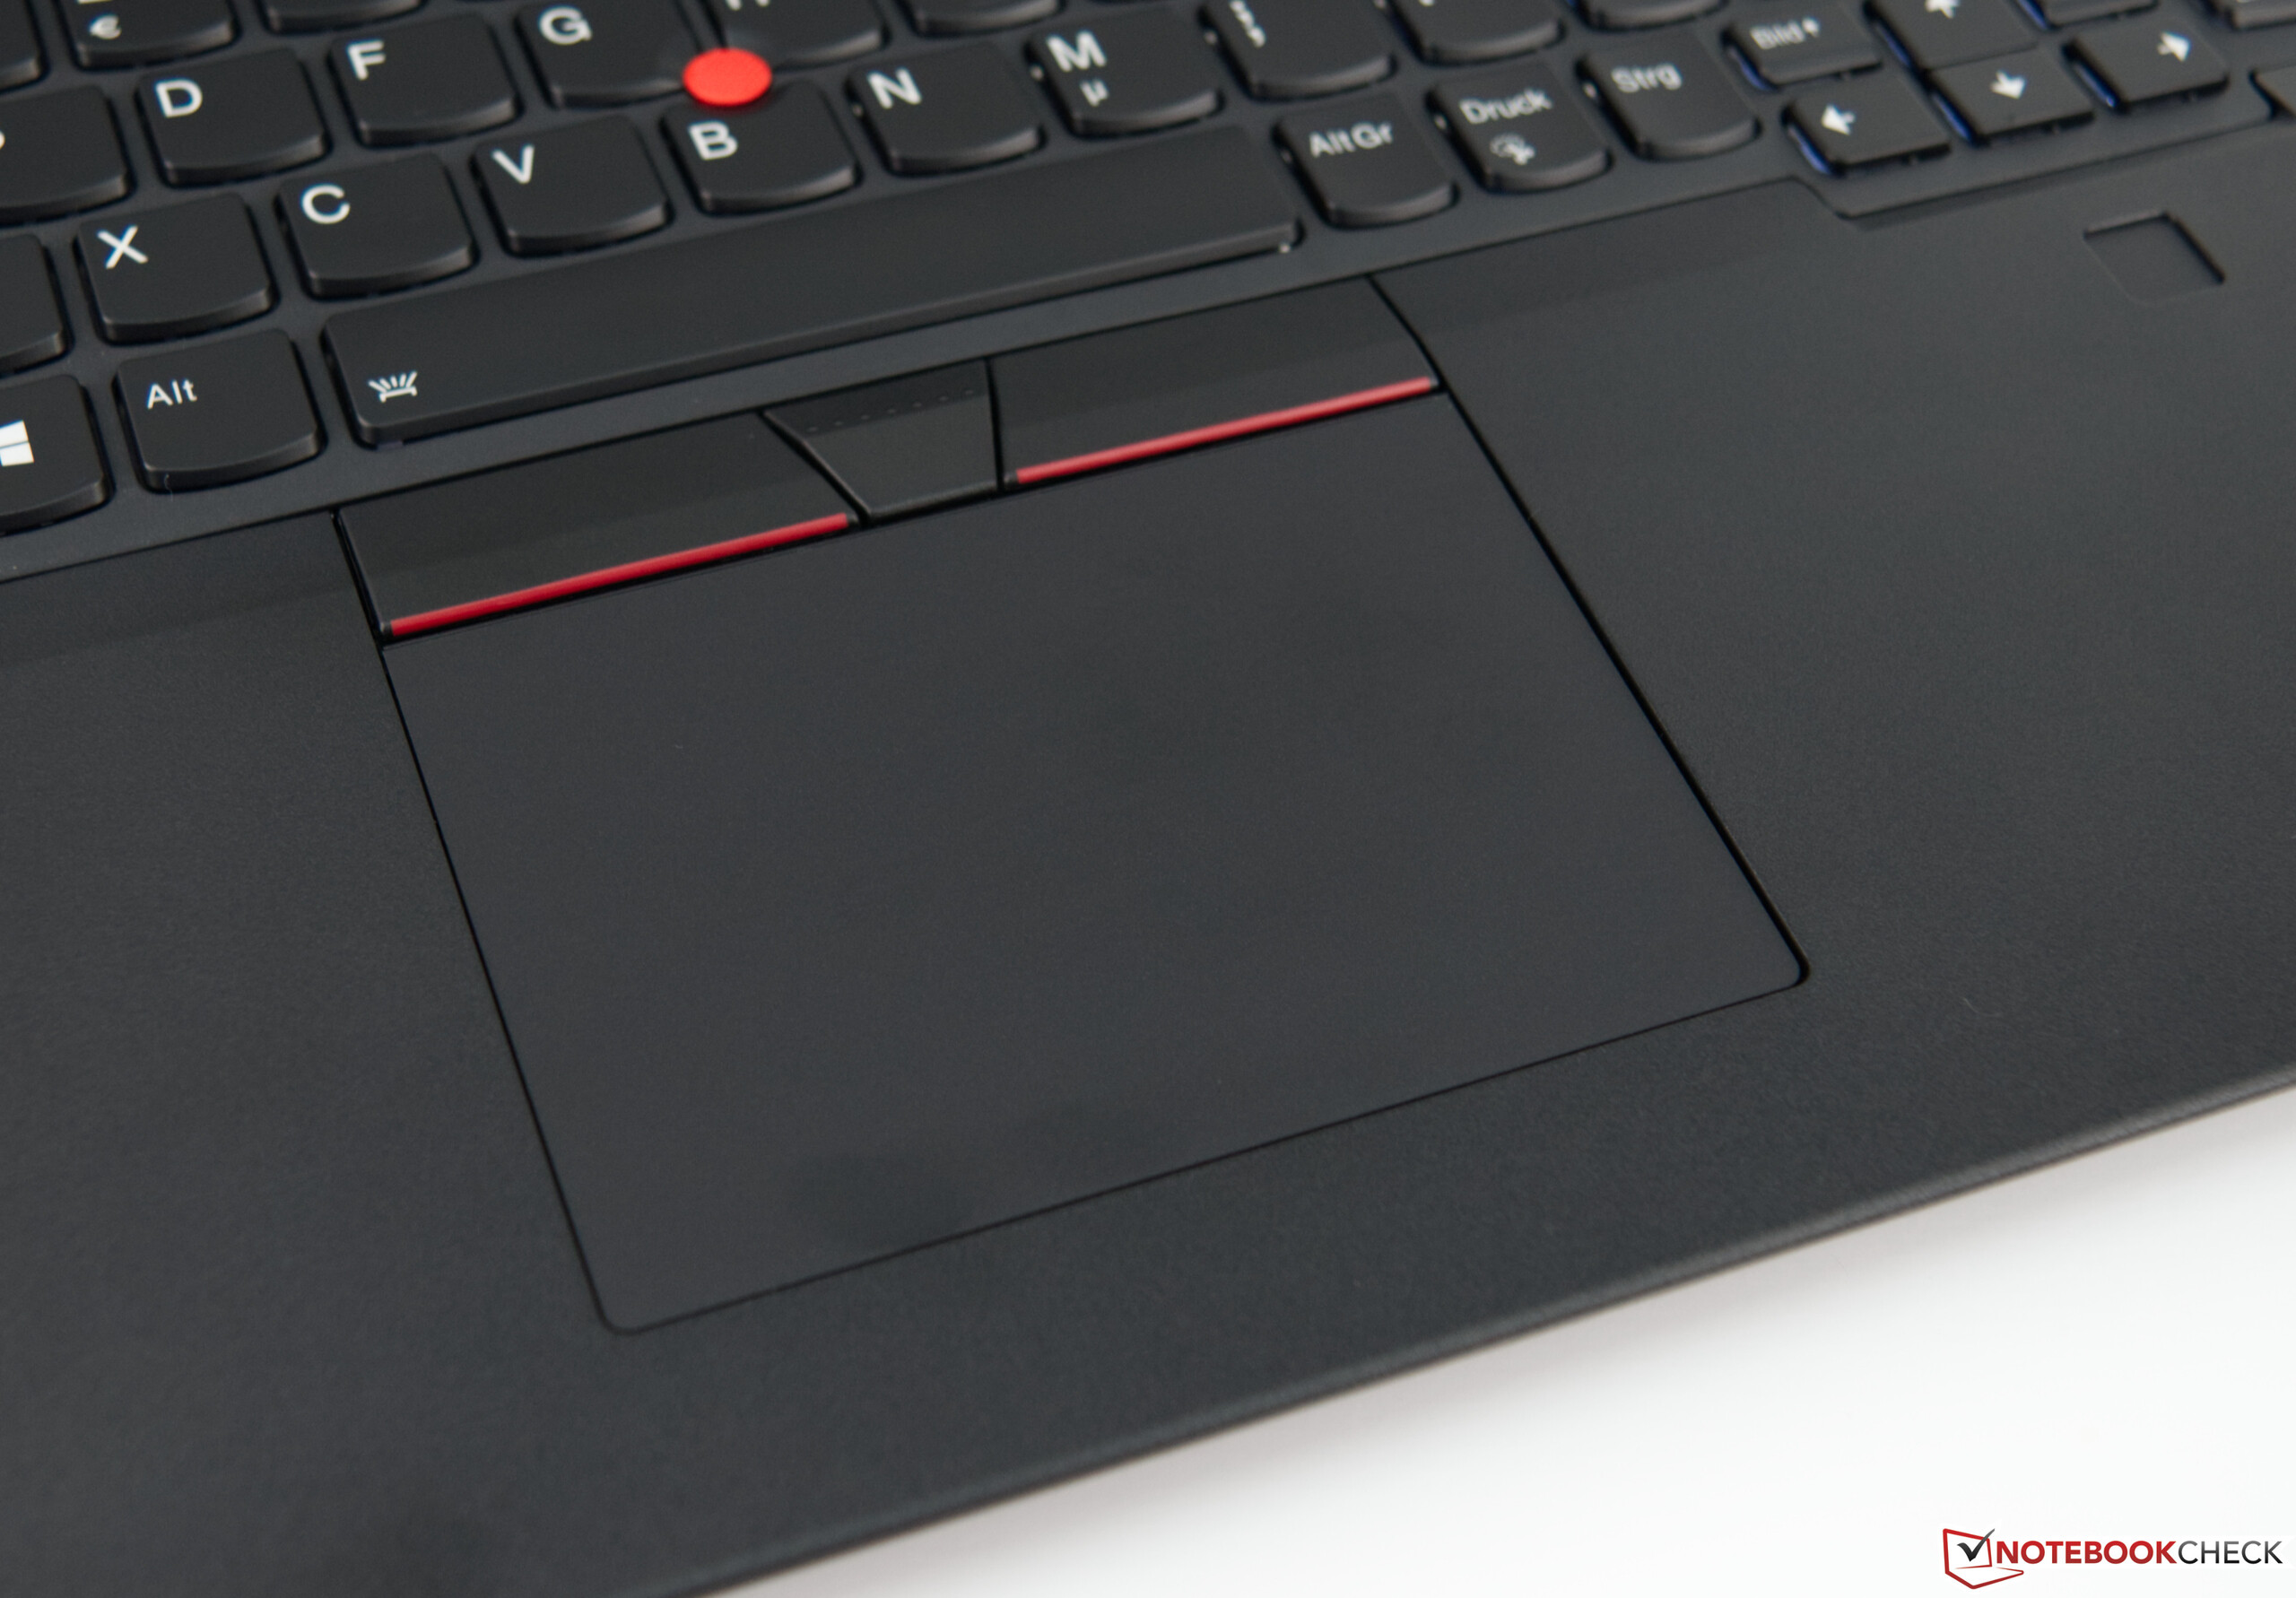
(+) Os apoios para as mãos e o touchpad são mais frios que a temperatura da pele, com um máximo de 25.2 °C / 77.4 F e, portanto, são frios ao toque.
(+) A temperatura média da área do apoio para as mãos de dispositivos semelhantes foi 27.5 °C / 81.5 F (+2.3 °C / 4.1 F).
| Lenovo ThinkPad L590-20Q70019GE UHD Graphics 620, i5-8265U, Toshiba XG6 KXG6AZNV512G | Lenovo ThinkPad L580-20LW000VGE UHD Graphics 620, i5-8250U, Samsung PM961 MZVLW256HEHP | Schenker Slim 15-RE-E19 UHD Graphics 620, i5-8265U, Samsung SSD 970 EVO Plus 500GB | Lenovo ThinkPad E590-20NC0003GE UHD Graphics 620, i7-8565U, Toshiba KBG30ZMT512G | Tuxedo Book BU1307 UHD Graphics 620, i5-8550U, Samsung SSD 970 EVO 250GB | Acer TravelMate X3410-M-50DD GeForce MX130, i5-8550U, Micron 1100 MTFDDAV256TBN | |
|---|---|---|---|---|---|---|
| Heat | 7% | 6% | 5% | 10% | -1% | |
| Maximum Upper Side * (°C) | 42.7 | 43 -1% | 40.3 6% | 43.8 -3% | 35.9 16% | 48.4 -13% |
| Maximum Bottom * (°C) | 51 | 46.2 9% | 47.1 8% | 43.9 14% | 39.2 23% | 45 12% |
| Idle Upper Side * (°C) | 25.9 | 24.1 7% | 25 3% | 25.5 2% | 25.6 1% | 27.2 -5% |
| Idle Bottom * (°C) | 28.3 | 25.3 11% | 26.4 7% | 27 5% | 28.7 -1% | 27.2 4% |
* ... menor é melhor
Lenovo ThinkPad L590-20Q70019GE análise de áudio
(-) | alto-falantes não muito altos (###valor### dB)
Graves 100 - 315Hz
(±) | graves reduzidos - em média 14.1% menor que a mediana
(±) | a linearidade dos graves é média (13% delta para a frequência anterior)
Médios 400 - 2.000 Hz
(±) | médios mais altos - em média 7.4% maior que a mediana
(±) | a linearidade dos médios é média (10% delta para frequência anterior)
Altos 2 - 16 kHz
(+) | agudos equilibrados - apenas 1.9% longe da mediana
(±) | a linearidade dos máximos é média (10.9% delta para frequência anterior)
Geral 100 - 16.000 Hz
(±) | a linearidade do som geral é média (27.5% diferença em relação à mediana)
Comparado com a mesma classe
» 86% de todos os dispositivos testados nesta classe foram melhores, 4% semelhantes, 10% piores
» O melhor teve um delta de 7%, a média foi 21%, o pior foi 53%
Comparado com todos os dispositivos testados
» 84% de todos os dispositivos testados foram melhores, 3% semelhantes, 13% piores
» O melhor teve um delta de 4%, a média foi 24%, o pior foi 134%
Acer TravelMate X3410-M-50DD análise de áudio
(-) | alto-falantes não muito altos (###valor### dB)
Graves 100 - 315Hz
(±) | graves reduzidos - em média 10% menor que a mediana
(±) | a linearidade dos graves é média (8% delta para a frequência anterior)
Médios 400 - 2.000 Hz
(±) | médios mais altos - em média 5.3% maior que a mediana
(±) | a linearidade dos médios é média (9.3% delta para frequência anterior)
Altos 2 - 16 kHz
(+) | agudos equilibrados - apenas 1.2% longe da mediana
(+) | os máximos são lineares (6.5% delta da frequência anterior)
Geral 100 - 16.000 Hz
(±) | a linearidade do som geral é média (19.5% diferença em relação à mediana)
Comparado com a mesma classe
» 40% de todos os dispositivos testados nesta classe foram melhores, 7% semelhantes, 53% piores
» O melhor teve um delta de 7%, a média foi 21%, o pior foi 53%
Comparado com todos os dispositivos testados
» 48% de todos os dispositivos testados foram melhores, 7% semelhantes, 44% piores
» O melhor teve um delta de 4%, a média foi 24%, o pior foi 134%
| desligado | |
| Ocioso | |
| Carga |
|
Key:
min: | |
| Lenovo ThinkPad L590-20Q70019GE i5-8265U, UHD Graphics 620, Toshiba XG6 KXG6AZNV512G, IPS, 1920x1080, 15.6" | Lenovo ThinkPad L580-20LW000VGE i5-8250U, UHD Graphics 620, Samsung PM961 MZVLW256HEHP, IPS, 1920x1080, 15.6" | Schenker Slim 15-RE-E19 i5-8265U, UHD Graphics 620, Samsung SSD 970 EVO Plus 500GB, IPS, 2x1, 15.6" | Lenovo ThinkPad E590-20NC0003GE i7-8565U, UHD Graphics 620, Toshiba KBG30ZMT512G, IPS LED, 1920x1080, 15.6" | Tuxedo Book BU1307 i5-8550U, UHD Graphics 620, Samsung SSD 970 EVO 250GB, IPS, 1920x1080, 13.3" | Acer TravelMate X3410-M-50DD i5-8550U, GeForce MX130, Micron 1100 MTFDDAV256TBN, IPS LED, 1920x1080, 14" | Média Intel UHD Graphics 620 | Média da turma Office | |
|---|---|---|---|---|---|---|---|---|
| Power Consumption | -2% | 3% | -1% | -15% | -25% | -0% | -16% | |
| Idle Minimum * (Watt) | 3.96 | 4.4 -11% | 3.2 19% | 3.72 6% | 5.5 -39% | 4.6 -16% | 3.81 ? 4% | 4.4 ? -11% |
| Idle Average * (Watt) | 6.9 | 7.2 -4% | 6.5 6% | 7.8 -13% | 8.9 -29% | 6.5 6% | 6.94 ? -1% | 7.32 ? -6% |
| Idle Maximum * (Watt) | 9.8 | 8.3 15% | 11.3 -15% | 10.32 -5% | 11.5 -17% | 8.5 13% | 8.75 ? 11% | 8.56 ? 13% |
| Load Average * (Watt) | 31.4 | 36.4 -16% | 32 -2% | 30.24 4% | 34.6 -10% | 56 -78% | 35 ? -11% | 42.5 ? -35% |
| Load Maximum * (Watt) | 45.4 | 42.5 6% | 42.2 7% | 44 3% | 36.6 19% | 67 -48% | 47.5 ? -5% | 64.1 ? -41% |
* ... menor é melhor


| Lenovo ThinkPad L590-20Q70019GE i5-8265U, UHD Graphics 620, 45 Wh | Lenovo ThinkPad L580-20LW000VGE i5-8250U, UHD Graphics 620, 45 Wh | Schenker Slim 15-RE-E19 i5-8265U, UHD Graphics 620, 36 Wh | Lenovo ThinkPad E590-20NC0003GE i7-8565U, UHD Graphics 620, 45 Wh | Tuxedo Book BU1307 i5-8550U, UHD Graphics 620, 66 Wh | Acer TravelMate X3410-M-50DD i5-8550U, GeForce MX130, 57 Wh | Média da turma Office | |
|---|---|---|---|---|---|---|---|
| Duração da bateria | 6% | -37% | -12% | 28% | 15% | 37% | |
| Reader / Idle (h) | 17.4 | 18.3 5% | 17.4 0% | 23.7 ? 36% | |||
| H.264 (h) | 9 | 8.4 -7% | 11.6 29% | 15 ? 67% | |||
| WiFi v1.3 (h) | 7.2 | 7.6 6% | 4.5 -37% | 6.4 -11% | 9.2 28% | 10.9 51% | 12.9 ? 79% |
| Load (h) | 2.8 | 1.8 -36% | 2.2 -21% | 1.807 ? -35% |
Pro
Contra
Veredicto - Boa conectividade e dispositivos de entrada por menos de 1.000 Euros
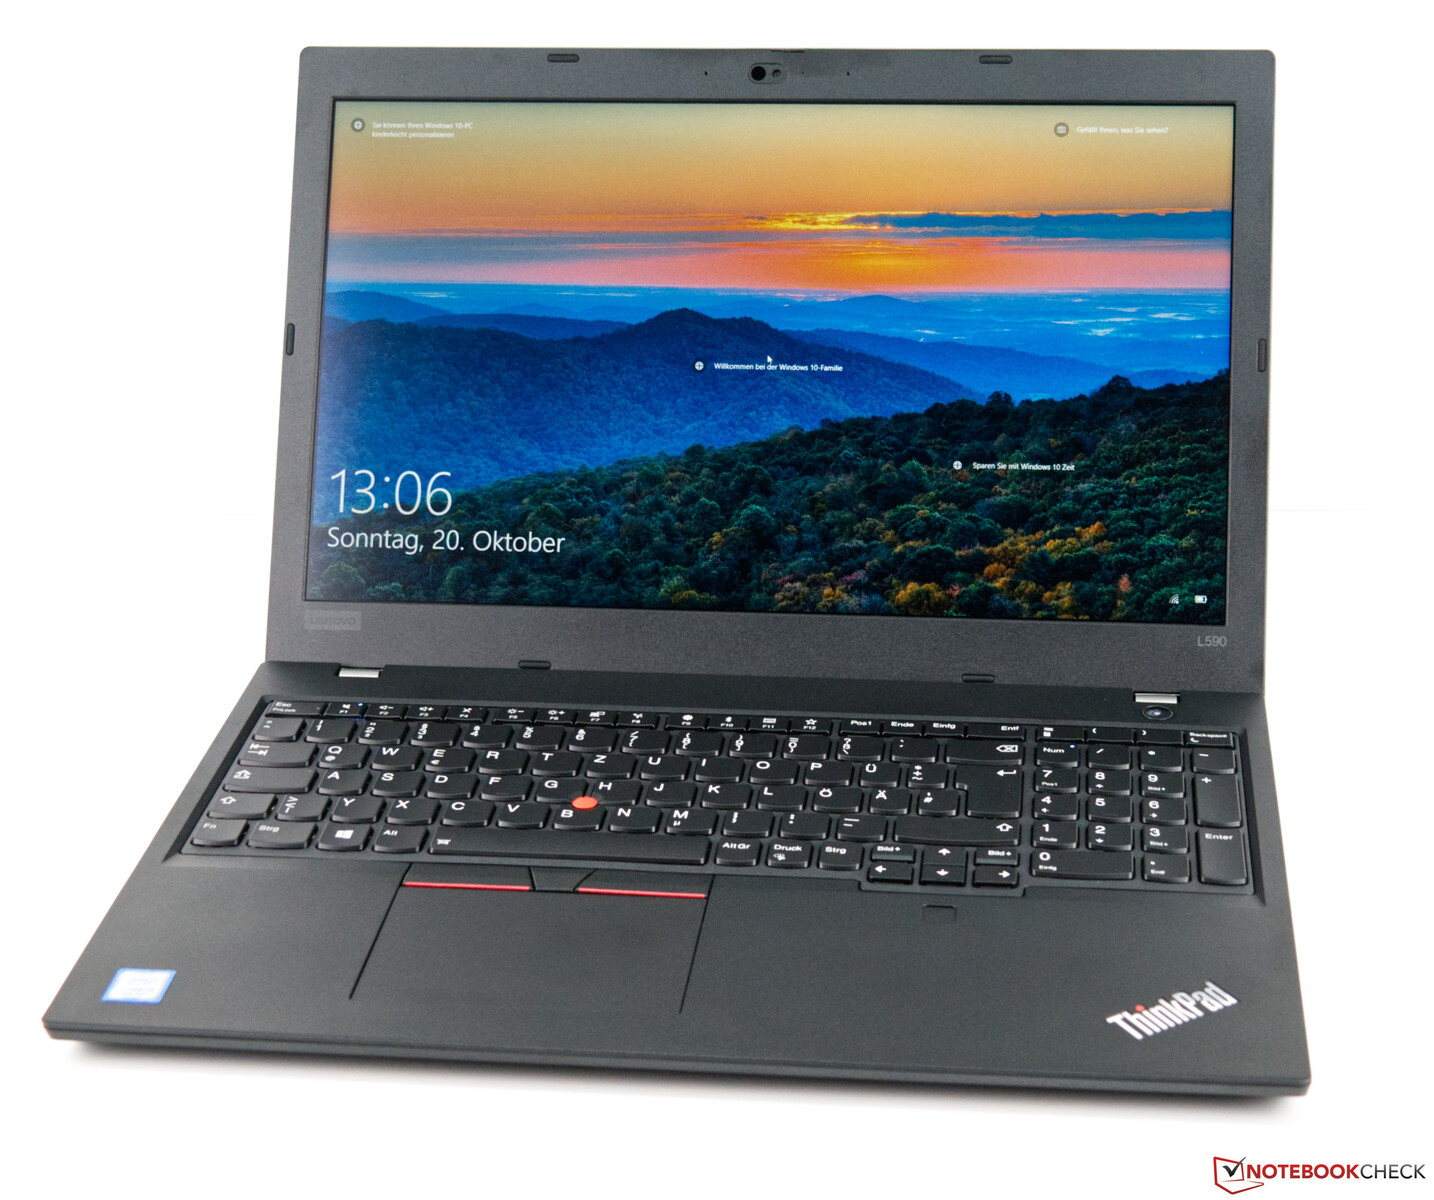
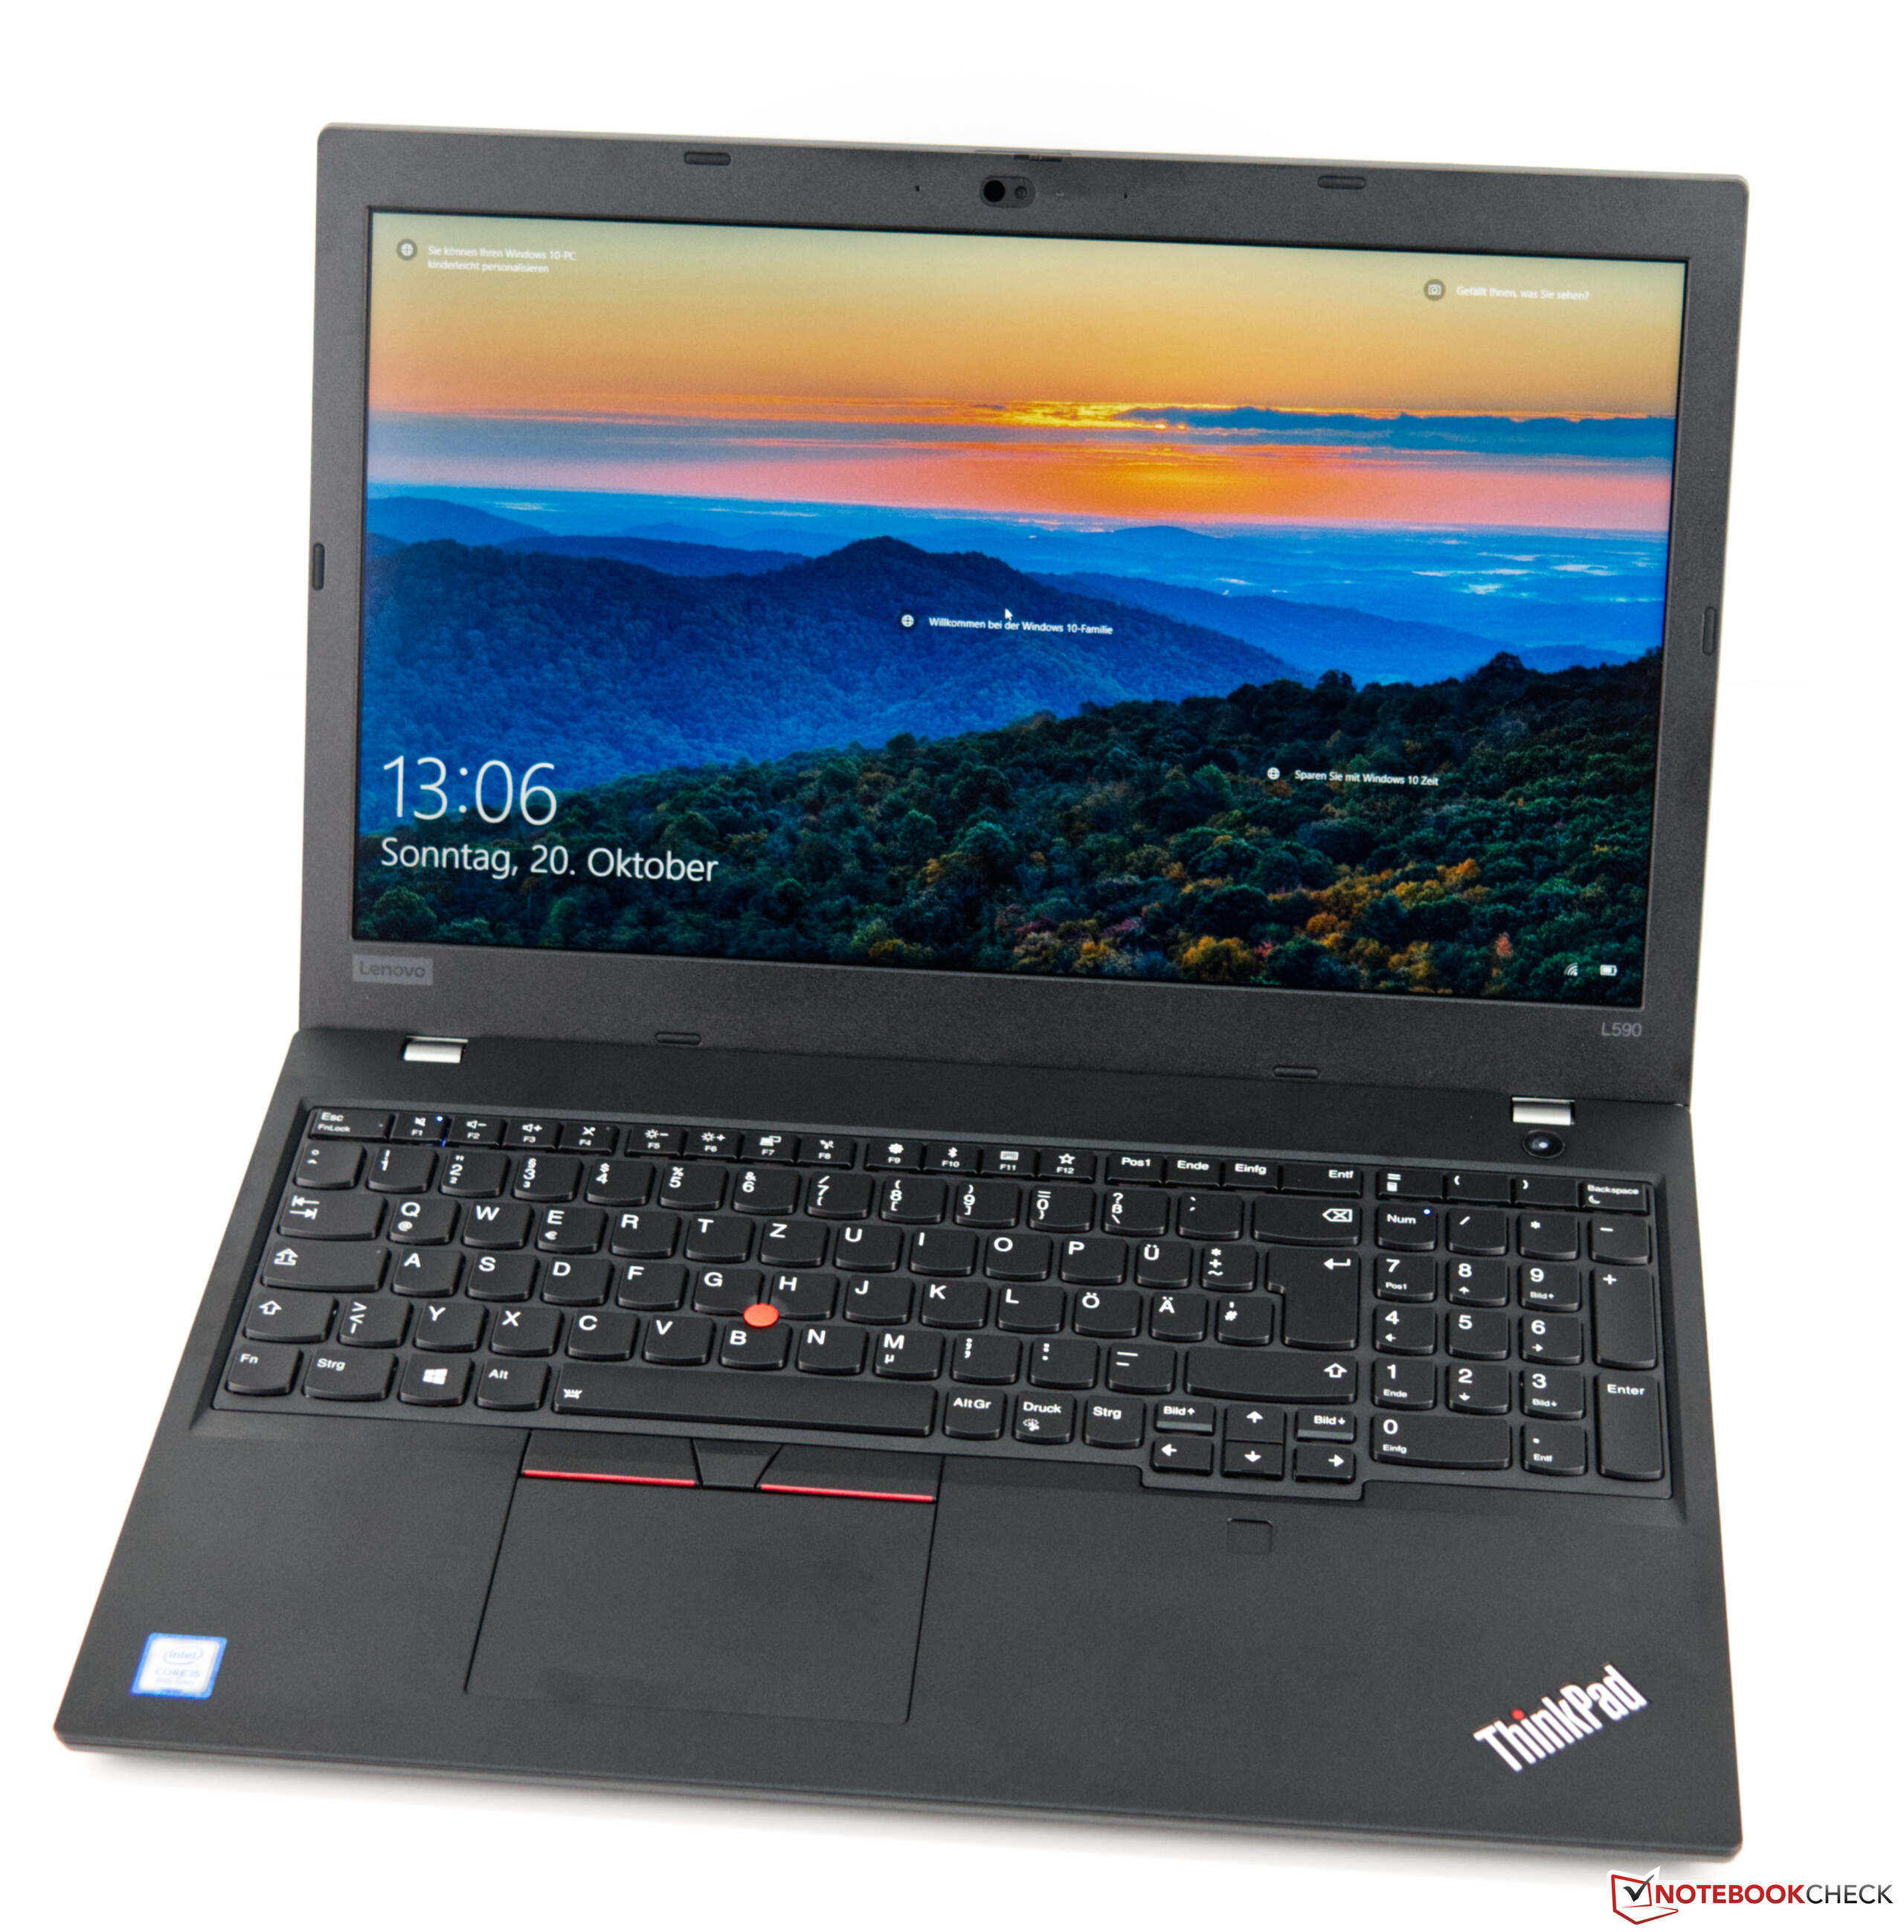
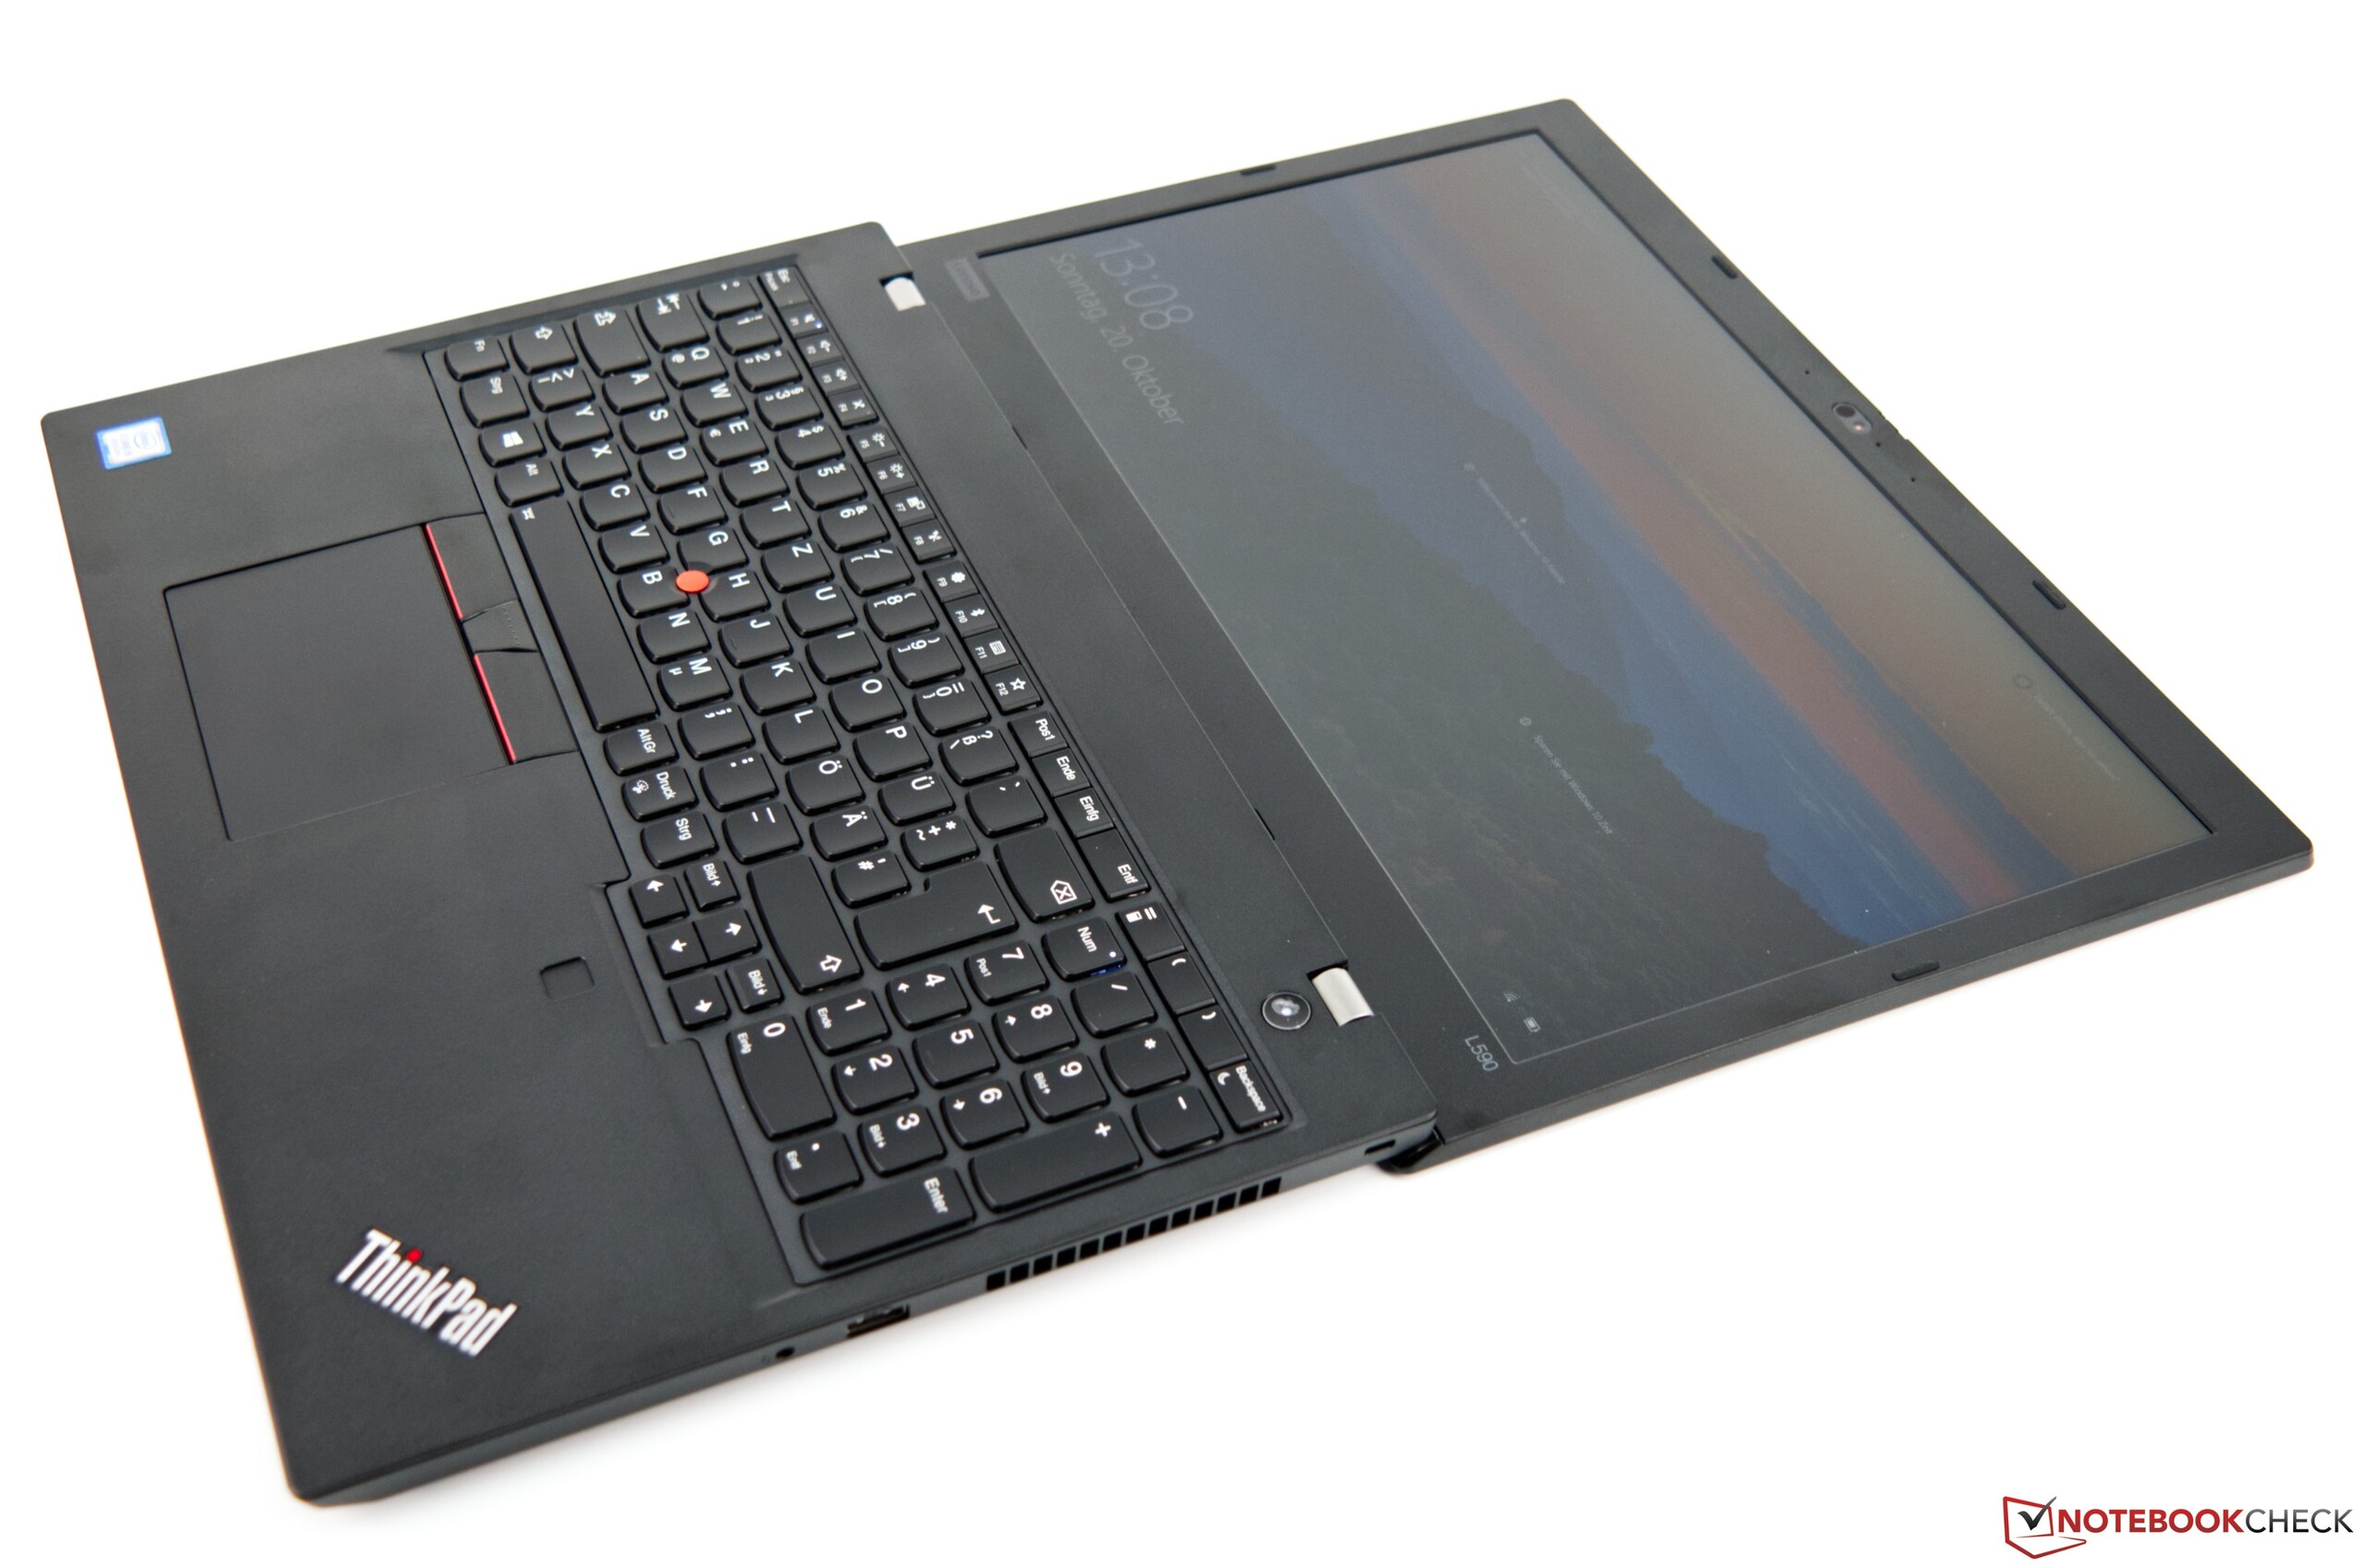
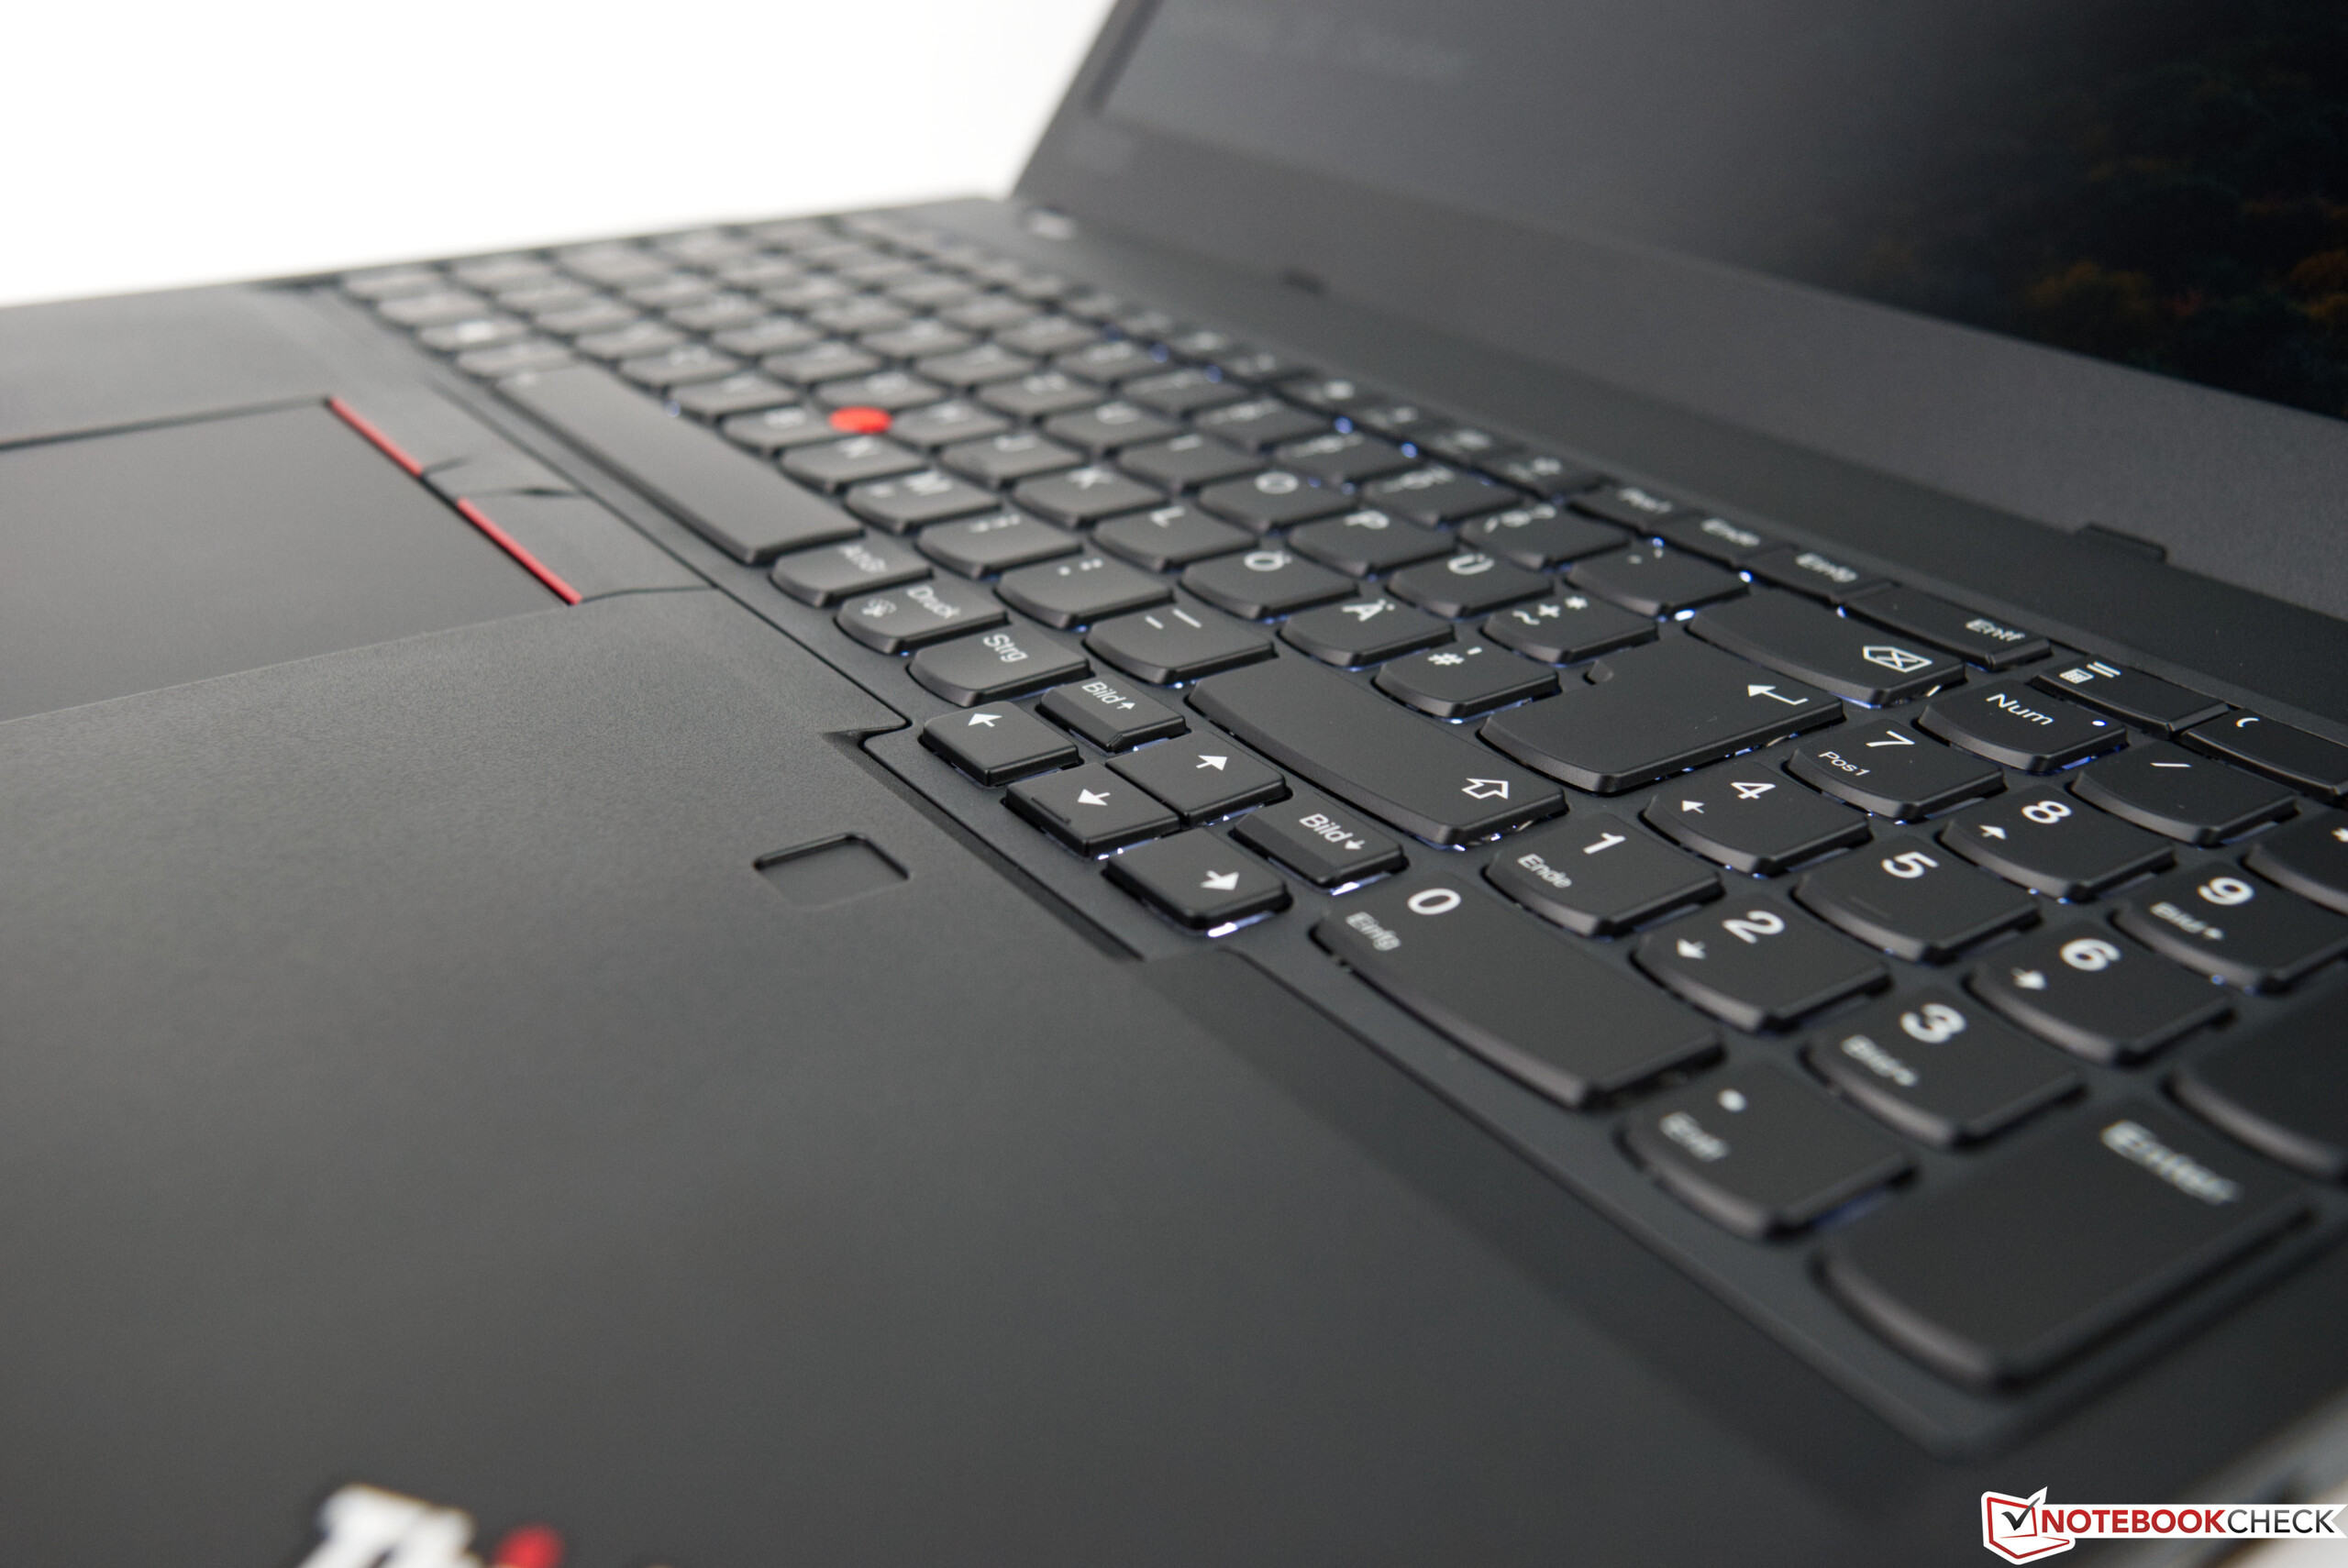
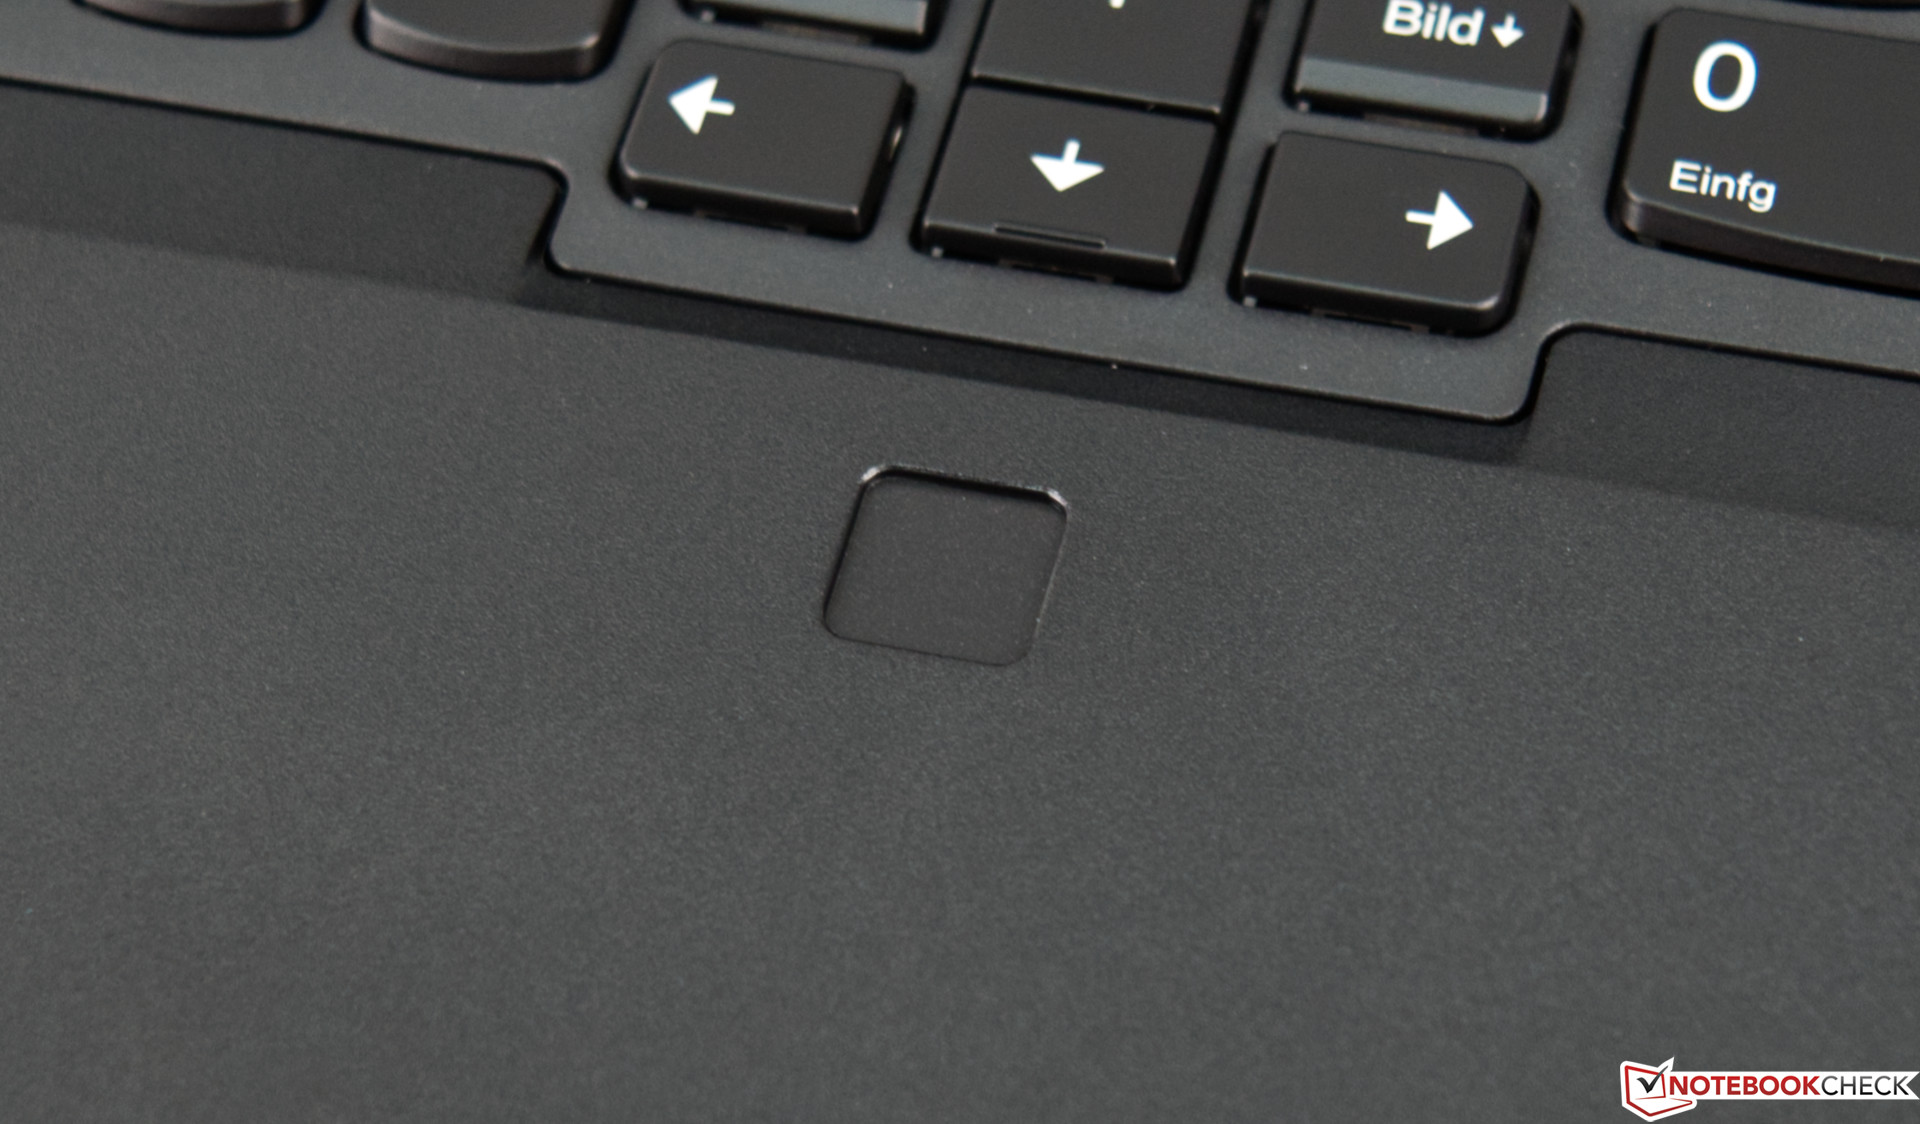
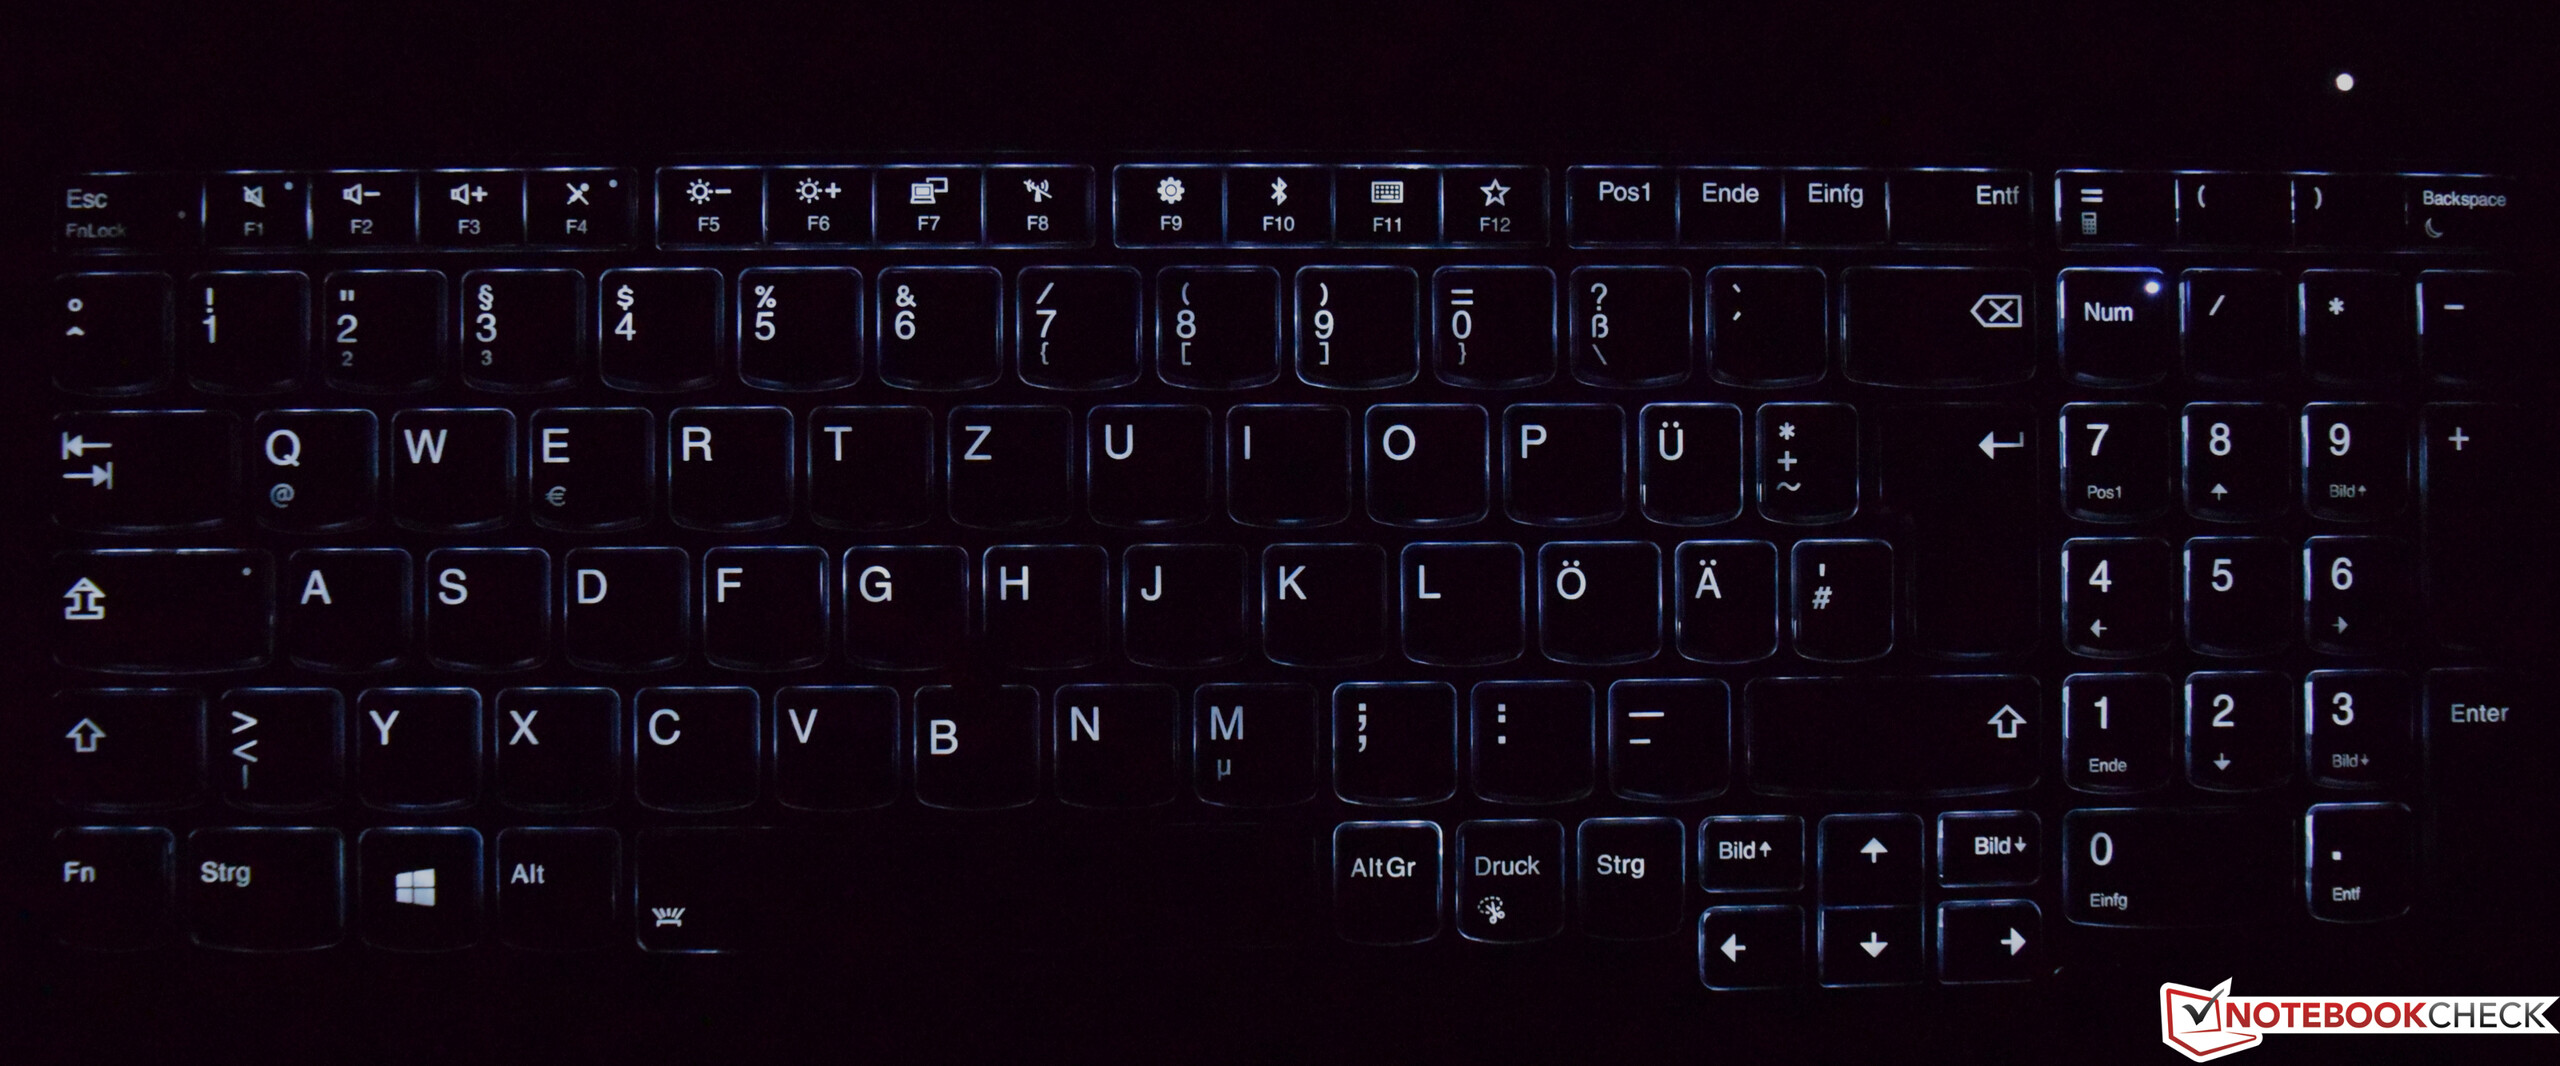
O ThinkPad L590 é um portátil de escritório simples que nos impressionou com seus dispositivos de entrada de primeira classe, acima de tudo. O dispositivo tem alguns outros pontos fortes para a venda exclusivos, já que muitos OEMs já alcançaram a Lenovo em outras áreas. O L590 também tem suas desvantagens, incluindo sua tela escura que também possui coberturas de espaço de cores inaceitavelmente pequenas. A concorrência também não é muito melhor neste ponto.
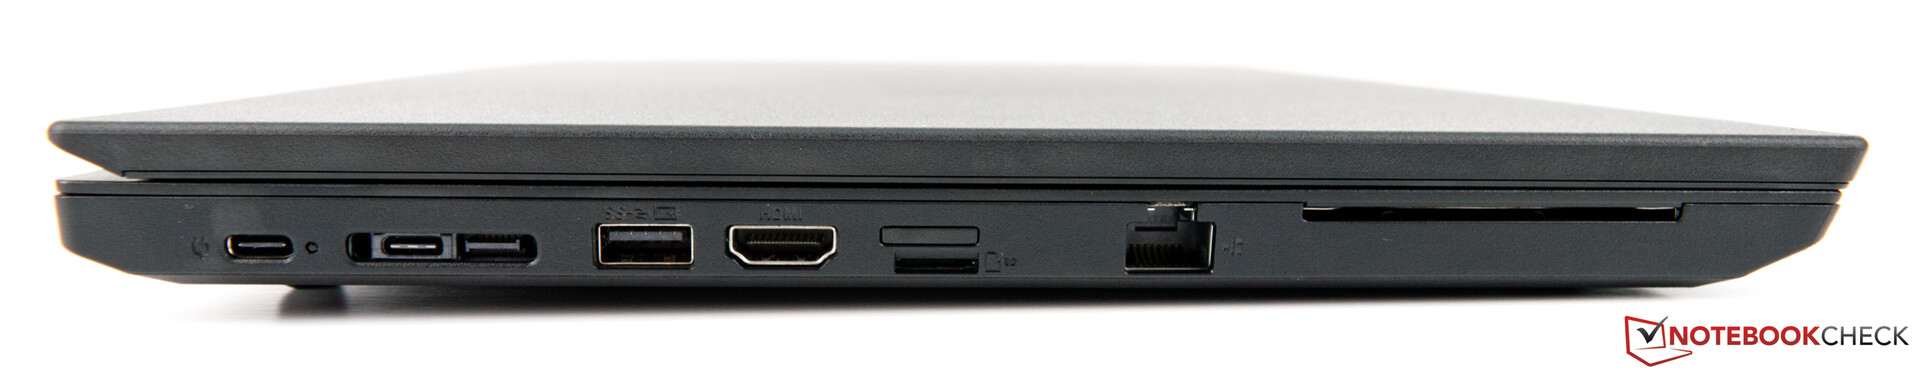
O L590, como seu antecessor, não consegue aproveitar o potencial desempenho de seu processador quad-core. A causa desse fraco desempenho parece ser um sistema de refrigeração fraco; portanto, seria prudente que a Lenovo invista em um sistema mais eficiente para os dispositivos subsequentes da série L. Não temos queixas sobre a seleção de portas que o L590 oferece. Todos os que a maioria das pessoas precisaria estão aqui, e os alto-falantes também não decepcionaram durante nossos testes.
Se você estiver procurando por um portátil de escritório com preços razoáveis, não irá errar muito com o Lenovo ThinkPad L590. O dispositivo vale a pena apenas por sua conectividade e dispositivos de entrada por menos de 1.000 Euros (~ US$ 1.108), mas você também deve suportar algumas deficiências.
Lenovo ThinkPad L590-20Q70019GE
- 10/25/2019 v7 (old)
Sebastian Bade
Price comparison
