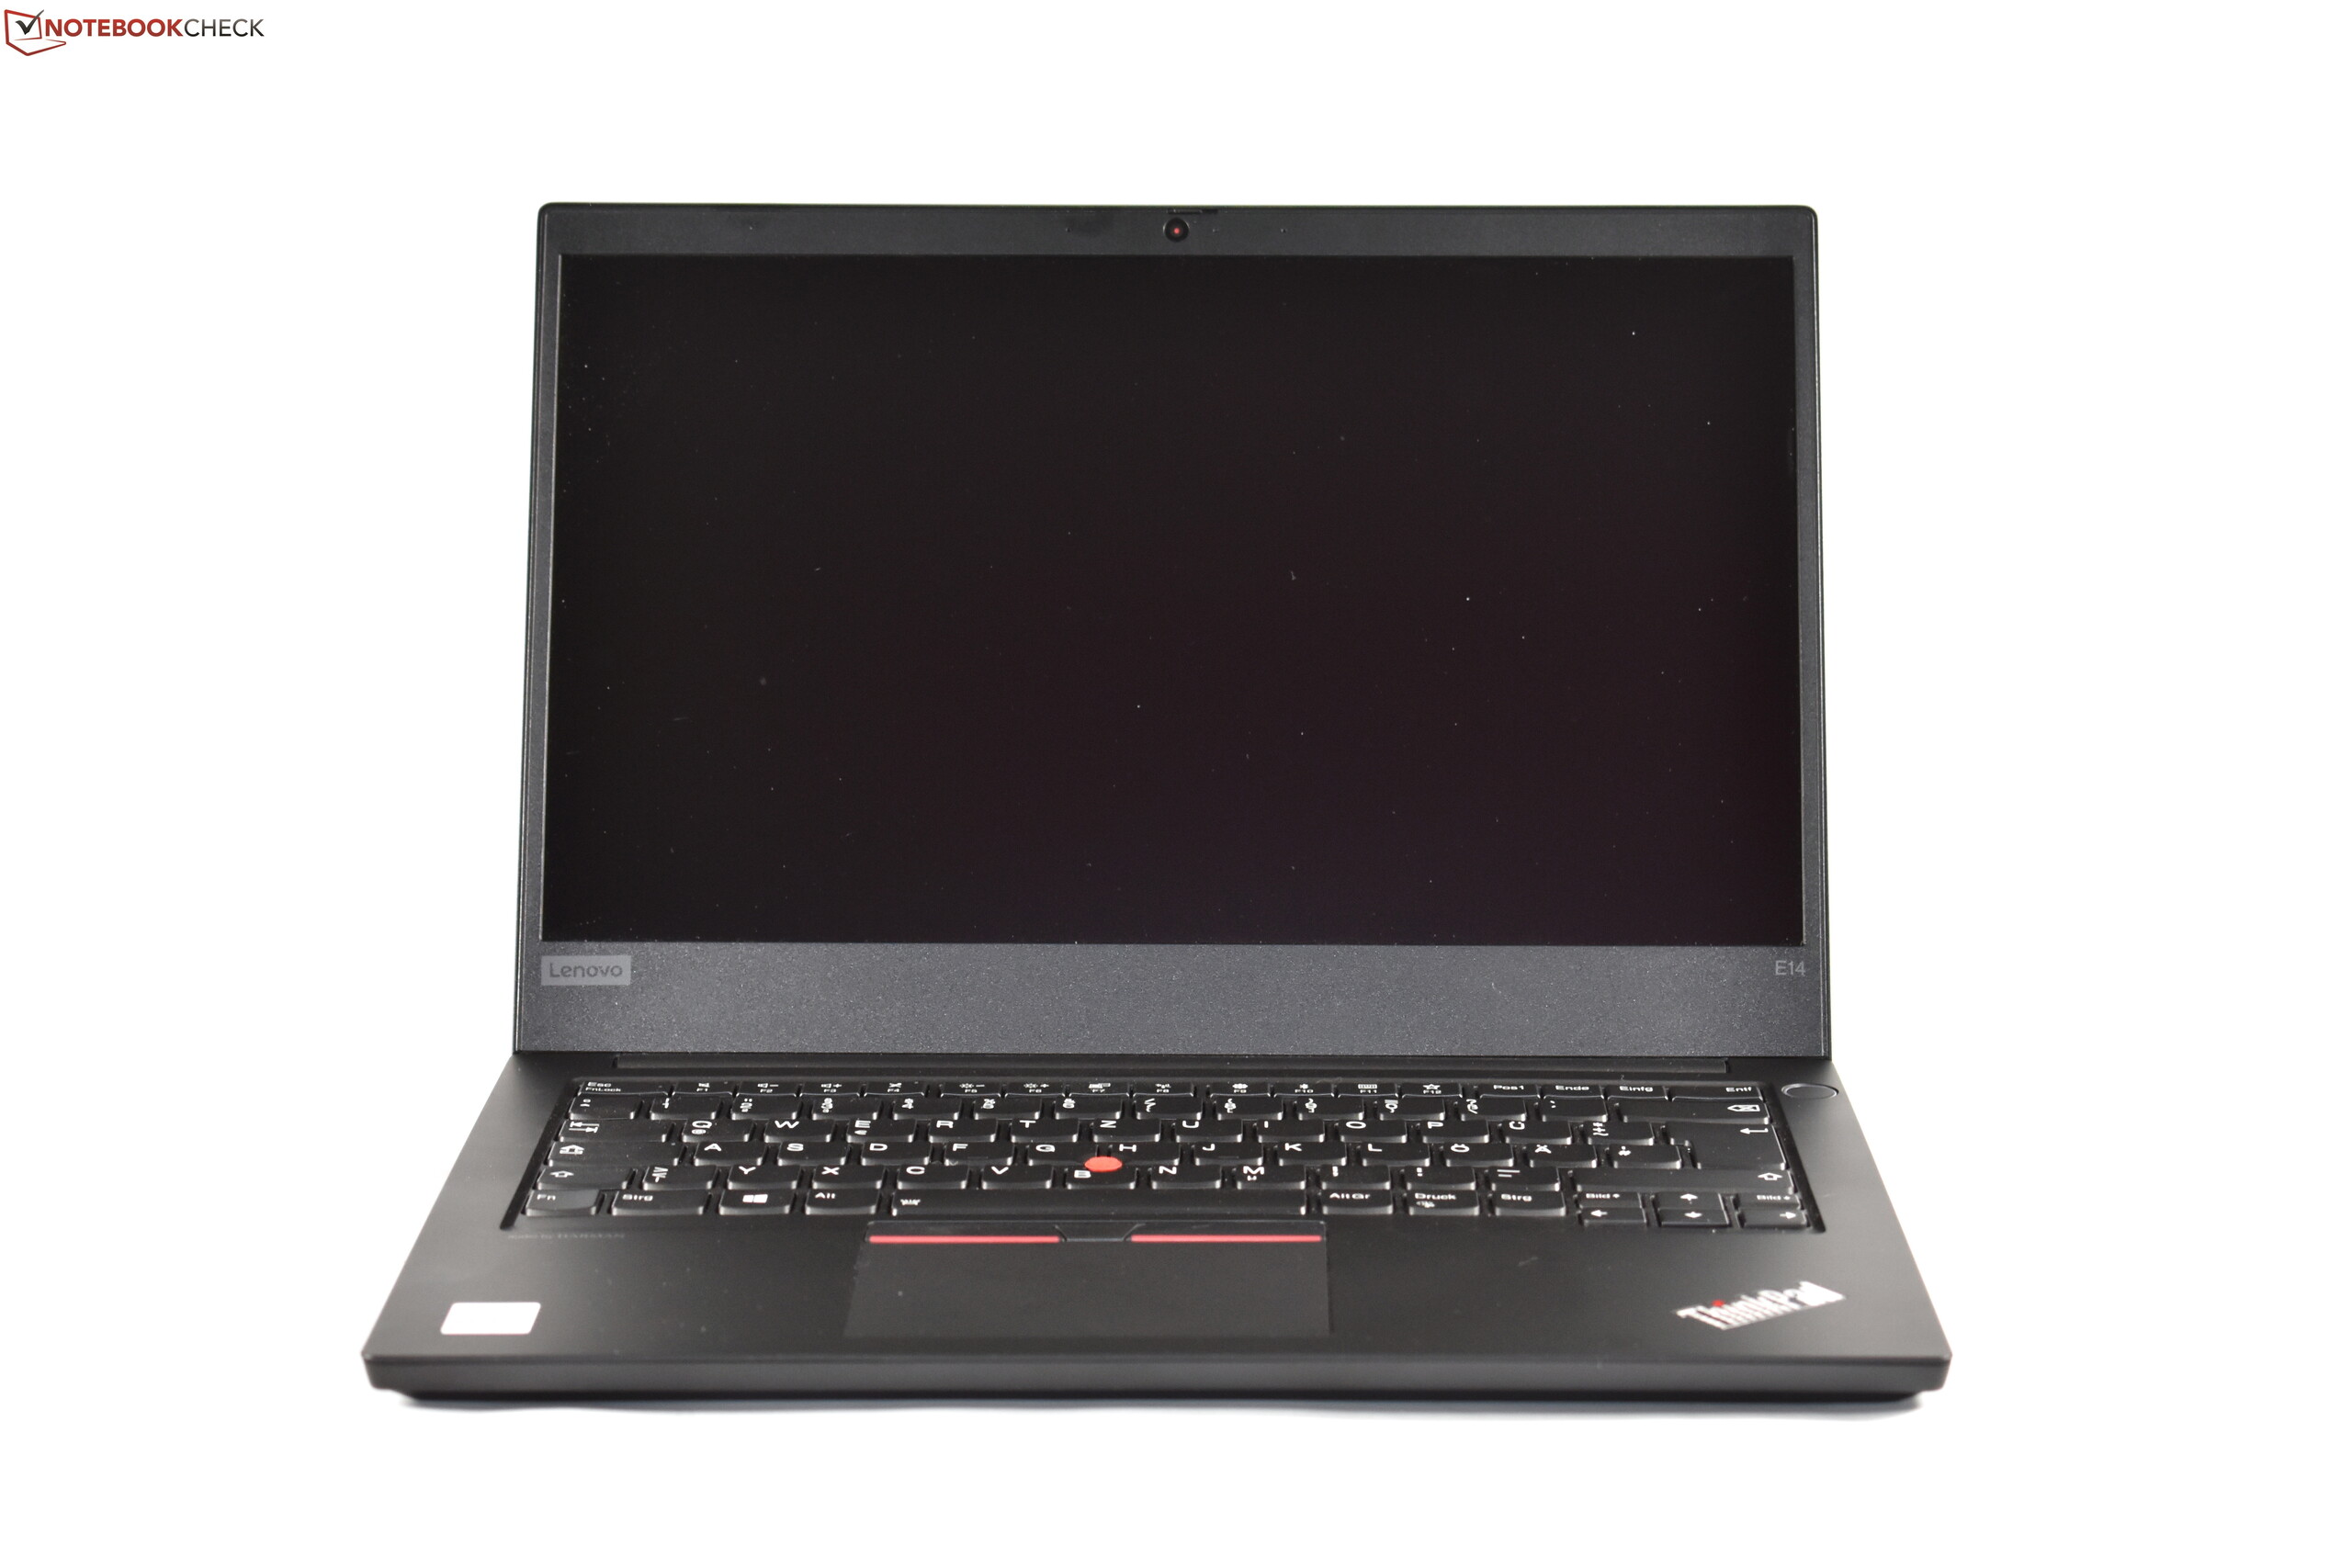
Breve Análise do Portátil Lenovo ThinkPad E14: O design fino derrota a capacidade de atualização
Avaliação | Data | Modelo | Peso | Altura | Size | Resolução | Preço |
|---|---|---|---|---|---|---|---|
| 84.5 % v7 (old) | 03/2020 | Lenovo ThinkPad E14 20RA001MGE i5-10210U, UHD Graphics 620 | 1.6 kg | 17.9 mm | 14.00" | 1920x1080 | |
| 85.9 % v7 (old) | 06/2019 | Lenovo ThinkPad E490-20N8000RGE i5-8265U, UHD Graphics 620 | 1.8 kg | 19.9 mm | 14.00" | 1920x1080 | |
| 80.9 % v7 (old) | 01/2020 | MSI Modern 14 A10RB-459US i5-10210U, GeForce MX250 | 1.2 kg | 16 mm | 14.00" | 1920x1080 | |
| 83 % v7 (old) | Dell Latitude 3400 i3-8145U, UHD Graphics 620 | 1.7 kg | 18.65 mm | 14.00" | 1920x1080 | ||
| 87.9 % v7 (old) | 06/2019 | Lenovo ThinkPad T490-20N2004EGE i5-8265U, UHD Graphics 620 | 1.4 kg | 17.9 mm | 14.00" | 1920x1080 |
| Networking | |
| iperf3 transmit AX12 | |
| Lenovo ThinkPad E490-20N8000RGE | |
| Lenovo ThinkPad T490-20N2004EGE | |
| Dell Latitude 3400 | |
| Lenovo ThinkPad E14 20RA001MGE | |
| iperf3 receive AX12 | |
| Lenovo ThinkPad E14 20RA001MGE | |
| Dell Latitude 3400 | |
| Lenovo ThinkPad T490-20N2004EGE | |
| Lenovo ThinkPad E490-20N8000RGE | |
| |||||||||||||||||||||||||
iluminação: 89 %
iluminação com acumulador: 308 cd/m²
Contraste: 1794:1 (Preto: 0.17 cd/m²)
ΔE ColorChecker Calman: 5.9 | ∀{0.5-29.43 Ø4.72}
calibrated: 4.6
ΔE Greyscale Calman: 4.4 | ∀{0.09-98 Ø4.97}
59.6% sRGB (Argyll 1.6.3 3D)
38.2% AdobeRGB 1998 (Argyll 1.6.3 3D)
41.65% AdobeRGB 1998 (Argyll 3D)
60% sRGB (Argyll 3D)
40.31% Display P3 (Argyll 3D)
Gamma: 2.05
CCT: 6921 K
| Lenovo ThinkPad E14 20RA001MGE NV140FHM-N48, IPS LED, 1920x1080, 14" | Lenovo ThinkPad E490-20N8000RGE Lenovo NV140FHM-N49, IPS, 1920x1080, 14" | MSI Modern 14 A10RB-459US Chi Mei N140HCE-EN2, IPS, 1920x1080, 14" | Dell Latitude 3400 BOE NV14N4H, IPS, 1920x1080, 14" | Lenovo ThinkPad T490-20N2004EGE NE140FHM-N61, IGZO IPS LED, 1920x1080, 14" | |
|---|---|---|---|---|---|
| Display | -1% | 58% | 0% | 63% | |
| Display P3 Coverage (%) | 40.31 | 39.85 -1% | 64.2 59% | 40.68 1% | 69.2 72% |
| sRGB Coverage (%) | 60 | 58.6 -2% | 94.8 58% | 59.3 -1% | 92.3 54% |
| AdobeRGB 1998 Coverage (%) | 41.65 | 41.18 -1% | 65.4 57% | 42.03 1% | 67.6 62% |
| Response Times | 5% | 17% | 4% | -26% | |
| Response Time Grey 50% / Grey 80% * (ms) | 52 ? | 48.4 ? 7% | 39.2 ? 25% | 44 ? 15% | 71.2 ? -37% |
| Response Time Black / White * (ms) | 39.2 ? | 38.4 ? 2% | 35.6 ? 9% | 42 ? -7% | 44.8 ? -14% |
| PWM Frequency (Hz) | 1250 ? | 1250 ? | 25000 ? | 1000 ? | 2427 ? |
| Screen | -1% | 31% | -16% | 20% | |
| Brightness middle (cd/m²) | 305 | 305 0% | 324.1 6% | 240 -21% | 428 40% |
| Brightness (cd/m²) | 292 | 295 1% | 301 3% | 227 -22% | 409 40% |
| Brightness Distribution (%) | 89 | 90 1% | 87 -2% | 79 -11% | 91 2% |
| Black Level * (cd/m²) | 0.17 | 0.23 -35% | 0.22 -29% | 0.48 -182% | 0.29 -71% |
| Contrast (:1) | 1794 | 1326 -26% | 1473 -18% | 500 -72% | 1476 -18% |
| Colorchecker dE 2000 * | 5.9 | 5.3 10% | 1.63 72% | 4.2 29% | 4.6 22% |
| Colorchecker dE 2000 max. * | 18.4 | 18.9 -3% | 4.25 77% | 7.16 61% | 8.2 55% |
| Colorchecker dE 2000 calibrated * | 4.6 | 5 -9% | 1.42 69% | 2 57% | |
| Greyscale dE 2000 * | 4.4 | 2.3 48% | 2.2 50% | 1.75 60% | 5.4 -23% |
| Gamma | 2.05 107% | 2.09 105% | 2.26 97% | 2.36 93% | 2.09 105% |
| CCT | 6921 94% | 6246 104% | 6887 94% | 6387 102% | 7562 86% |
| Color Space (Percent of AdobeRGB 1998) (%) | 38.2 | 37.7 -1% | 60.2 58% | 38 -1% | 60 57% |
| Color Space (Percent of sRGB) (%) | 59.6 | 58.2 -2% | 95 59% | 59 -1% | 92.2 55% |
| Média Total (Programa/Configurações) | 1% /
-1% | 35% /
35% | -4% /
-10% | 19% /
22% |
* ... menor é melhor
Exibir tempos de resposta
| ↔ Tempo de resposta preto para branco | ||
|---|---|---|
| 39.2 ms ... ascensão ↗ e queda ↘ combinadas | ↗ 22 ms ascensão | 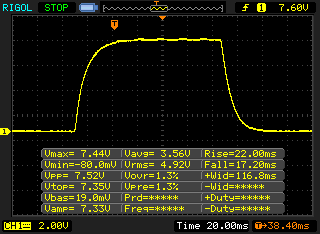 |
| ↘ 17.2 ms queda | ||
| A tela mostra taxas de resposta lentas em nossos testes e será insatisfatória para os jogadores. Em comparação, todos os dispositivos testados variam de 0.1 (mínimo) a 240 (máximo) ms. » 97 % de todos os dispositivos são melhores. Isso significa que o tempo de resposta medido é pior que a média de todos os dispositivos testados (19.8 ms). | ||
| ↔ Tempo de resposta 50% cinza a 80% cinza | ||
| 52 ms ... ascensão ↗ e queda ↘ combinadas | ↗ 26 ms ascensão | 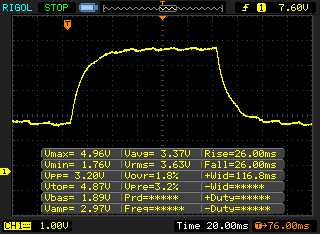 |
| ↘ 26 ms queda | ||
| A tela mostra taxas de resposta lentas em nossos testes e será insatisfatória para os jogadores. Em comparação, todos os dispositivos testados variam de 0.165 (mínimo) a 636 (máximo) ms. » 88 % de todos os dispositivos são melhores. Isso significa que o tempo de resposta medido é pior que a média de todos os dispositivos testados (31 ms). | ||
Cintilação da tela / PWM (modulação por largura de pulso)
| Tela tremeluzindo/PWM detectado | 1250 Hz | ≤ 99 % configuração de brilho | 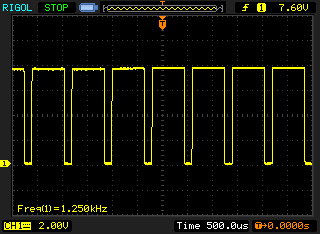 |
A luz de fundo da tela pisca em 1250 Hz (pior caso, por exemplo, utilizando PWM) Cintilação detectada em uma configuração de brilho de 99 % e abaixo. Não deve haver cintilação ou PWM acima desta configuração de brilho. A frequência de 1250 Hz é bastante alta, então a maioria dos usuários sensíveis ao PWM não deve notar nenhuma oscilação. [pwm_comparison] Em comparação: 52 % de todos os dispositivos testados não usam PWM para escurecer a tela. Se PWM foi detectado, uma média de 7747 (mínimo: 5 - máximo: 343500) Hz foi medida. | |||
| PCMark 8 Home Score Accelerated v2 | 3402 pontos | |
| PCMark 8 Work Score Accelerated v2 | 5001 pontos | |
| PCMark 10 Score | 3901 pontos | |
Ajuda | ||
| Lenovo ThinkPad E14 20RA001MGE SK hynix BC501 HFM512GDHTNG-8310A | Lenovo ThinkPad E490-20N8000RGE SK hynix BC501 HFM256GDHTNG | MSI Modern 14 A10RB-459US Kingston RBUSNS8154P3512GJ | Dell Latitude 3400 WDC PC SN520 SDAPNUW-256G | Lenovo ThinkPad T490-20N2004EGE Toshiba KXG5AZNV256G | Média SK hynix BC501 HFM512GDHTNG-8310A | |
|---|---|---|---|---|---|---|
| CrystalDiskMark 5.2 / 6 | -9% | -2% | 9% | 24% | -9% | |
| Write 4K (MB/s) | 121.9 | 110.7 -9% | 107.7 -12% | 107.9 -11% | 119.9 -2% | 110 ? -10% |
| Read 4K (MB/s) | 42.66 | 41.02 -4% | 39.73 -7% | 40.27 -6% | 39.94 -6% | 40.6 ? -5% |
| Write Seq (MB/s) | 628 | 757 21% | 926 47% | 1253 100% | 1334 112% | 677 ? 8% |
| Read Seq (MB/s) | 1193 | 1037 -13% | 1014 -15% | 1298 9% | 1357 14% | 1104 ? -7% |
| Write 4K Q32T1 (MB/s) | 590 | 359 -39% | 343.6 -42% | 415 -30% | 311.2 -47% | 438 ? -26% |
| Read 4K Q32T1 (MB/s) | 414.5 | 402.4 -3% | 499.1 20% | 313.3 -24% | 400.6 -3% | 338 ? -18% |
| Write Seq Q32T1 (MB/s) | 866 | 833 -4% | 1033 19% | 1297 50% | 1642 90% | 860 ? -1% |
| Read Seq Q32T1 (MB/s) | 2078 | 1635 -21% | 1604 -23% | 1728 -17% | 2778 34% | 1786 ? -14% |

| 3DMark 11 - 1280x720 Performance GPU | |
| Média da turma Office (2551 - 18313, n=70, últimos 2 anos) | |
| MSI Modern 14 A10RB-459US | |
| Lenovo ThinkPad E14 20RA001MGE | |
| Média Intel UHD Graphics 620 (1144 - 3432, n=244) | |
| Lenovo ThinkPad T490-20N2004EGE | |
| Lenovo ThinkPad E490-20N8000RGE | |
| Dell Latitude 3400 | |
| 3DMark | |
| 1280x720 Cloud Gate Standard Graphics | |
| Média da turma Office (11640 - 118515, n=37, últimos 2 anos) | |
| MSI Modern 14 A10RB-459US | |
| Média Intel UHD Graphics 620 (6205 - 16400, n=225) | |
| Lenovo ThinkPad E14 20RA001MGE | |
| Lenovo ThinkPad E490-20N8000RGE | |
| Lenovo ThinkPad T490-20N2004EGE | |
| Dell Latitude 3400 | |
| 1920x1080 Fire Strike Graphics | |
| Média da turma Office (736 - 21871, n=73, últimos 2 anos) | |
| MSI Modern 14 A10RB-459US | |
| Lenovo ThinkPad E14 20RA001MGE | |
| Média Intel UHD Graphics 620 (557 - 2608, n=213) | |
| Lenovo ThinkPad E490-20N8000RGE | |
| Lenovo ThinkPad T490-20N2004EGE | |
| Dell Latitude 3400 | |
| 2560x1440 Time Spy Graphics | |
| Média da turma Office (493 - 6679, n=68, últimos 2 anos) | |
| MSI Modern 14 A10RB-459US | |
| Média Intel UHD Graphics 620 (299 - 797, n=88) | |
| Lenovo ThinkPad E490-20N8000RGE | |
| Dell Latitude 3400 | |
| 3DMark 11 Performance | 1938 pontos | |
| 3DMark Cloud Gate Standard Score | 8057 pontos | |
| 3DMark Fire Strike Score | 1072 pontos | |
Ajuda | ||
| baixo | média | alto | ultra | |
|---|---|---|---|---|
| BioShock Infinite (2013) | 59.8 | 33.23 | 27.38 | 8.74 |
| Dota 2 Reborn (2015) | 68.7 | 40.7 | 19.3 | 17.1 |
| Rise of the Tomb Raider (2016) | 20.6 | |||
| X-Plane 11.11 (2018) | 10.6 | 9.02 | 8.8 | |
| Total War: Three Kingdoms (2019) | 23.4 |
Barulho
| Ocioso |
| 29.2 / 29.2 / 29.2 dB |
| Carga |
| 29.5 / 29.9 dB |
 | ||
30 dB silencioso 40 dB(A) audível 50 dB(A) ruidosamente alto |
||
min: | ||
(±) A temperatura máxima no lado superior é 41.7 °C / 107 F, em comparação com a média de 34.3 °C / 94 F , variando de 21.2 a 62.5 °C para a classe Office.
(±) A parte inferior aquece até um máximo de 40.3 °C / 105 F, em comparação com a média de 36.8 °C / 98 F
(+) Em uso inativo, a temperatura média para o lado superior é 23.8 °C / 75 F, em comparação com a média do dispositivo de 29.5 °C / ### class_avg_f### F.
(+) Os apoios para as mãos e o touchpad são mais frios que a temperatura da pele, com um máximo de 30 °C / 86 F e, portanto, são frios ao toque.
(-) A temperatura média da área do apoio para as mãos de dispositivos semelhantes foi 27.5 °C / 81.5 F (-2.5 °C / -4.5 F).
Lenovo ThinkPad E14 20RA001MGE análise de áudio
(±) | o volume do alto-falante é médio, mas bom (###valor### dB)
Graves 100 - 315Hz
(-) | quase nenhum baixo - em média 18.3% menor que a mediana
(-) | graves não são lineares (15.8% delta para frequência anterior)
Médios 400 - 2.000 Hz
(±) | médios mais altos - em média 6.4% maior que a mediana
(±) | a linearidade dos médios é média (8.2% delta para frequência anterior)
Altos 2 - 16 kHz
(+) | agudos equilibrados - apenas 3.2% longe da mediana
(±) | a linearidade dos máximos é média (11.7% delta para frequência anterior)
Geral 100 - 16.000 Hz
(±) | a linearidade do som geral é média (26.4% diferença em relação à mediana)
Comparado com a mesma classe
» 81% de todos os dispositivos testados nesta classe foram melhores, 7% semelhantes, 13% piores
» O melhor teve um delta de 7%, a média foi 21%, o pior foi 53%
Comparado com todos os dispositivos testados
» 81% de todos os dispositivos testados foram melhores, 4% semelhantes, 15% piores
» O melhor teve um delta de 4%, a média foi 23%, o pior foi 134%
Apple MacBook 12 (Early 2016) 1.1 GHz análise de áudio
(+) | os alto-falantes podem tocar relativamente alto (###valor### dB)
Graves 100 - 315Hz
(±) | graves reduzidos - em média 11.3% menor que a mediana
(±) | a linearidade dos graves é média (14.2% delta para a frequência anterior)
Médios 400 - 2.000 Hz
(+) | médios equilibrados - apenas 2.4% longe da mediana
(+) | médios são lineares (5.5% delta para frequência anterior)
Altos 2 - 16 kHz
(+) | agudos equilibrados - apenas 2% longe da mediana
(+) | os máximos são lineares (4.5% delta da frequência anterior)
Geral 100 - 16.000 Hz
(+) | o som geral é linear (10.2% diferença em relação à mediana)
Comparado com a mesma classe
» 7% de todos os dispositivos testados nesta classe foram melhores, 2% semelhantes, 90% piores
» O melhor teve um delta de 5%, a média foi 18%, o pior foi 53%
Comparado com todos os dispositivos testados
» 5% de todos os dispositivos testados foram melhores, 1% semelhantes, 94% piores
» O melhor teve um delta de 4%, a média foi 23%, o pior foi 134%
| desligado | |
| Ocioso | |
| Carga |
|
Key:
min: | |
| Lenovo ThinkPad E14 20RA001MGE i5-10210U, UHD Graphics 620, SK hynix BC501 HFM512GDHTNG-8310A, IPS LED, 1920x1080, 14" | Lenovo ThinkPad E490-20N8000RGE i5-8265U, UHD Graphics 620, SK hynix BC501 HFM256GDHTNG, IPS, 1920x1080, 14" | MSI Modern 14 A10RB-459US i5-10210U, GeForce MX250, Kingston RBUSNS8154P3512GJ, IPS, 1920x1080, 14" | Dell Latitude 3400 i3-8145U, UHD Graphics 620, WDC PC SN520 SDAPNUW-256G, IPS, 1920x1080, 14" | Lenovo ThinkPad T490-20N2004EGE i5-8265U, UHD Graphics 620, Toshiba KXG5AZNV256G, IGZO IPS LED, 1920x1080, 14" | Média Intel UHD Graphics 620 | Média da turma Office | |
|---|---|---|---|---|---|---|---|
| Power Consumption | 11% | -32% | 12% | 5% | -10% | -27% | |
| Idle Minimum * (Watt) | 3.01 | 2.76 8% | 4.2 -40% | 2.4 20% | 2.34 22% | 3.81 ? -27% | 4.3 ? -43% |
| Idle Average * (Watt) | 6.32 | 5.96 6% | 5.9 7% | 4.9 22% | 5.22 17% | 6.94 ? -10% | 7.33 ? -16% |
| Idle Maximum * (Watt) | 8.78 | 6.57 25% | 7.2 18% | 7.4 16% | 8.82 -0% | 8.75 ? -0% | 8.59 ? 2% |
| Load Average * (Watt) | 32.5 | 28.2 13% | 63.4 -95% | 31 5% | 35.8 -10% | 35 ? -8% | 43.6 ? -34% |
| Load Maximum * (Watt) | 45.5 | 43.6 4% | 67.4 -48% | 47 -3% | 47.3 -4% | 47.5 ? -4% | 64.4 ? -42% |
| Witcher 3 ultra * (Watt) | 53.5 |
* ... menor é melhor
| Lenovo ThinkPad E14 20RA001MGE i5-10210U, UHD Graphics 620, 45 Wh | Lenovo ThinkPad E490-20N8000RGE i5-8265U, UHD Graphics 620, 45 Wh | MSI Modern 14 A10RB-459US i5-10210U, GeForce MX250, 50 Wh | Lenovo ThinkPad T490-20N2004EGE i5-8265U, UHD Graphics 620, 50 Wh | Dell Latitude 3400 i3-8145U, UHD Graphics 620, 56 Wh | Média da turma Office | |
|---|---|---|---|---|---|---|
| Duração da bateria | 8% | 4% | 27% | 14% | 36% | |
| H.264 (h) | 10.3 | 11.5 12% | 11.3 10% | 15.5 ? 50% | ||
| WiFi v1.3 (h) | 8.5 | 8.1 -5% | 8.6 1% | 9.5 12% | 9.7 14% | 13 ? 53% |
| Load (h) | 1.7 | 2 18% | 1.8 6% | 2.7 59% | 1.808 ? 6% | |
| Reader / Idle (h) | 17.7 | 16.4 | 24.5 ? |
Pro
Contra

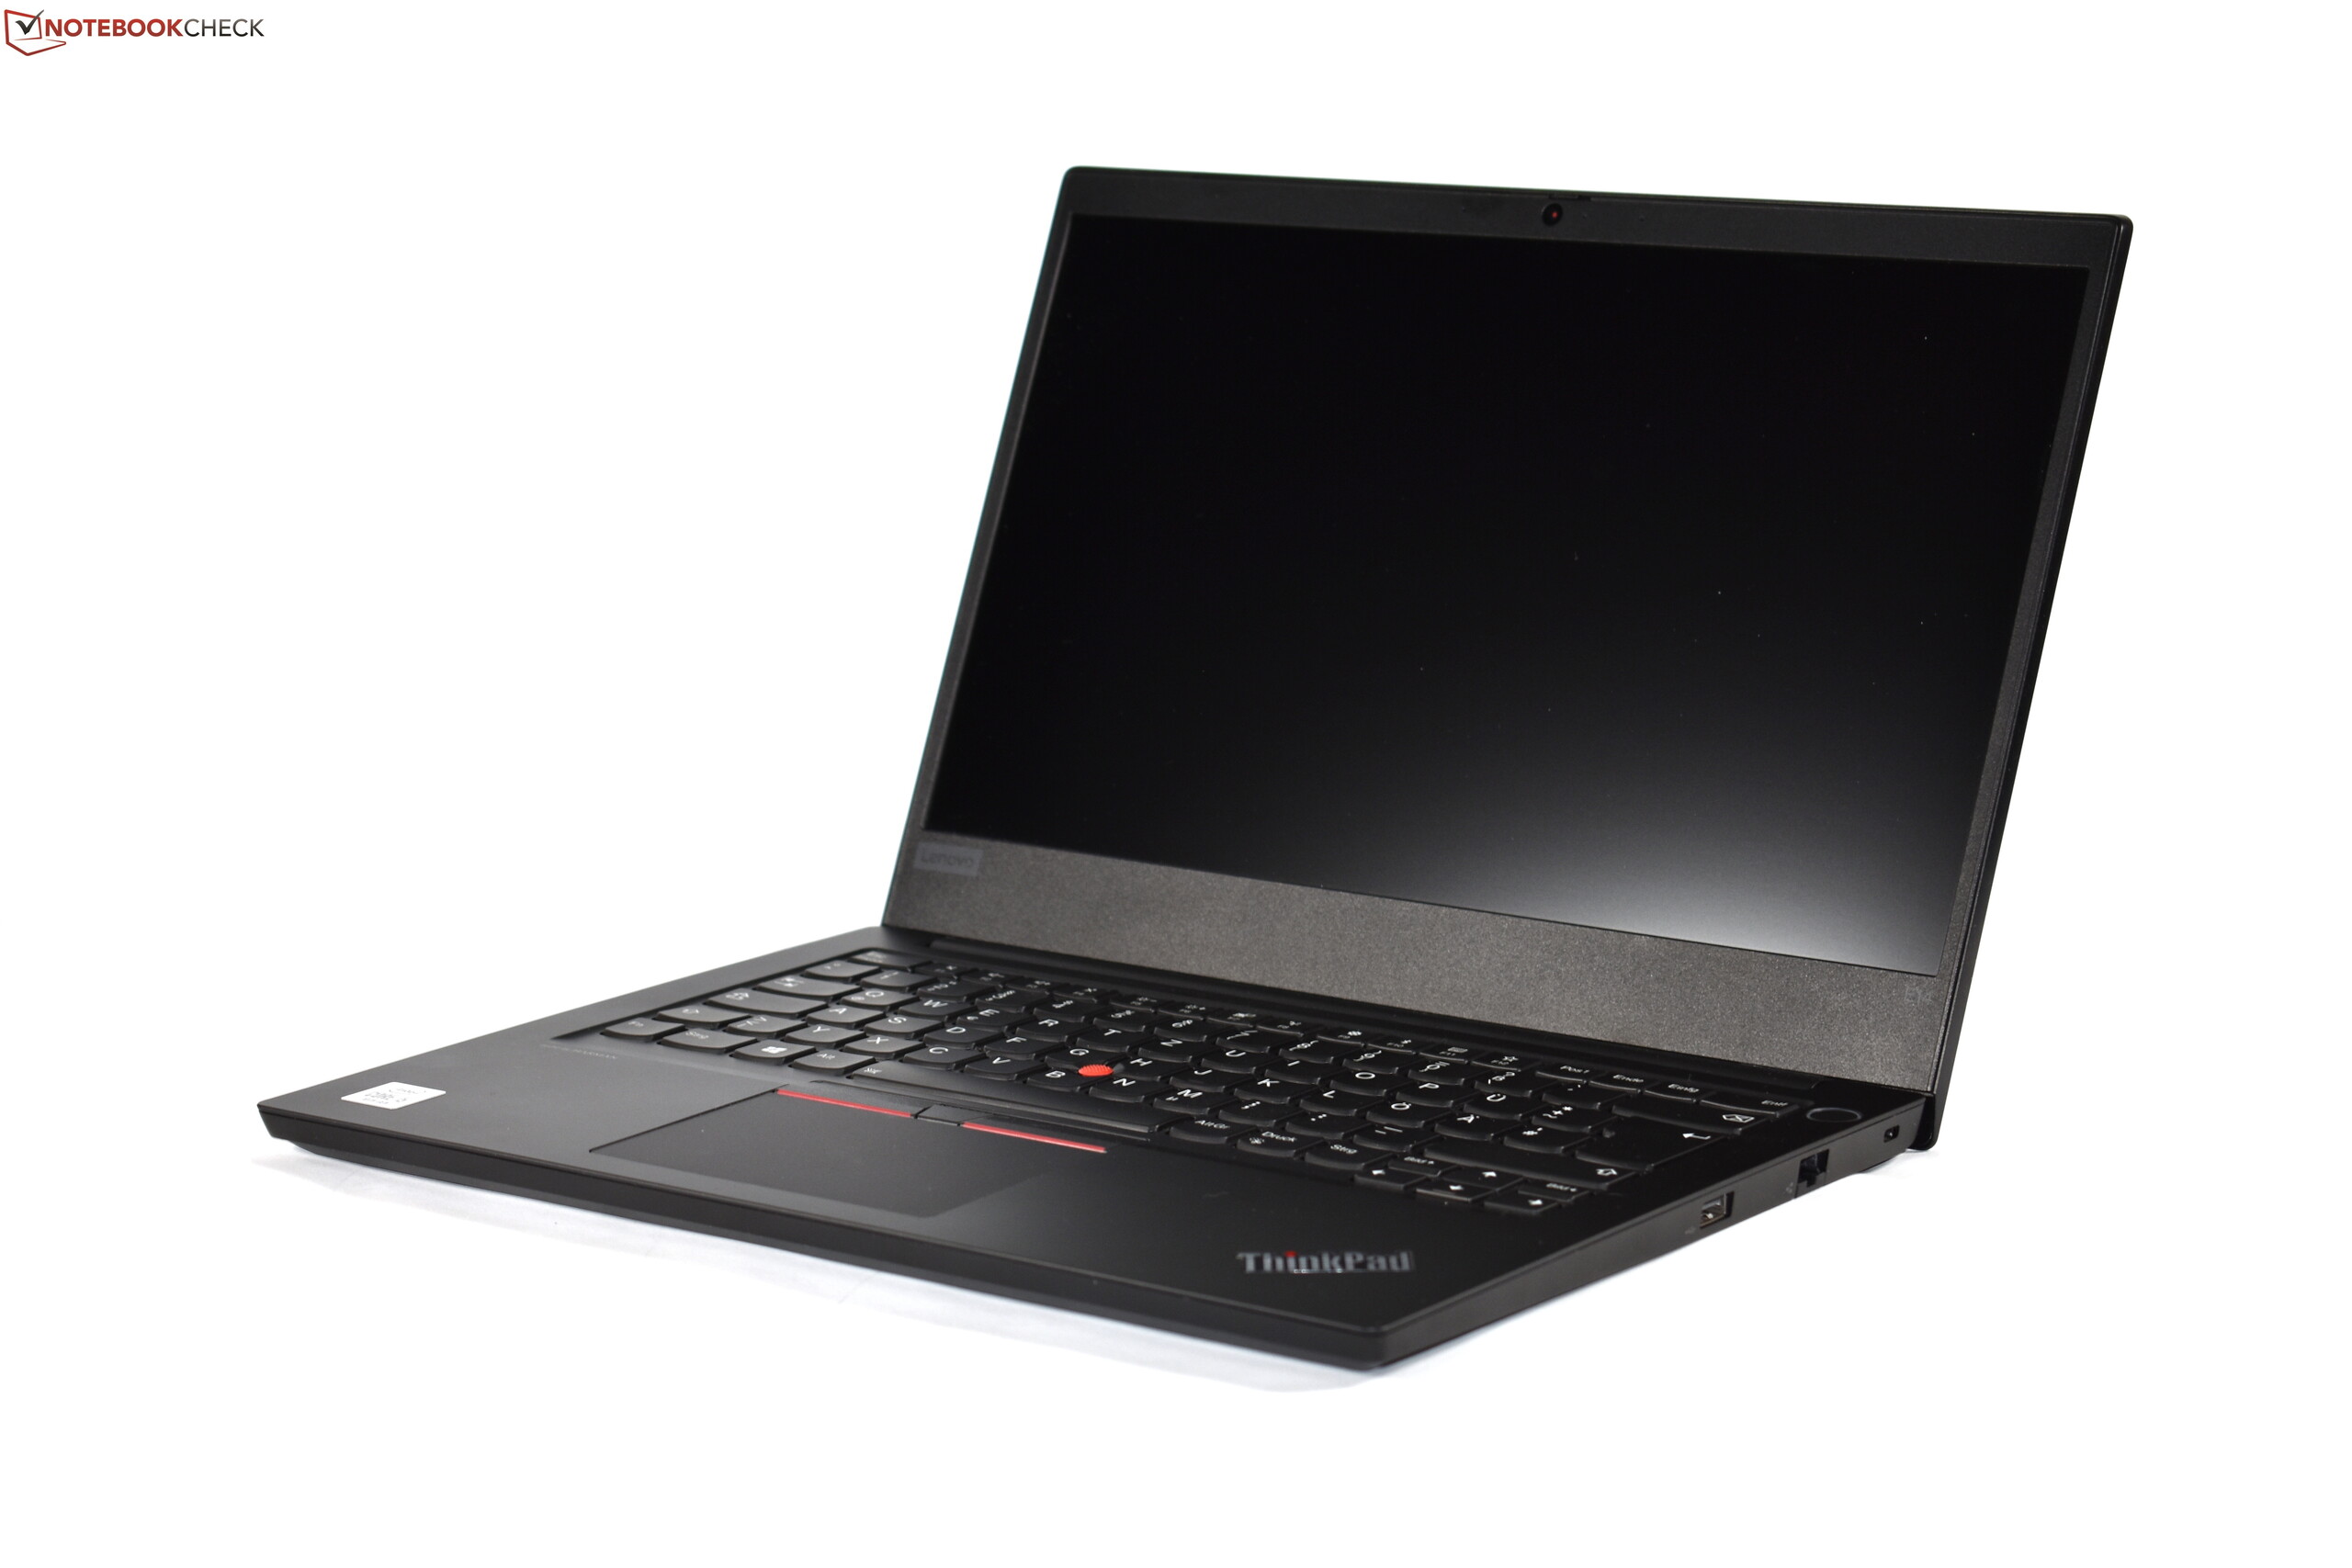
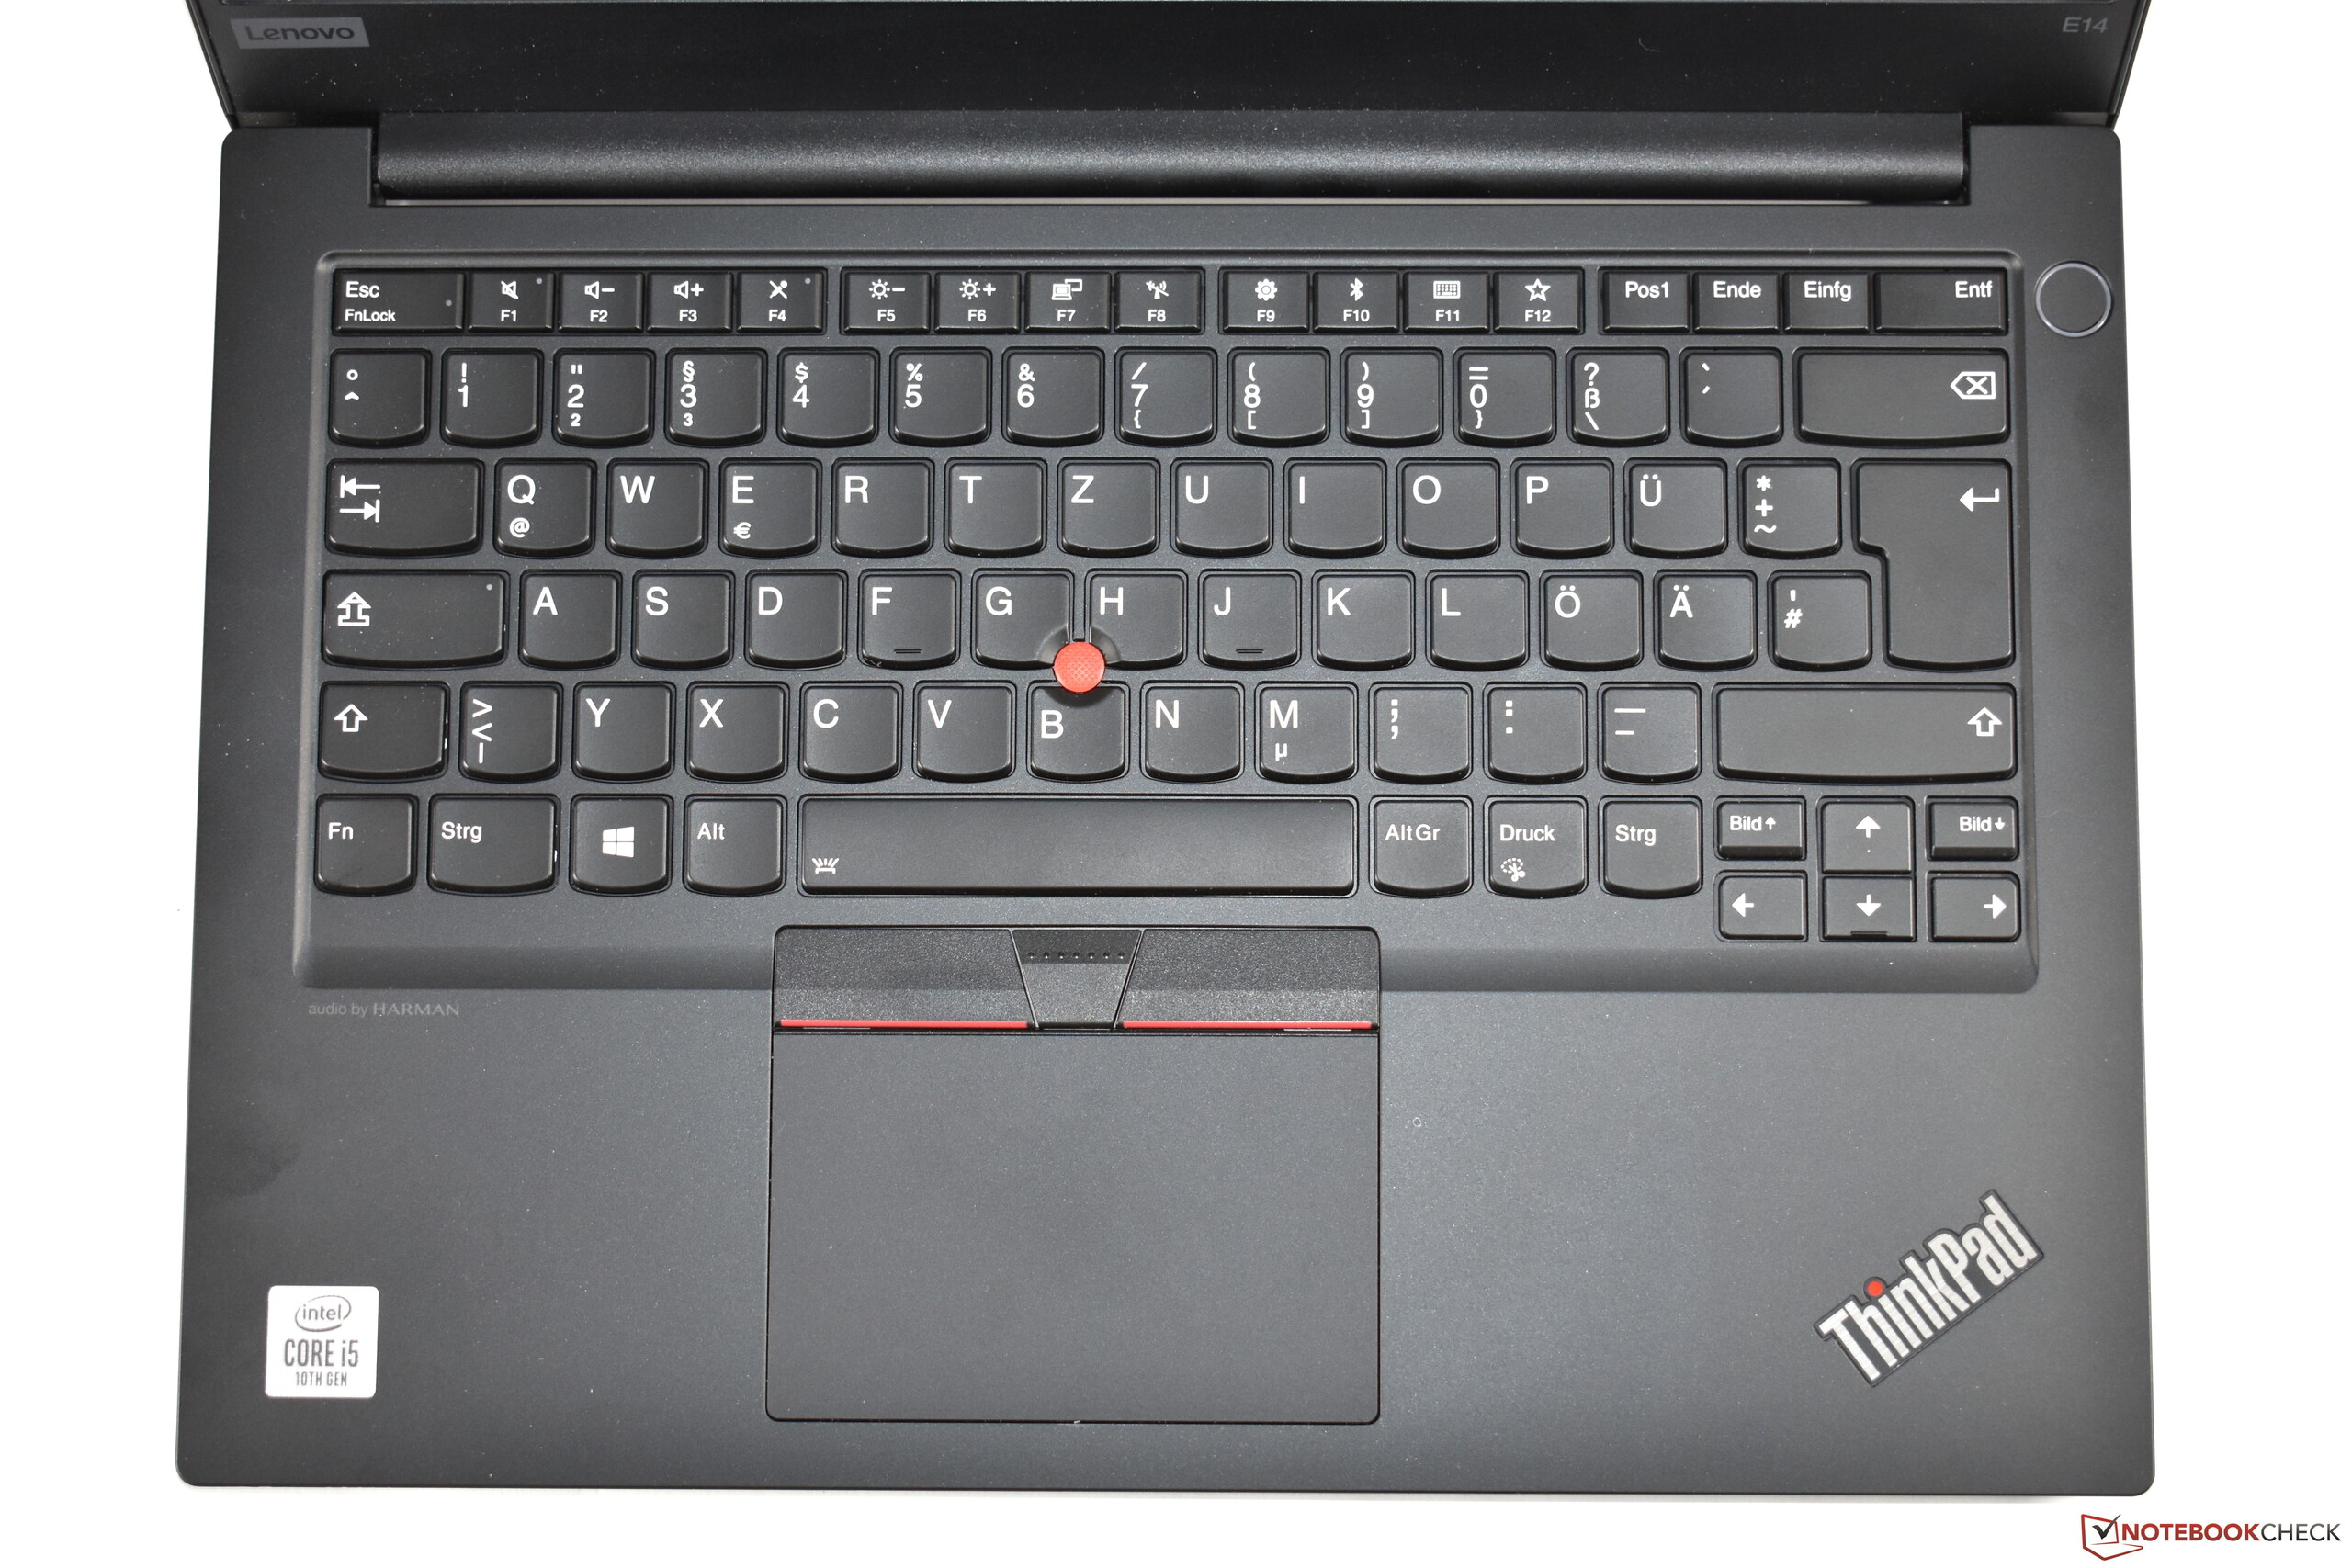
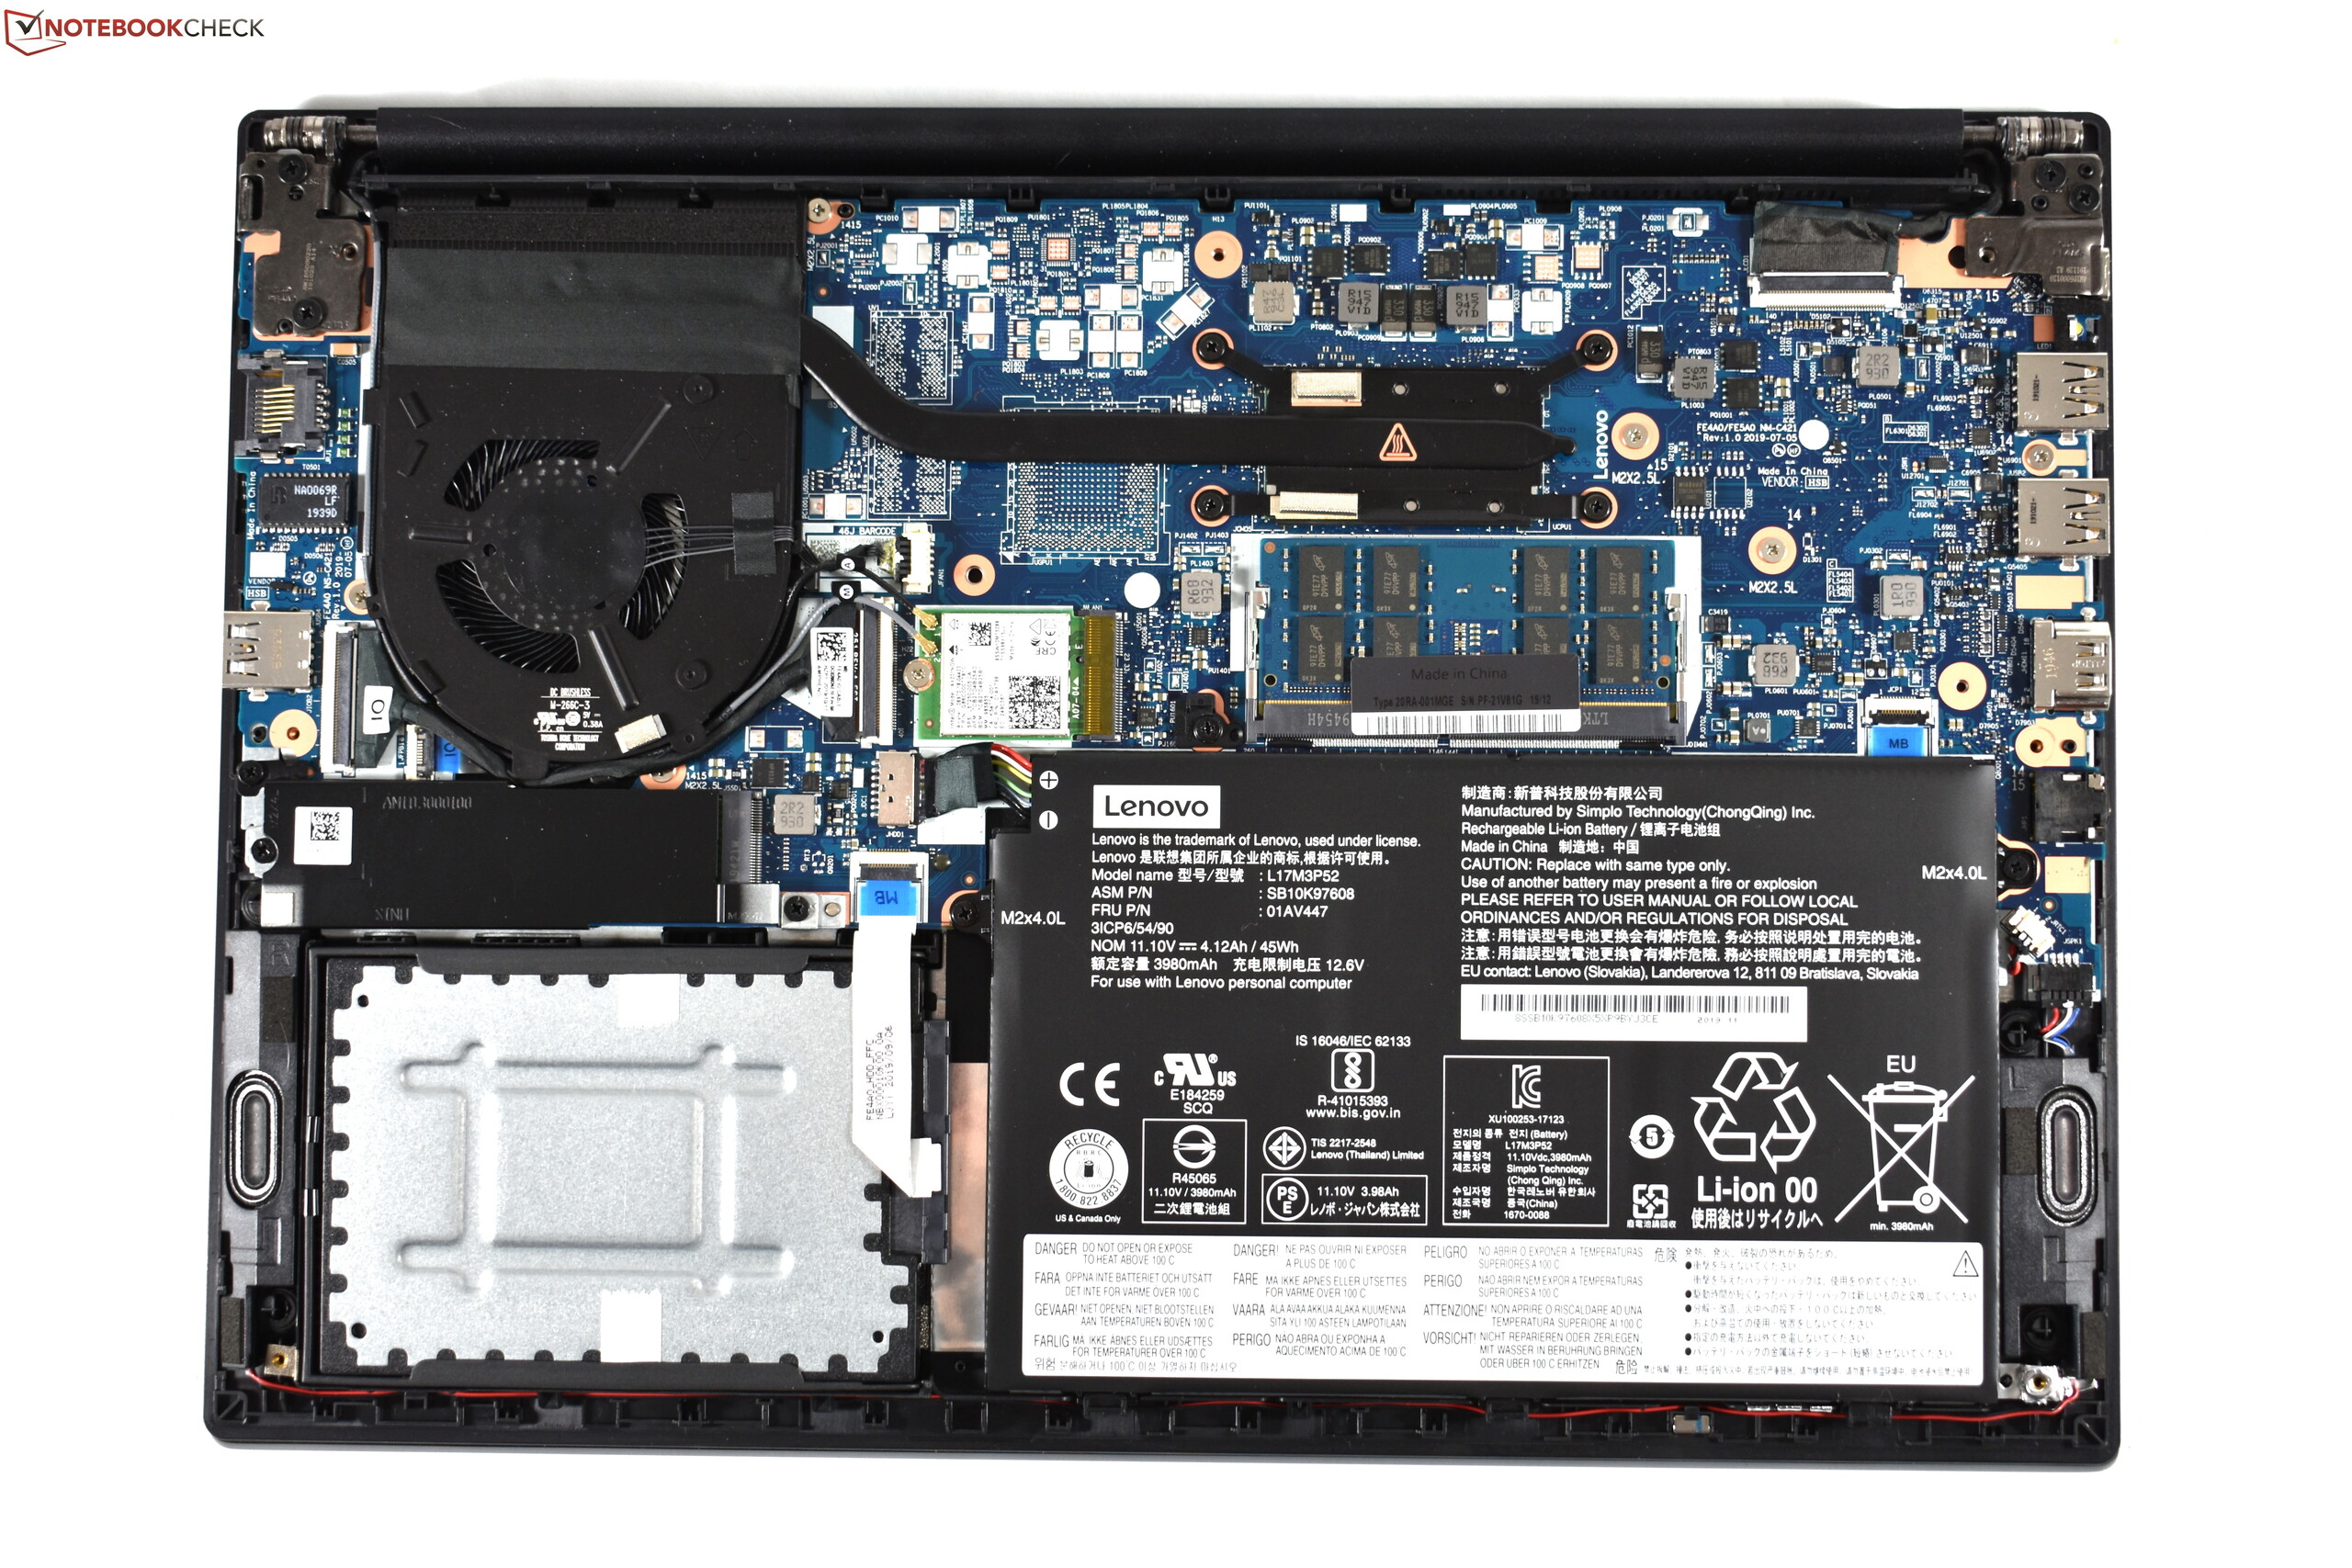
A Lenovo continua a evoluir a série E com o novo ThinkPad E14: O chassi mais fino recebe muitas dicas de design do ThinkPad E490 mais antigo e, portanto, possui muitos de seus pontos fortes. Um deles: Os ótimos dispositivos de entrada ThinkPad Outros incluem a boa duração da bateria e o baixo nível de calor/ruído, mesmo sob carga. O ThinkPad E14 ainda também pode ser atualizado, principalmente quando se trata de armazenamento. Além disso, graças ao aumento do uso de alumínio, a qualidade háptica melhorou.
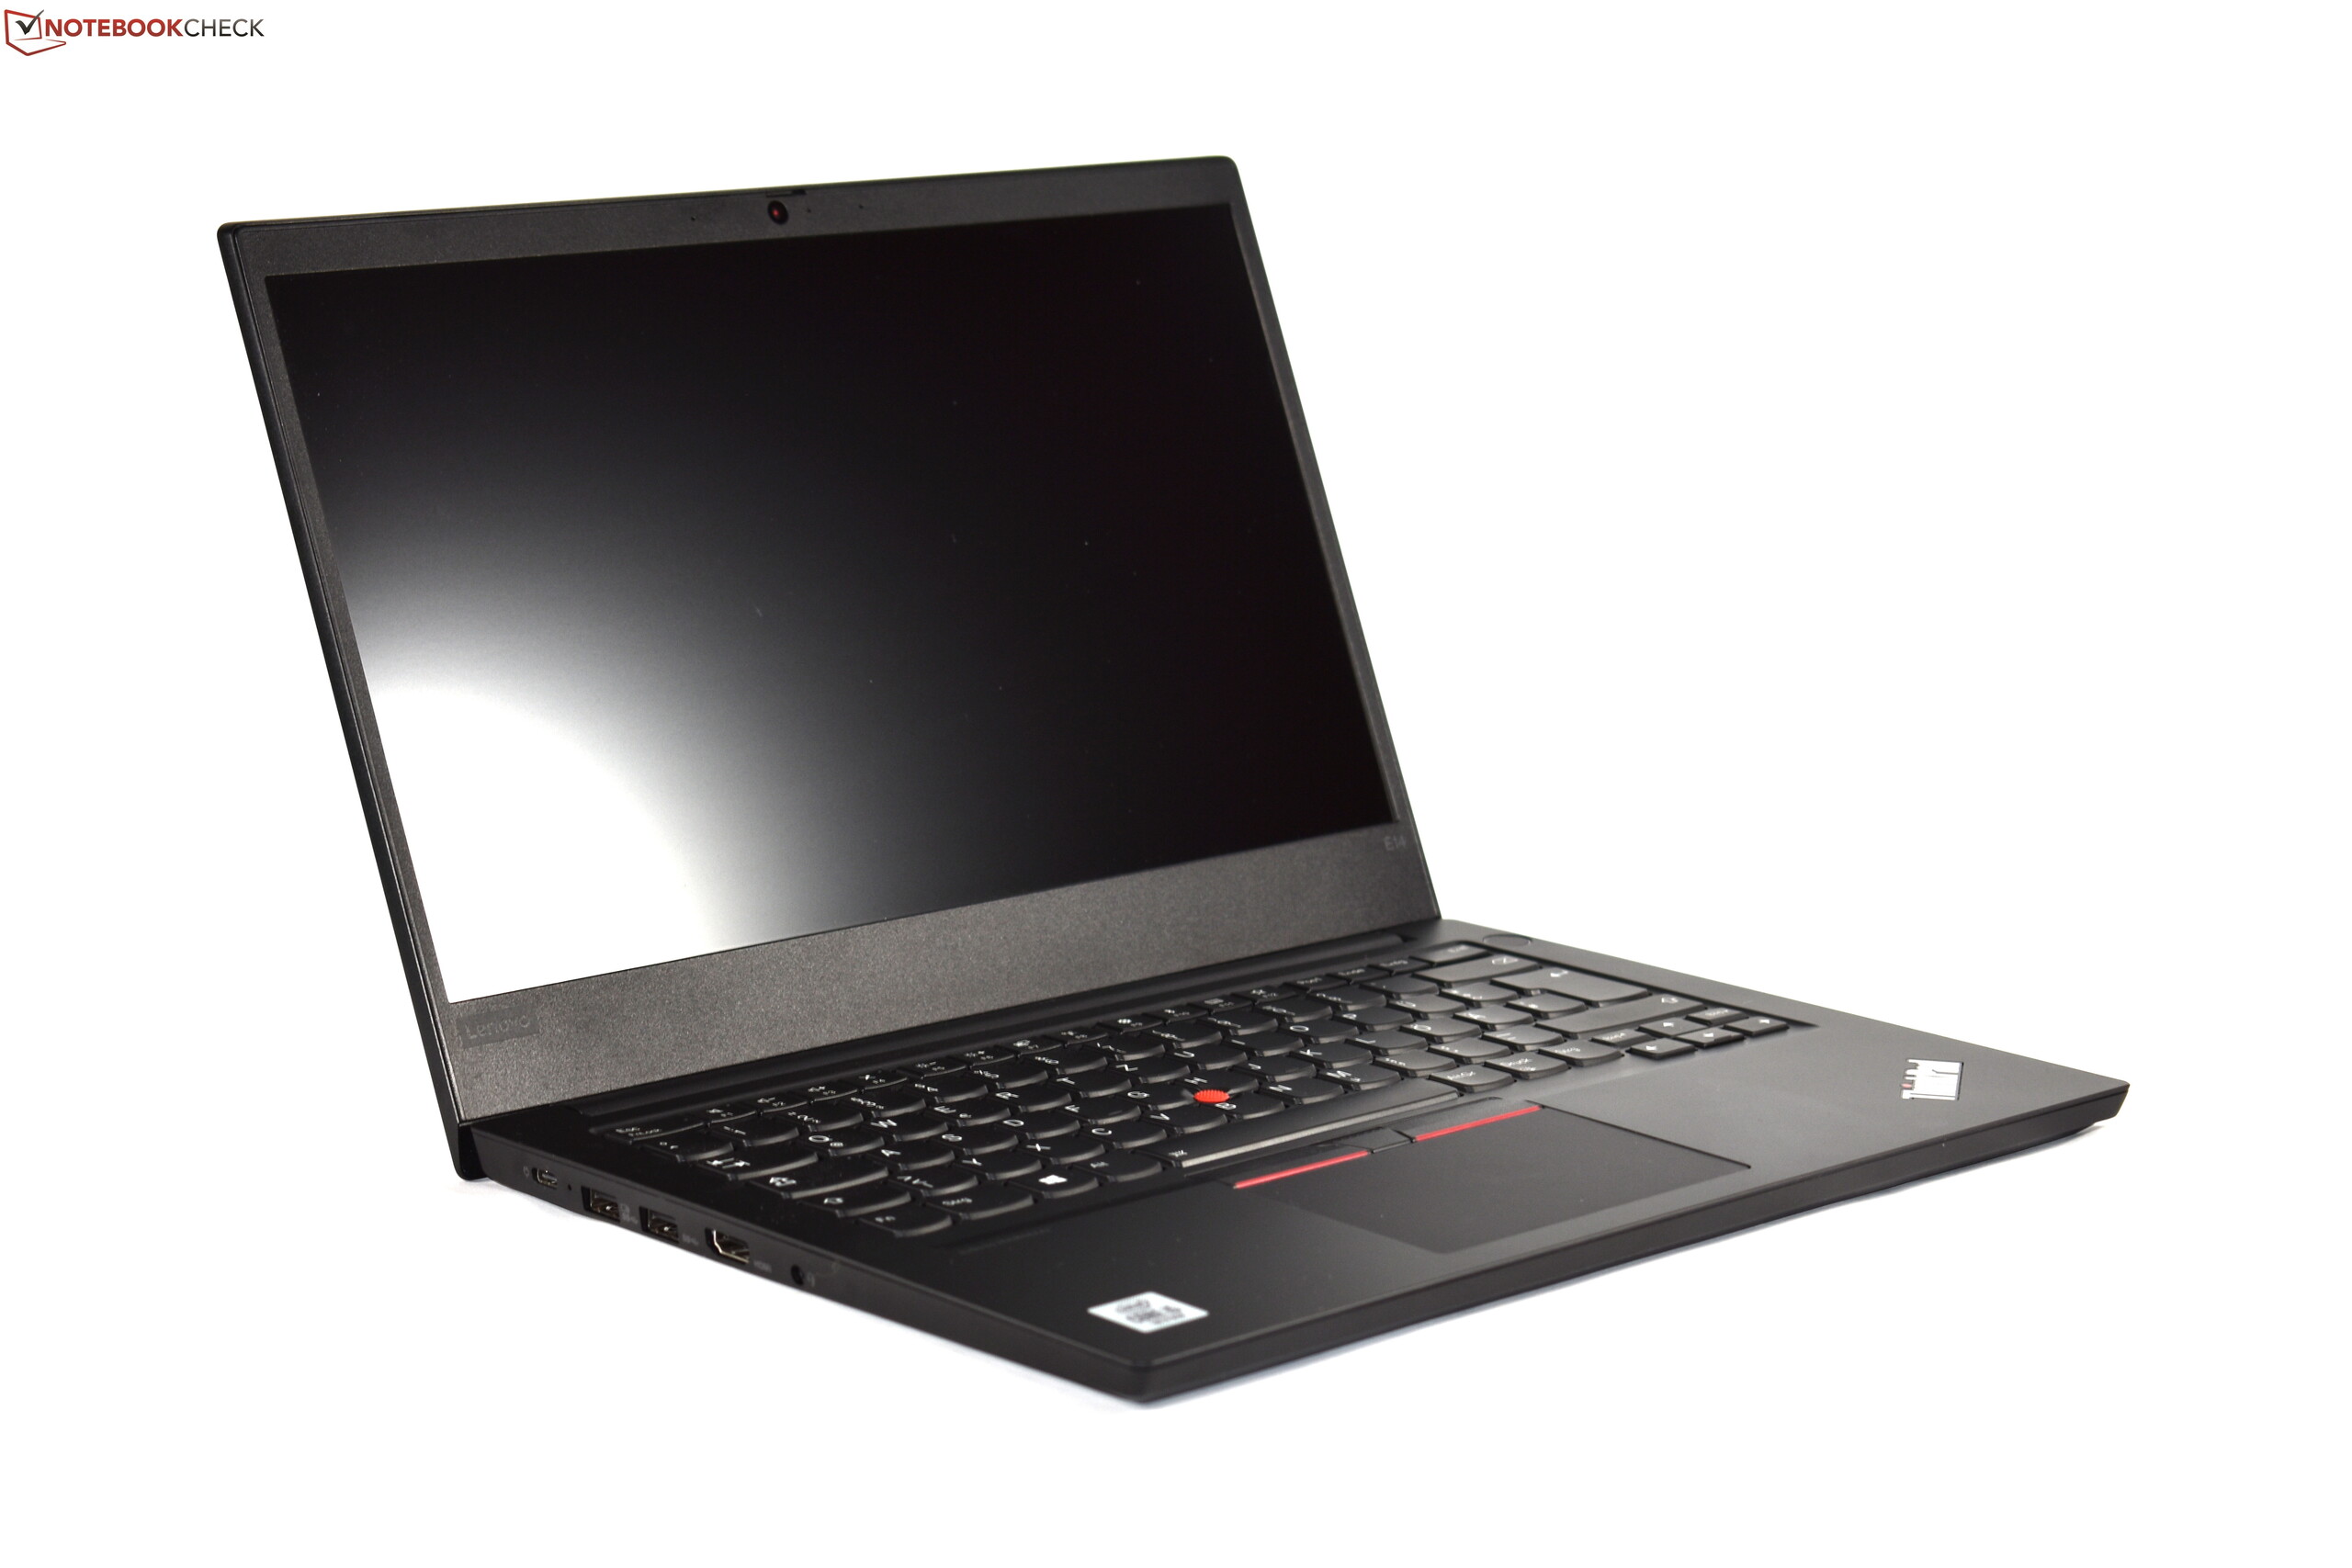
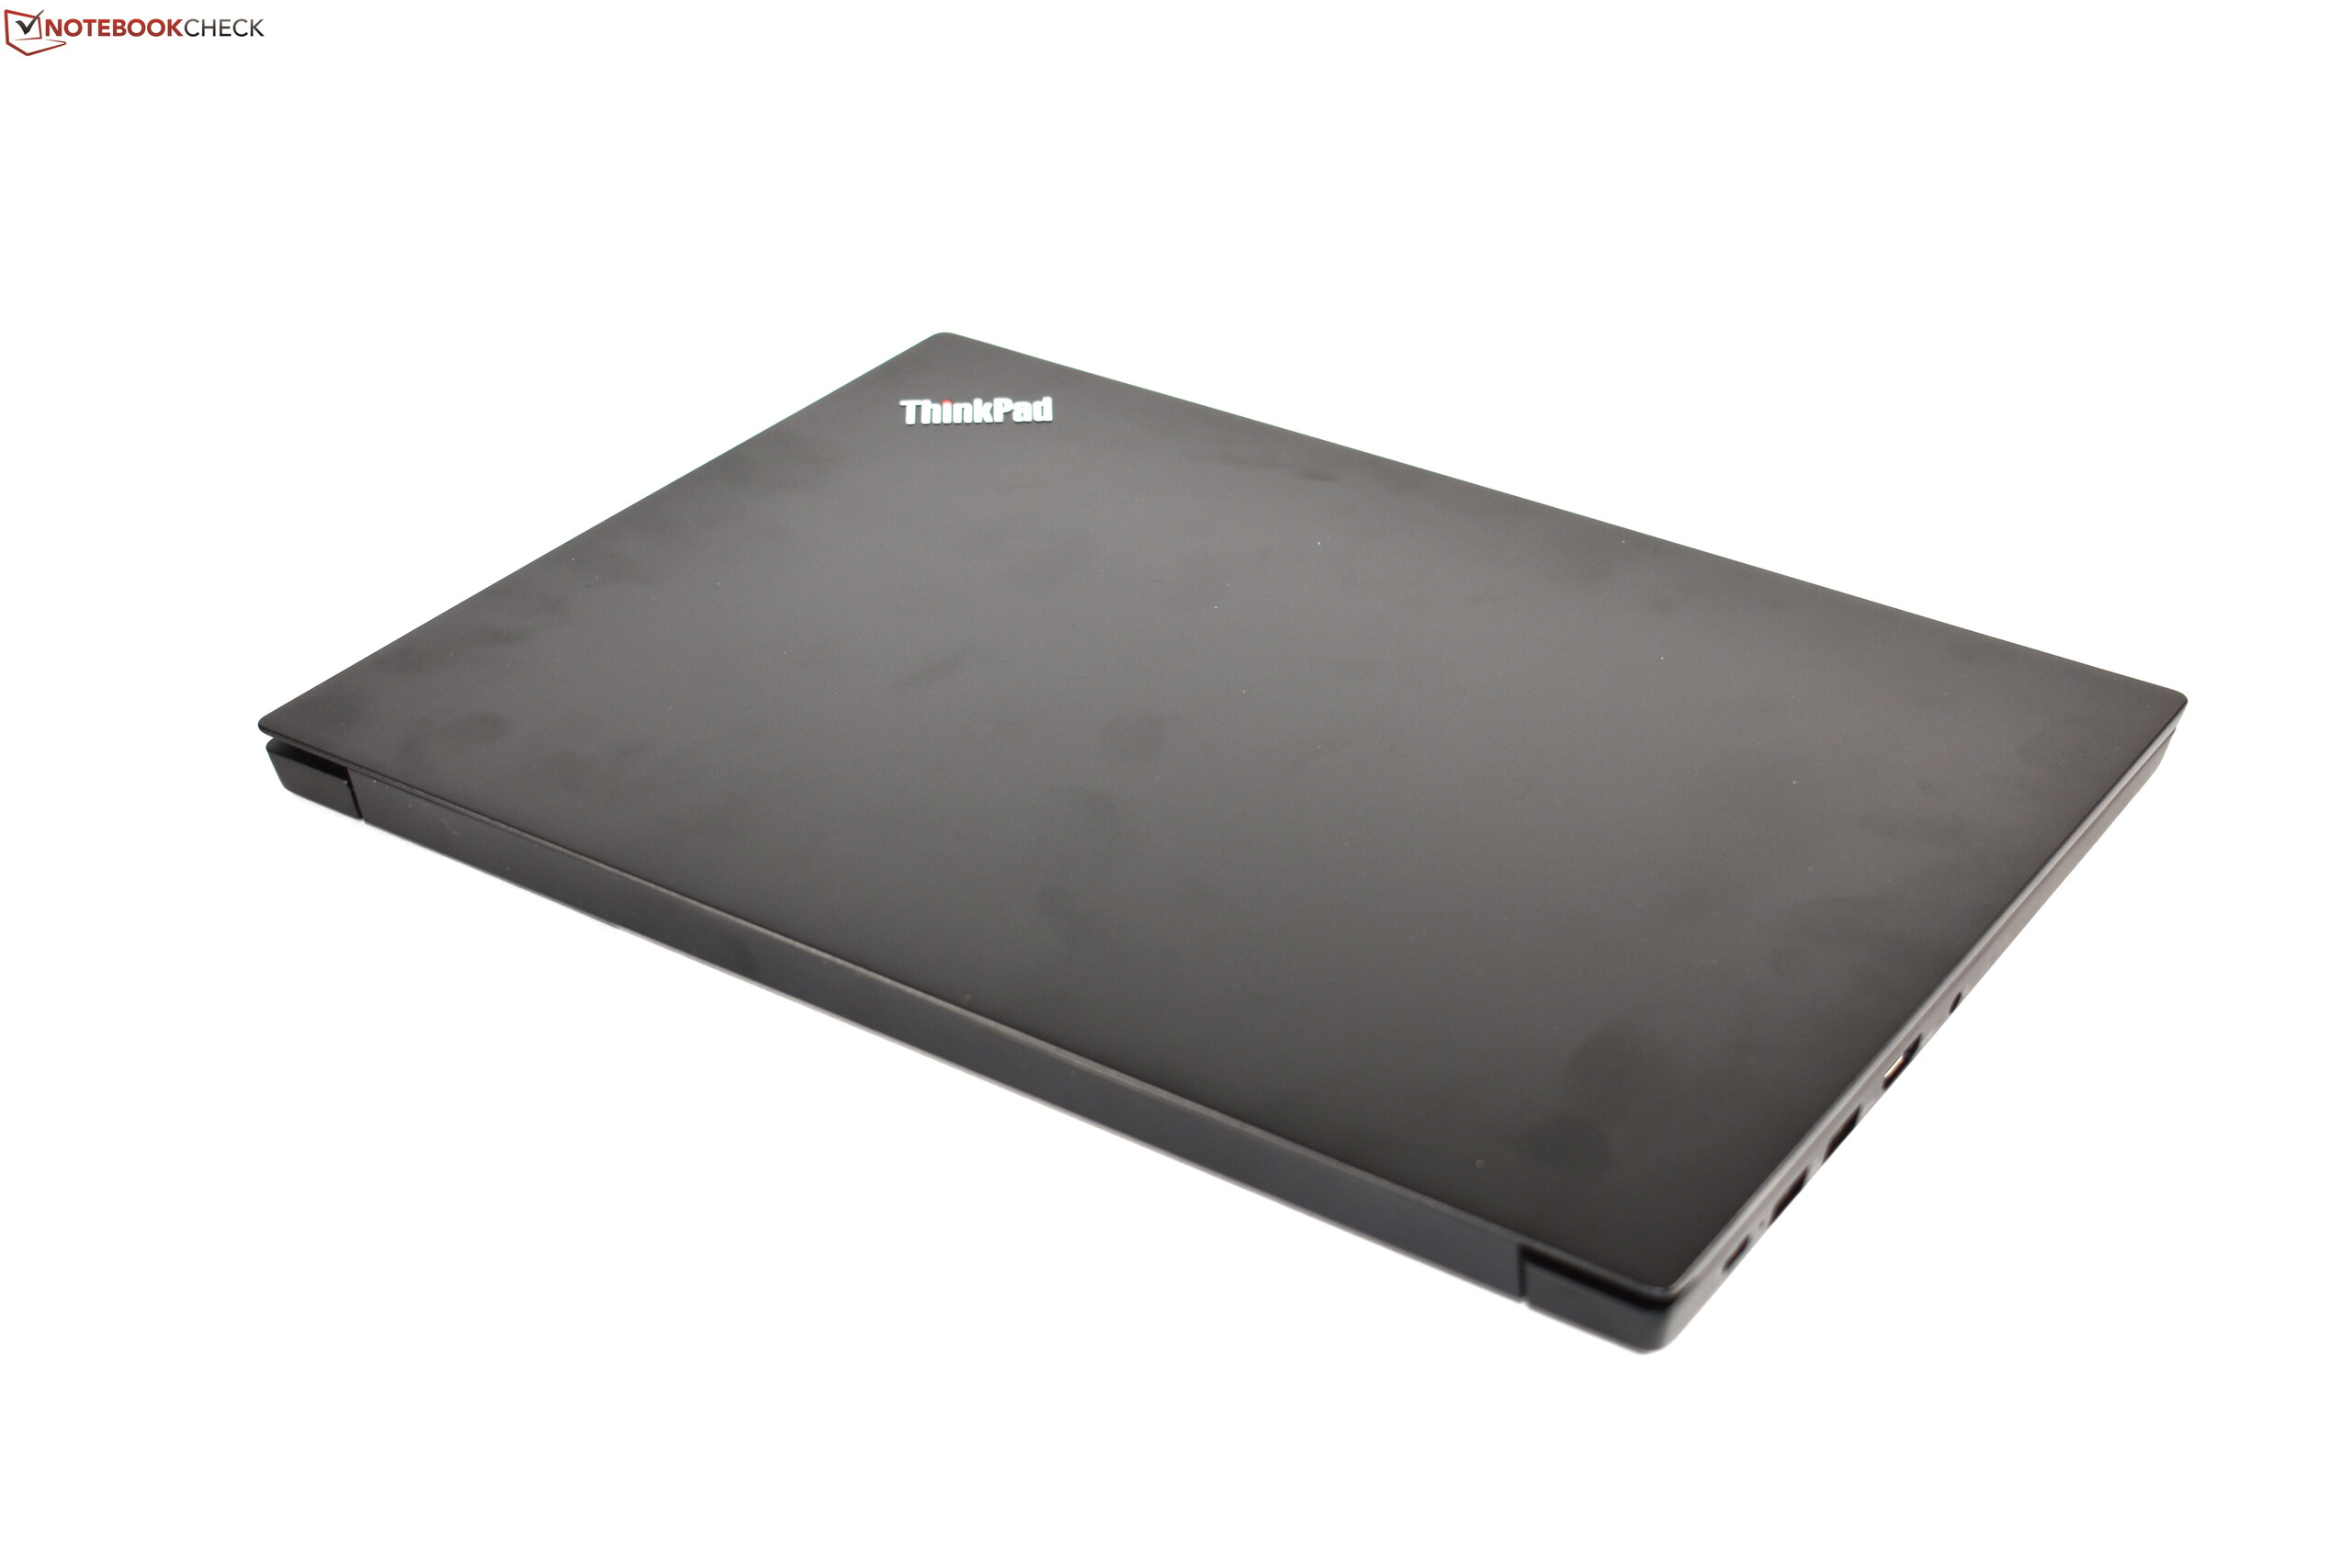
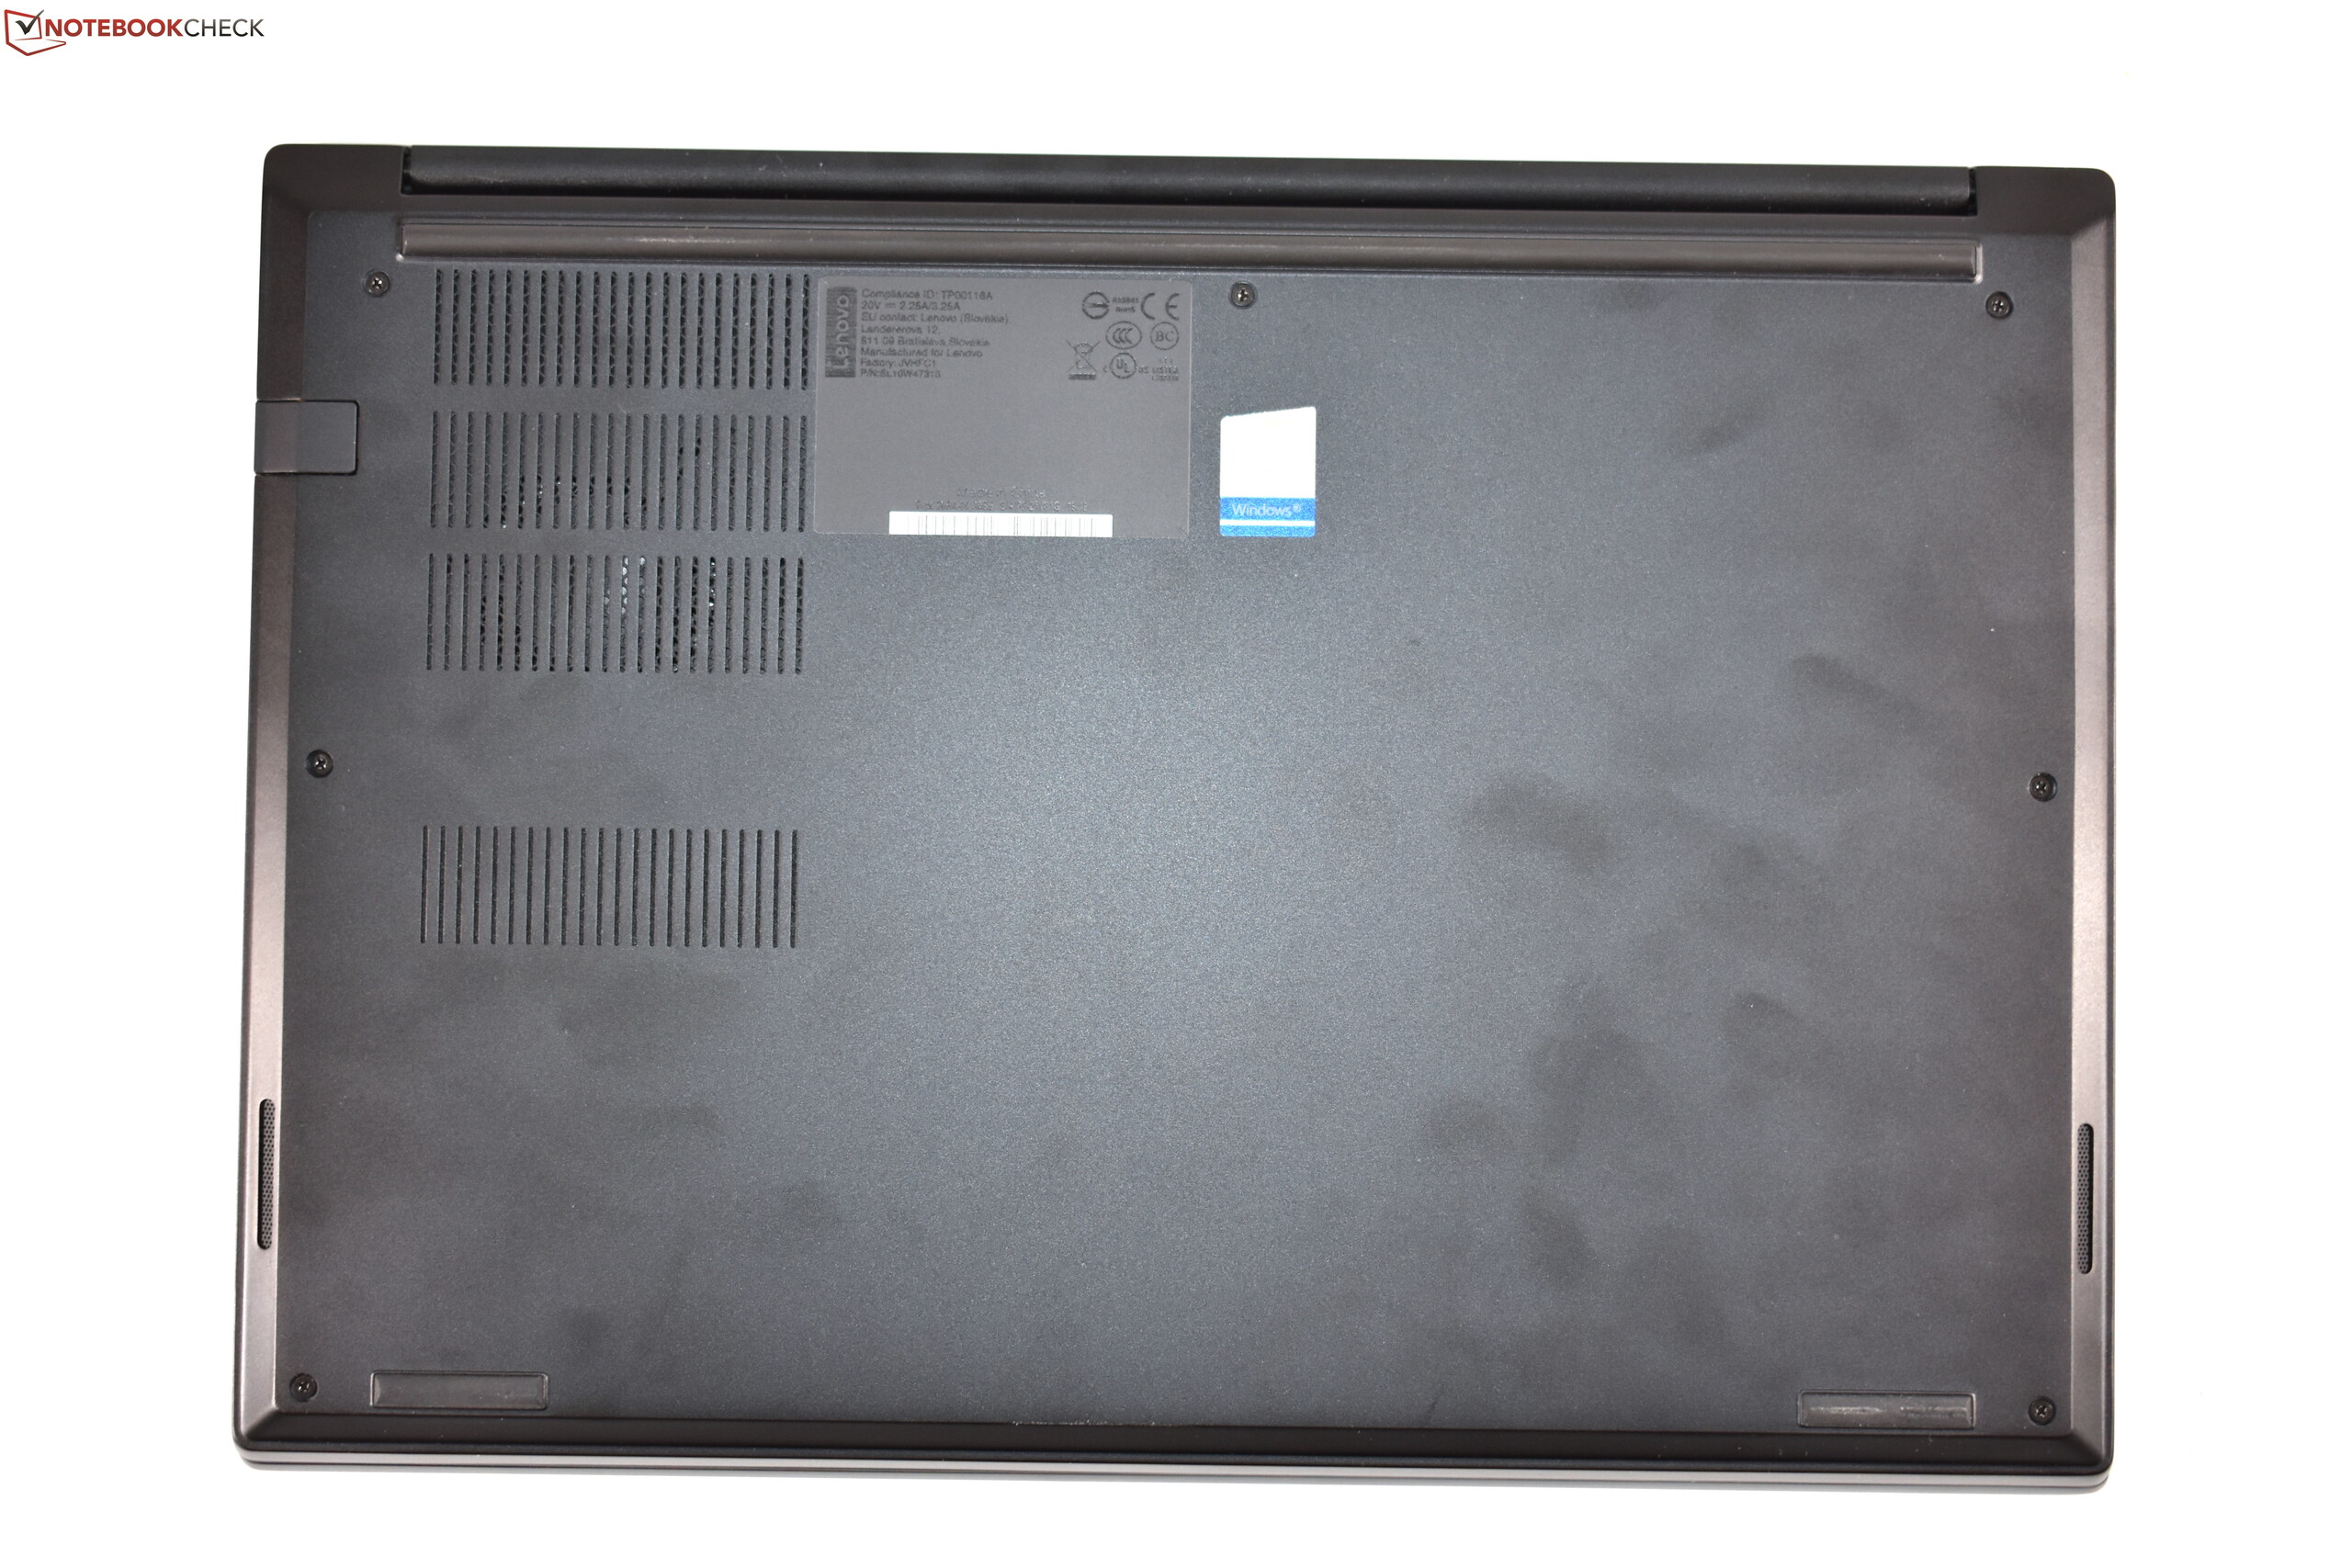
Infelizmente, também há alguns passos para trás. O slot para cartão microSD foi eliminado sem substituição. A capacidade de atualização da RAM também foi restrita: Em vez de dois slots SO-DIMM e memória de canal duplo de até 64 GB, o E14 oferece apenas um único slot de RAM com memória de canal único de até 32 GB. Outros pontos negativos incluem os curtos 12 meses de garantia e a tela, que possui uma cobertura de cores ruim. Um pouco preocupante é ruído da área da dobradiça ao fechar a tela - o acabamento definitivamente não é perfeito aqui.
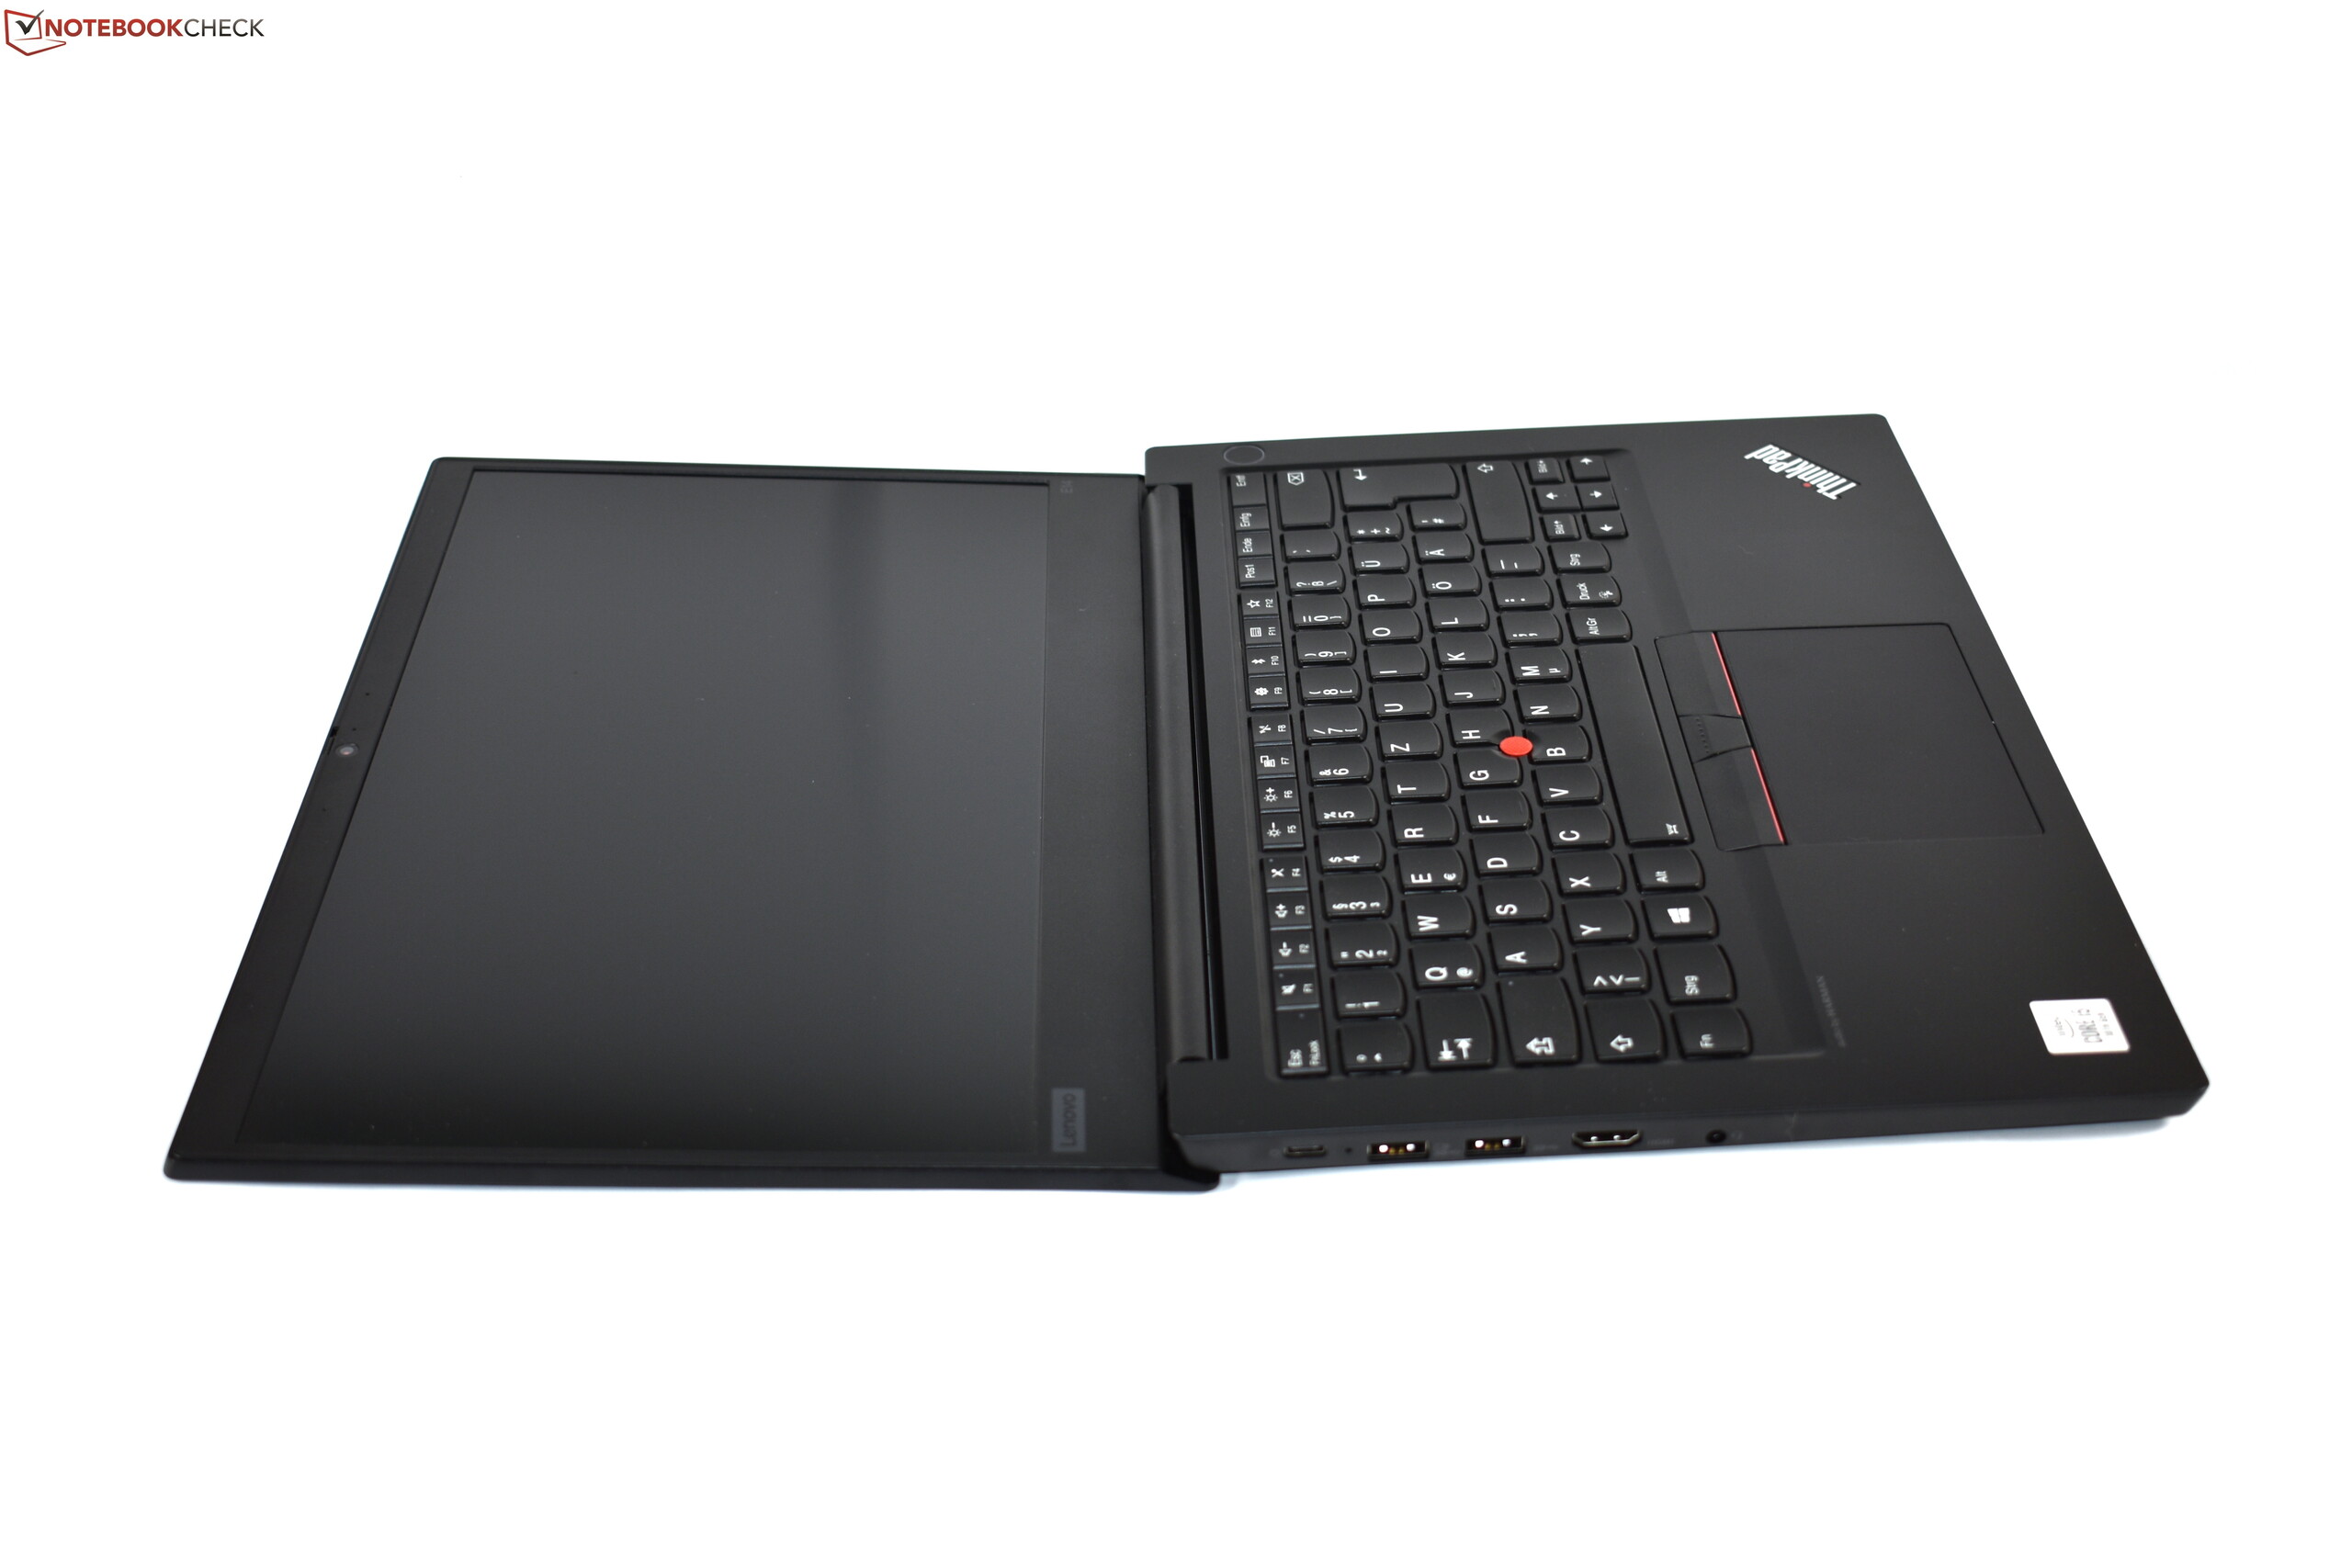
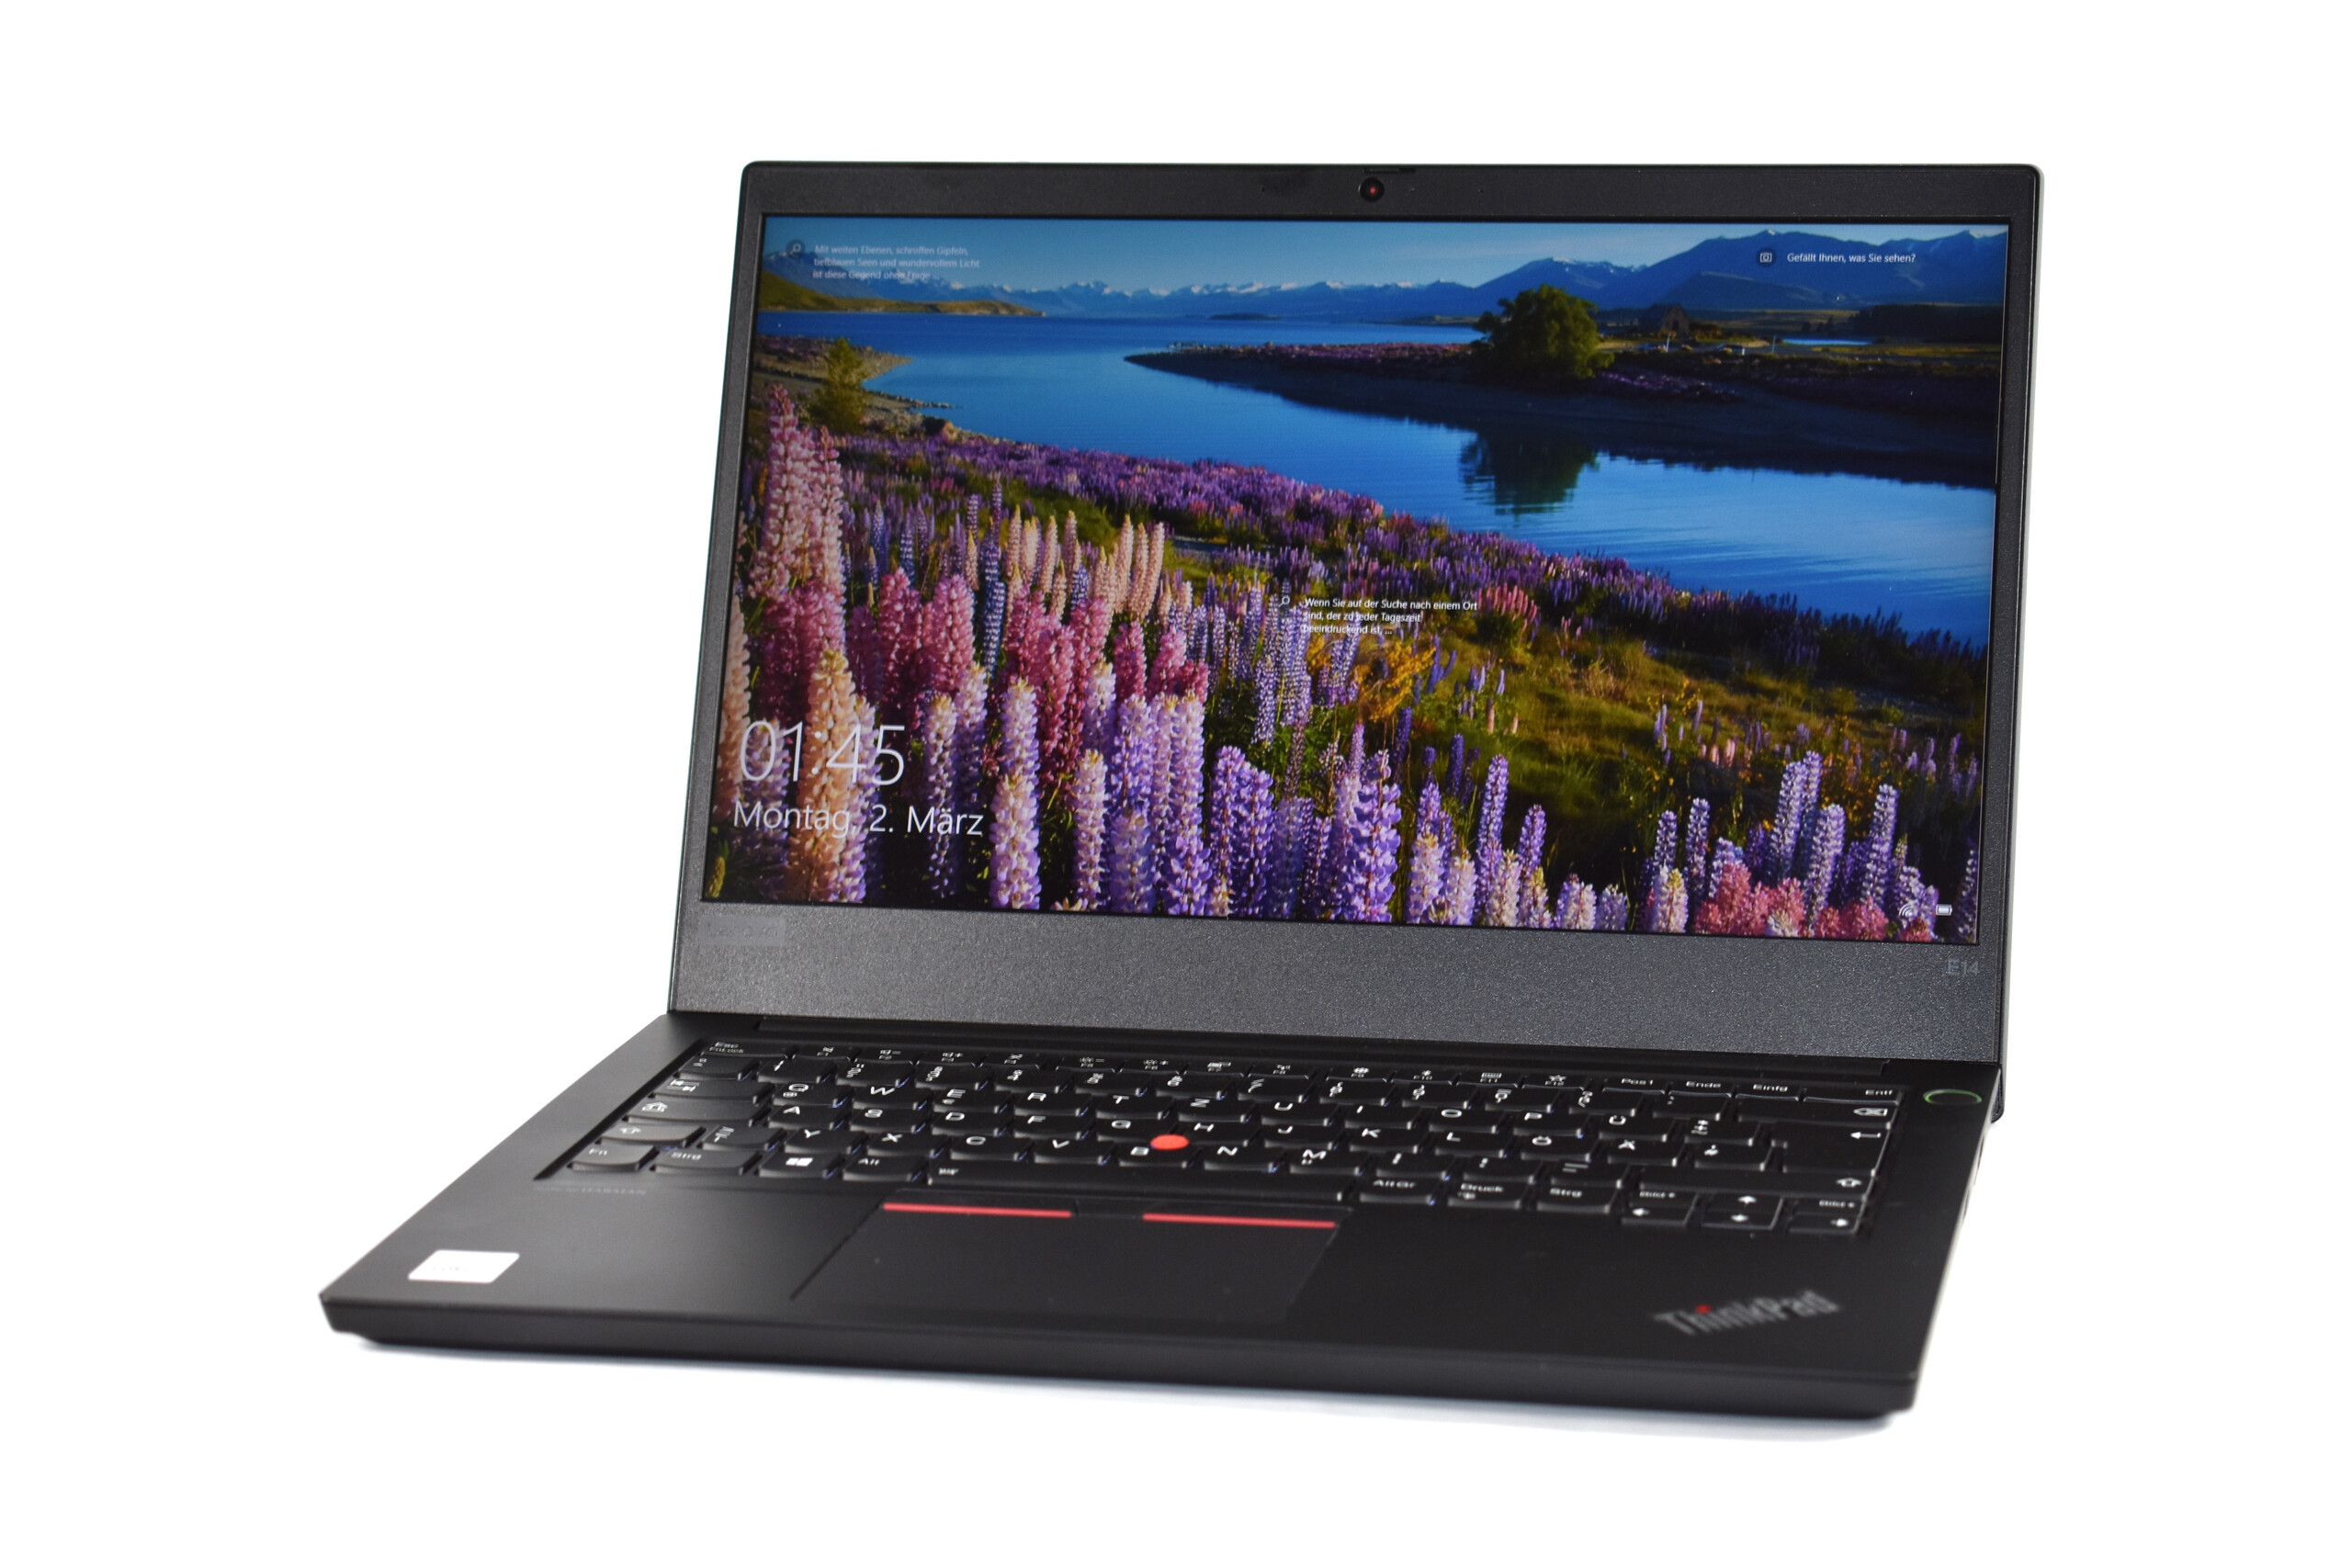
Não é realmente melhor que o antecessor: O Lenovo ThinkPad E14 elimina desnecessariamente alguns recursos.
No geral, ainda podemos recomendar o Lenovo ThinkPad E14 como um portátil ThinkPad sólido por um orçamento menor, apesar das desvantagens - apesar de acharmos que não é tão atraente quanto o antecessor ThinkPad E490, devido à perda de recursos.
Lenovo ThinkPad E14 20RA001MGE
- 03/03/2020 v7 (old)
Benjamin Herzig
Price comparison
