Breve Análise do Portátil MSI Modern 14 A10RB: Mais leve do que parece
Avaliação | Data | Modelo | Peso | Altura | Size | Resolução | Preço |
|---|---|---|---|---|---|---|---|
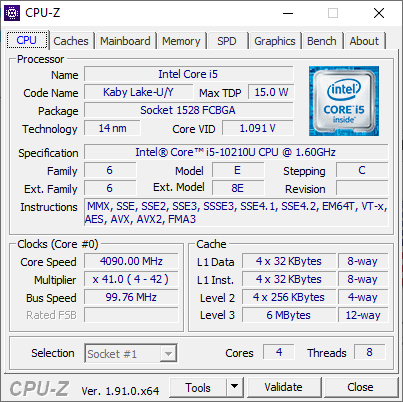
| 80.9 % v7 (old) | 01/2020 | MSI Modern 14 A10RB-459US i5-10210U, GeForce MX250 | 1.2 kg | 16 mm | 14.00" | 1920x1080 |
| SD Card Reader | |
| average JPG Copy Test (av. of 3 runs) | |
| Dell XPS 15 7590 9980HK GTX 1650 (Toshiba Exceria Pro SDXC 64 GB UHS-II) | |
| Asus ZenBook 15 UX534FT-DB77 (Toshiba Exceria Pro SDXC 64 GB UHS-II) | |
| MSI Modern 14 A10RB-459US (Toshiba Exceria Pro SDXC 64 GB UHS-II) | |
| maximum AS SSD Seq Read Test (1GB) | |
| Dell XPS 15 7590 9980HK GTX 1650 (Toshiba Exceria Pro SDXC 64 GB UHS-II) | |
| Asus ZenBook 15 UX534FT-DB77 (Toshiba Exceria Pro SDXC 64 GB UHS-II) | |
| MSI Modern 14 A10RB-459US (Toshiba Exceria Pro SDXC 64 GB UHS-II) | |
| Networking | |
| iperf3 transmit AX12 | |
| MSI Prestige 15 A10SC | |
| Asus ZenBook 15 UX534FT-DB77 | |
| iperf3 receive AX12 | |
| MSI Prestige 15 A10SC | |
| Asus ZenBook 15 UX534FT-DB77 | |
| |||||||||||||||||||||||||
iluminação: 87 %
iluminação com acumulador: 324.1 cd/m²
Contraste: 1473:1 (Preto: 0.22 cd/m²)
ΔE ColorChecker Calman: 1.63 | ∀{0.5-29.43 Ø4.72}
calibrated: 1.42
ΔE Greyscale Calman: 2.2 | ∀{0.09-98 Ø4.97}
95% sRGB (Argyll 1.6.3 3D)
60.2% AdobeRGB 1998 (Argyll 1.6.3 3D)
65.4% AdobeRGB 1998 (Argyll 3D)
94.8% sRGB (Argyll 3D)
64.2% Display P3 (Argyll 3D)
Gamma: 2.26
CCT: 6887 K
| MSI Modern 14 A10RB-459US Chi Mei N140HCE-EN2, IPS, 14", 1920x1080 | MSI Prestige 14 i7-10710U AUO123B, , 14", 3840x2160 | Asus ZenBook 15 UX534FT-DB77 BOE NV156FHM-N63, IPS, 15.6", 1920x1080 | Lenovo Yoga C940-14IIL LP140WF9-SPE2, IPS LED, 14", 1920x1080 | Dell XPS 15 7590 9980HK GTX 1650 Samsung 156WR04, SDCA029, OLED, 15.6", 3840x2160 | Apple MacBook Pro 16 2019 i9 5500M APPA044, IPS, 16", 3072x1920 | |
|---|---|---|---|---|---|---|
| Display | 26% | -2% | 3% | 27% | ||
| Display P3 Coverage (%) | 64.2 | 81.5 27% | 66.6 4% | 66 3% | 88.1 37% | |
| sRGB Coverage (%) | 94.8 | 99 4% | 87.7 -7% | 97.9 3% | 99.6 5% | |
| AdobeRGB 1998 Coverage (%) | 65.4 | 95.4 46% | 64.1 -2% | 67.3 3% | 91.8 40% | |
| Response Times | 1% | -6% | 94% | -16% | ||
| Response Time Grey 50% / Grey 80% * (ms) | 39.2 ? | 41.2 ? -5% | 49.6 ? -27% | 2.3 ? 94% | 52.4 ? -34% | |
| Response Time Black / White * (ms) | 35.6 ? | 33.2 ? 7% | 30 ? 16% | 2.4 ? 93% | 34.9 ? 2% | |
| PWM Frequency (Hz) | 25000 ? | 59.5 ? | 131700 | |||
| Screen | -5% | -70% | -9% | -45% | 6% | |
| Brightness middle (cd/m²) | 324.1 | 568 75% | 312.6 -4% | 384 18% | 421.2 30% | 519 60% |
| Brightness (cd/m²) | 301 | 513 70% | 290 -4% | 363 21% | 417 39% | 477 58% |
| Brightness Distribution (%) | 87 | 87 0% | 85 -2% | 90 3% | 94 8% | 86 -1% |
| Black Level * (cd/m²) | 0.22 | 0.28 -27% | 0.31 -41% | 0.17 23% | 0.39 -77% | |
| Contrast (:1) | 1473 | 2029 38% | 1008 -32% | 2259 53% | 1331 -10% | |
| Colorchecker dE 2000 * | 1.63 | 3.18 -95% | 5.78 -255% | 3.5 -115% | 6.06 -272% | 2.28 -40% |
| Colorchecker dE 2000 max. * | 4.25 | 7.01 -65% | 8.86 -108% | 5.5 -29% | 11.89 -180% | 6.54 -54% |
| Colorchecker dE 2000 calibrated * | 1.42 | 1.14 20% | 3.78 -166% | 1 30% | 0.86 39% | |
| Greyscale dE 2000 * | 2.2 | 4.79 -118% | 5.4 -145% | 4.6 -109% | 2.8 -27% | 0.9 59% |
| Gamma | 2.26 97% | 2.49 88% | 2.21 100% | 2.32 95% | 2.15 102% | 2145 0% |
| CCT | 6887 94% | 6488 100% | 7864 83% | 6884 94% | 6235 104% | 6572 99% |
| Color Space (Percent of AdobeRGB 1998) (%) | 60.2 | 85 41% | 57.1 -5% | 62 3% | 81 35% | 78 30% |
| Color Space (Percent of sRGB) (%) | 95 | 99 4% | 87.4 -8% | 97.7 3% | 99.6 5% | |
| Média Total (Programa/Configurações) | 11% /
1% | -24% /
-48% | -4% /
-6% | 25% /
-7% | -5% /
3% |
* ... menor é melhor
Exibir tempos de resposta
| ↔ Tempo de resposta preto para branco | ||
|---|---|---|
| 35.6 ms ... ascensão ↗ e queda ↘ combinadas | ↗ 21.2 ms ascensão | 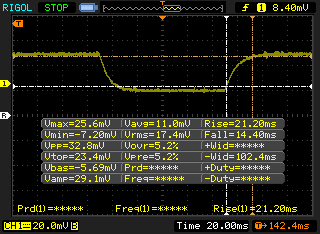 |
| ↘ 14.4 ms queda | ||
| A tela mostra taxas de resposta lentas em nossos testes e será insatisfatória para os jogadores. Em comparação, todos os dispositivos testados variam de 0.1 (mínimo) a 240 (máximo) ms. » 93 % de todos os dispositivos são melhores. Isso significa que o tempo de resposta medido é pior que a média de todos os dispositivos testados (19.8 ms). | ||
| ↔ Tempo de resposta 50% cinza a 80% cinza | ||
| 39.2 ms ... ascensão ↗ e queda ↘ combinadas | ↗ 20.8 ms ascensão | 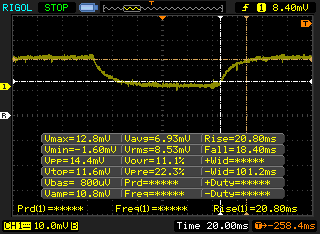 |
| ↘ 18.4 ms queda | ||
| A tela mostra taxas de resposta lentas em nossos testes e será insatisfatória para os jogadores. Em comparação, todos os dispositivos testados variam de 0.165 (mínimo) a 636 (máximo) ms. » 60 % de todos os dispositivos são melhores. Isso significa que o tempo de resposta medido é pior que a média de todos os dispositivos testados (31 ms). | ||
Cintilação da tela / PWM (modulação por largura de pulso)
| Tela tremeluzindo/PWM detectado | 25000 Hz | ≤ 28 % configuração de brilho | 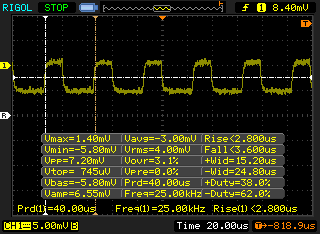 |
A luz de fundo da tela pisca em 25000 Hz (pior caso, por exemplo, utilizando PWM) Cintilação detectada em uma configuração de brilho de 28 % e abaixo. Não deve haver cintilação ou PWM acima desta configuração de brilho. A frequência de 25000 Hz é bastante alta, então a maioria dos usuários sensíveis ao PWM não deve notar nenhuma oscilação. [pwm_comparison] Em comparação: 52 % de todos os dispositivos testados não usam PWM para escurecer a tela. Se PWM foi detectado, uma média de 7781 (mínimo: 5 - máximo: 343500) Hz foi medida. | |||
| Cinebench R10 | |
| Rendering Multiple CPUs 32Bit | |
| Dell XPS 13 7390 Core i7-10710U | |
| Asus VivoBook 14 X403FA | |
| Microsoft Surface Laptop 3 15 Ryzen 5 3580U | |
| Média Intel Core i5-10210U (15037 - 22164, n=3) | |
| Dynabook Portege A30-E-174 | |
| Lenovo ThinkPad P43s-20RH001FGE | |
| Rendering Single 32Bit | |
| Dell XPS 13 7390 Core i7-10710U | |
| Média Intel Core i5-10210U (6410 - 6613, n=3) | |
| Dynabook Portege A30-E-174 | |
| Lenovo ThinkPad P43s-20RH001FGE | |
| Asus VivoBook 14 X403FA | |
| Microsoft Surface Laptop 3 15 Ryzen 5 3580U | |
| wPrime 2.10 - 1024m | |
| Microsoft Surface Laptop 3 15 Ryzen 5 3580U | |
| Média Intel Core i5-10210U (n=1) | |
| Dell XPS 13 7390 Core i7-10710U | |
* ... menor é melhor
| PCMark 8 Home Score Accelerated v2 | 3464 pontos | |
| PCMark 8 Work Score Accelerated v2 | 4992 pontos | |
| PCMark 10 Score | 4497 pontos | |
Ajuda | ||
| MSI Modern 14 A10RB-459US Kingston RBUSNS8154P3512GJ | Asus ZenBook 15 UX534FT-DB77 Samsung SSD PM981 MZVLB1T0HALR | Lenovo Yoga C940-14IIL Samsung SSD PM981 MZVLB512HAJQ | Dell XPS 15 7590 9980HK GTX 1650 Toshiba XG6 KXG60ZNV1T02 | Apple MacBook Pro 16 2019 i9 5500M Apple SSD AP1024 7171 | |
|---|---|---|---|---|---|
| AS SSD | 51% | 64% | 73% | 57% | |
| Seq Read (MB/s) | 1061 | 1887 78% | 2525 138% | 1723 62% | 2531 139% |
| Seq Write (MB/s) | 953 | 1432 50% | 1253 31% | 1386 45% | 2289 140% |
| 4K Read (MB/s) | 35.59 | 52.3 47% | 59.1 66% | 43.25 22% | 15.85 -55% |
| 4K Write (MB/s) | 87 | 146 68% | 134.1 54% | 98.3 13% | 39.88 -54% |
| 4K-64 Read (MB/s) | 769 | 969 26% | 1010 31% | 1078 40% | 1267 65% |
| 4K-64 Write (MB/s) | 733 | 1375 88% | 1461 99% | 1456 99% | 1749 139% |
| Access Time Read * (ms) | 0.084 | 0.034 60% | 0.052 38% | 0.05 40% | 0.122 -45% |
| Access Time Write * (ms) | 0.136 | 0.075 45% | 0.029 79% | 0.039 71% | 0.095 30% |
| Score Read (Points) | 911 | 1210 33% | 1322 45% | 1294 42% | 1536 69% |
| Score Write (Points) | 916 | 1664 82% | 1721 88% | 1693 85% | 2018 120% |
| Score Total (Points) | 2294 | 3483 52% | 3670 60% | 3638 59% | 4317 88% |
| Copy ISO MB/s (MB/s) | 956 | 1375 44% | 2016 111% | 3182 233% | 1995 109% |
| Copy Program MB/s (MB/s) | 496.5 | 468 -6% | 542 9% | 984 98% | 584 18% |
| Copy Game MB/s (MB/s) | 872 | 1287 48% | 1278 47% | 1824 109% | 1135 30% |
| CrystalDiskMark 5.2 / 6 | 68% | 66% | 58% | 49% | |
| Write 4K (MB/s) | 107.7 | 141.6 31% | 128.4 19% | 104.3 -3% | 55.5 -48% |
| Read 4K (MB/s) | 39.73 | 45.28 14% | 46.37 17% | 45.23 14% | 16.21 -59% |
| Write Seq (MB/s) | 926 | 1975 113% | 1863 101% | 1729 87% | 1959 112% |
| Read Seq (MB/s) | 1014 | 2272 124% | 2340 131% | 1861 84% | 1763 74% |
| Write 4K Q32T1 (MB/s) | 343.6 | 458.6 33% | 451.1 31% | 509 48% | 398.5 16% |
| Read 4K Q32T1 (MB/s) | 499.1 | 391.4 -22% | 415.3 -17% | 388.5 -22% | 648 30% |
| Write Seq Q32T1 (MB/s) | 1033 | 2393 132% | 2985 189% | 2813 172% | 2727 164% |
| Read Seq Q32T1 (MB/s) | 1604 | 3464 116% | 2565 60% | 2906 81% | 3242 102% |
| Write 4K Q8T8 (MB/s) | 451.4 | ||||
| Read 4K Q8T8 (MB/s) | 1004 | ||||
| Média Total (Programa/Configurações) | 60% /
57% | 65% /
65% | 66% /
67% | 53% /
54% |
* ... menor é melhor

| 3DMark 11 | |
| 1280x720 Performance GPU | |
| Walmart EVOO Gaming 17 | |
| Maingear Vector 15 | |
| Asus Zephyrus S GX531GM | |
| Dell XPS 15 7590 9980HK GTX 1650 | |
| Lenovo ThinkPad X1 Extreme-20MF000XGE | |
| MSI Modern 14 A10RB-459US | |
| Microsoft Surface Laptop 3 15 i7-1065G7 | |
| Média NVIDIA GeForce MX250 (3585 - 4942, n=29) | |
| Asus Zenbook 14 UX433FN-A6023T | |
| Asus VivoBook 14 X412FJ-EB023T | |
| Asus VivoBook 15 X542UF-DM143T | |
| 1280x720 Performance Combined | |
| Walmart EVOO Gaming 17 | |
| Maingear Vector 15 | |
| Dell XPS 15 7590 9980HK GTX 1650 | |
| Lenovo ThinkPad X1 Extreme-20MF000XGE | |
| Asus Zephyrus S GX531GM | |
| MSI Modern 14 A10RB-459US | |
| Média NVIDIA GeForce MX250 (3532 - 4638, n=29) | |
| Microsoft Surface Laptop 3 15 i7-1065G7 | |
| Asus Zenbook 14 UX433FN-A6023T | |
| Asus VivoBook 14 X412FJ-EB023T | |
| Asus VivoBook 15 X542UF-DM143T | |
| 3DMark 11 Performance | 5085 pontos | |
| 3DMark Cloud Gate Standard Score | 14266 pontos | |
| 3DMark Fire Strike Score | 3487 pontos | |
| 3DMark Time Spy Score | 1279 pontos | |
Ajuda | ||
| Shadow of the Tomb Raider | |
| 1280x720 Lowest Preset | |
| Lenovo IdeaPad S740-15IRH | |
| HP Pavilion Gaming 15-ec0017ng | |
| MSI PS63 Modern 8RC | |
| MSI Modern 14 A10RB-459US | |
| Média NVIDIA GeForce MX250 (24 - 56, n=8) | |
| Asus VivoBook 14 F412FJ-EB084T | |
| Microsoft Surface Laptop 3 15 i7-1065G7 | |
| HP Envy 13-ah0003ng | |
| Microsoft Surface Laptop 3 15 Ryzen 5 3580U | |
| 1920x1080 Medium Preset | |
| Lenovo IdeaPad S740-15IRH | |
| HP Pavilion Gaming 15-ec0017ng | |
| MSI PS63 Modern 8RC | |
| MSI Modern 14 A10RB-459US | |
| Média NVIDIA GeForce MX250 (7 - 19, n=8) | |
| HP Envy 13-ah0003ng | |
| Asus VivoBook 14 F412FJ-EB084T | |
| Microsoft Surface Laptop 3 15 Ryzen 5 3580U | |
| baixo | média | alto | ultra | |
|---|---|---|---|---|
| BioShock Infinite (2013) | 189.7 | 117.5 | 100.5 | 37.8 |
| The Witcher 3 (2015) | 68.1 | 38 | 21.5 | 11.7 |
| Shadow of the Tomb Raider (2018) | 56 | 19 | 12 |
| MSI Modern 14 A10RB-459US GeForce MX250, i5-10210U, Kingston RBUSNS8154P3512GJ | Asus ZenBook 15 UX534FT-DB77 GeForce GTX 1650 Max-Q, i7-8565U, Samsung SSD PM981 MZVLB1T0HALR | Lenovo Yoga C940-14IIL Iris Plus Graphics G7 (Ice Lake 64 EU), i7-1065G7, Samsung SSD PM981 MZVLB512HAJQ | Apple MacBook Pro 16 2019 i9 5500M Radeon Pro 5500M, i9-9880H, Apple SSD AP1024 7171 | Lenovo ThinkPad P43s-20RH001FGE Quadro P520, i7-8565U, WDC PC SN720 SDAQNTW-256G | Lenovo ThinkPad X1 Carbon 2019-20QE000VGE UHD Graphics 620, i7-8665U, WDC PC SN720 SDAQNTW-512G | |
|---|---|---|---|---|---|---|
| Noise | 1% | 3% | -10% | 3% | 6% | |
| desligado / ambiente * (dB) | 28.7 | 28.4 1% | 29.3 -2% | 29.8 -4% | 29.2 -2% | 28.4 1% |
| Idle Minimum * (dB) | 29.5 | 28.4 4% | 29.3 1% | 29.9 -1% | 29.2 1% | 28.4 4% |
| Idle Average * (dB) | 29.5 | 28.4 4% | 29.3 1% | 29.9 -1% | 29.2 1% | 28.4 4% |
| Idle Maximum * (dB) | 29.5 | 28.4 4% | 29.3 1% | 29.9 -1% | 29.2 1% | 28.6 3% |
| Load Average * (dB) | 33.4 | 33.9 -1% | 33.3 -0% | 43 -29% | 33.3 -0% | 31.5 6% |
| Witcher 3 ultra * (dB) | 37.9 | 39.8 -5% | 45.4 -20% | |||
| Load Maximum * (dB) | 40.5 | 40.2 1% | 33.3 18% | 46.1 -14% | 33.3 18% | 33.1 18% |
* ... menor é melhor
Barulho
| Ocioso |
| 29.5 / 29.5 / 29.5 dB |
| Carga |
| 33.4 / 40.5 dB |
 | ||
30 dB silencioso 40 dB(A) audível 50 dB(A) ruidosamente alto |
||
min: | ||
(-) A temperatura máxima no lado superior é 47.6 °C / 118 F, em comparação com a média de 34.3 °C / 94 F , variando de 21.2 a 62.5 °C para a classe Office.
(-) A parte inferior aquece até um máximo de 58.2 °C / 137 F, em comparação com a média de 36.8 °C / 98 F
(+) Em uso inativo, a temperatura média para o lado superior é 20.7 °C / 69 F, em comparação com a média do dispositivo de 29.5 °C / ### class_avg_f### F.
(+) Jogando The Witcher 3, a temperatura média para o lado superior é 29.1 °C / 84 F, em comparação com a média do dispositivo de 29.5 °C / ## #class_avg_f### F.
(+) Os apoios para as mãos e o touchpad são mais frios que a temperatura da pele, com um máximo de 26.8 °C / 80.2 F e, portanto, são frios ao toque.
(±) A temperatura média da área do apoio para as mãos de dispositivos semelhantes foi 27.5 °C / 81.5 F (+0.7 °C / 1.3 F).
MSI Modern 14 A10RB-459US análise de áudio
(+) | os alto-falantes podem tocar relativamente alto (###valor### dB)
Graves 100 - 315Hz
(-) | quase nenhum baixo - em média 25.7% menor que a mediana
(±) | a linearidade dos graves é média (11.6% delta para a frequência anterior)
Médios 400 - 2.000 Hz
(±) | médios mais altos - em média 8.2% maior que a mediana
(±) | a linearidade dos médios é média (10.7% delta para frequência anterior)
Altos 2 - 16 kHz
(+) | agudos equilibrados - apenas 3.2% longe da mediana
(±) | a linearidade dos máximos é média (7.9% delta para frequência anterior)
Geral 100 - 16.000 Hz
(-) | o som geral não é linear (30.8% diferença em relação à mediana)
Comparado com a mesma classe
» 92% de todos os dispositivos testados nesta classe foram melhores, 3% semelhantes, 5% piores
» O melhor teve um delta de 7%, a média foi 21%, o pior foi 53%
Comparado com todos os dispositivos testados
» 89% de todos os dispositivos testados foram melhores, 3% semelhantes, 8% piores
» O melhor teve um delta de 4%, a média foi 24%, o pior foi 134%
Apple MacBook 12 (Early 2016) 1.1 GHz análise de áudio
(+) | os alto-falantes podem tocar relativamente alto (###valor### dB)
Graves 100 - 315Hz
(±) | graves reduzidos - em média 11.3% menor que a mediana
(±) | a linearidade dos graves é média (14.2% delta para a frequência anterior)
Médios 400 - 2.000 Hz
(+) | médios equilibrados - apenas 2.4% longe da mediana
(+) | médios são lineares (5.5% delta para frequência anterior)
Altos 2 - 16 kHz
(+) | agudos equilibrados - apenas 2% longe da mediana
(+) | os máximos são lineares (4.5% delta da frequência anterior)
Geral 100 - 16.000 Hz
(+) | o som geral é linear (10.2% diferença em relação à mediana)
Comparado com a mesma classe
» 7% de todos os dispositivos testados nesta classe foram melhores, 2% semelhantes, 91% piores
» O melhor teve um delta de 5%, a média foi 18%, o pior foi 53%
Comparado com todos os dispositivos testados
» 5% de todos os dispositivos testados foram melhores, 1% semelhantes, 94% piores
» O melhor teve um delta de 4%, a média foi 24%, o pior foi 134%
| desligado | |
| Ocioso | |
| Carga |
|
Key:
min: | |
| MSI Modern 14 A10RB-459US i5-10210U, GeForce MX250, Kingston RBUSNS8154P3512GJ, IPS, 1920x1080, 14" | Asus ZenBook 15 UX534FT-DB77 i7-8565U, GeForce GTX 1650 Max-Q, Samsung SSD PM981 MZVLB1T0HALR, IPS, 1920x1080, 15.6" | Lenovo Yoga C940-14IIL i7-1065G7, Iris Plus Graphics G7 (Ice Lake 64 EU), Samsung SSD PM981 MZVLB512HAJQ, IPS LED, 1920x1080, 14" | Dell XPS 15 7590 9980HK GTX 1650 i9-9980HK, GeForce GTX 1650 Mobile, Toshiba XG6 KXG60ZNV1T02, OLED, 3840x2160, 15.6" | Apple MacBook Pro 16 2019 i9 5500M i9-9880H, Radeon Pro 5500M, Apple SSD AP1024 7171, IPS, 3072x1920, 16" | Lenovo ThinkPad X1 Carbon 2019-20QE000VGE i7-8665U, UHD Graphics 620, WDC PC SN720 SDAQNTW-512G, IPS, 2560x1440, 14" | |
|---|---|---|---|---|---|---|
| Power Consumption | -79% | 2% | -90% | -70% | 7% | |
| Idle Minimum * (Watt) | 4.2 | 5 -19% | 3.2 24% | 6.2 -48% | 3.7 12% | 3 29% |
| Idle Average * (Watt) | 5.9 | 13.2 -124% | 7 -19% | 9.6 -63% | 12.1 -105% | 6.3 -7% |
| Idle Maximum * (Watt) | 7.2 | 24 -233% | 8.9 -24% | 21.2 -194% | 17 -136% | 8.9 -24% |
| Load Average * (Watt) | 63.4 | 70 -10% | 47.6 25% | 104.3 -65% | 91.5 -44% | 40.8 36% |
| Witcher 3 ultra * (Watt) | 53.5 | 63.3 -18% | 91.7 -71% | 103 -93% | ||
| Load Maximum * (Watt) | 67.4 | 114 -69% | 63.1 6% | 135.3 -101% | 102.3 -52% | 67.5 -0% |
* ... menor é melhor
| MSI Modern 14 A10RB-459US i5-10210U, GeForce MX250, 50 Wh | Lenovo ThinkPad X1 Carbon 2018-20KGS5DU00 i5-8550U, UHD Graphics 620, 57 Wh | Asus ZenBook 15 UX534FT-DB77 i7-8565U, GeForce GTX 1650 Max-Q, 71 Wh | Lenovo Yoga C940-14IIL i7-1065G7, Iris Plus Graphics G7 (Ice Lake 64 EU), 60 Wh | Dell XPS 15 7590 9980HK GTX 1650 i9-9980HK, GeForce GTX 1650 Mobile, 97 Wh | Apple MacBook Pro 16 2019 i9 5500M i9-9880H, Radeon Pro 5500M, 99.8 Wh | |
|---|---|---|---|---|---|---|
| Duração da bateria | 5% | 30% | -8% | 22% | -2% | |
| Reader / Idle (h) | 16.4 | 21.5 31% | 15.2 -7% | |||
| WiFi v1.3 (h) | 8.6 | 9 5% | 8.4 -2% | 10.6 23% | 7.8 -9% | 12 40% |
| Load (h) | 1.8 | 2.9 61% | 1.1 -39% | 3.3 83% | 1 -44% | |
| Witcher 3 ultra (h) | 0.9 |
Pro
Contra
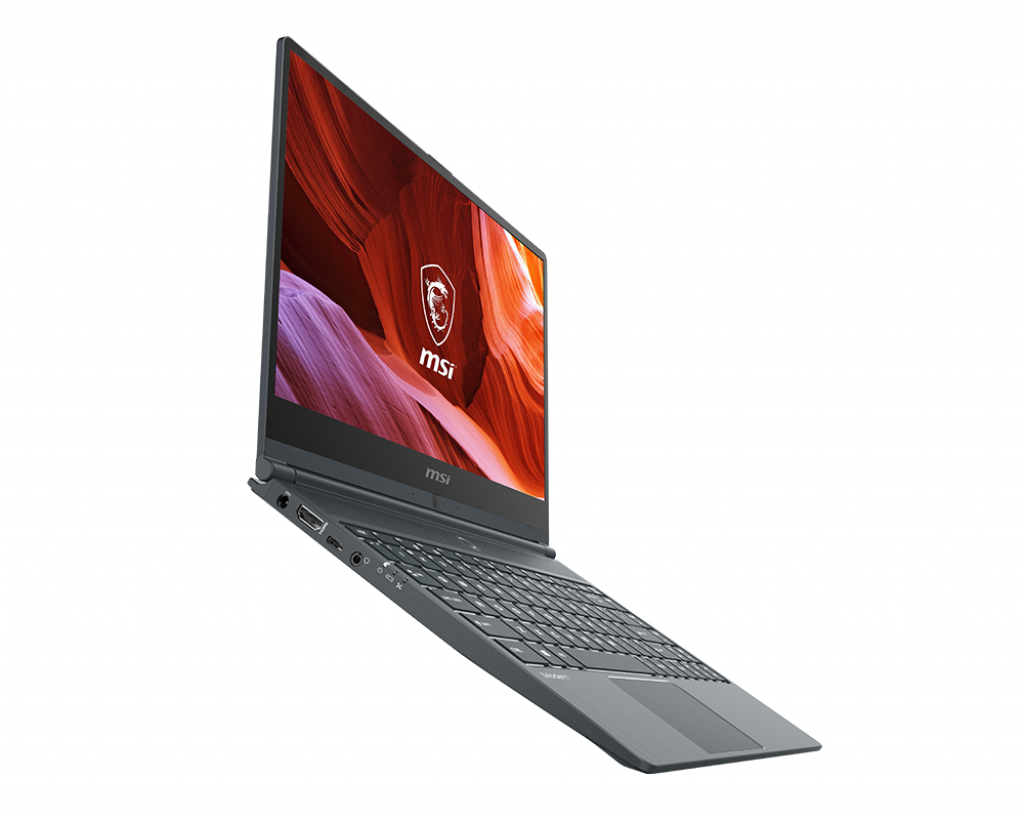

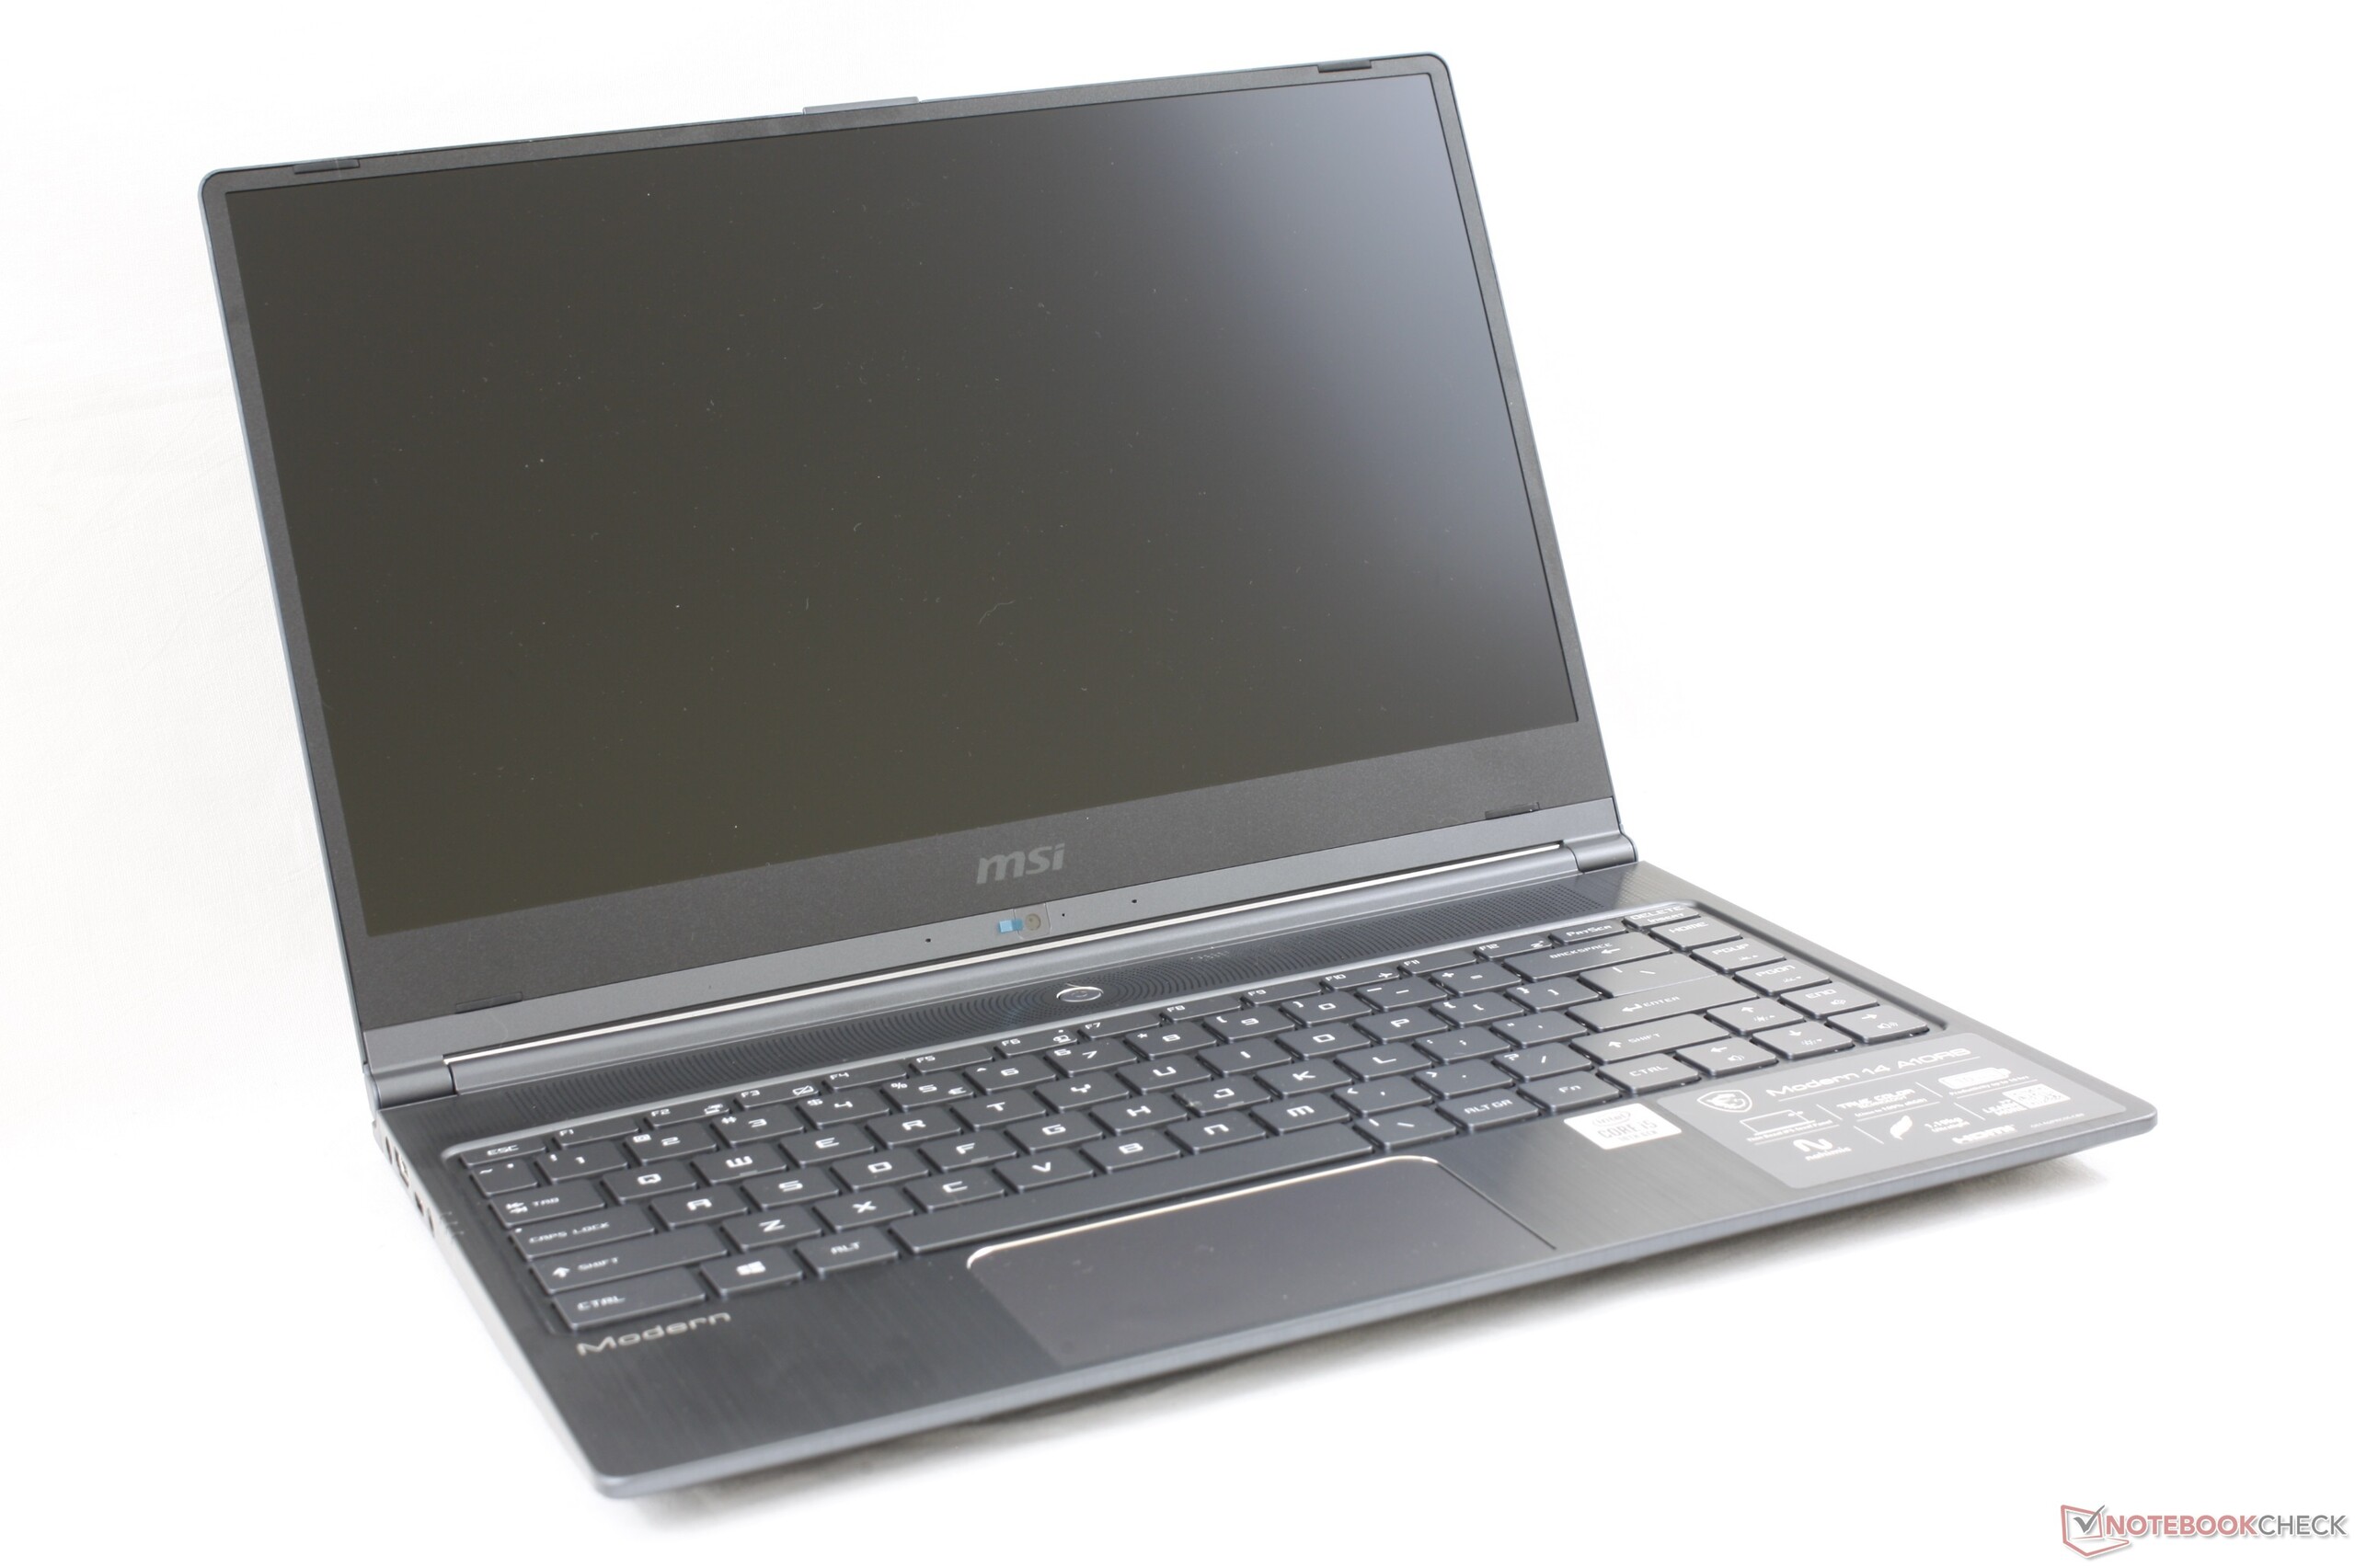
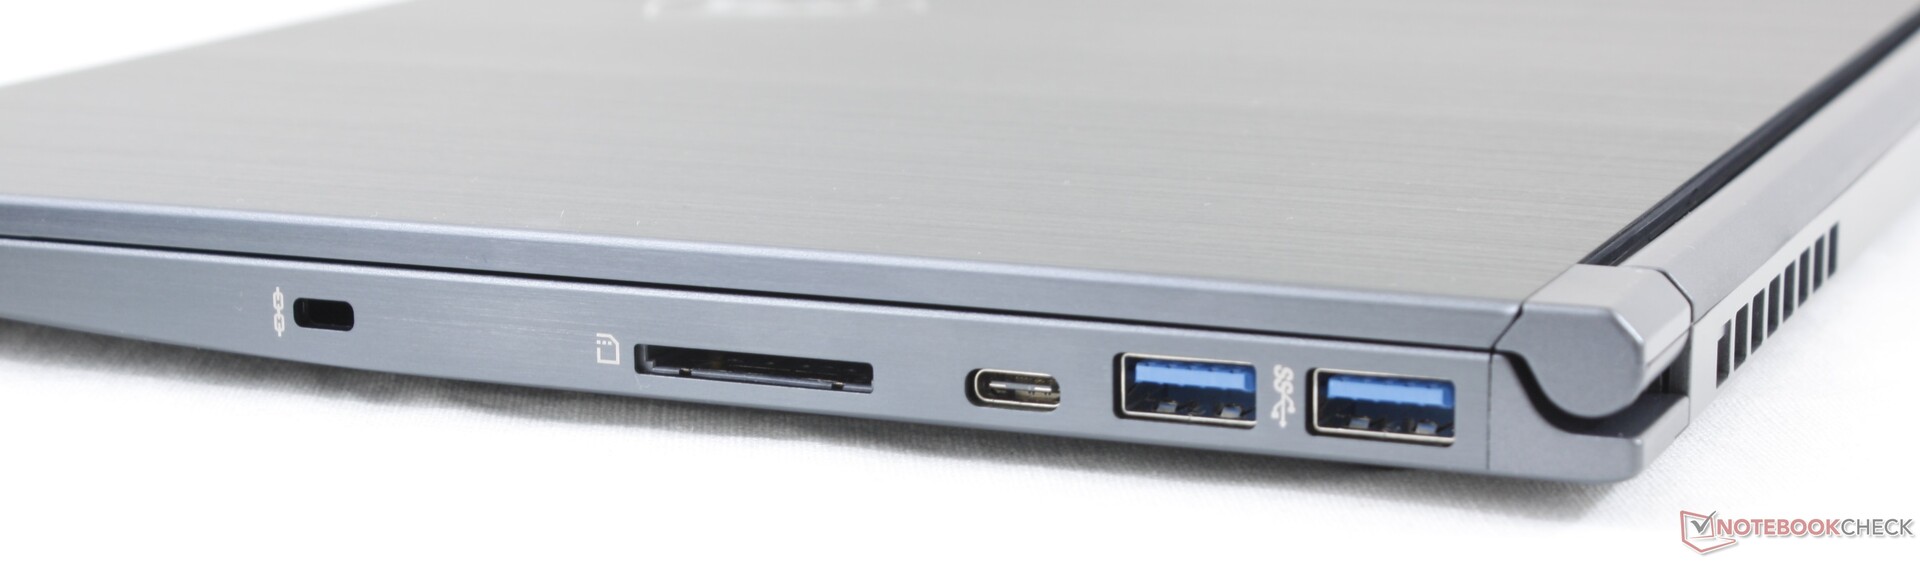
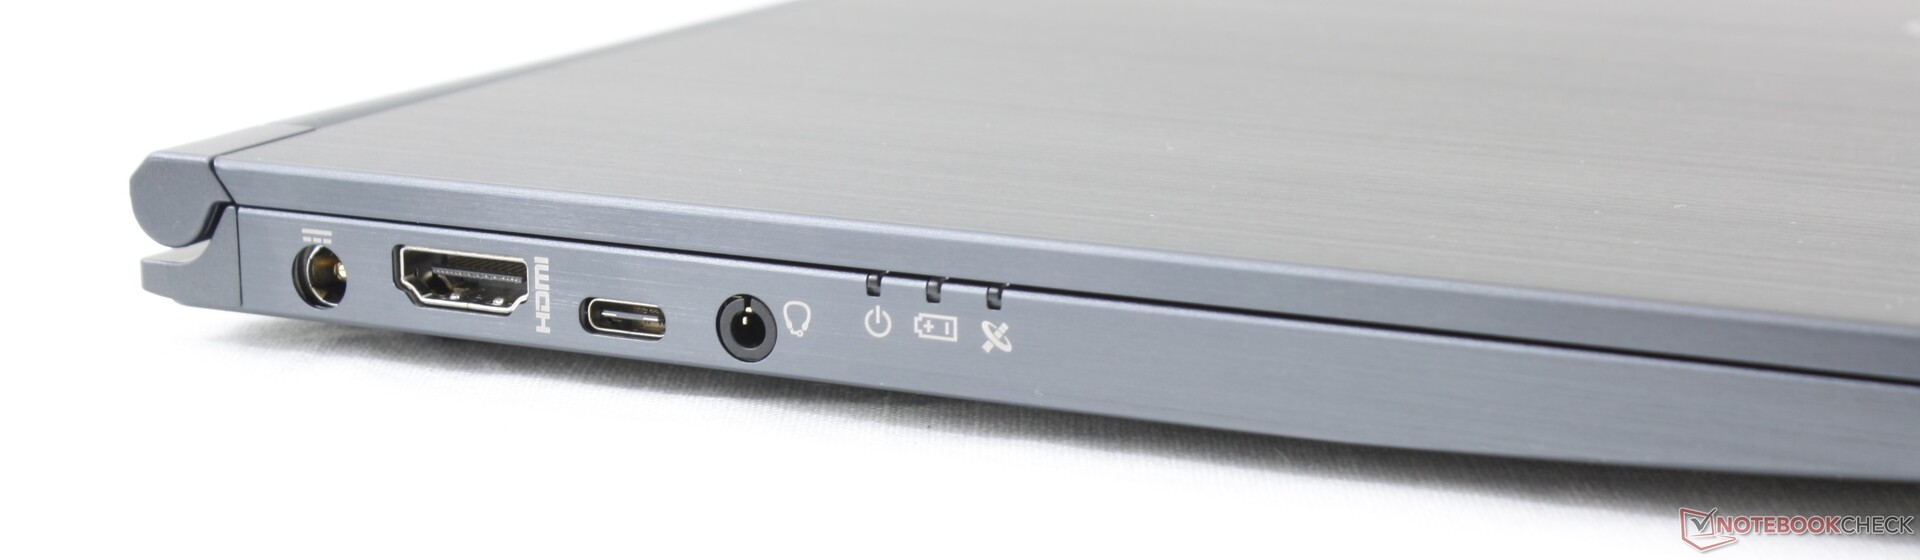
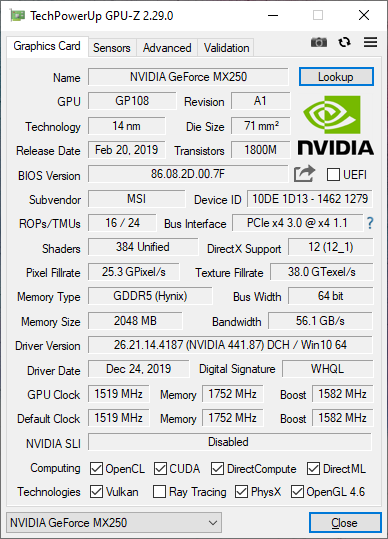
Depois de mergulhar nos portáteis de jogos e portáteis profissionais por tanto tempo, a MSI agora está pronta para entrar no mercado subportáteis com o Modern 14. As melhores características do Modern 14 são principalmente visuais; a tela de 14 polegadas está bem calibrada e pronta para uso, enquanto tem um peso amigável para viajar, a seleção saudável de portas e os gráficos opcionais da GeForce MX250 beneficiam diretamente o público-alvo.
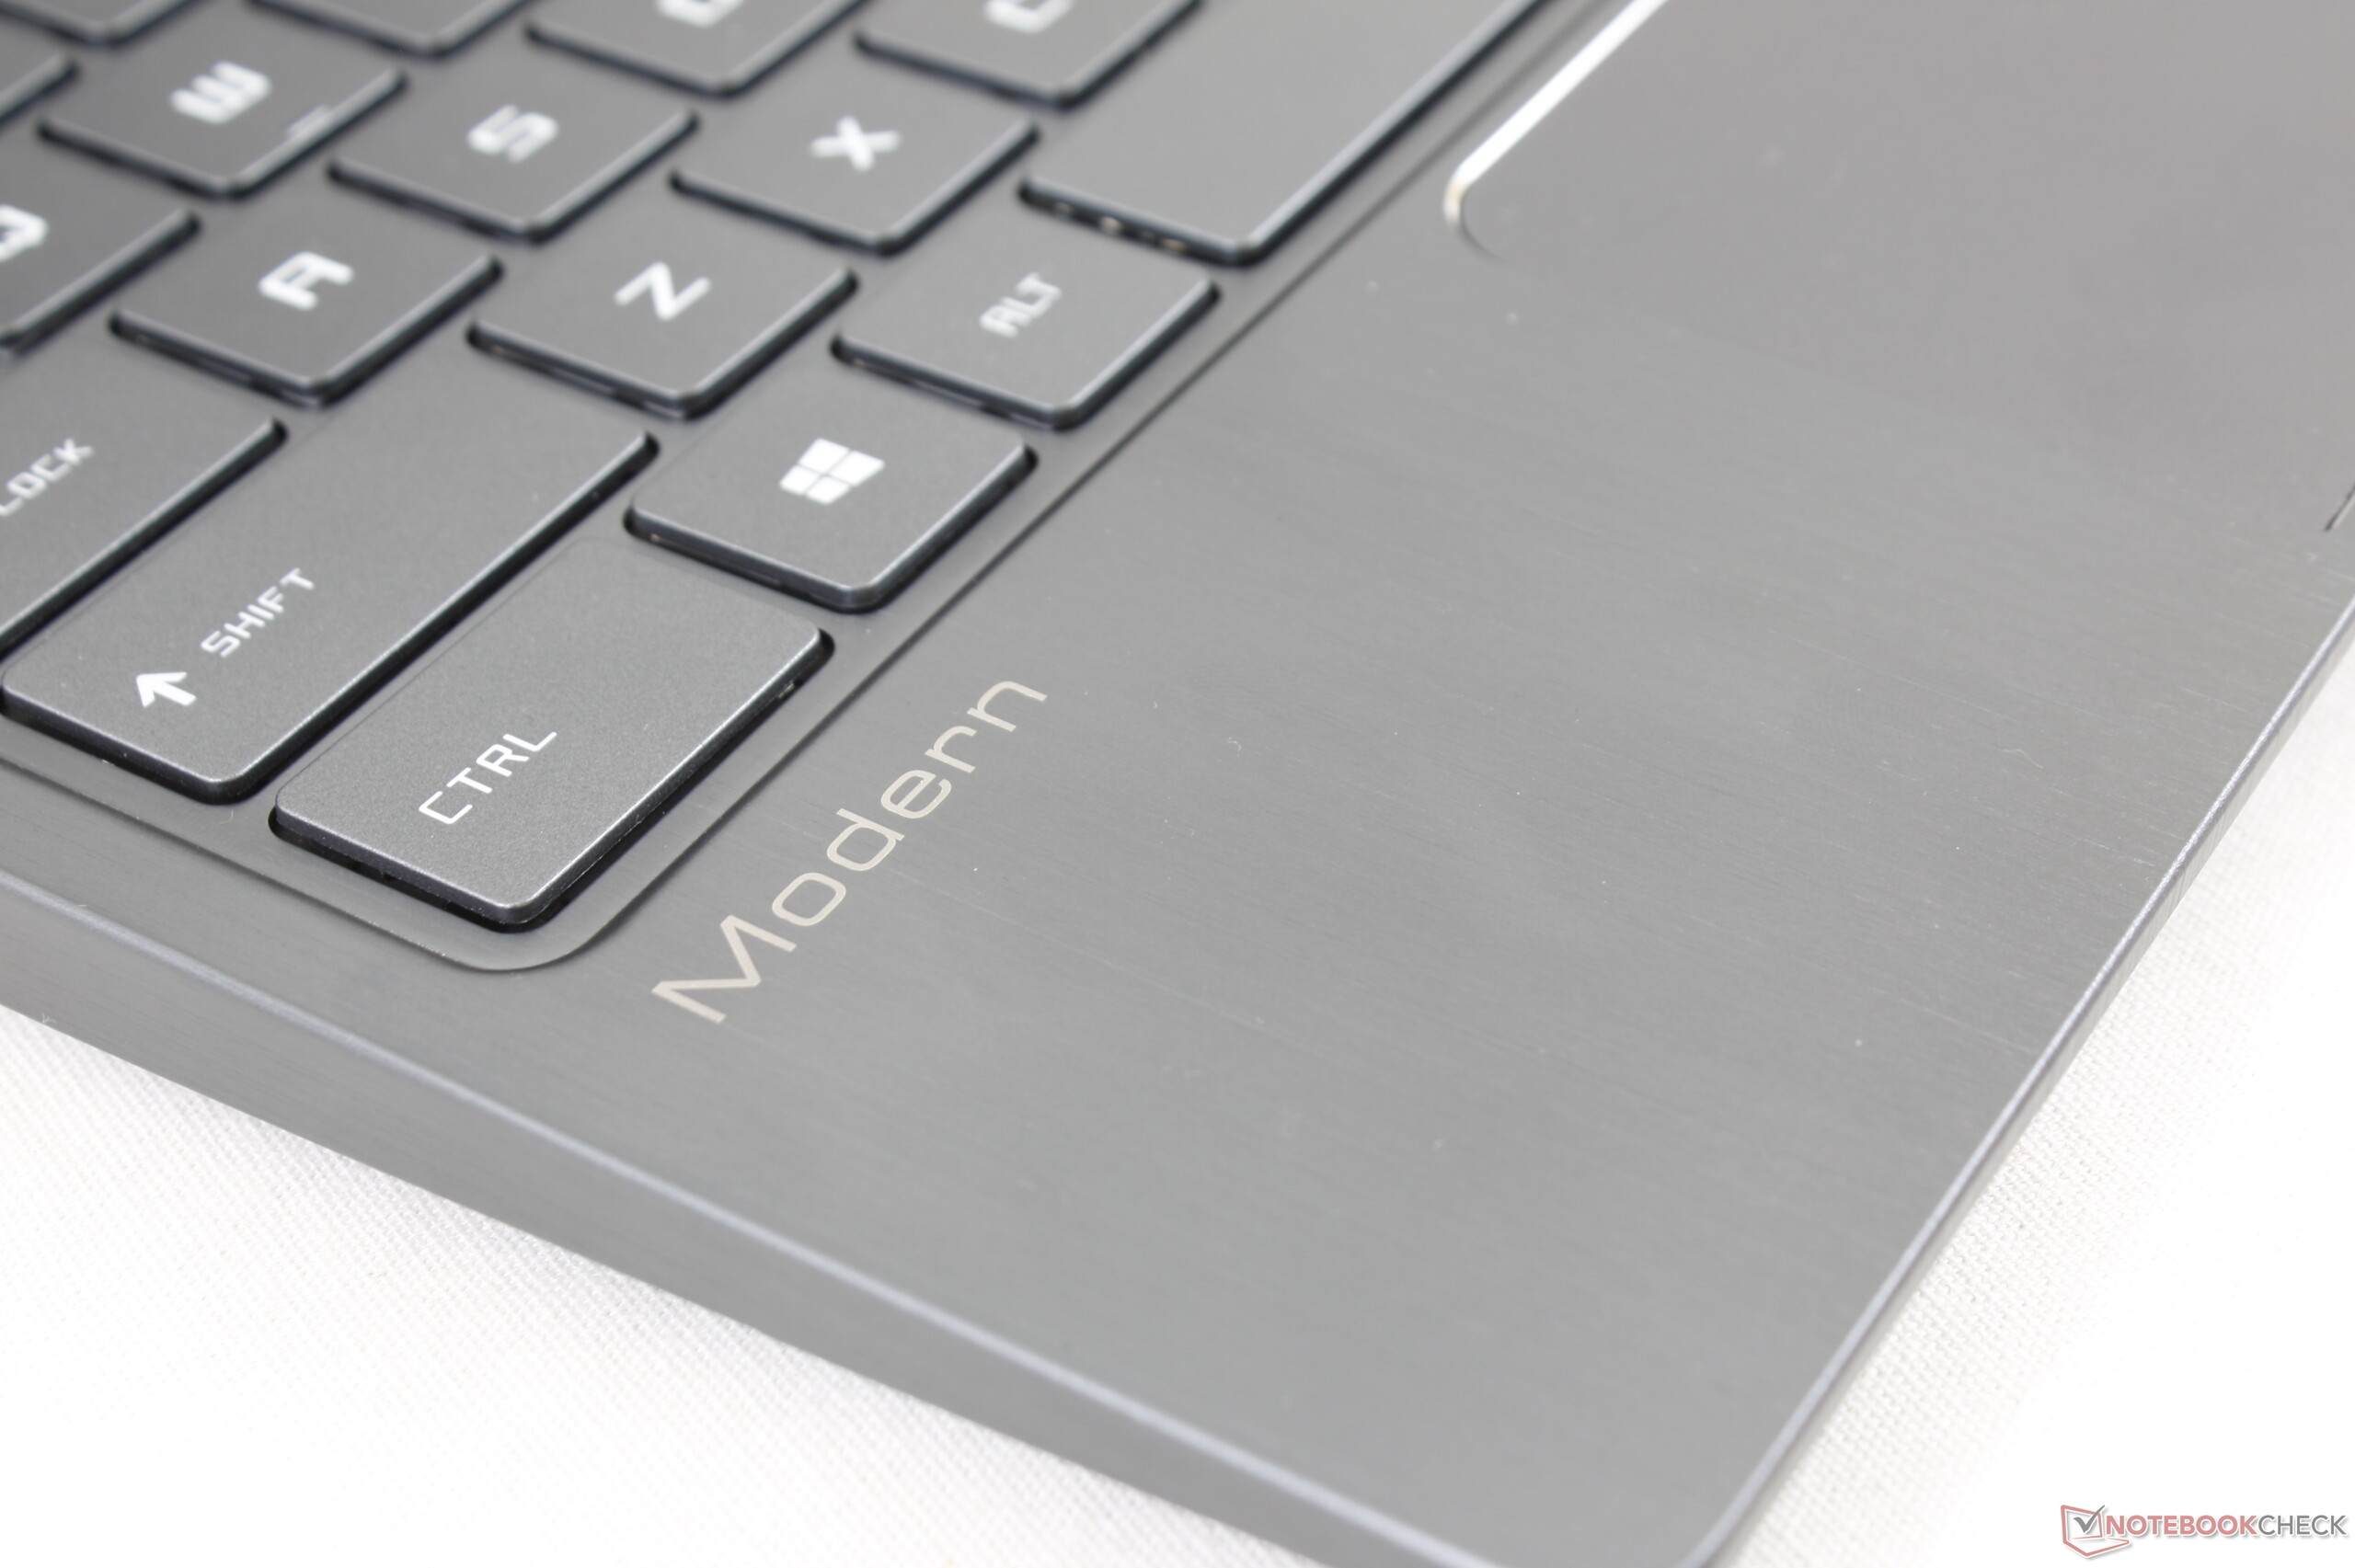
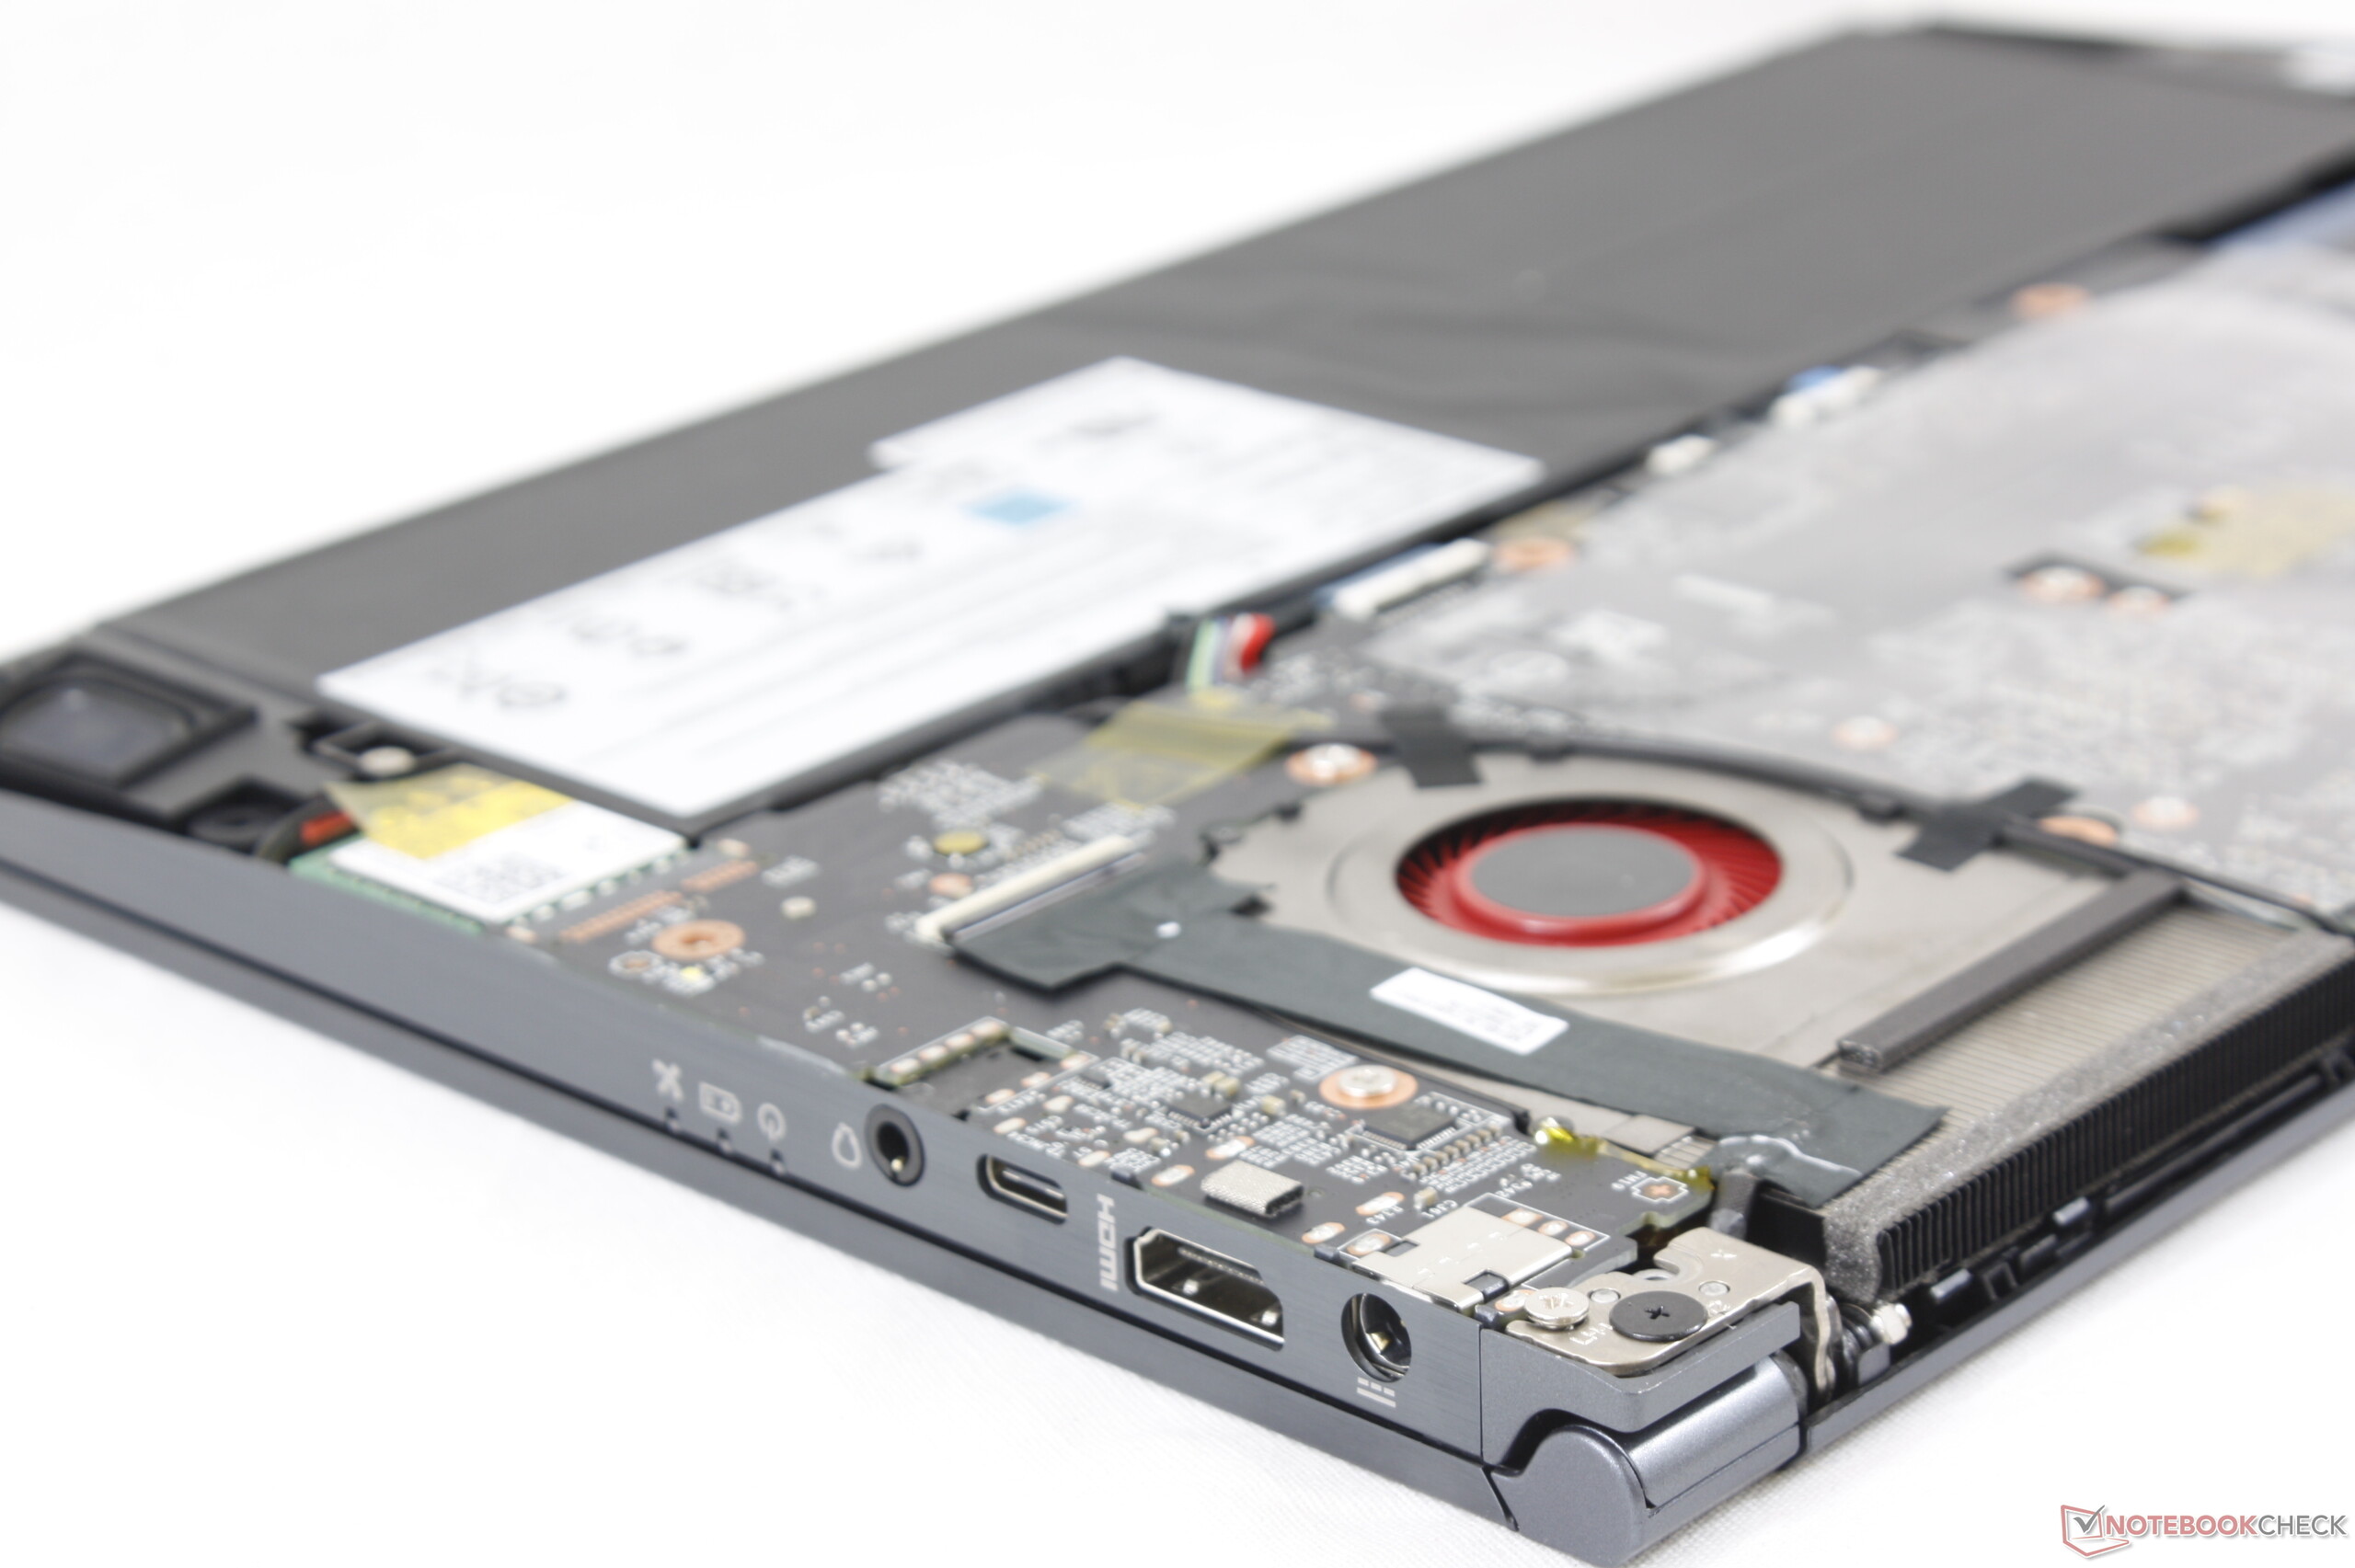
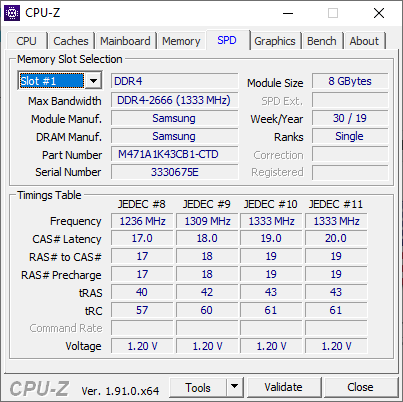
As principais desvantagens do Modern 14 são a rigidez do chassi, capacidade de atualização, a RAM de canal único e resposta do teclado. As superfícies se flexionam e rangem mais do que a maioria dos portáteis de escritório da Dell, Lenovo ou HP, enquanto atualizações comuns como RAM ou armazenamento são dificultadas. As teclas do teclado estão no lado suave e poderiam ter se beneficiado mais da resposta mais nítida para servir melhor os datilógrafos.
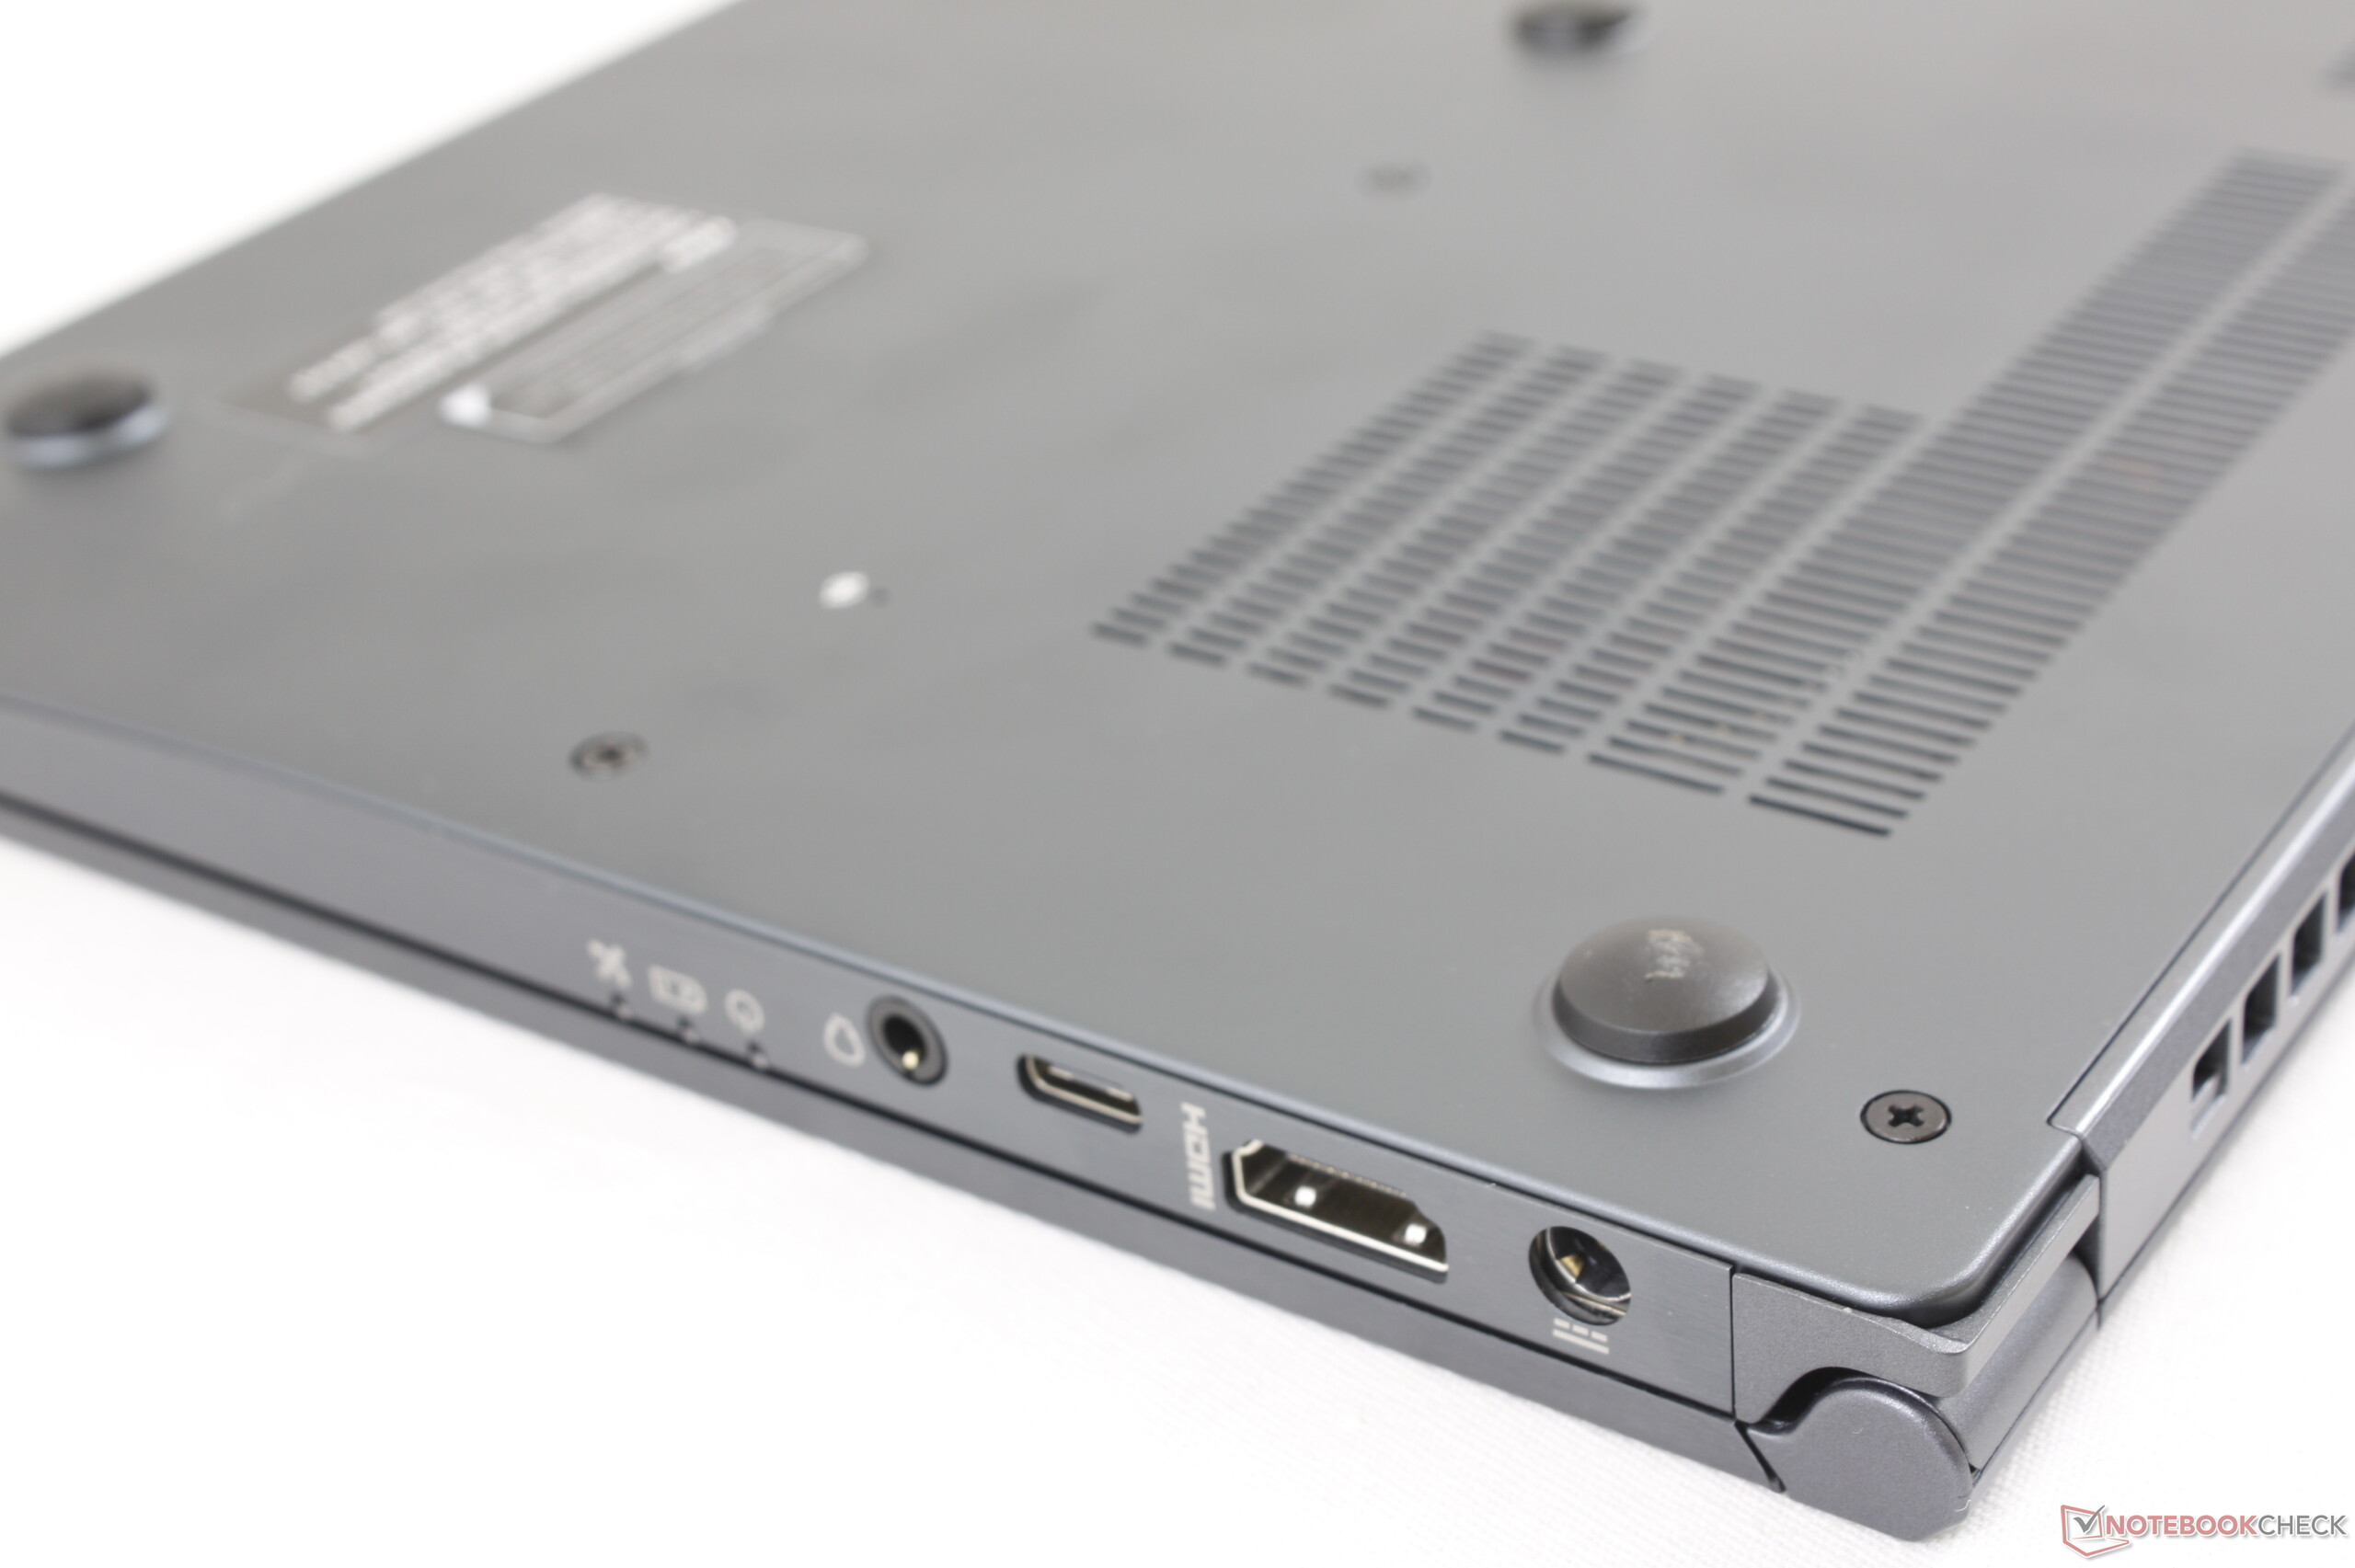
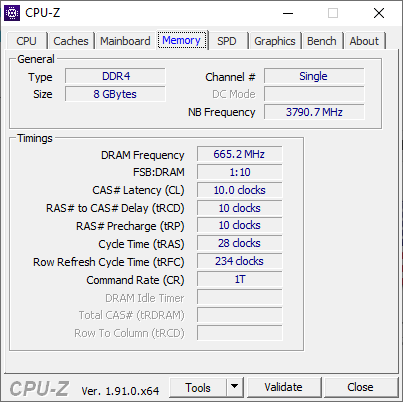
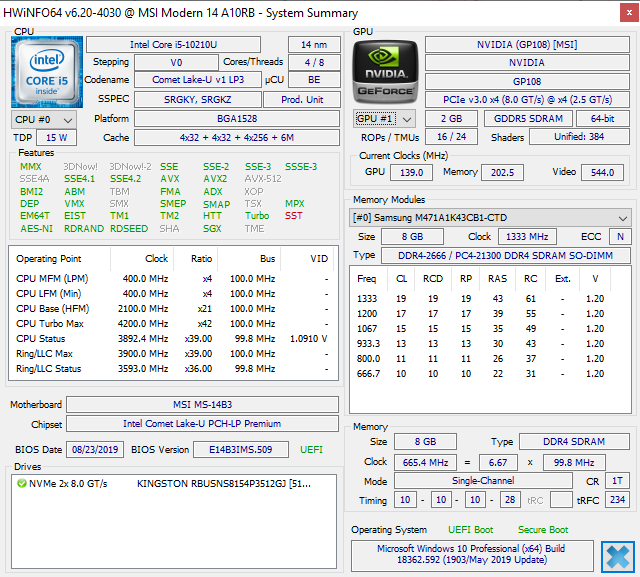
Outras desvantagens incluem a webcam "nose cam", a ausência de um leitor de digitais ou suporte para Thunderbolt 3, 8 GB de RAM de canal único e desempenho médio da CPU do Core i5-10210U. No entanto, menos de US$ 900 é um preço justo, desde que você conheça os pontos fortes e fracos do sistema.
Este não é o portátil de escritório do seu pai. O MSI Modern 14 tem como alvo usuários de escritório mais jovens e criadores de conteúdo com seu design visualmente atraente e muito leve quando comparado às soluções de escritório de gama média da Dell, HP ou Lenovo.
MSI Modern 14 A10RB-459US
- 01/27/2020 v7 (old)
Allen Ngo
Price comparison
