Breve Análise do Portátil HP ProBook 440 G6 (i7, 512 GB, FHD)
| SD Card Reader | |
| average JPG Copy Test (av. of 3 runs) | |
| HP ProBook 440 G5-3KX87ES (Toshiba Exceria Pro SDXC 64 GB UHS-II) | |
| HP ProBook 440 G6-5TK01EA (Toshiba Exceria Pro SDXC 64 GB UHS-II) | |
| Lenovo ThinkPad E480-20KNCTO1WW (Toshiba Exceria Pro M501) | |
| Lenovo ThinkPad A485-20MU000CGE (Toshiba Exceria Pro SDXC 64 GB UHS-II) | |
| Fujitsu Lifebook E548 (Toshiba Exceria Pro SDXC 64 GB UHS-II) | |
| Média da turma Office (22.4 - 198.5, n=22, últimos 2 anos) | |
| Acer TravelMate X3410-M-866T (Toshiba Exceria Pro SDXC 64 GB UHS-II) | |
| maximum AS SSD Seq Read Test (1GB) | |
| HP ProBook 440 G5-3KX87ES (Toshiba Exceria Pro SDXC 64 GB UHS-II) | |
| Lenovo ThinkPad E480-20KNCTO1WW (Toshiba Exceria Pro M501) | |
| Lenovo ThinkPad A485-20MU000CGE (Toshiba Exceria Pro SDXC 64 GB UHS-II) | |
| HP ProBook 440 G6-5TK01EA (Toshiba Exceria Pro SDXC 64 GB UHS-II) | |
| Média da turma Office (27.4 - 249, n=20, últimos 2 anos) | |
| Fujitsu Lifebook E548 (Toshiba Exceria Pro SDXC 64 GB UHS-II) | |
| Acer TravelMate X3410-M-866T (Toshiba Exceria Pro SDXC 64 GB UHS-II) | |
| |||||||||||||||||||||||||
iluminação: 85 %
iluminação com acumulador: 257 cd/m²
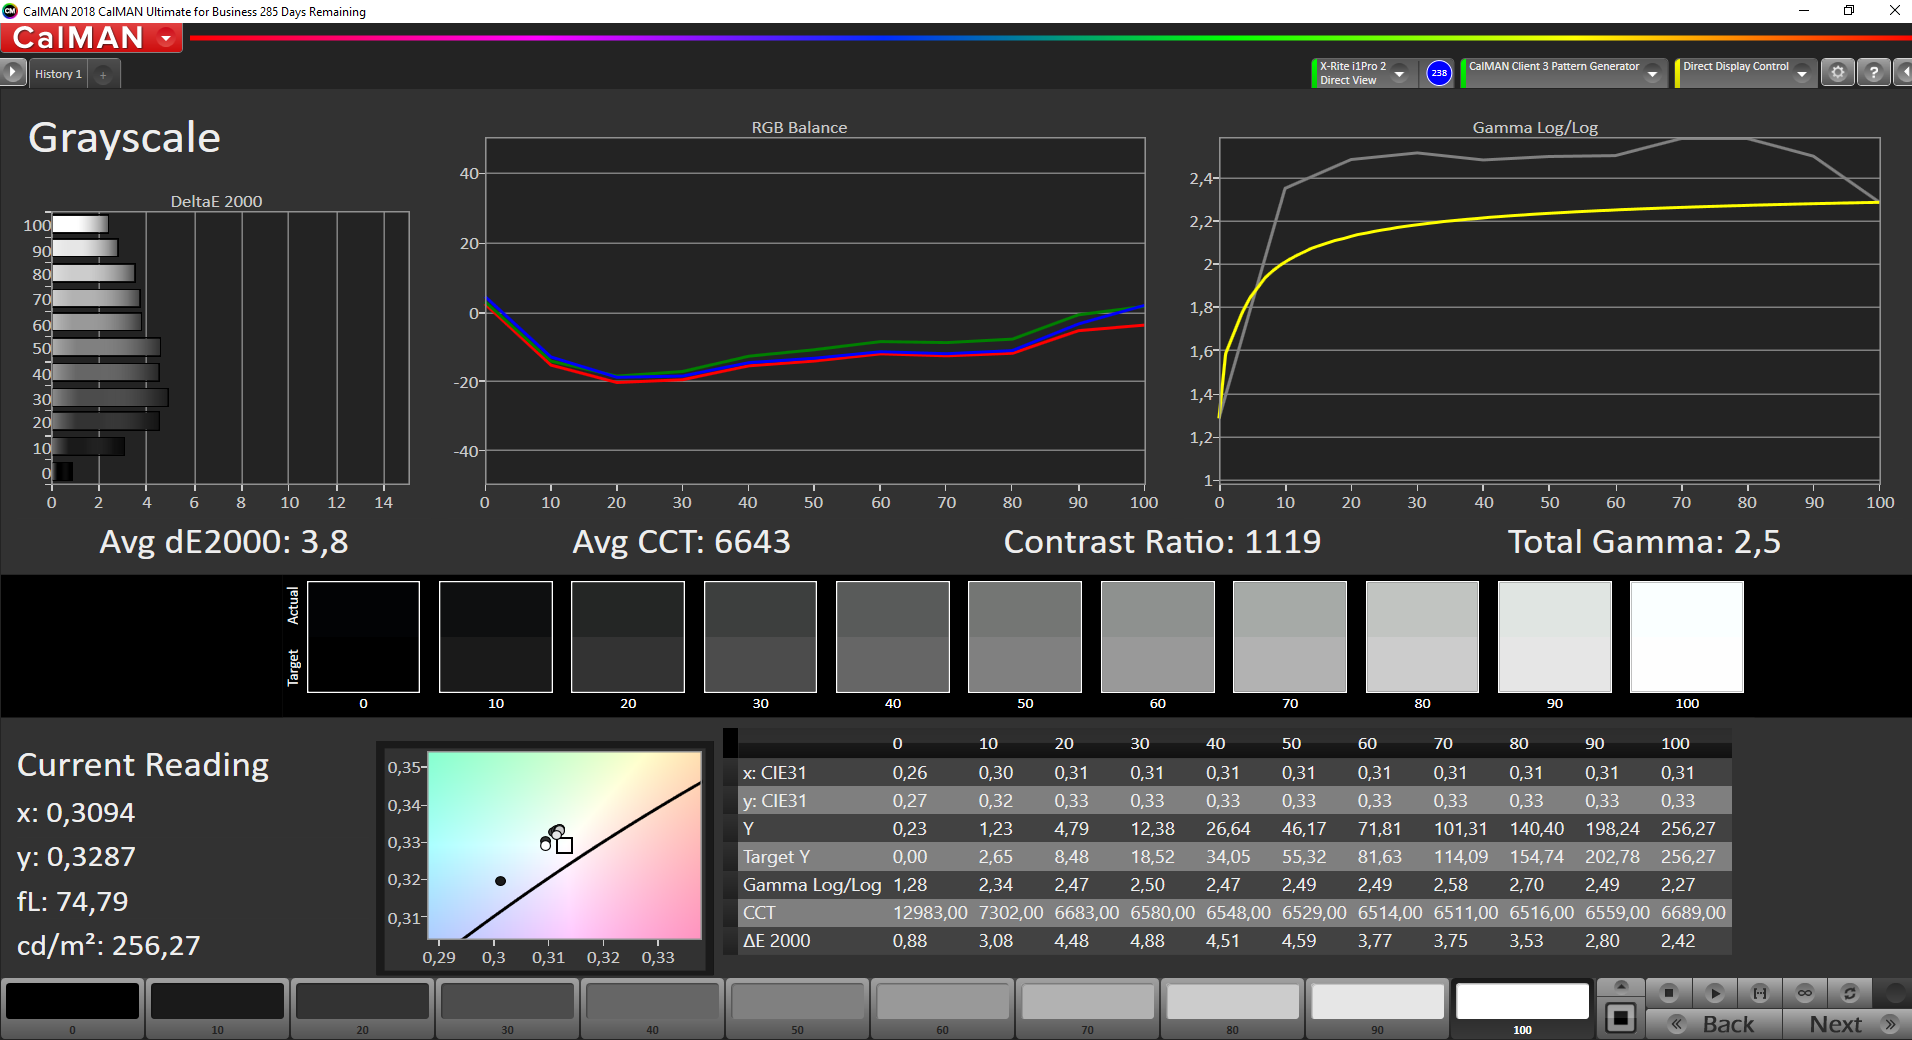
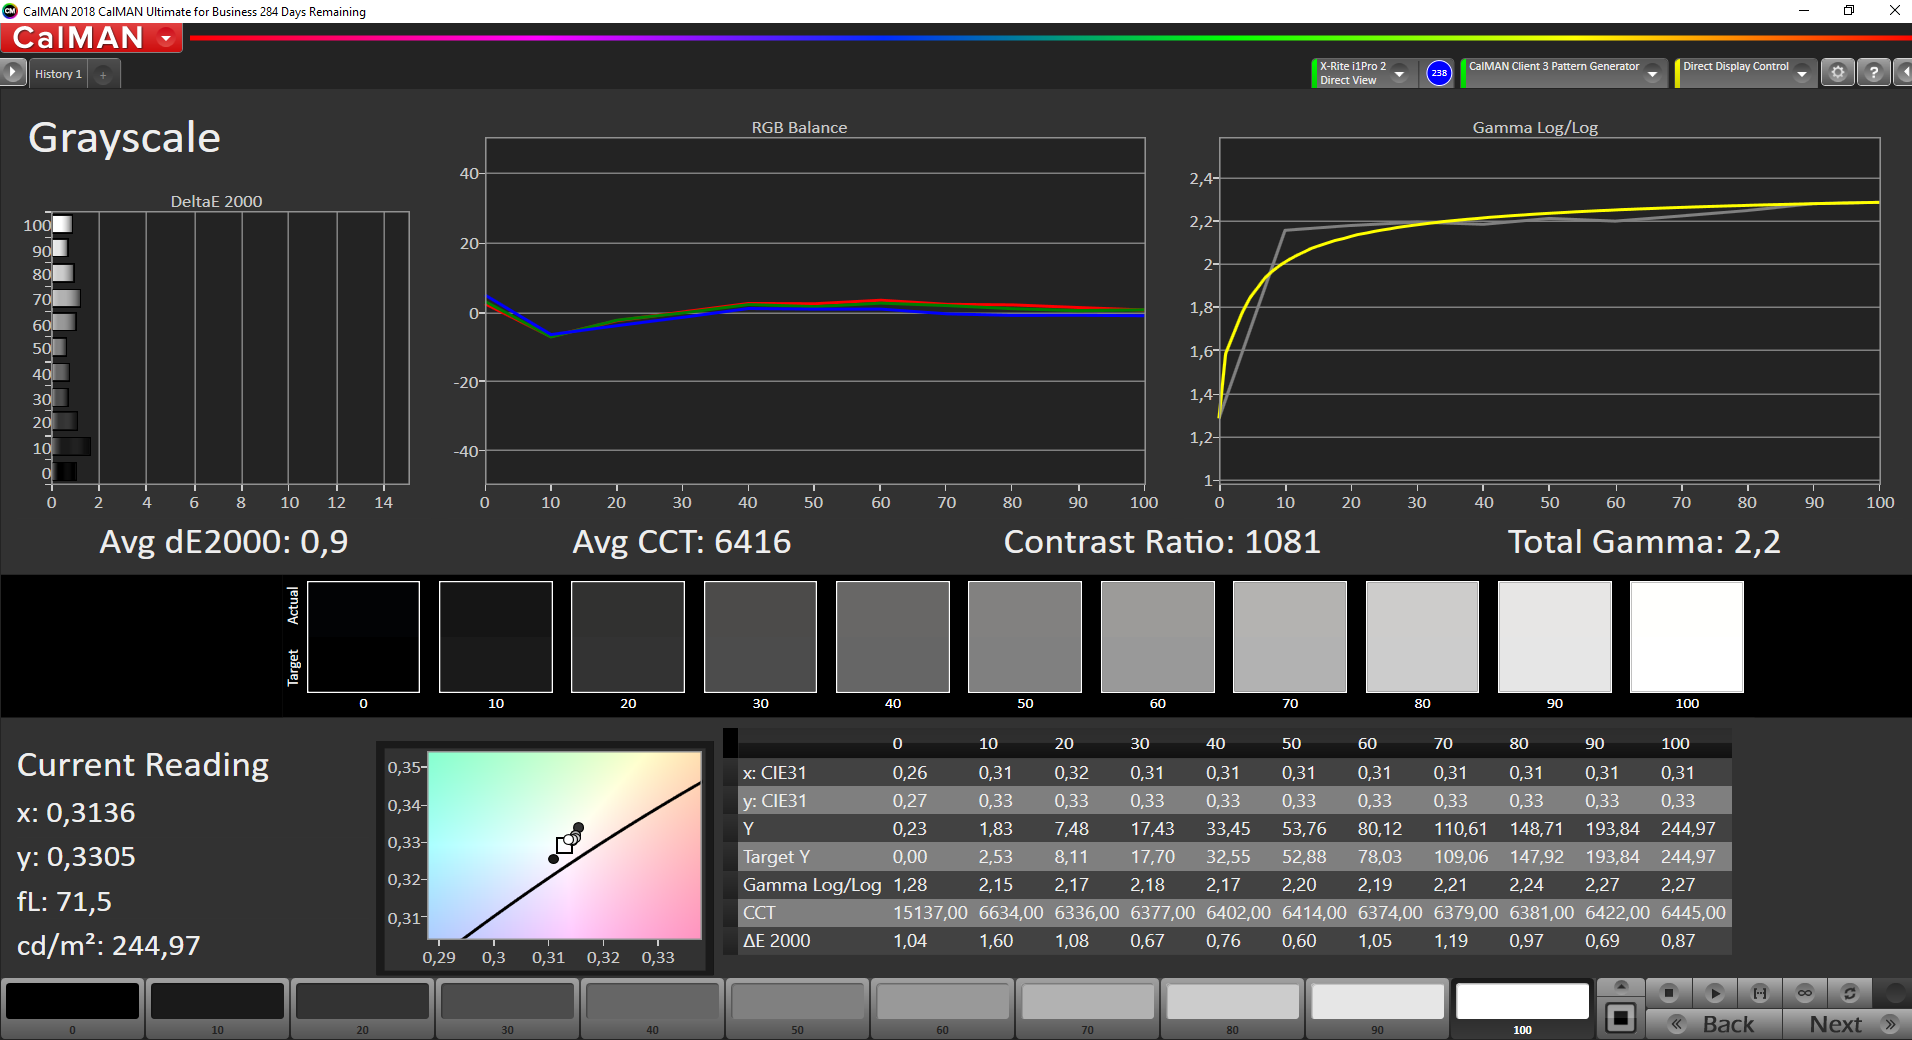
Contraste: 1113:1 (Preto: 0.23 cd/m²)
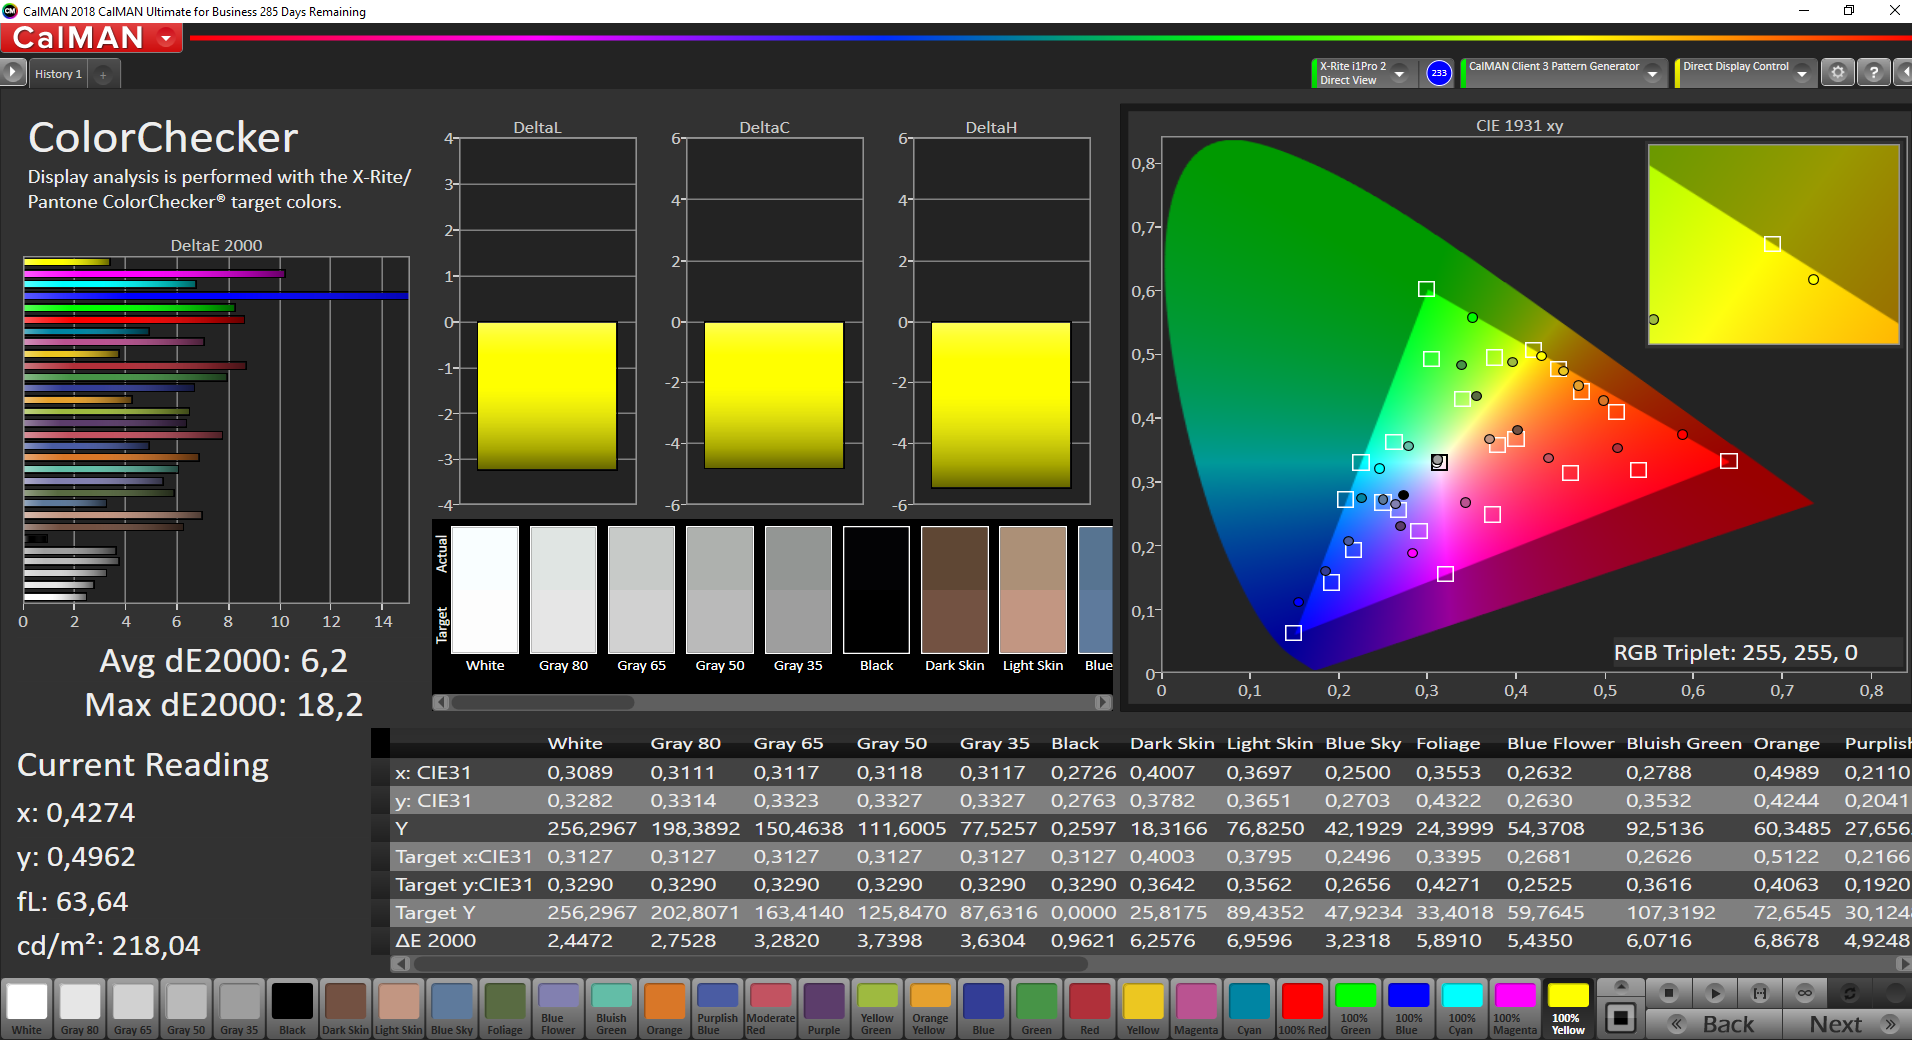
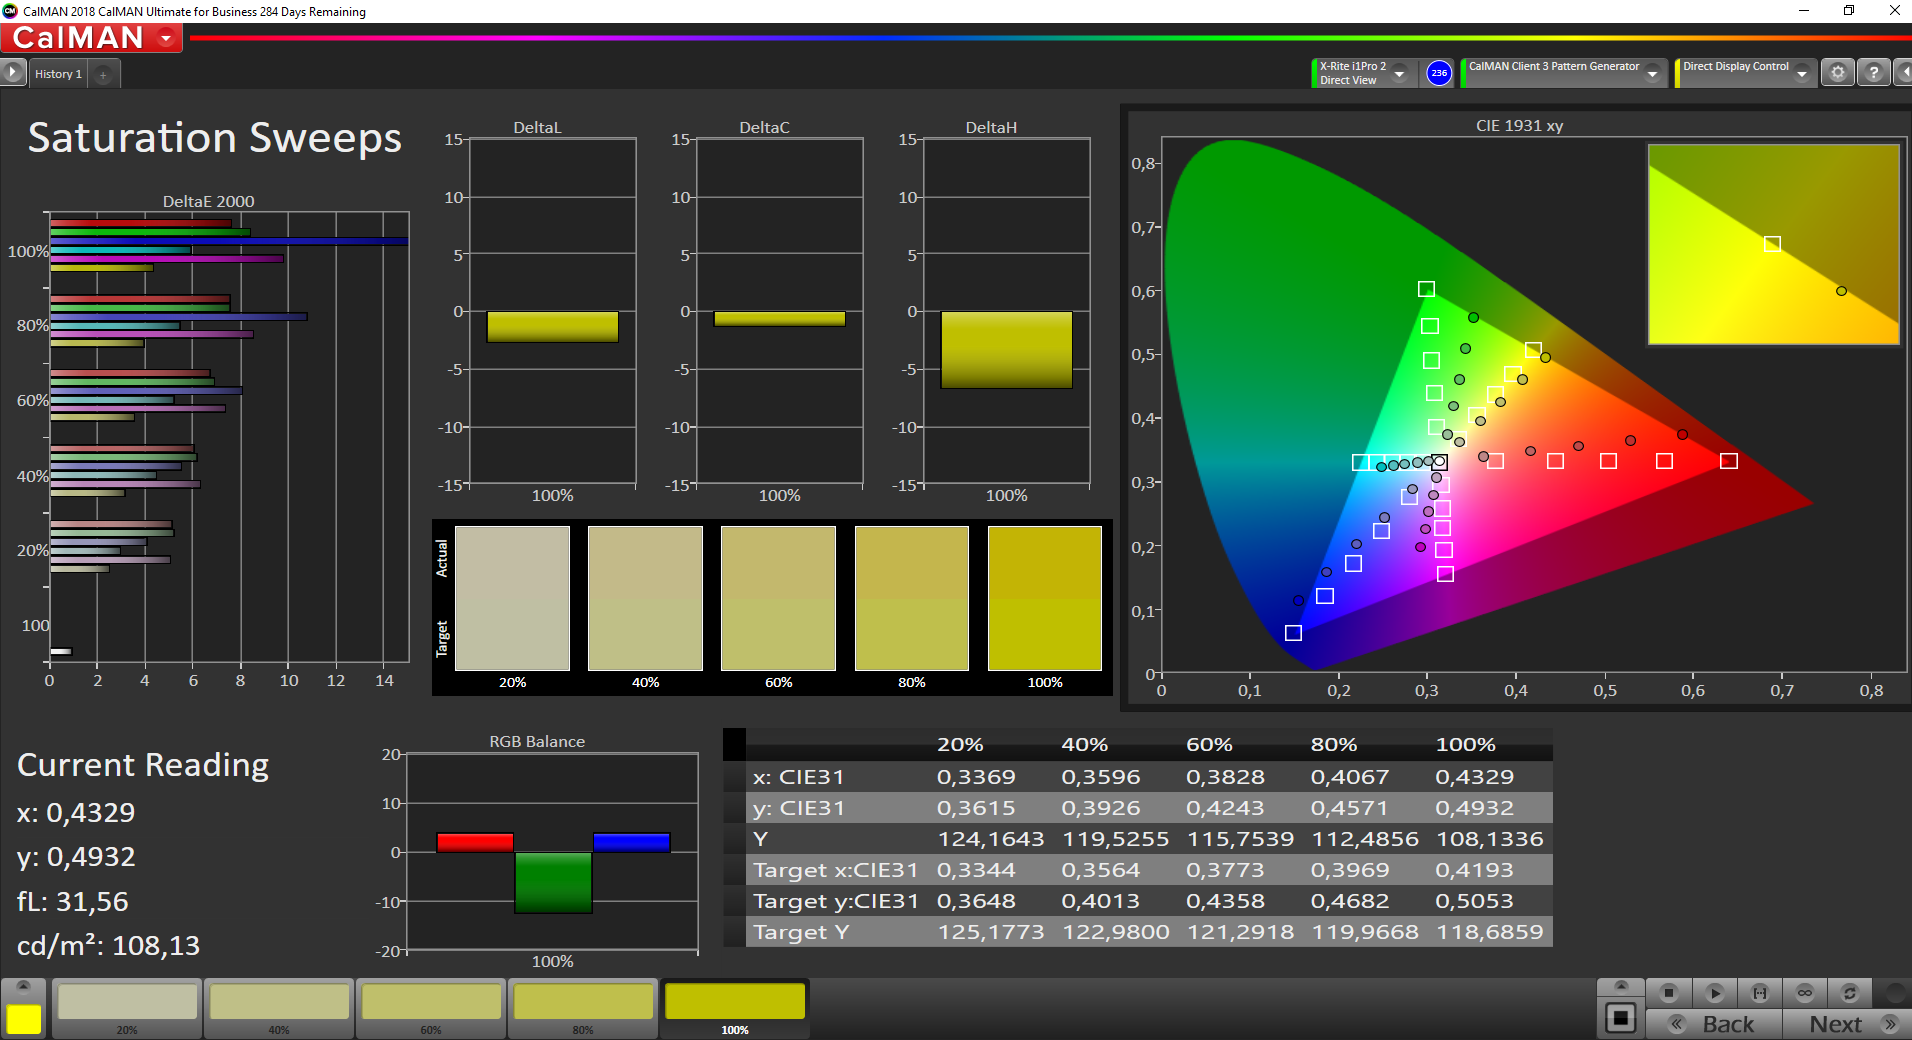
ΔE ColorChecker Calman: 6.2 | ∀{0.5-29.43 Ø4.73}
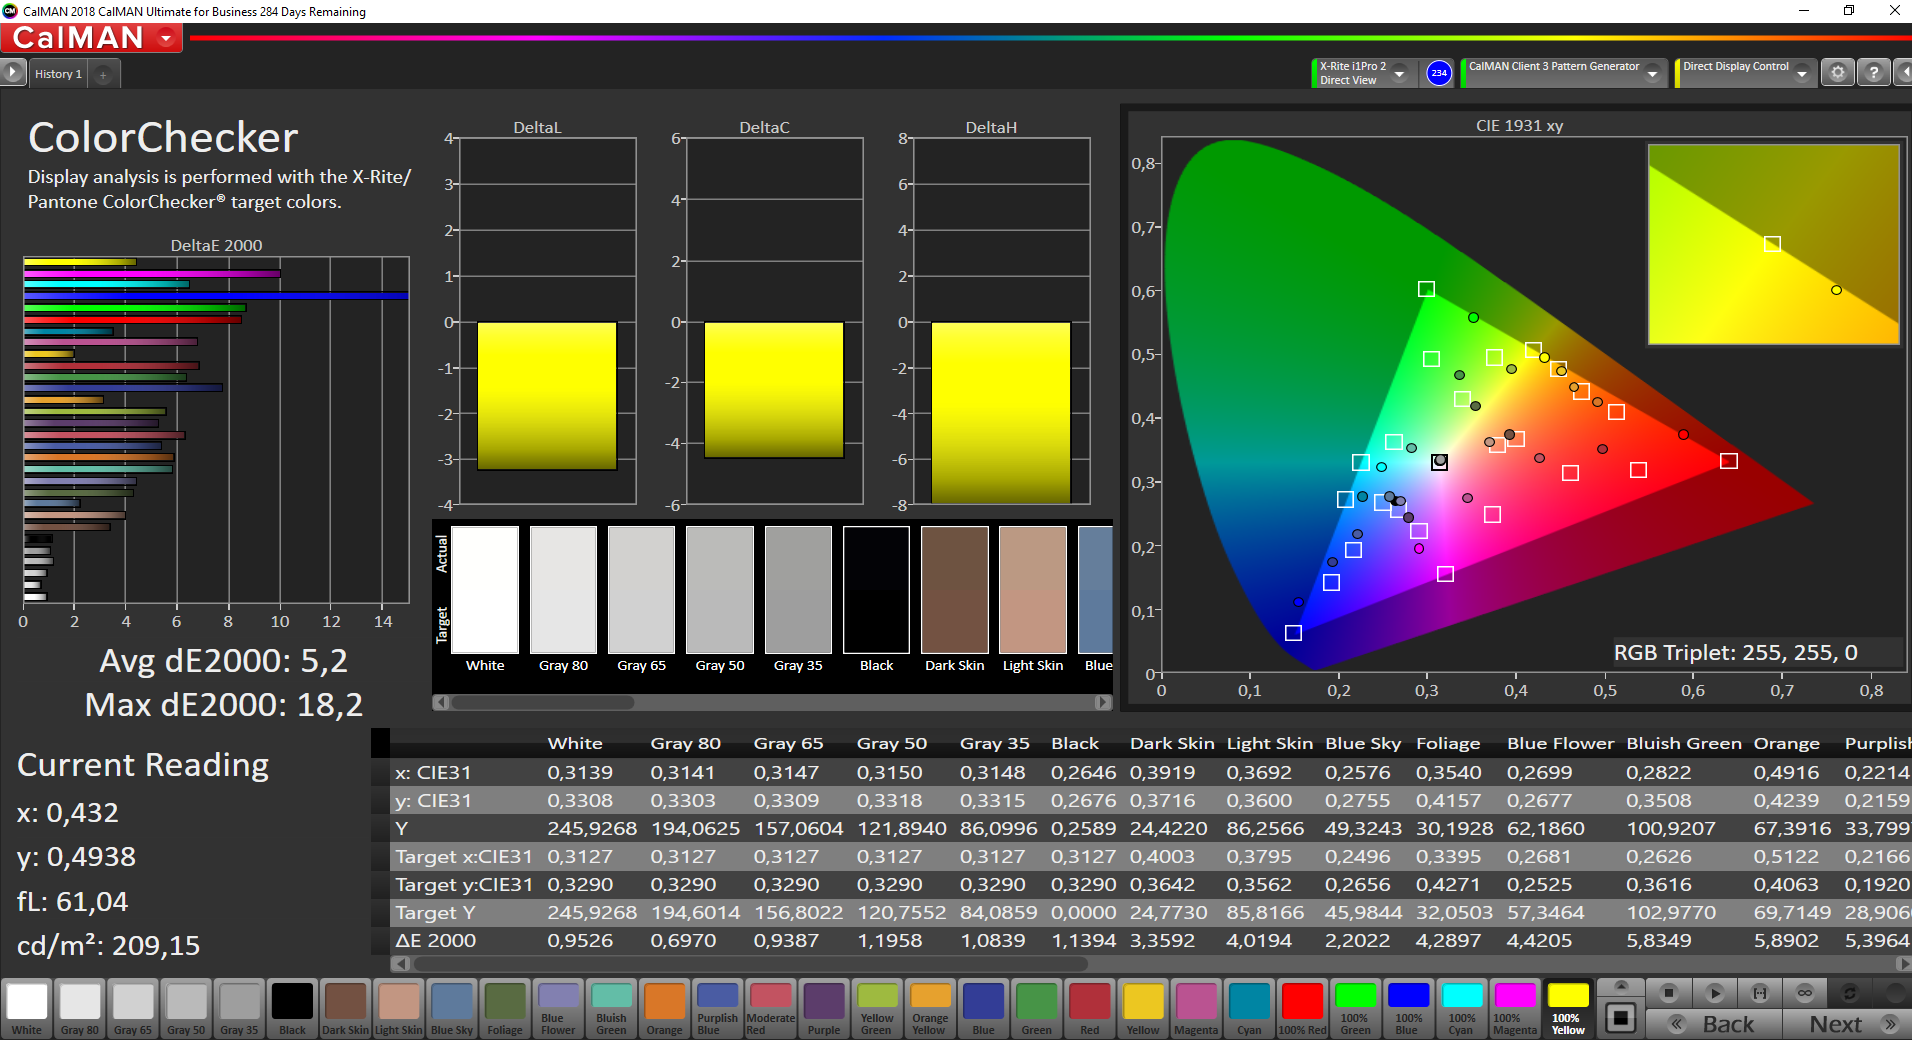
calibrated: 5.2
ΔE Greyscale Calman: 3.8 | ∀{0.09-98 Ø4.97}
56.9% sRGB (Argyll 1.6.3 3D)
36.1% AdobeRGB 1998 (Argyll 1.6.3 3D)
39.37% AdobeRGB 1998 (Argyll 3D)
57.2% sRGB (Argyll 3D)
38.08% Display P3 (Argyll 3D)
Gamma: 2.5
CCT: 6643 K
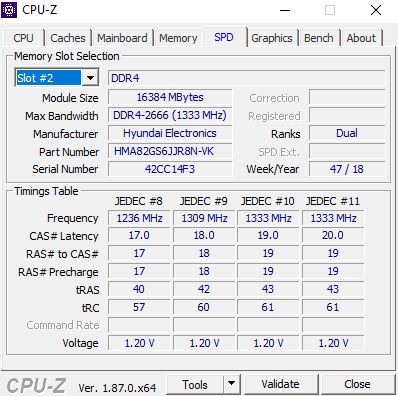
| HP ProBook 440 G6-5TK01EA LG Philips, LGD05F1, IPS, 1920x1080, 14" | HP ProBook 440 G5-3KX87ES LGD04B2, IPS LED, 1920x1080, 14" | Lenovo ThinkPad E480-20KNCTO1WW Innolux N140HCA-EAC, IPS LED, 1920x1080, 14" | Lenovo ThinkPad A485-20MU000CGE NV140FHM-N46, IPS LED, 1920x1080, 14" | Acer TravelMate X3410-M-866T Chi Mei CMN14D4, IPS, 1920x1080, 14" | Fujitsu Lifebook E548 LG Philips LGD05B6, IPS, 1920x1080, 14" | Huawei MateBook D 14 W50F BOE0764 / TV140FHM-NH0, IPS, 1920x1080, 14" | |
|---|---|---|---|---|---|---|---|
| Display | 4% | 9% | 6% | 9% | 3% | 13% | |
| Display P3 Coverage (%) | 38.08 | 39.56 4% | 41.56 9% | 40.24 6% | 41.59 9% | 39.21 3% | 43.19 13% |
| sRGB Coverage (%) | 57.2 | 59.3 4% | 62.2 9% | 60 5% | 62.4 9% | 58.5 2% | 64 12% |
| AdobeRGB 1998 Coverage (%) | 39.37 | 40.88 4% | 42.96 9% | 41.57 6% | 42.99 9% | 40.56 3% | 44.62 13% |
| Response Times | -1% | -12% | -19% | -13% | 21% | -18% | |
| Response Time Grey 50% / Grey 80% * (ms) | 41.6 ? | 40 ? 4% | 44.8 ? -8% | 44.8 ? -8% | 40.4 ? 3% | 34 ? 18% | 41 ? 1% |
| Response Time Black / White * (ms) | 27.2 ? | 28.8 ? -6% | 31.2 ? -15% | 35.2 ? -29% | 35.2 ? -29% | 21 ? 23% | 37 ? -36% |
| PWM Frequency (Hz) | 25000 ? | 1000 ? | 25000 ? | 200 ? | |||
| Screen | -5% | -5% | 2% | 1% | -1% | 2% | |
| Brightness middle (cd/m²) | 256 | 236 -8% | 262 2% | 275 7% | 253.1 -1% | 278 9% | 291 14% |
| Brightness (cd/m²) | 238 | 221 -7% | 245 3% | 272 14% | 230 -3% | 240 1% | 276 16% |
| Brightness Distribution (%) | 85 | 88 4% | 83 -2% | 85 0% | 77 -9% | 78 -8% | 85 0% |
| Black Level * (cd/m²) | 0.23 | 0.26 -13% | 0.19 17% | 0.26 -13% | 0.3 -30% | 0.27 -17% | 0.46 -100% |
| Contrast (:1) | 1113 | 908 -18% | 1379 24% | 1058 -5% | 844 -24% | 1030 -7% | 633 -43% |
| Colorchecker dE 2000 * | 6.2 | 5.7 8% | 7 -13% | 5.9 5% | 4.71 24% | 5.57 10% | 4.3 31% |
| Colorchecker dE 2000 max. * | 18.2 | 22 -21% | 23.6 -30% | 20 -10% | 20.72 -14% | 11.01 40% | 10.01 45% |
| Colorchecker dE 2000 calibrated * | 5.2 | 4.9 6% | 3.44 34% | 5.63 -8% | 3.18 39% | ||
| Greyscale dE 2000 * | 3.8 | 3.8 -0% | 6.4 -68% | 3.6 5% | 3.4 11% | 4.94 -30% | 4.21 -11% |
| Gamma | 2.5 88% | 2.1 105% | 2.14 103% | 2.36 93% | 1.997 110% | 2.6 85% | 2.46 89% |
| CCT | 6643 98% | 7318 89% | 6065 107% | 6798 96% | 6266 104% | 7322 89% | 6867 95% |
| Color Space (Percent of AdobeRGB 1998) (%) | 36.1 | 37.7 4% | 39.5 9% | 38.1 6% | 40 11% | 37 2% | 41 14% |
| Color Space (Percent of sRGB) (%) | 56.9 | 59.2 4% | 61.9 9% | 59.6 5% | 62 9% | 58 2% | 64 12% |
| Média Total (Programa/Configurações) | -1% /
-2% | -3% /
-3% | -4% /
0% | -1% /
1% | 8% /
3% | -1% /
1% |
* ... menor é melhor
Exibir tempos de resposta
| ↔ Tempo de resposta preto para branco | ||
|---|---|---|
| 27.2 ms ... ascensão ↗ e queda ↘ combinadas | ↗ 15.6 ms ascensão | 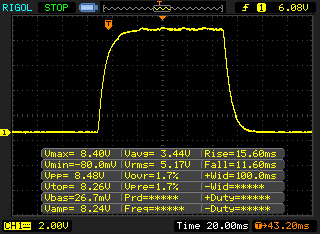 |
| ↘ 11.6 ms queda | ||
| A tela mostra taxas de resposta relativamente lentas em nossos testes e pode ser muito lenta para os jogadores. Em comparação, todos os dispositivos testados variam de 0.1 (mínimo) a 240 (máximo) ms. » 69 % de todos os dispositivos são melhores. Isso significa que o tempo de resposta medido é pior que a média de todos os dispositivos testados (19.9 ms). | ||
| ↔ Tempo de resposta 50% cinza a 80% cinza | ||
| 41.6 ms ... ascensão ↗ e queda ↘ combinadas | ↗ 22.8 ms ascensão | 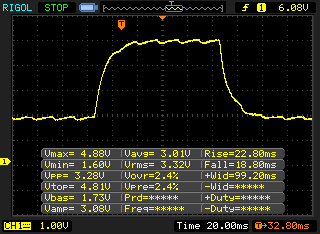 |
| ↘ 18.8 ms queda | ||
| A tela mostra taxas de resposta lentas em nossos testes e será insatisfatória para os jogadores. Em comparação, todos os dispositivos testados variam de 0.165 (mínimo) a 636 (máximo) ms. » 67 % de todos os dispositivos são melhores. Isso significa que o tempo de resposta medido é pior que a média de todos os dispositivos testados (31.1 ms). | ||
Cintilação da tela / PWM (modulação por largura de pulso)
| Tela tremeluzindo / PWM não detectado | 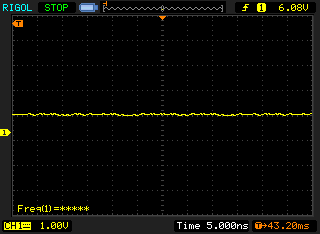 | ||
[pwm_comparison] Em comparação: 52 % de todos os dispositivos testados não usam PWM para escurecer a tela. Se PWM foi detectado, uma média de 7798 (mínimo: 5 - máximo: 343500) Hz foi medida. | |||

| Blender - v2.79 BMW27 CPU | |
| Lenovo ThinkPad A485-20MU000CGE | |
| HP ProBook 440 G6-5TK01EA | |
| Média Intel Core i7-8565U (687 - 1175, n=22) | |
| Média da turma Office (158 - 1940, n=73, últimos 2 anos) | |
* ... menor é melhor
| PCMark 8 Home Score Accelerated v2 | 4071 pontos | |
| PCMark 8 Creative Score Accelerated v2 | 5124 pontos | |
| PCMark 8 Work Score Accelerated v2 | 5160 pontos | |
| PCMark 10 Score | 4015 pontos | |
Ajuda | ||
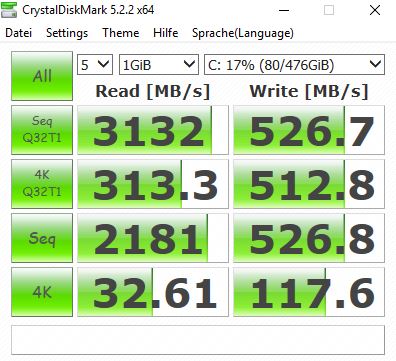
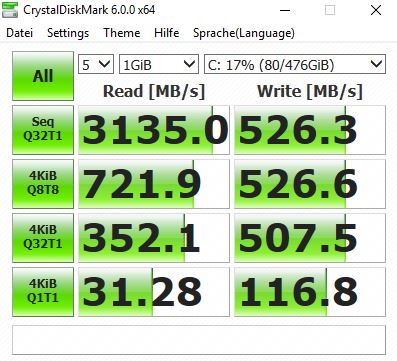
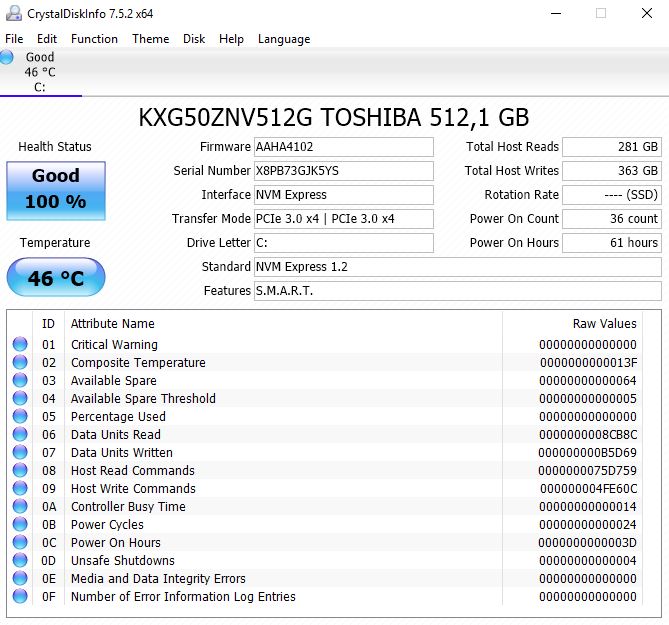
| HP ProBook 440 G6-5TK01EA Toshiba XG5 KXG50ZNV512G | HP ProBook 440 G5-3KX87ES Intel SSD 600p SSDPEKKW256G7 | Lenovo ThinkPad E480-20KNCTO1WW Toshiba KBG30ZMT128G | Lenovo ThinkPad A485-20MU000CGE Samsung SSD PM981 MZVLB256HAHQ | Acer TravelMate X3410-M-866T Micron SSD 1100 SED 512GB, M.2 (MTFDDAV512TBN) | Fujitsu Lifebook E548 Samsung SSD PM871b MZNLN256HAJQ | Huawei MateBook D 14 W50F SanDisk SD9SN8W256G1027 | Média Toshiba XG5 KXG50ZNV512G | |
|---|---|---|---|---|---|---|---|---|
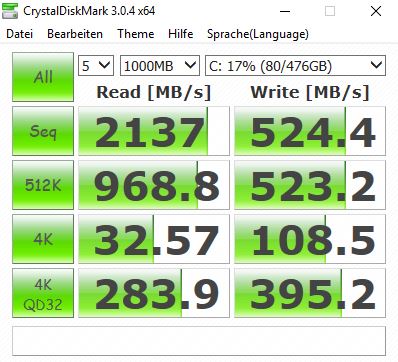
| CrystalDiskMark 5.2 / 6 | -12% | -54% | 34% | -32% | -42% | -41% | 18% | |
| Write 4K (MB/s) | 117.6 | 135.3 15% | 81.4 -31% | 114.8 -2% | 113.3 -4% | 83.2 -29% | 60.5 -49% | 114 ? -3% |
| Read 4K (MB/s) | 32.61 | 34.35 5% | 33.74 3% | 41.33 27% | 28.65 -12% | 16.66 -49% | 21.63 -34% | 35.6 ? 9% |
| Write Seq (MB/s) | 527 | 601 14% | 129 -76% | 1271 141% | 428.7 -19% | 384.3 -27% | 450.9 -14% | 684 ? 30% |
| Read Seq (MB/s) | 2181 | 1175 -46% | 905 -59% | 1171 -46% | 435.2 -80% | 466.8 -79% | 482.3 -78% | 1612 ? -26% |
| Write 4K Q32T1 (MB/s) | 508 | 377.6 -26% | 107.2 -79% | 218.4 -57% | 274.6 -46% | 269.7 -47% | 248.9 -51% | 401 ? -21% |
| Read 4K Q32T1 (MB/s) | 352.1 | 288.3 -18% | 197.1 -44% | 308.5 -12% | 326.5 -7% | 260 -26% | 267.6 -24% | 427 ? 21% |
| Write Seq Q32T1 (MB/s) | 526 | 591 12% | 128.9 -75% | 1460 178% | 505 -4% | 532 1% | 534 2% | 830 ? 58% |
| Read Seq Q32T1 (MB/s) | 3135 | 1574 -50% | 906 -71% | 1529 -51% | 530 -83% | 545 -83% | 563 -82% | 2950 ? -6% |
| Write 4K Q8T8 (MB/s) | 527 | 1208 129% | 887 ? 68% | |||||
| Read 4K Q8T8 (MB/s) | 722 | 983 36% | 1060 ? 47% | |||||
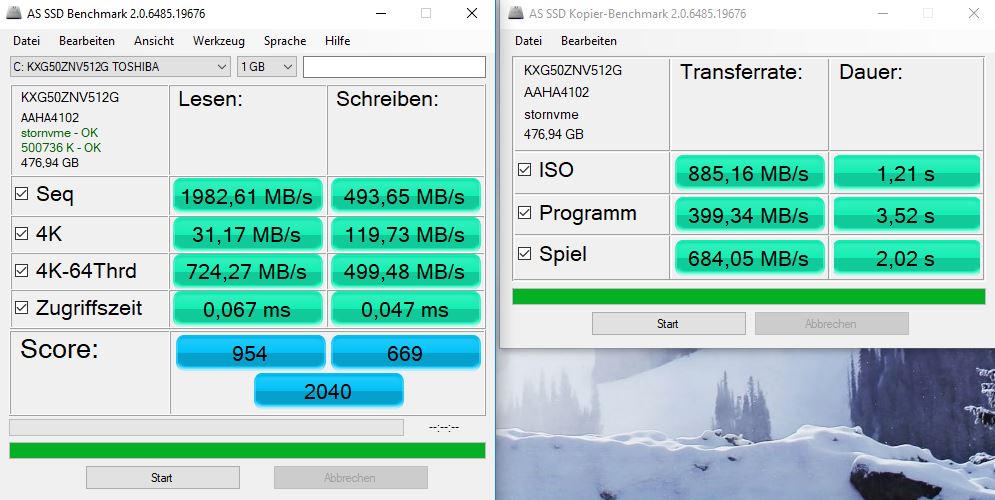
| AS SSD | -28% | -88% | -10% | -36% | -48% | -65% | -14% | |
| Seq Read (MB/s) | 1983 | 1282 -35% | 1015 -49% | 1224 -38% | 464.9 -77% | 448.4 -77% | 458.3 -77% | 2137 ? 8% |
| Seq Write (MB/s) | 493.6 | 430 -13% | 115.4 -77% | 1118 126% | 465.2 -6% | 246.1 -50% | 268.6 -46% | 744 ? 51% |
| 4K Read (MB/s) | 31.17 | 31.9 2% | 31.13 0% | 42.46 36% | 22.96 -26% | 14.13 -55% | 26.87 -14% | 30.1 ? -3% |
| 4K Write (MB/s) | 119.7 | 106.5 -11% | 78.9 -34% | 77.4 -35% | 89.1 -26% | 72.1 -40% | 51.7 -57% | 93.6 ? -22% |
| 4K-64 Read (MB/s) | 724 | 277.5 -62% | 190.9 -74% | 559 -23% | 350.5 -52% | 375.2 -48% | 364.2 -50% | 784 ? 8% |
| 4K-64 Write (MB/s) | 499.5 | 485 -3% | 92.1 -82% | 378.1 -24% | 313.3 -37% | 288.8 -42% | 137.3 -73% | 515 ? 3% |
| Access Time Read * (ms) | 0.067 | 0.119 -78% | 0.106 -58% | 0.081 -21% | 0.123 -84% | 0.092 -37% | 0.09253 ? -38% | |
| Access Time Write * (ms) | 0.047 | 0.032 32% | 0.235 -400% | 0.049 -4% | 0.047 -0% | 0.041 13% | 0.13 -177% | 0.1653 ? -252% |
| Score Read (Points) | 954 | 438 -54% | 324 -66% | 724 -24% | 420 -56% | 434 -55% | 437 -54% | 1028 ? 8% |
| Score Write (Points) | 669 | 634 -5% | 182 -73% | 567 -15% | 449 -33% | 385 -42% | 216 -68% | 683 ? 2% |
| Score Total (Points) | 2040 | 1264 -38% | 638 -69% | 1669 -18% | 1090 -47% | 1034 -49% | 875 -57% | 2170 ? 6% |
| Copy ISO MB/s (MB/s) | 885 | 522 -41% | 108.2 -88% | 812 -8% | 1109 ? 25% | |||
| Copy Program MB/s (MB/s) | 399.3 | 229.6 -42% | 78 -80% | 209.4 -48% | 380 ? -5% | |||
| Copy Game MB/s (MB/s) | 684 | 395.8 -42% | 105.5 -85% | 356.1 -48% | 738 ? 8% | |||
| Média Total (Programa/Configurações) | -20% /
-22% | -71% /
-76% | 12% /
8% | -34% /
-34% | -45% /
-46% | -53% /
-55% | 2% /
-1% |
* ... menor é melhor

| 3DMark 11 Performance | 1997 pontos | |
| 3DMark Ice Storm Standard Score | 45682 pontos | |
| 3DMark Cloud Gate Standard Score | 8458 pontos | |
| 3DMark Fire Strike Score | 1090 pontos | |
| 3DMark Fire Strike Extreme Score | 506 pontos | |
Ajuda | ||
| baixo | média | alto | ultra | |
|---|---|---|---|---|
| BioShock Infinite (2013) | 59.8 | 34.3 | 27.4 | 8.2 |
| Dota 2 Reborn (2015) | 70 | 42.5 | 19.7 | 17.5 |
| Rise of the Tomb Raider (2016) | 20.6 | 13.4 | 6.9 | |
| Rocket League (2017) | 25.5 | 16.9 | ||
| X-Plane 11.11 (2018) | 30.3 | 22.7 | 19.1 |
Barulho
| Ocioso |
| 29.4 / 29.4 / 30.2 dB |
| Carga |
| 31.8 / 33.1 dB |
 | ||
30 dB silencioso 40 dB(A) audível 50 dB(A) ruidosamente alto |
||
min: | ||
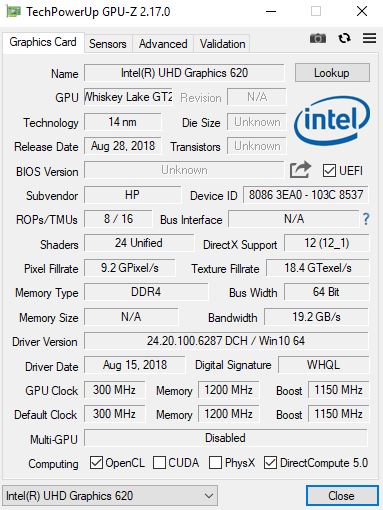
| HP ProBook 440 G6-5TK01EA UHD Graphics 620, i7-8565U, Toshiba XG5 KXG50ZNV512G | HP ProBook 440 G5-3KX87ES UHD Graphics 620, i5-8250U, Intel SSD 600p SSDPEKKW256G7 | Lenovo ThinkPad E480-20KNCTO1WW UHD Graphics 620, i5-8250U, Toshiba KBG30ZMT128G | Lenovo ThinkPad A485-20MU000CGE Vega 8, R5 PRO 2500U, Samsung SSD PM981 MZVLB256HAHQ | Acer TravelMate X3410-M-866T UHD Graphics 620, i5-8550U, Micron SSD 1100 SED 512GB, M.2 (MTFDDAV512TBN) | Fujitsu Lifebook E548 UHD Graphics 620, i5-8250U, Samsung SSD PM871b MZNLN256HAJQ | Huawei MateBook D 14 W50F UHD Graphics 620, i5-8250U, SanDisk SD9SN8W256G1027 | |
|---|---|---|---|---|---|---|---|
| Noise | -3% | 0% | 1% | 1% | -3% | -3% | |
| desligado / ambiente * (dB) | 29.4 | 29.1 1% | 29.1 1% | 29.3 -0% | 28.2 4% | 30 -2% | 30.5 -4% |
| Idle Minimum * (dB) | 29.4 | 29.1 1% | 29.1 1% | 29.3 -0% | 28.2 4% | 30 -2% | 30.5 -4% |
| Idle Average * (dB) | 29.4 | 29.1 1% | 29.1 1% | 29.3 -0% | 28.2 4% | 30 -2% | 30.5 -4% |
| Idle Maximum * (dB) | 30.2 | 30.7 -2% | 30.3 -0% | 29.6 2% | 28.2 7% | 30 1% | 30.5 -1% |
| Load Average * (dB) | 31.8 | 34.5 -8% | 31.8 -0% | 31.6 1% | 33.2 -4% | 35.3 -11% | 33.6 -6% |
| Load Maximum * (dB) | 33.1 | 36 -9% | 33.8 -2% | 31.6 5% | 35.6 -8% | 33.9 -2% | 32.6 2% |
* ... menor é melhor
(+) A temperatura máxima no lado superior é 38.3 °C / 101 F, em comparação com a média de 34.3 °C / 94 F , variando de 21.2 a 62.5 °C para a classe Office.
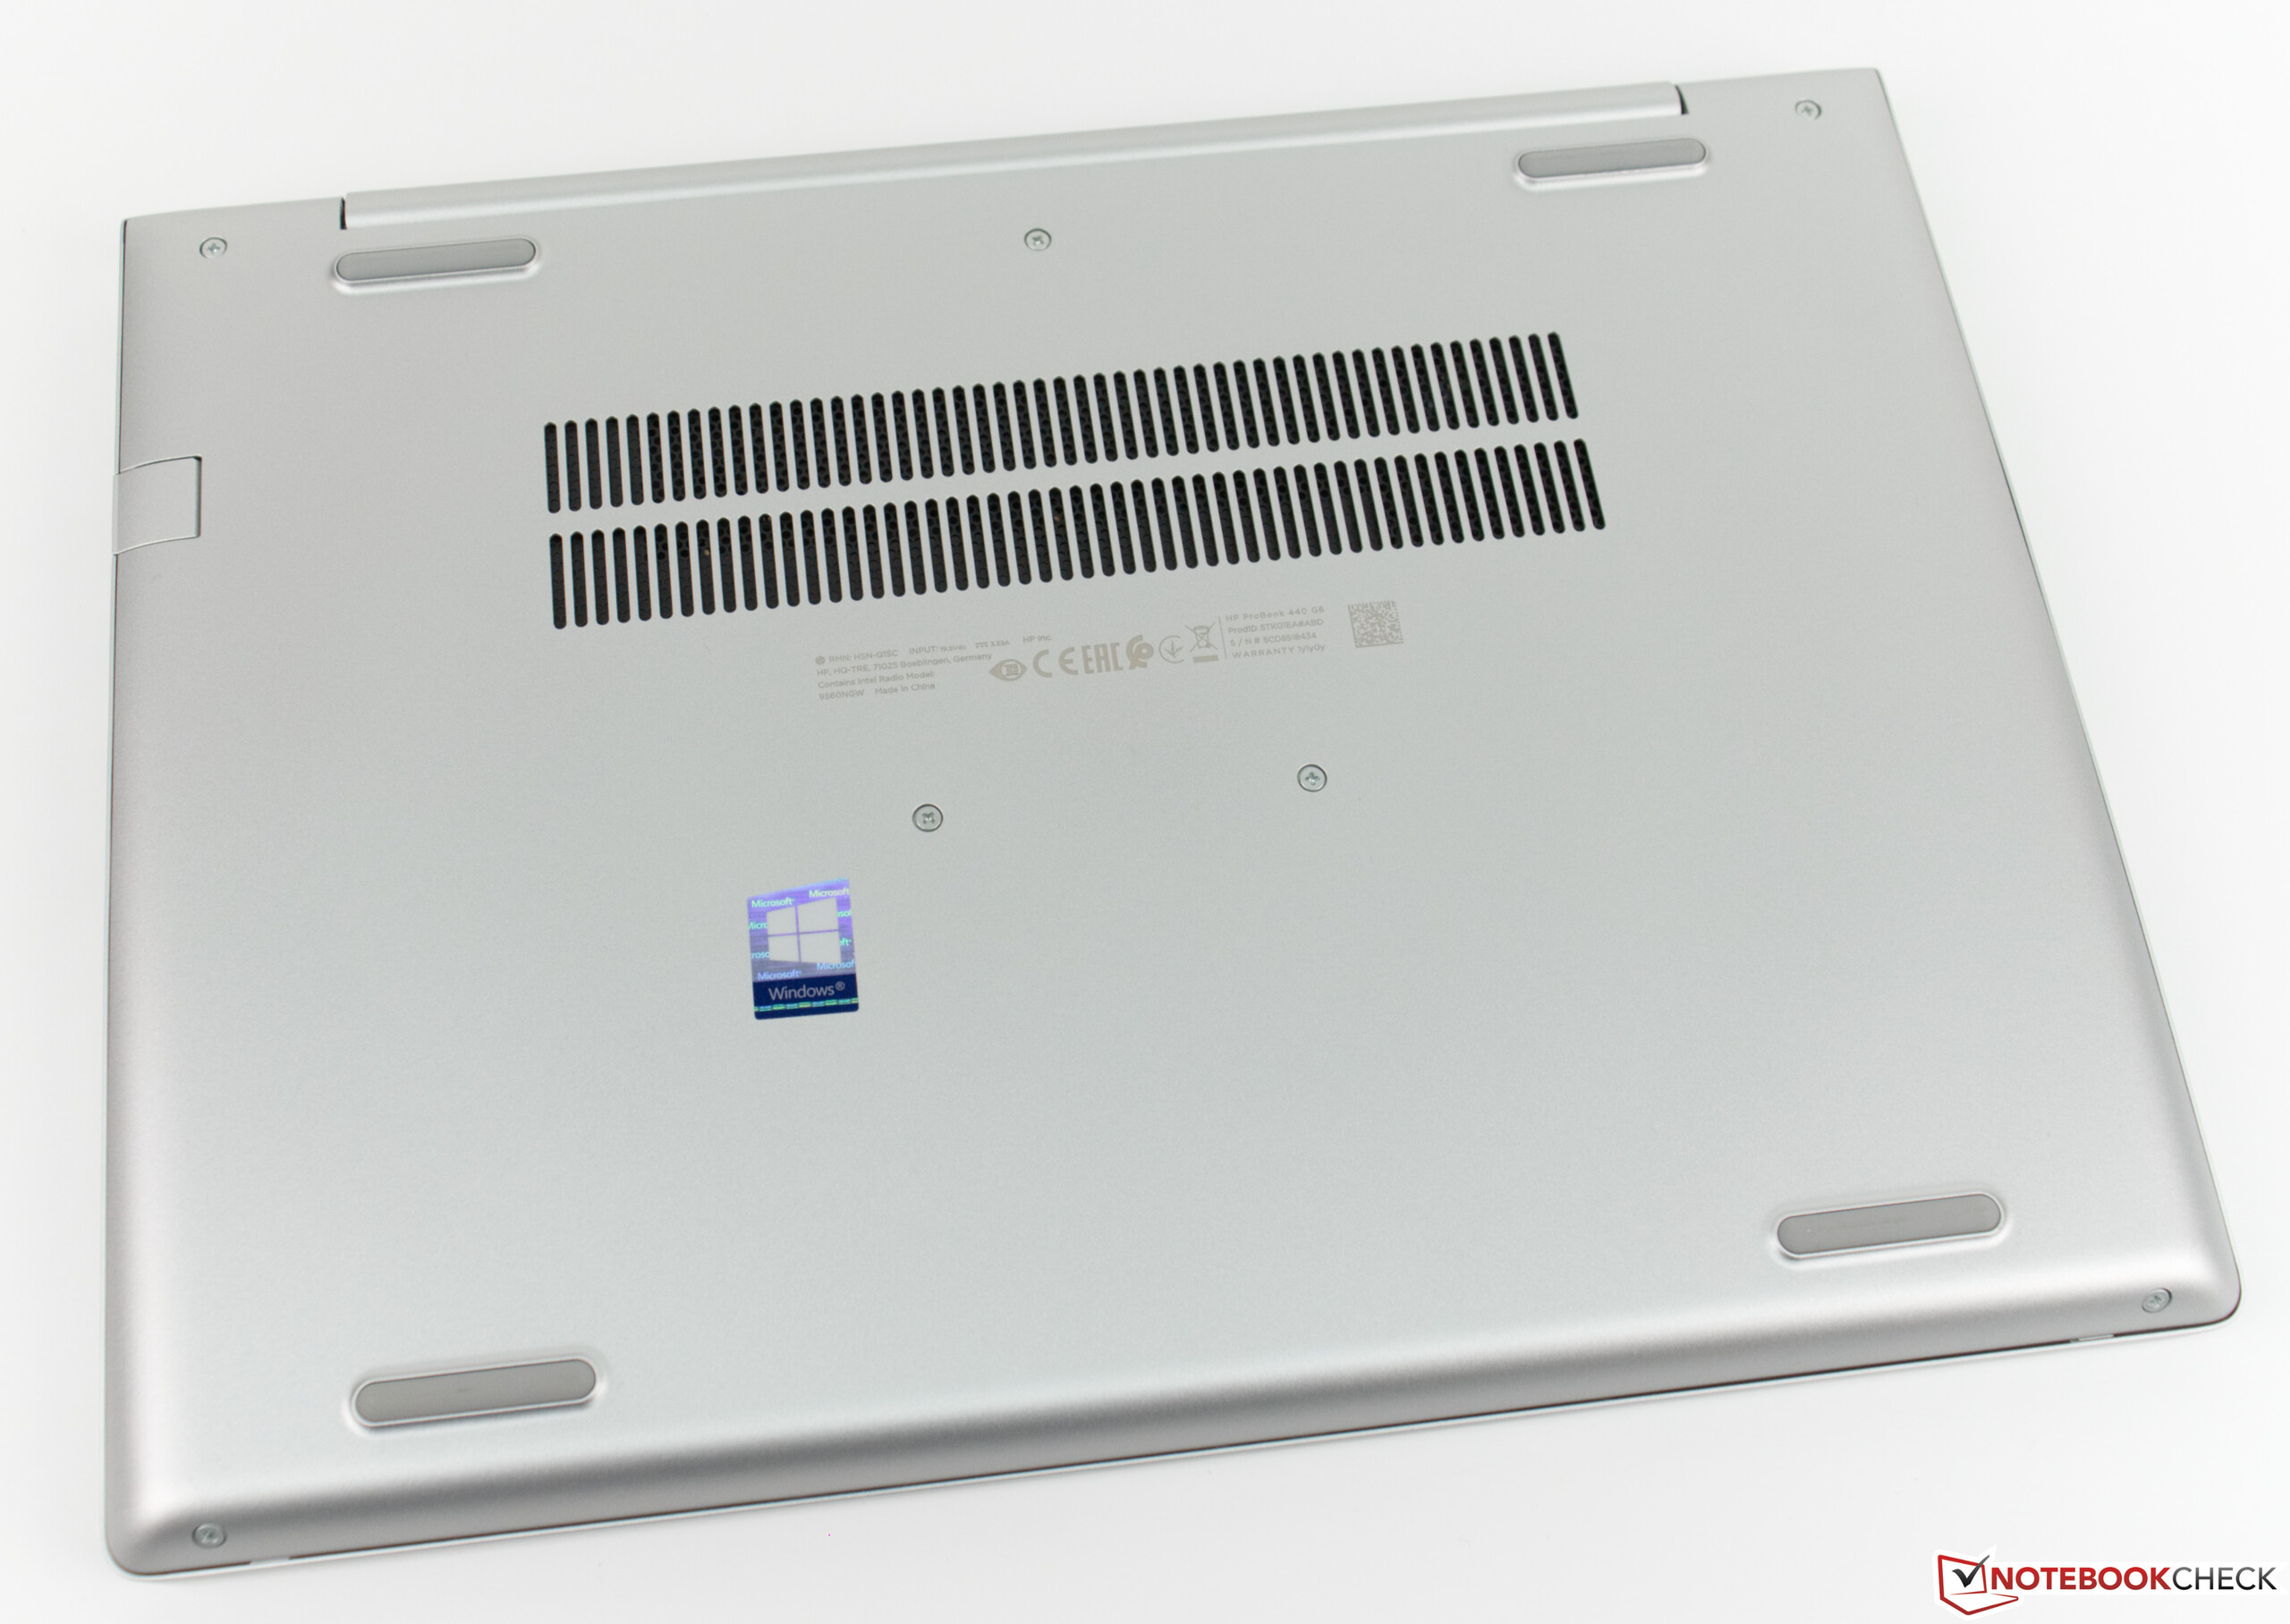
(-) A parte inferior aquece até um máximo de 50.5 °C / 123 F, em comparação com a média de 36.8 °C / 98 F
(+) Em uso inativo, a temperatura média para o lado superior é 24.1 °C / 75 F, em comparação com a média do dispositivo de 29.5 °C / ### class_avg_f### F.
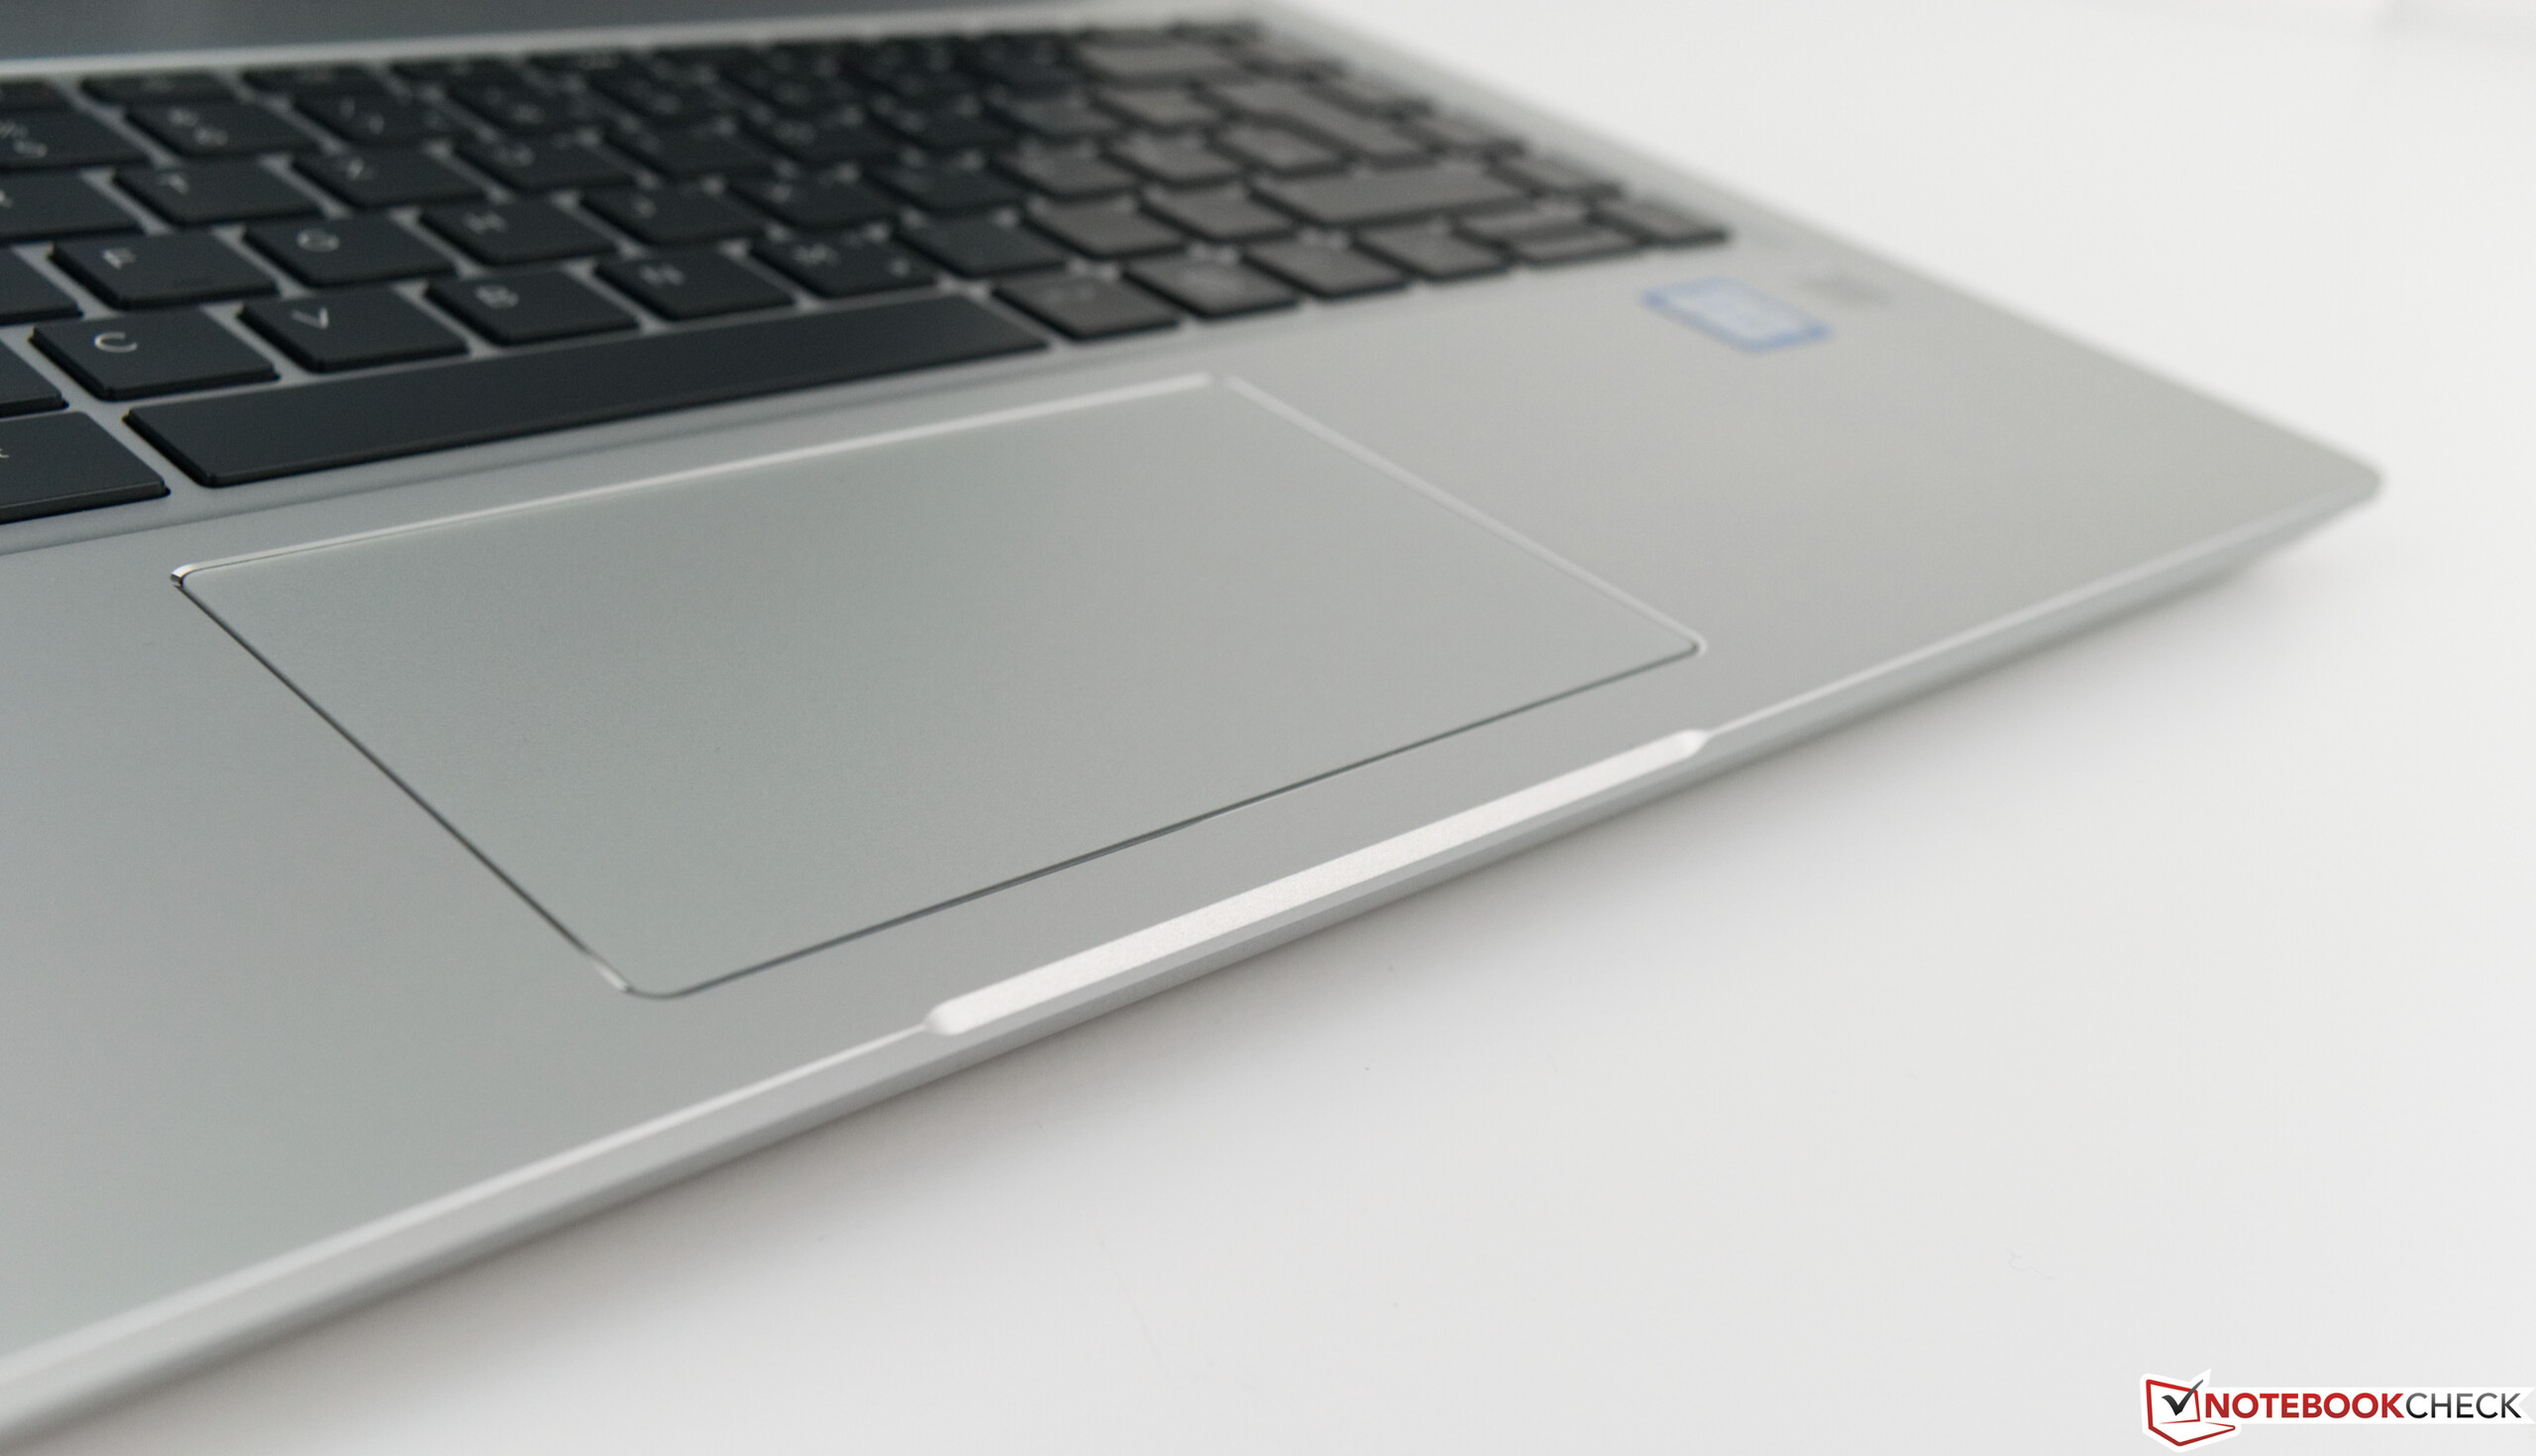
(+) Os apoios para as mãos e o touchpad são mais frios que a temperatura da pele, com um máximo de 30.3 °C / 86.5 F e, portanto, são frios ao toque.
(-) A temperatura média da área do apoio para as mãos de dispositivos semelhantes foi 27.5 °C / 81.5 F (-2.8 °C / -5 F).
| HP ProBook 440 G6-5TK01EA UHD Graphics 620, i7-8565U, Toshiba XG5 KXG50ZNV512G | HP ProBook 440 G5-3KX87ES UHD Graphics 620, i5-8250U, Intel SSD 600p SSDPEKKW256G7 | Lenovo ThinkPad E480-20KNCTO1WW UHD Graphics 620, i5-8250U, Toshiba KBG30ZMT128G | Lenovo ThinkPad A485-20MU000CGE Vega 8, R5 PRO 2500U, Samsung SSD PM981 MZVLB256HAHQ | Acer TravelMate X3410-M-866T UHD Graphics 620, i5-8550U, Micron SSD 1100 SED 512GB, M.2 (MTFDDAV512TBN) | Fujitsu Lifebook E548 UHD Graphics 620, i5-8250U, Samsung SSD PM871b MZNLN256HAJQ | Huawei MateBook D 14 W50F UHD Graphics 620, i5-8250U, SanDisk SD9SN8W256G1027 | |
|---|---|---|---|---|---|---|---|
| Heat | 2% | 9% | -9% | 2% | -6% | -4% | |
| Maximum Upper Side * (°C) | 38.3 | 39 -2% | 36.7 4% | 39.1 -2% | 35.2 8% | 40.3 -5% | 41.6 -9% |
| Maximum Bottom * (°C) | 50.5 | 45.5 10% | 42.8 15% | 49.9 1% | 39.4 22% | 42.6 16% | 44.2 12% |
| Idle Upper Side * (°C) | 24.6 | 24.8 -1% | 23.4 5% | 28 -14% | 27.6 -12% | 28 -14% | 27.4 -11% |
| Idle Bottom * (°C) | 25.4 | 25 2% | 22.8 10% | 30.5 -20% | 27.8 -9% | 31 -22% | 27.6 -9% |
* ... menor é melhor
HP ProBook 440 G6-5TK01EA análise de áudio
(±) | o volume do alto-falante é médio, mas bom (###valor### dB)
Graves 100 - 315Hz
(-) | quase nenhum baixo - em média 17.2% menor que a mediana
(±) | a linearidade dos graves é média (12.1% delta para a frequência anterior)
Médios 400 - 2.000 Hz
(+) | médios equilibrados - apenas 3.3% longe da mediana
(+) | médios são lineares (6.7% delta para frequência anterior)
Altos 2 - 16 kHz
(±) | máximos mais altos - em média 5.7% maior que a mediana
(±) | a linearidade dos máximos é média (7.1% delta para frequência anterior)
Geral 100 - 16.000 Hz
(±) | a linearidade do som geral é média (20.8% diferença em relação à mediana)
Comparado com a mesma classe
» 48% de todos os dispositivos testados nesta classe foram melhores, 9% semelhantes, 43% piores
» O melhor teve um delta de 7%, a média foi 21%, o pior foi 53%
Comparado com todos os dispositivos testados
» 56% de todos os dispositivos testados foram melhores, 8% semelhantes, 36% piores
» O melhor teve um delta de 4%, a média foi 24%, o pior foi 134%
Lenovo ThinkPad A485-20MU000CGE análise de áudio
(±) | o volume do alto-falante é médio, mas bom (###valor### dB)
Graves 100 - 315Hz
(-) | quase nenhum baixo - em média 24.7% menor que a mediana
(±) | a linearidade dos graves é média (11.9% delta para a frequência anterior)
Médios 400 - 2.000 Hz
(+) | médios equilibrados - apenas 2.9% longe da mediana
(±) | a linearidade dos médios é média (7.5% delta para frequência anterior)
Altos 2 - 16 kHz
(+) | agudos equilibrados - apenas 2.2% longe da mediana
(+) | os máximos são lineares (6.8% delta da frequência anterior)
Geral 100 - 16.000 Hz
(±) | a linearidade do som geral é média (23.8% diferença em relação à mediana)
Comparado com a mesma classe
» 68% de todos os dispositivos testados nesta classe foram melhores, 8% semelhantes, 24% piores
» O melhor teve um delta de 7%, a média foi 21%, o pior foi 53%
Comparado com todos os dispositivos testados
» 71% de todos os dispositivos testados foram melhores, 6% semelhantes, 22% piores
» O melhor teve um delta de 4%, a média foi 24%, o pior foi 134%
| desligado | |
| Ocioso | |
| Carga |
|
Key:
min: | |
| HP ProBook 440 G6-5TK01EA i7-8565U, UHD Graphics 620, Toshiba XG5 KXG50ZNV512G, IPS, 1920x1080, 14" | HP ProBook 440 G5-3KX87ES i5-8250U, UHD Graphics 620, Intel SSD 600p SSDPEKKW256G7, IPS LED, 1920x1080, 14" | Lenovo ThinkPad E480-20KNCTO1WW i5-8250U, UHD Graphics 620, Toshiba KBG30ZMT128G, IPS LED, 1920x1080, 14" | Lenovo ThinkPad A485-20MU000CGE R5 PRO 2500U, Vega 8, Samsung SSD PM981 MZVLB256HAHQ, IPS LED, 1920x1080, 14" | Acer TravelMate X3410-M-866T i5-8550U, UHD Graphics 620, Micron SSD 1100 SED 512GB, M.2 (MTFDDAV512TBN), IPS, 1920x1080, 14" | Fujitsu Lifebook E548 i5-8250U, UHD Graphics 620, Samsung SSD PM871b MZNLN256HAJQ, IPS, 1920x1080, 14" | Huawei MateBook D 14 W50F i5-8250U, UHD Graphics 620, SanDisk SD9SN8W256G1027, IPS, 1920x1080, 14" | Média Intel UHD Graphics 620 | Média da turma Office | |
|---|---|---|---|---|---|---|---|---|---|
| Power Consumption | -25% | 5% | -42% | -19% | 16% | -5% | -16% | -33% | |
| Idle Minimum * (Watt) | 2.98 | 4.4 -48% | 3.5 -17% | 5.3 -78% | 4.5 -51% | 3.1 -4% | 3.7 -24% | 3.81 ? -28% | 4.4 ? -48% |
| Idle Average * (Watt) | 5.4 | 7.1 -31% | 5.3 2% | 8.3 -54% | 6.3 -17% | 5 7% | 6.9 -28% | 6.94 ? -29% | 7.32 ? -36% |
| Idle Maximum * (Watt) | 7.9 | 10.2 -29% | 6.1 23% | 11.4 -44% | 7 11% | 6.1 23% | 8.4 -6% | 8.75 ? -11% | 8.56 ? -8% |
| Load Average * (Watt) | 34.5 | 36.5 -6% | 30 13% | 42 -22% | 28.7 17% | 27 22% | 32 7% | 35 ? -1% | 42.5 ? -23% |
| Load Maximum * (Watt) | 43.3 | 48.7 -12% | 42.3 2% | 48.8 -13% | 67.7 -56% | 29.7 31% | 32.6 25% | 47.5 ? -10% | 64.1 ? -48% |
* ... menor é melhor

| HP ProBook 440 G6-5TK01EA i7-8565U, UHD Graphics 620, 45 Wh | HP ProBook 440 G5-3KX87ES i5-8250U, UHD Graphics 620, 48 Wh | Lenovo ThinkPad E480-20KNCTO1WW i5-8250U, UHD Graphics 620, 45 Wh | Lenovo ThinkPad A485-20MU000CGE R5 PRO 2500U, Vega 8, 48 Wh | Acer TravelMate X3410-M-866T i5-8550U, UHD Graphics 620, 57 Wh | Fujitsu Lifebook E548 i5-8250U, UHD Graphics 620, 50 Wh | Huawei MateBook D 14 W50F i5-8250U, UHD Graphics 620, 57 Wh | Média da turma Office | |
|---|---|---|---|---|---|---|---|---|
| Duração da bateria | -16% | -7% | -37% | 11% | 1% | 26% | 41% | |
| Reader / Idle (h) | 17.1 | 13.7 -20% | 18.4 8% | 11.2 -35% | 20.8 22% | 23.6 38% | 23.7 ? 39% | |
| H.264 (h) | 7.6 | 3.7 -51% | 7.2 -5% | 6.1 -20% | 12.1 59% | 15 ? 97% | ||
| WiFi v1.3 (h) | 8.4 | 6.9 -18% | 8.3 -1% | 5.5 -35% | 10.3 23% | 8.5 1% | 10 19% | 12.9 ? 54% |
| Load (h) | 2.5 | 3.1 24% | 1.8 -28% | 1.1 -56% | 2.2 -12% | 2.2 -12% | 1.807 ? -28% |
Pro
Contra
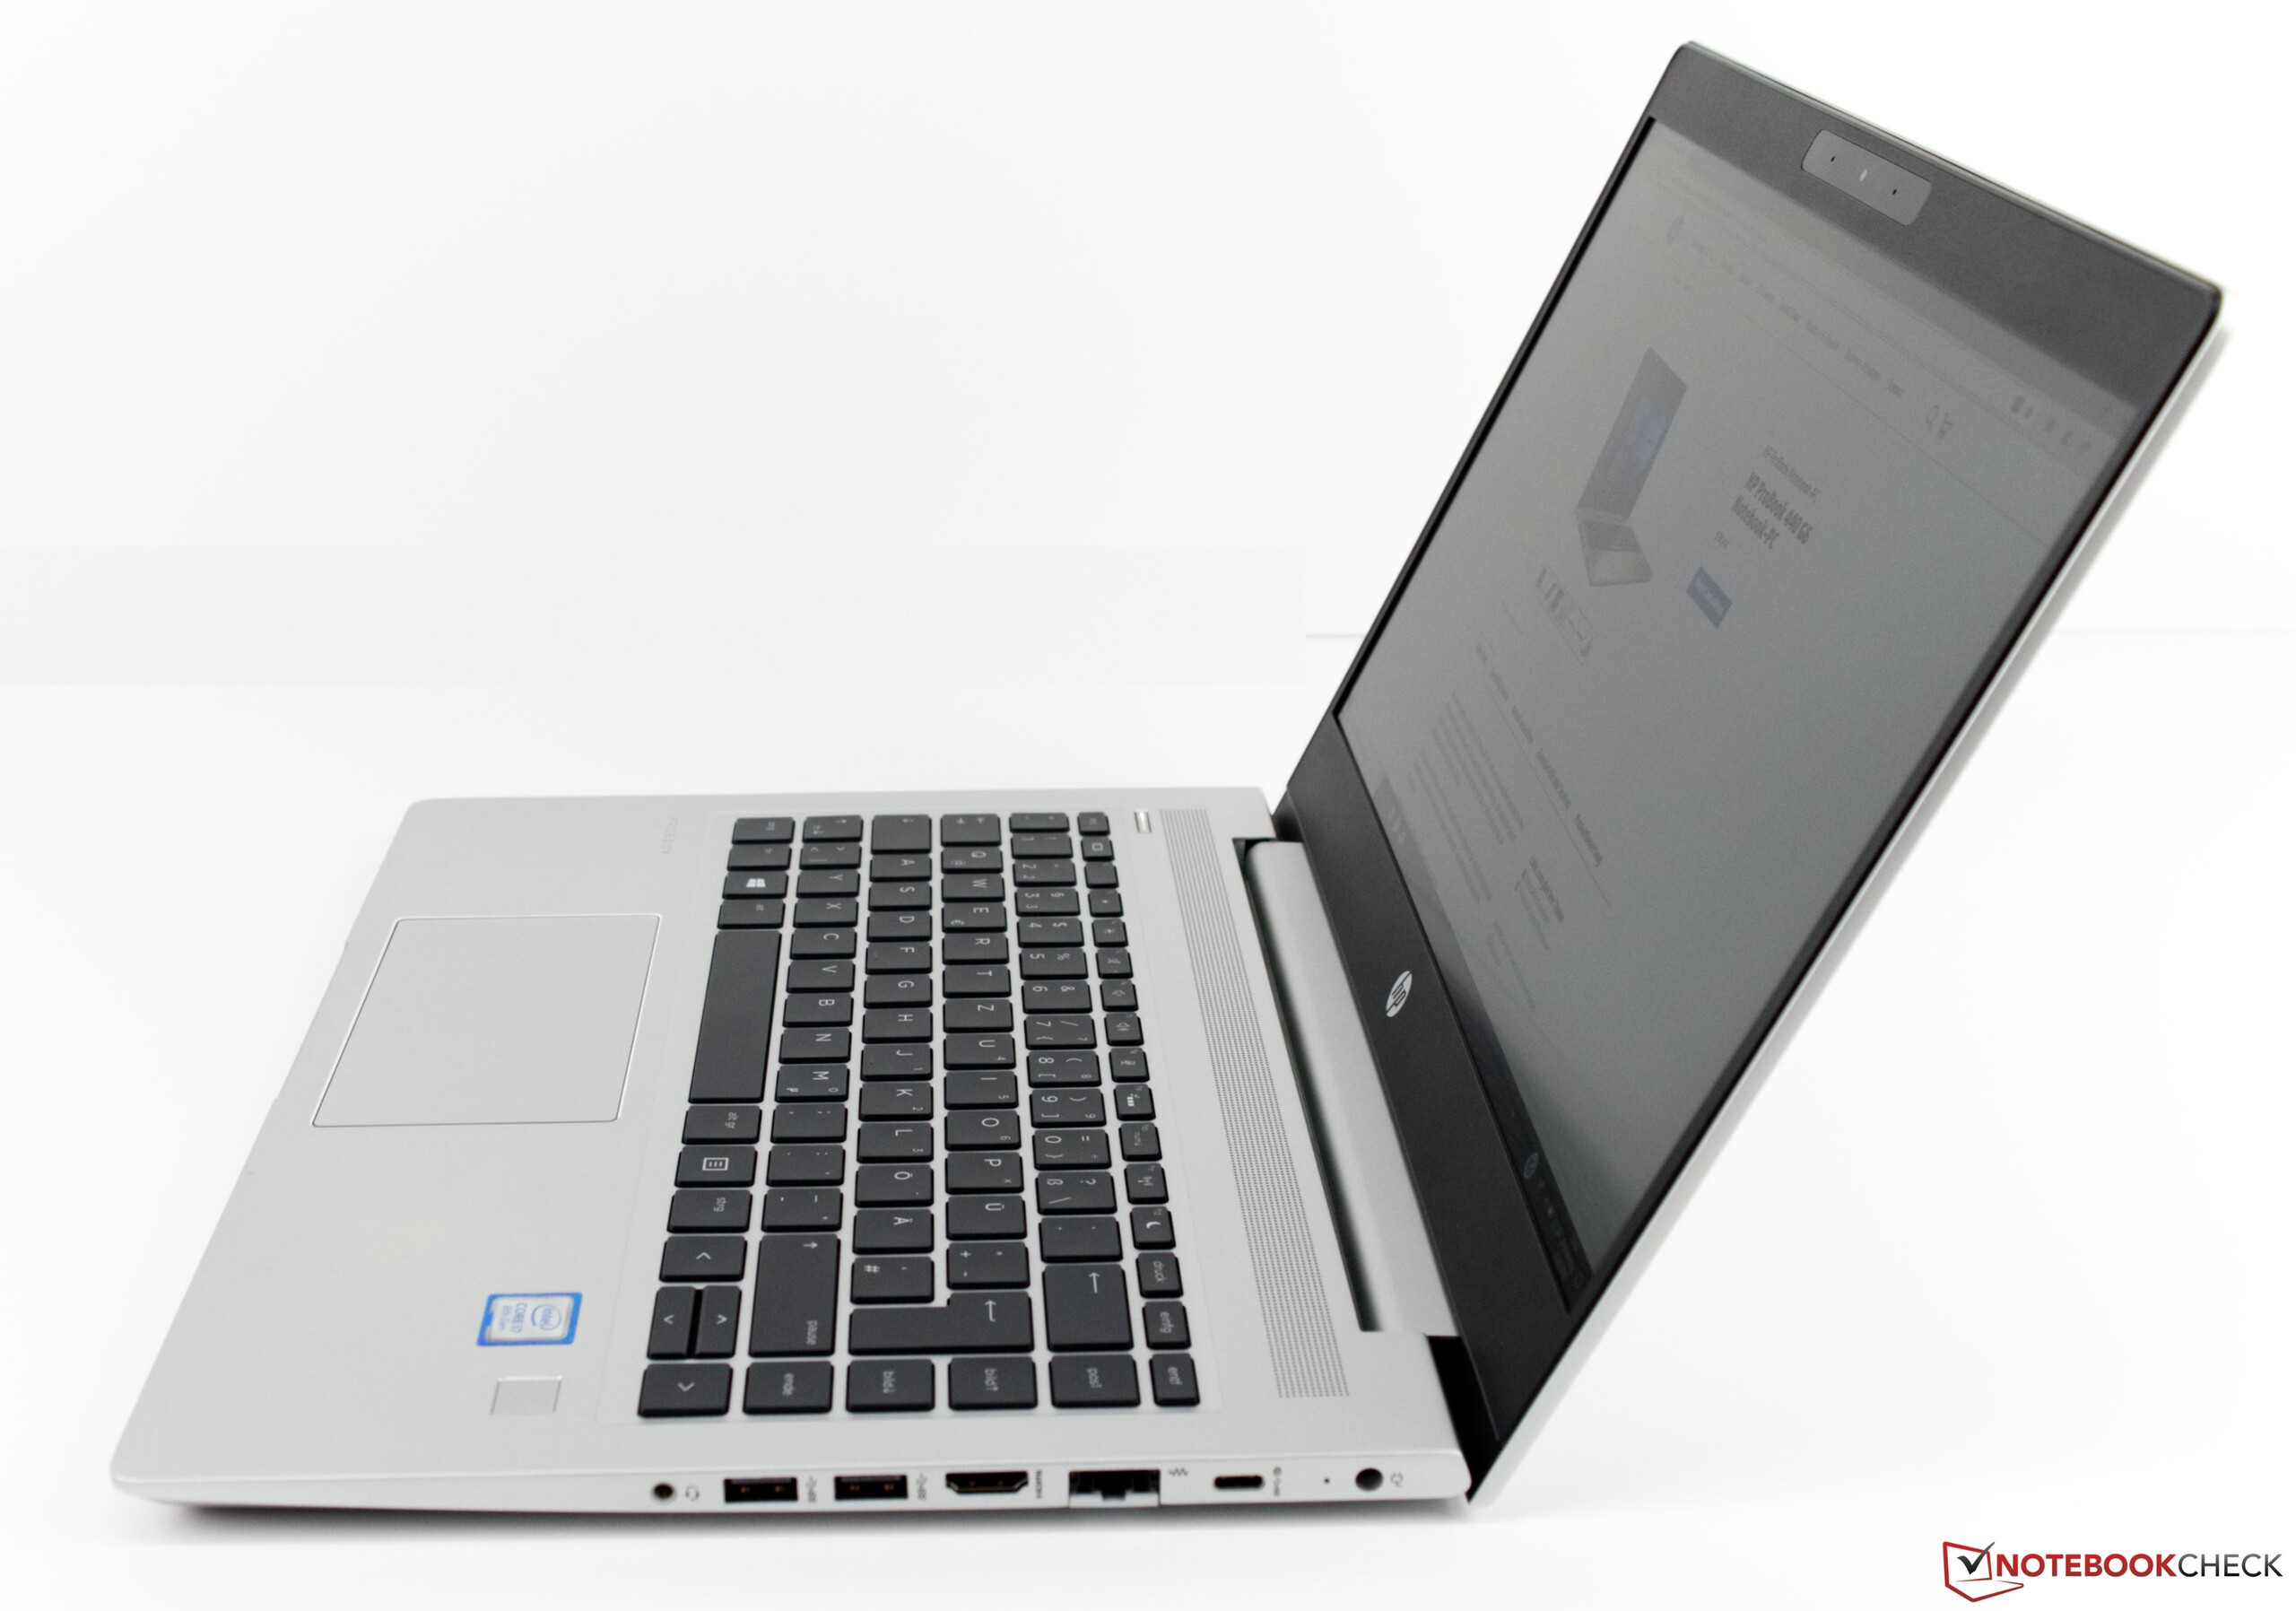
Verdict - a modern HP ProBook

O HP ProBook 440 G6 é um dispositivo voltado principalmente para clientes corporativos com empresas pequenas e médias. Mas o dispositivo também é adequado para usuários finais, pois este dispositivo é ideal para o uso diário no escritório e para navegar na web.
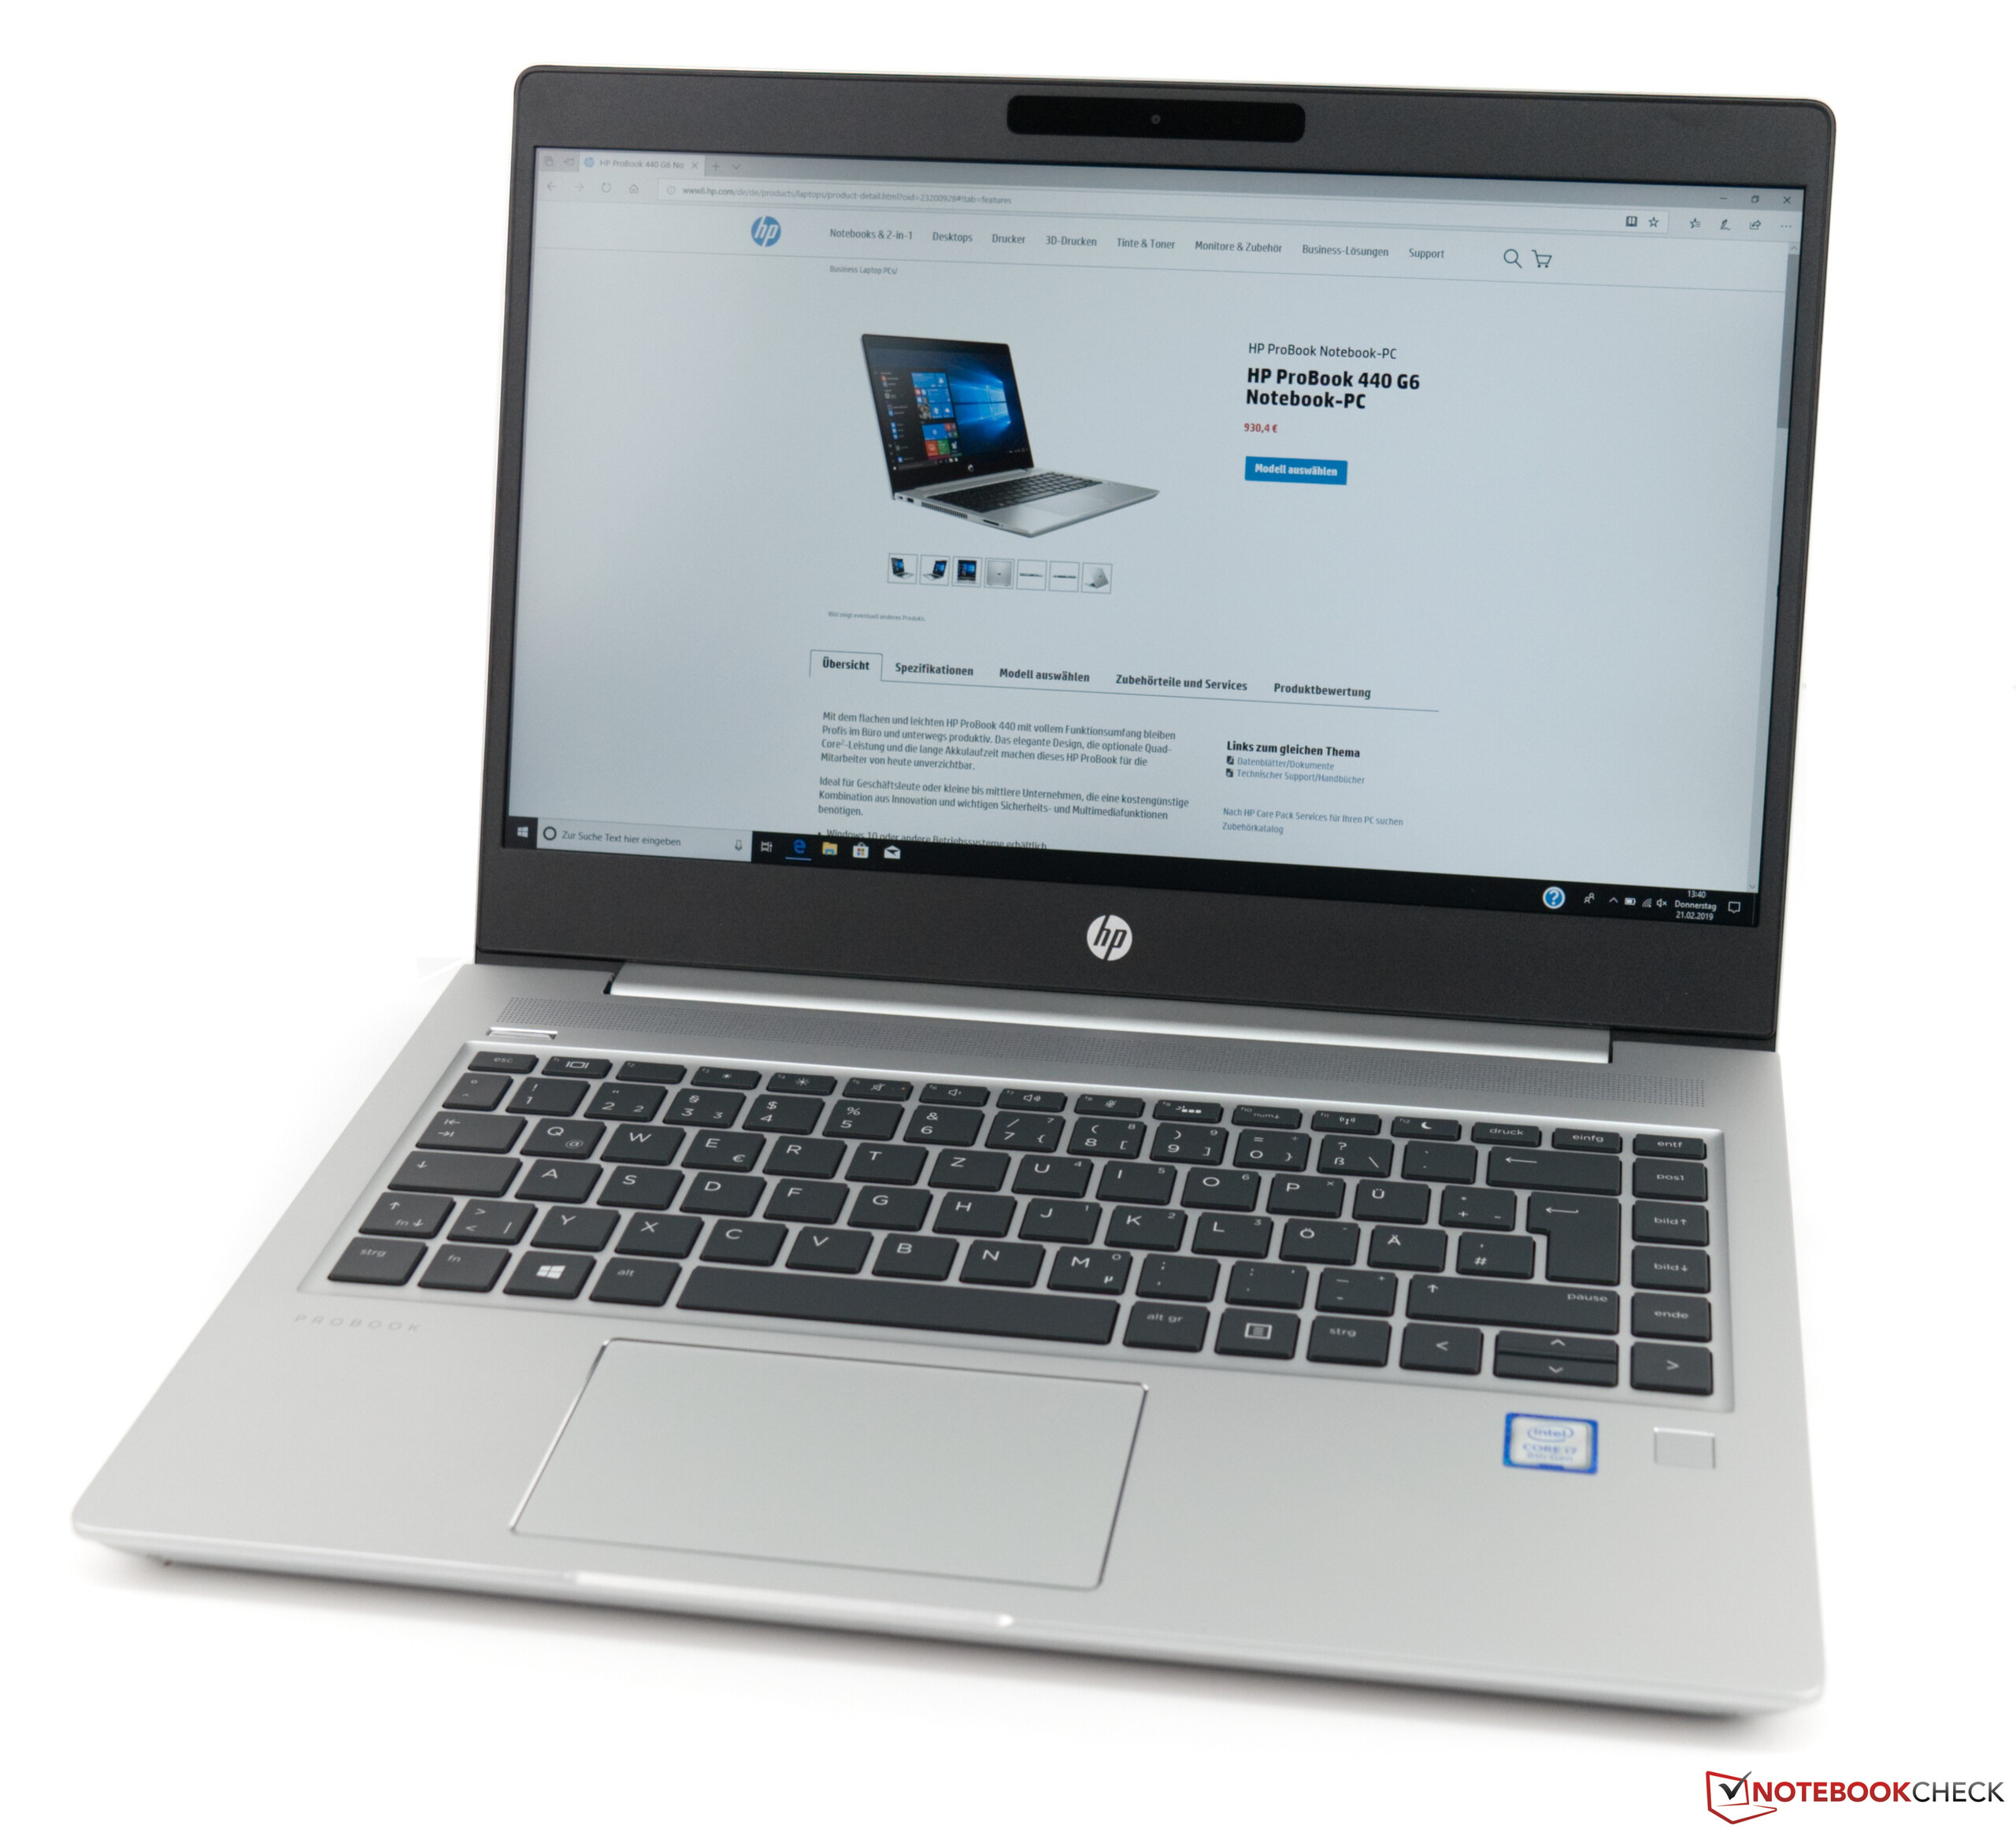
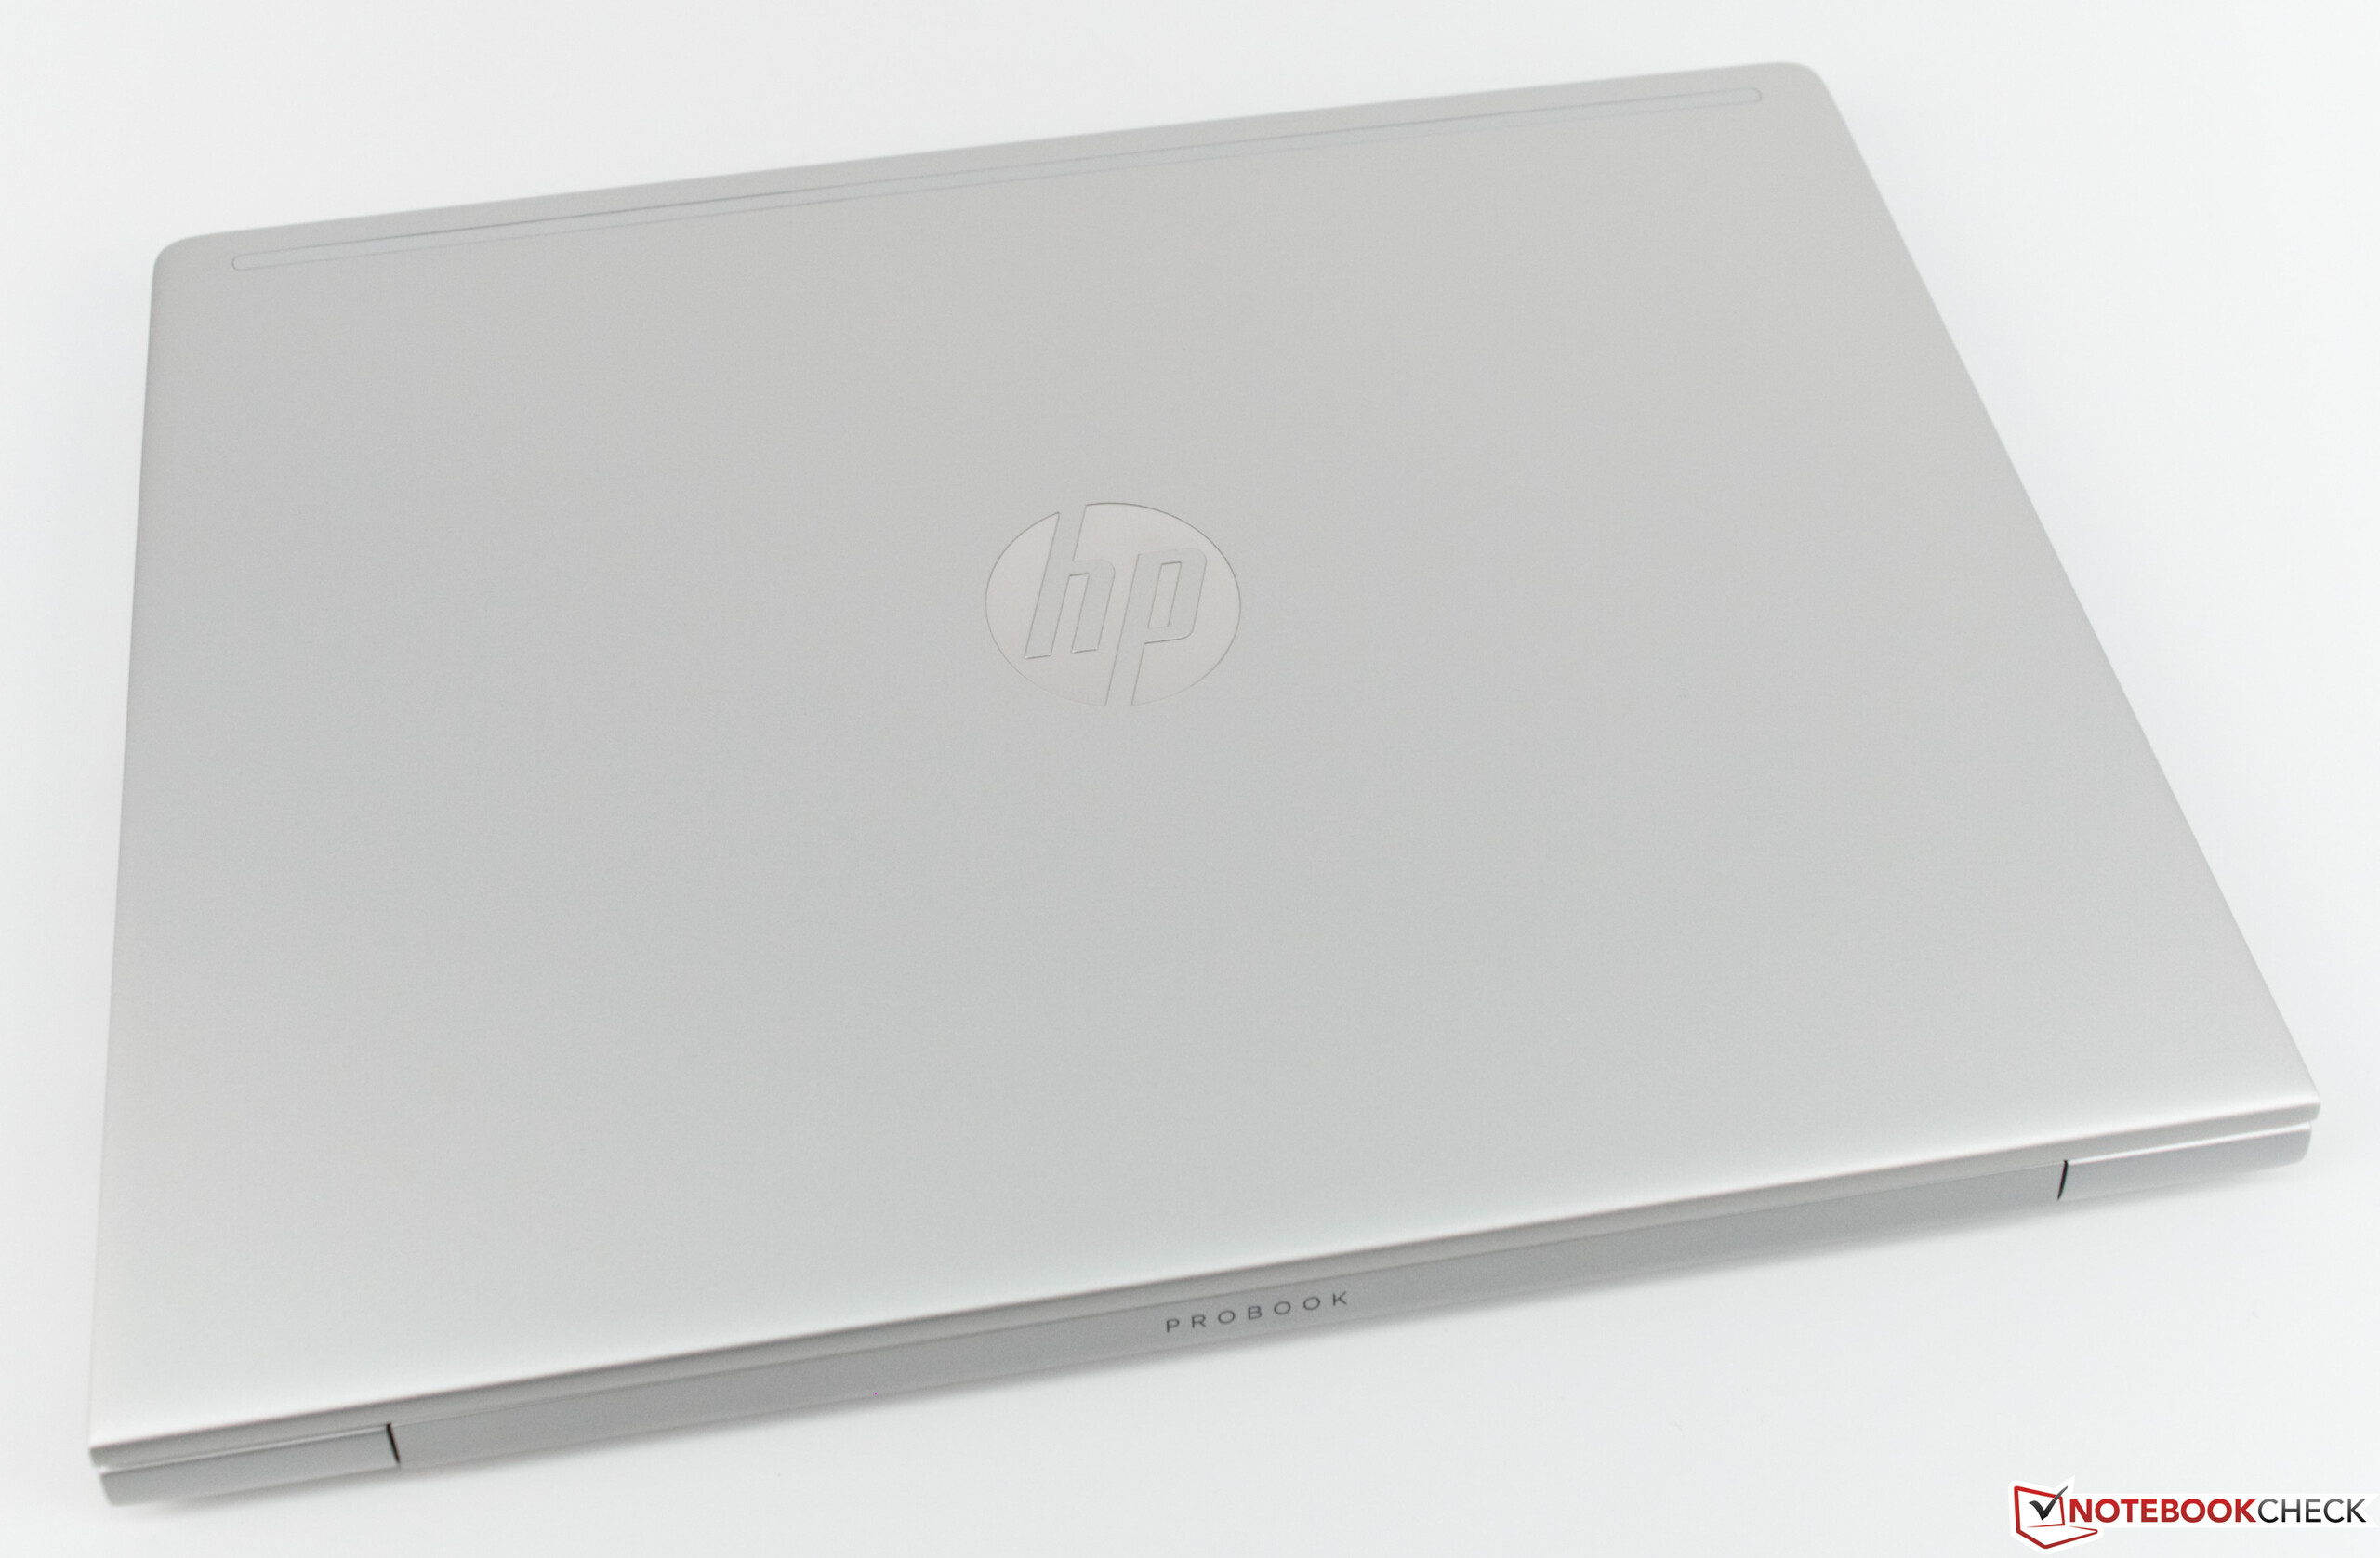
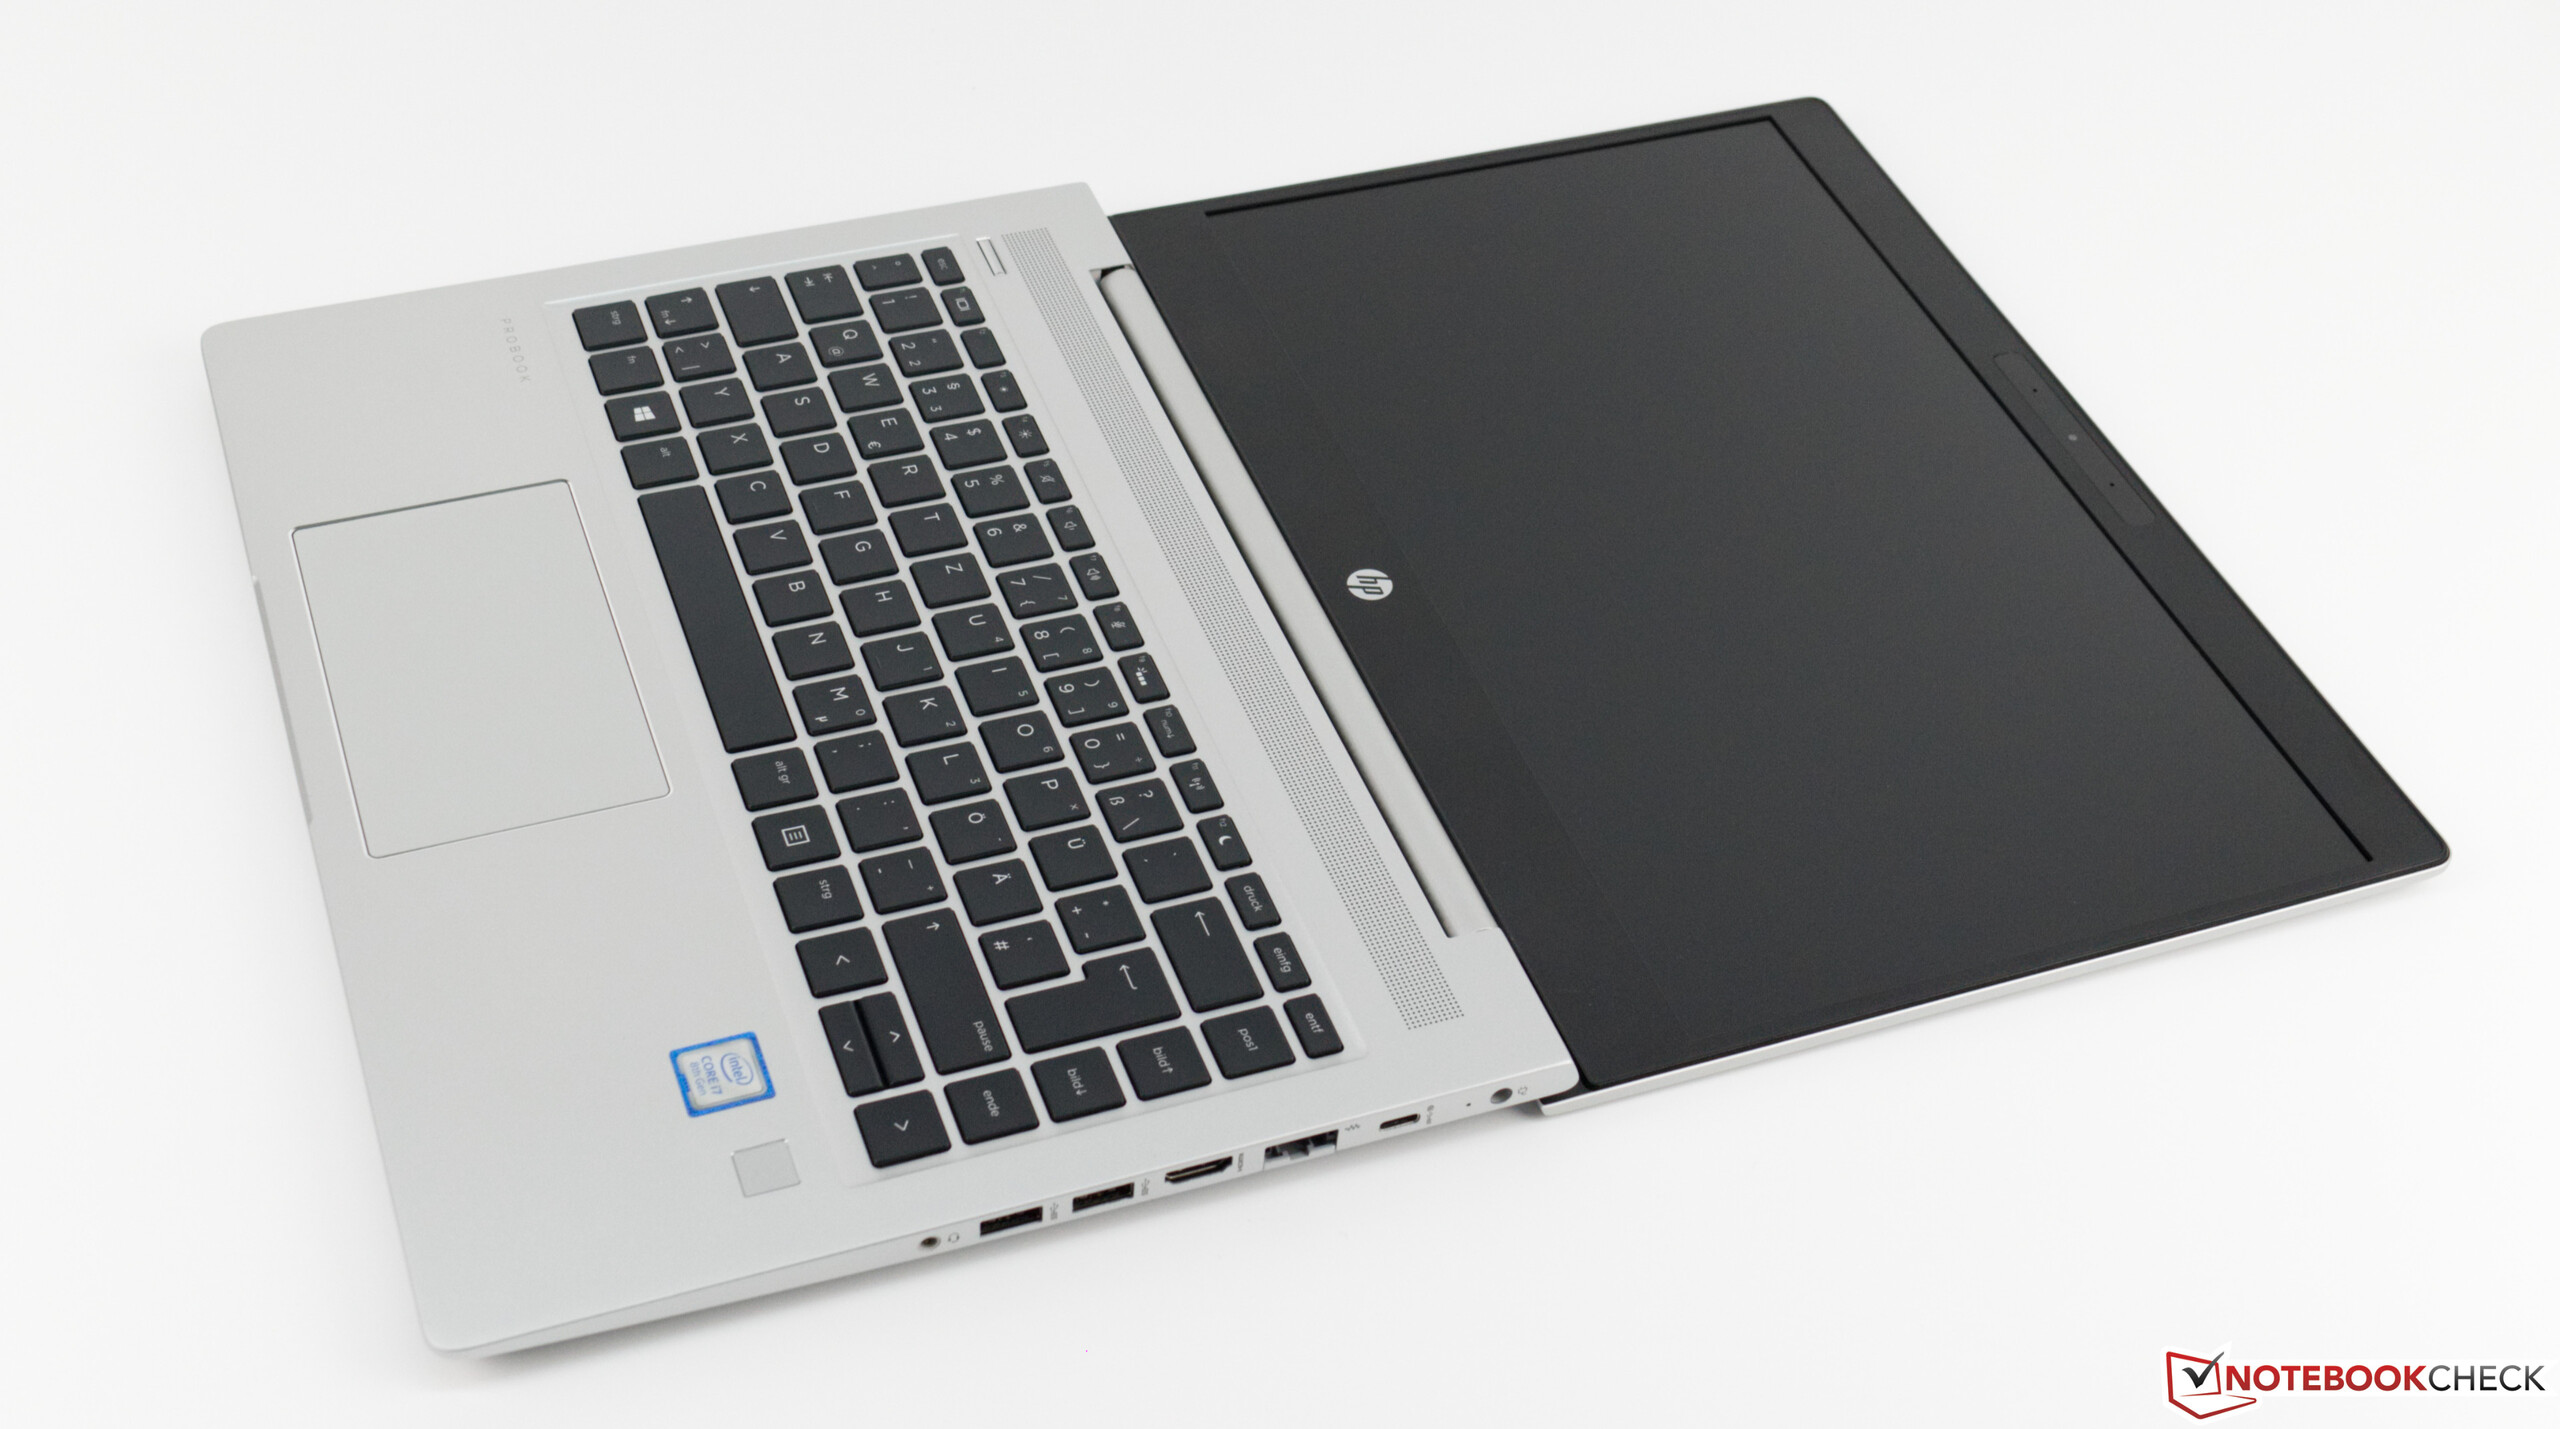
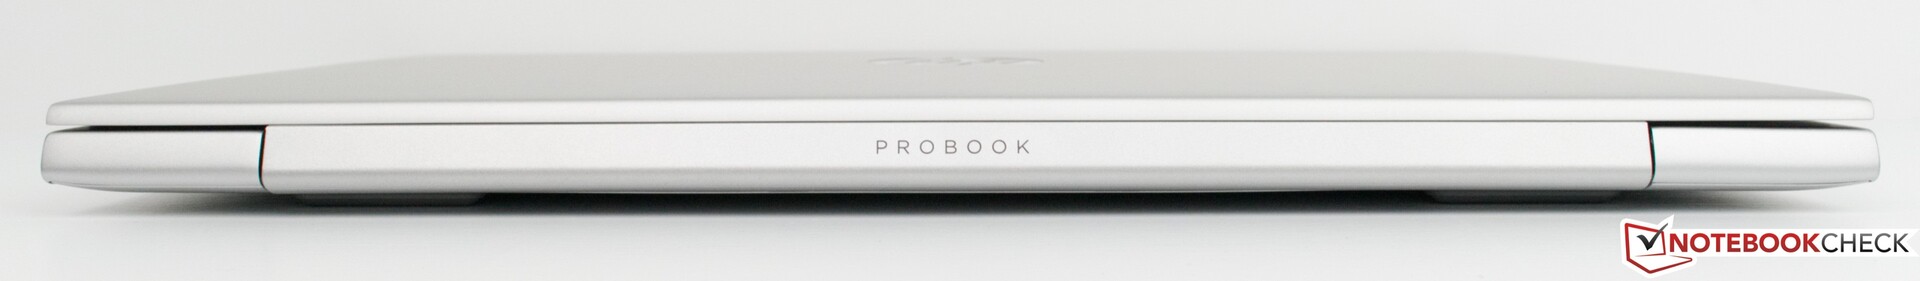
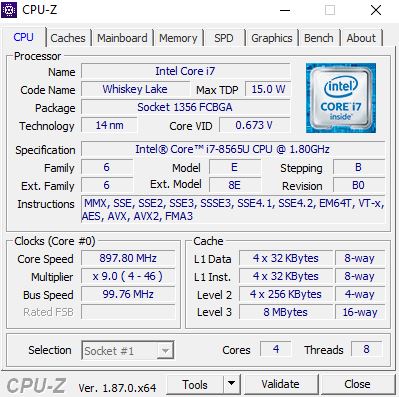
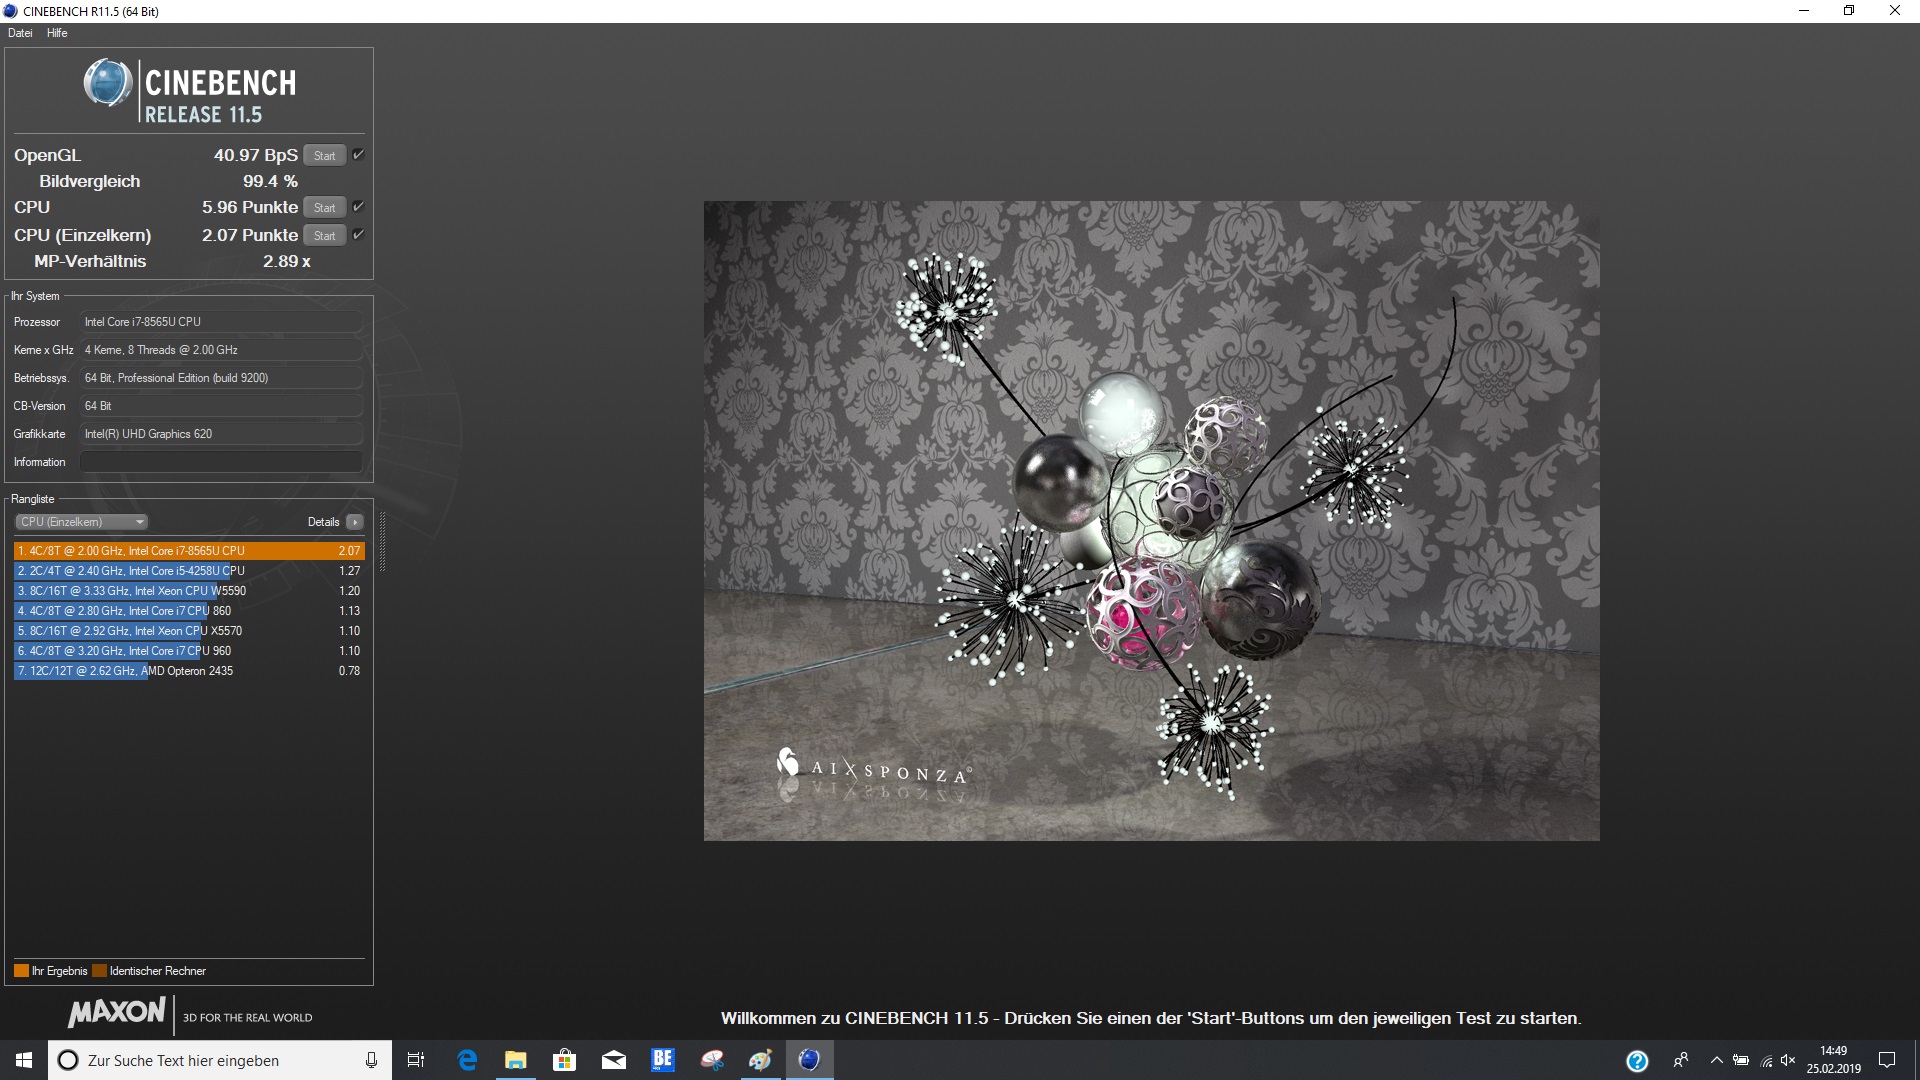
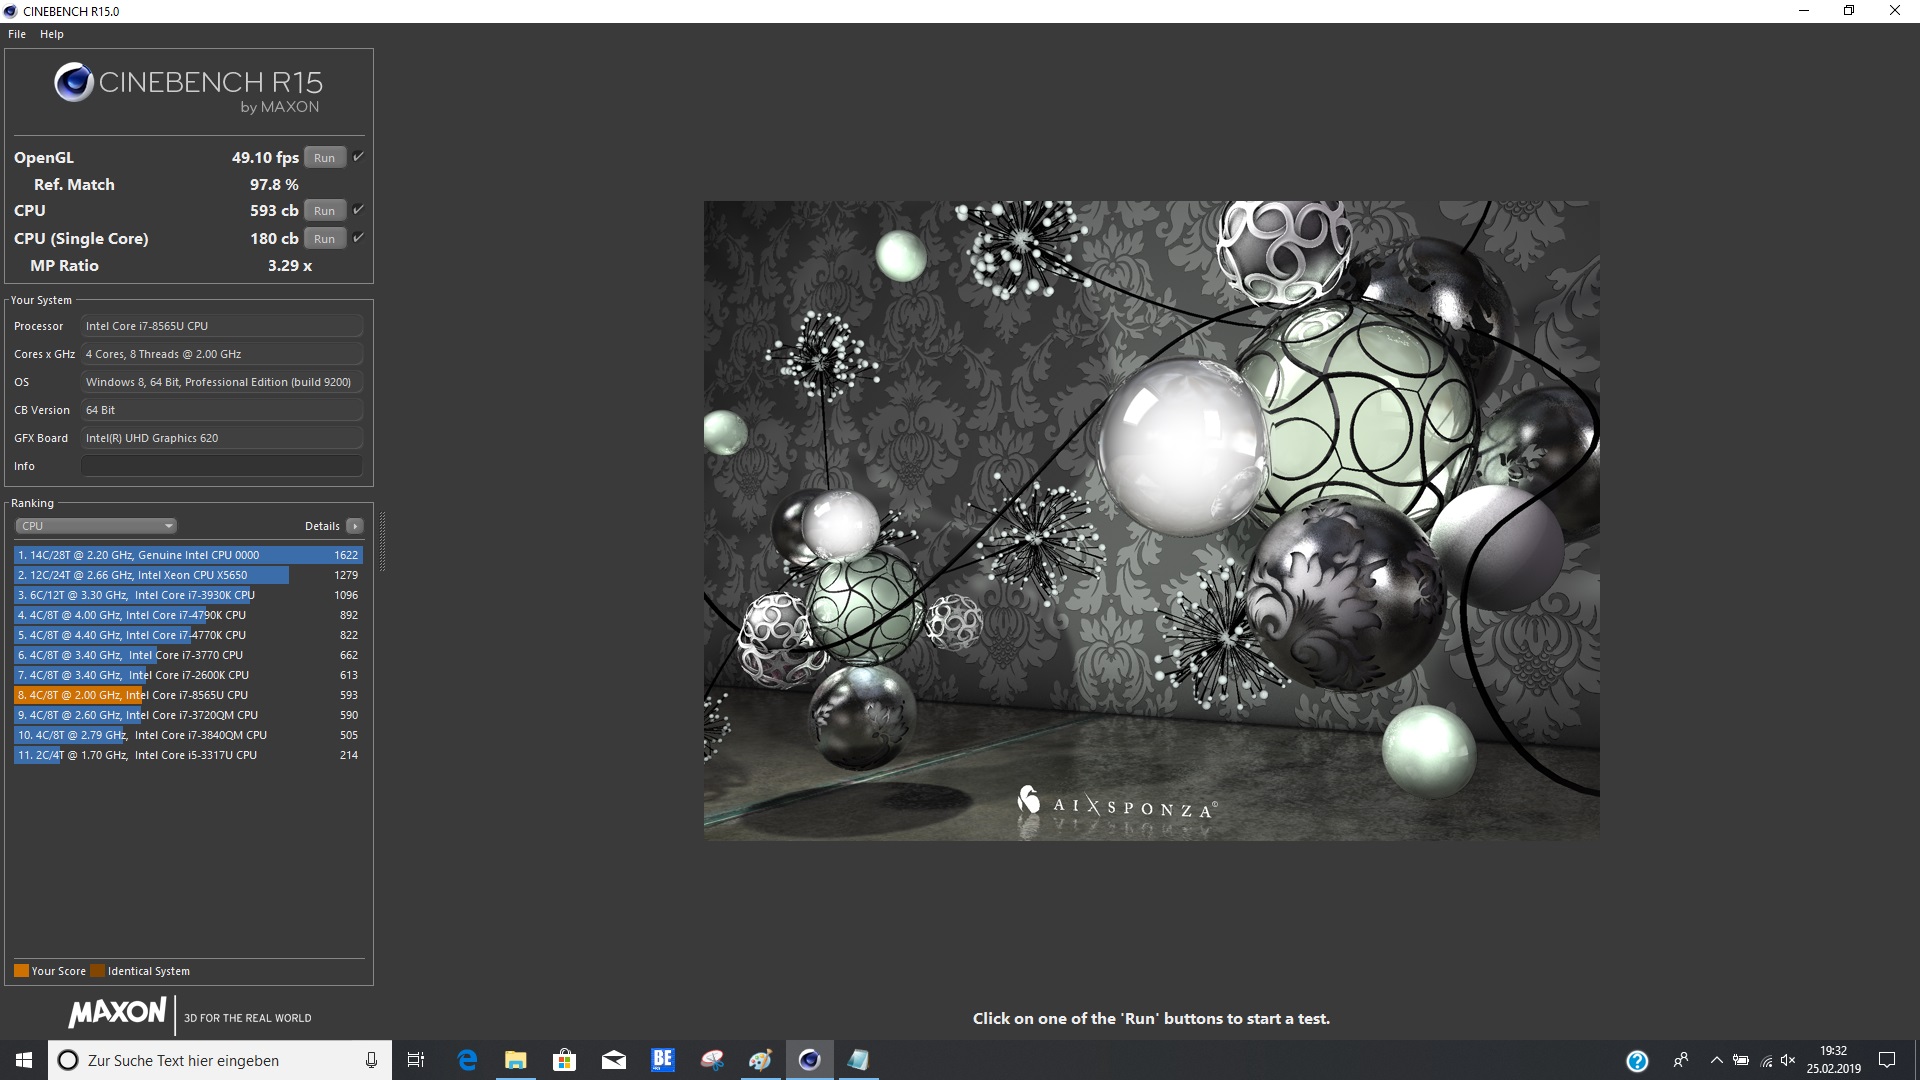
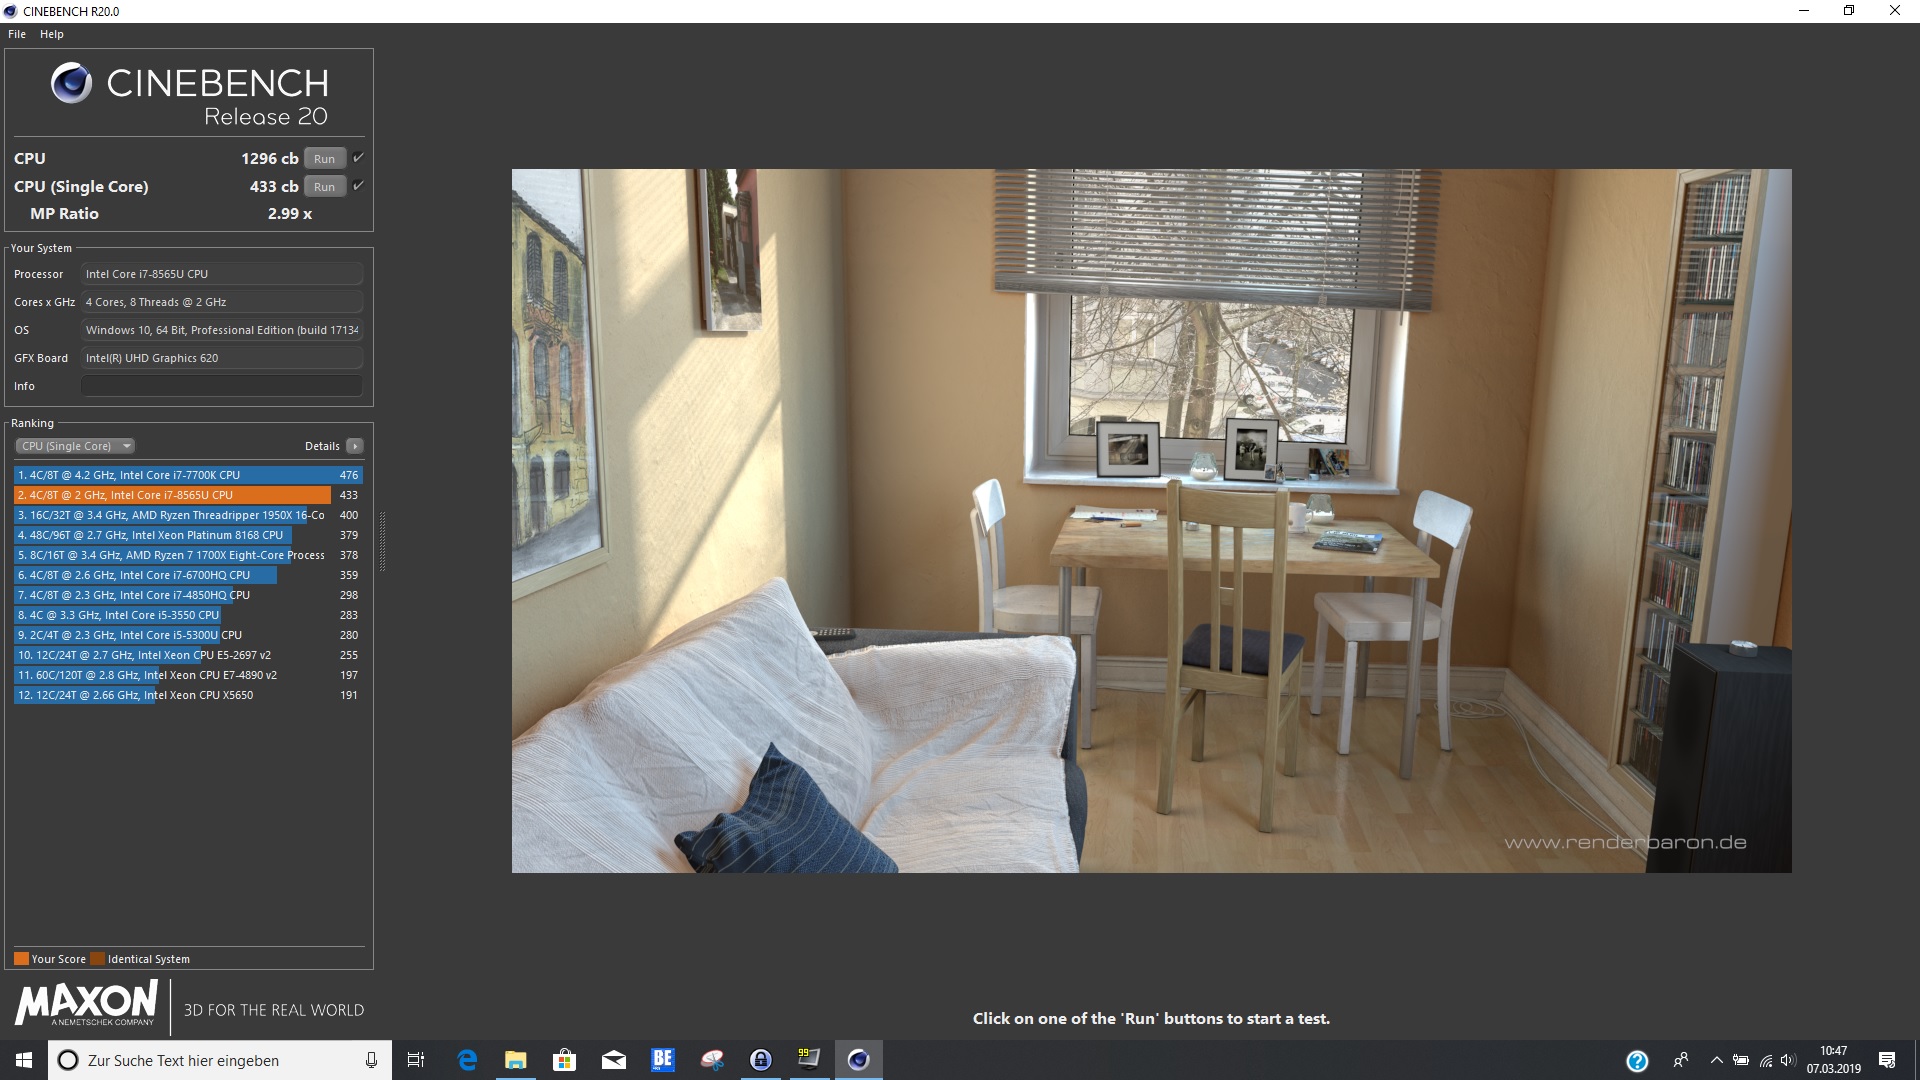
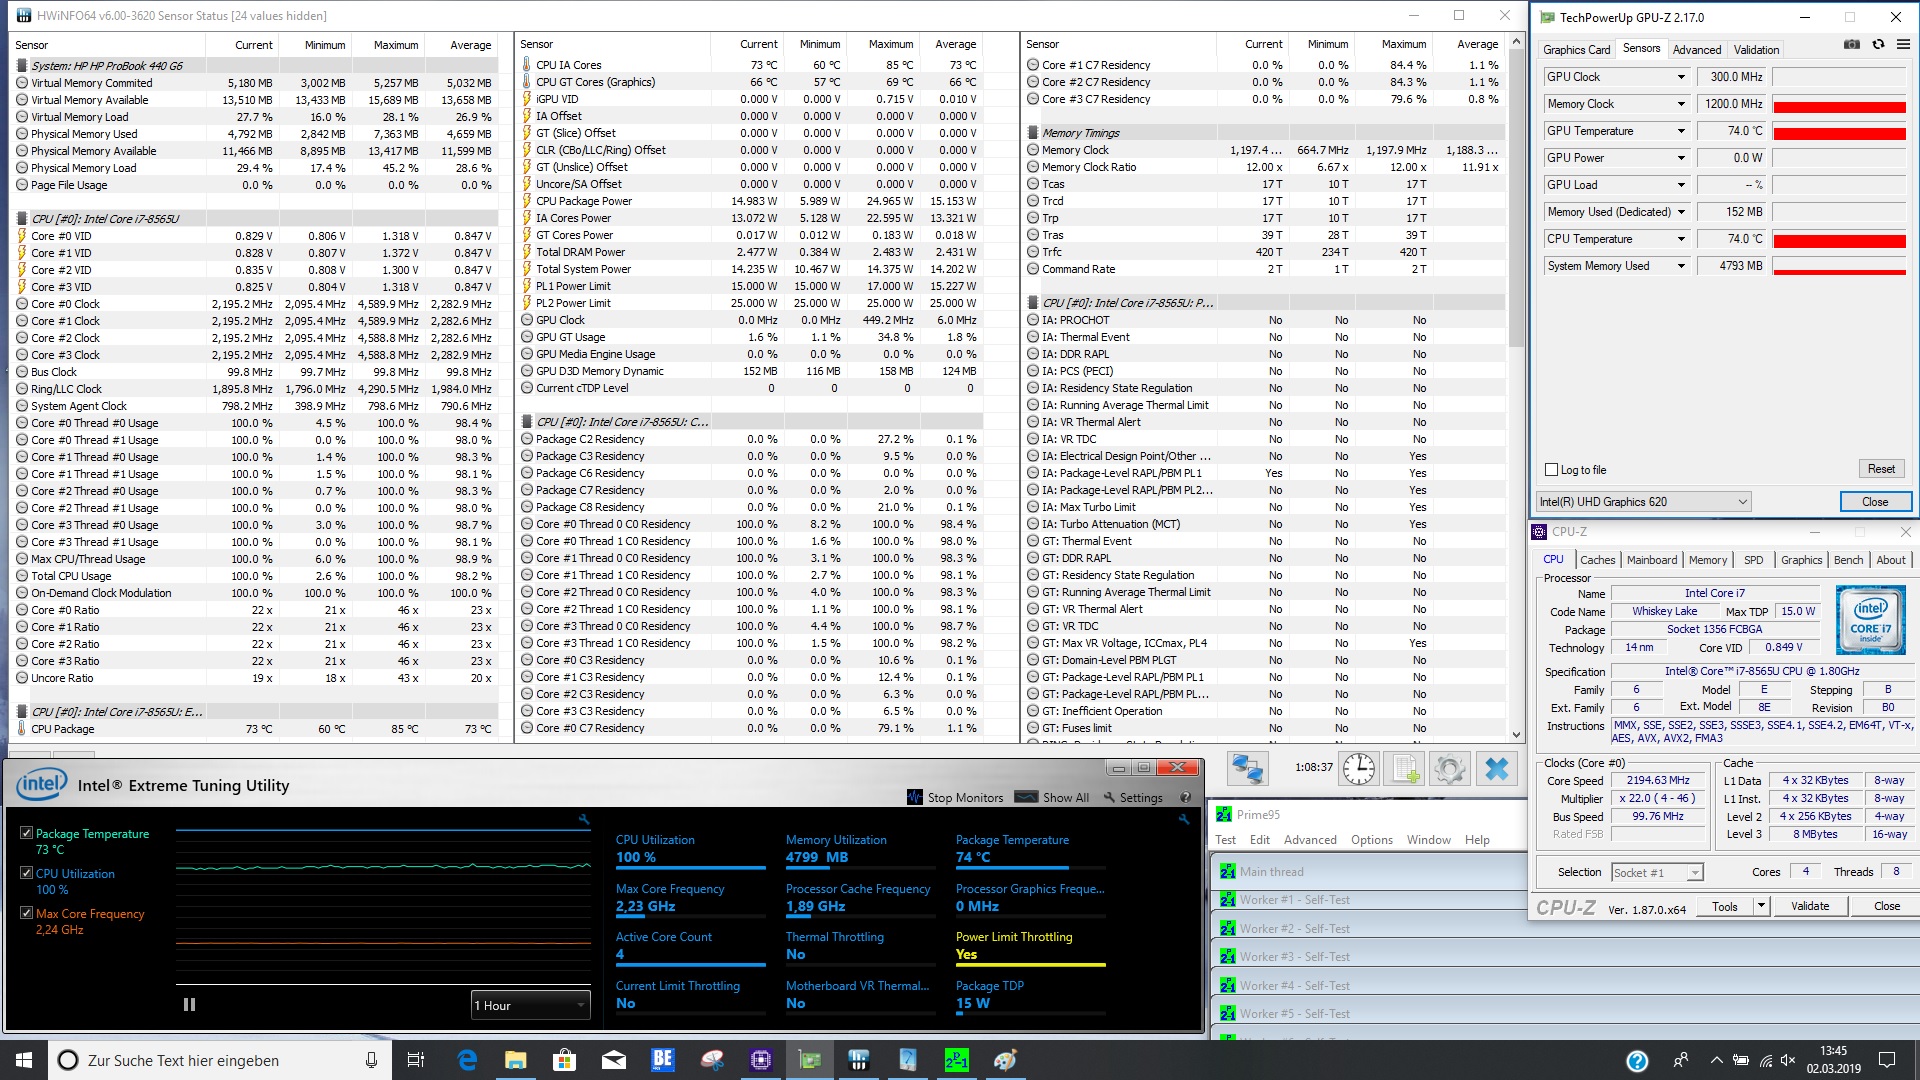
A HP reformulou a carcaça do ProBook 440 G6, tornando-o mais fino e fornecendo uma aparência mais moderna. O fabricante fez uma boa escolha do material com o acabamento em alumínio, dando ao dispositivo uma aparência de alta qualidade. Mas não apenas a aparência do dispositivo foi atualizada; os componentes da HP também foram atualizados, com os processadores mais recentes da Intel - embora não estivéssemos totalmente convencidos com os resultados do Cinebench R15 Multi loop Intel Core i7 2617M em nossa unidade de teste. Ainda assim, o desempenho single-thread foi muito bom, assim como o desempenho geral do sistema com a nossa unidade de testes da HP, alcançando o primeiro lugar na nossa tabela de comparação.
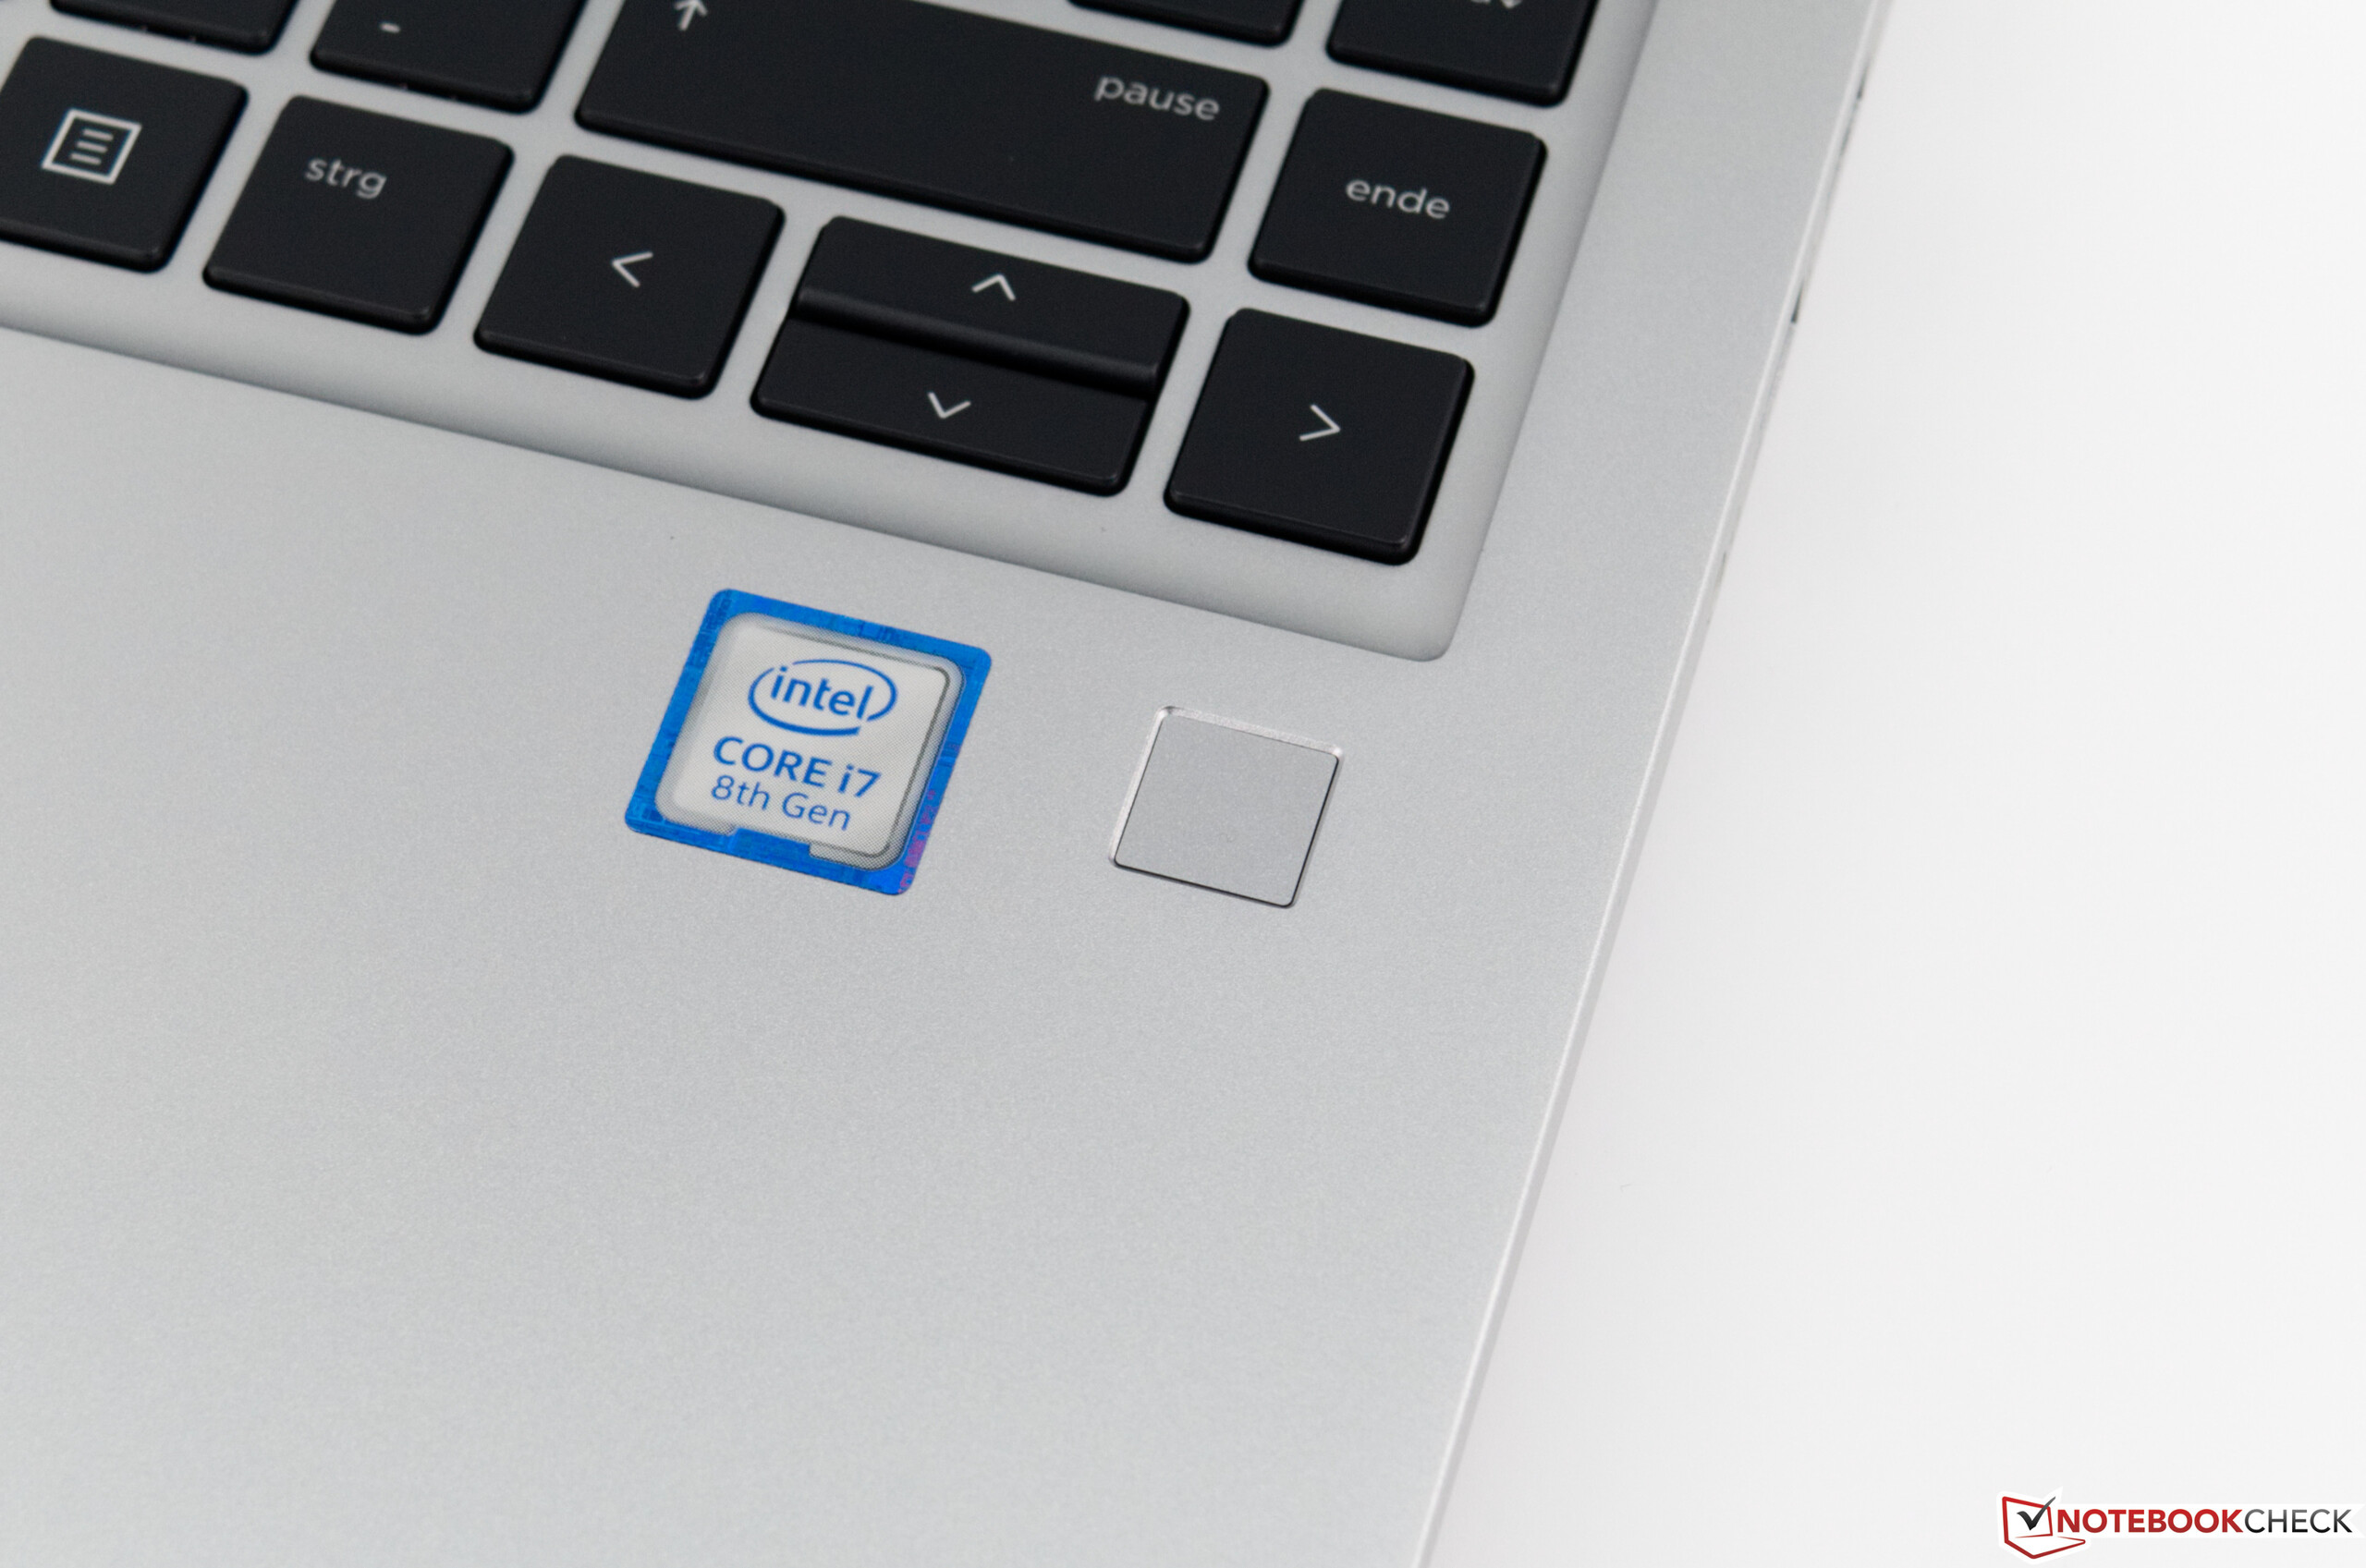
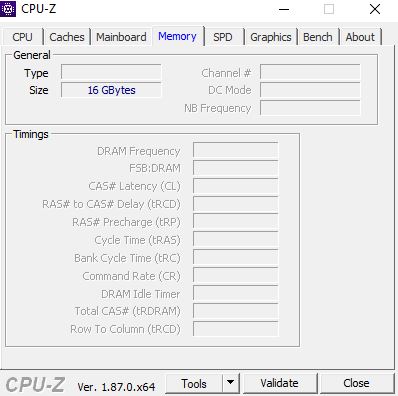
O HP ProBook 440 G6 está disponível por cerca de $1300 em nossa configuração de teste. Isso inclui um processador Core i7, 16 GB de RAM e um SSD de 512 GB. Agradecemos a consideração na escolha da tela, mas não é suficiente para um dispositivo nesta faixa de preço. Um painel IPS mate não faz nada se for acompanhado por uma cobertura de espaço de cor inferior e uma turvação significativa.
A HP está no caminho certo com o seu ProBook 440 G6. No entanto, o dispositivo terá dificuldades em encarar a forte concorrência de outros fabricantes.
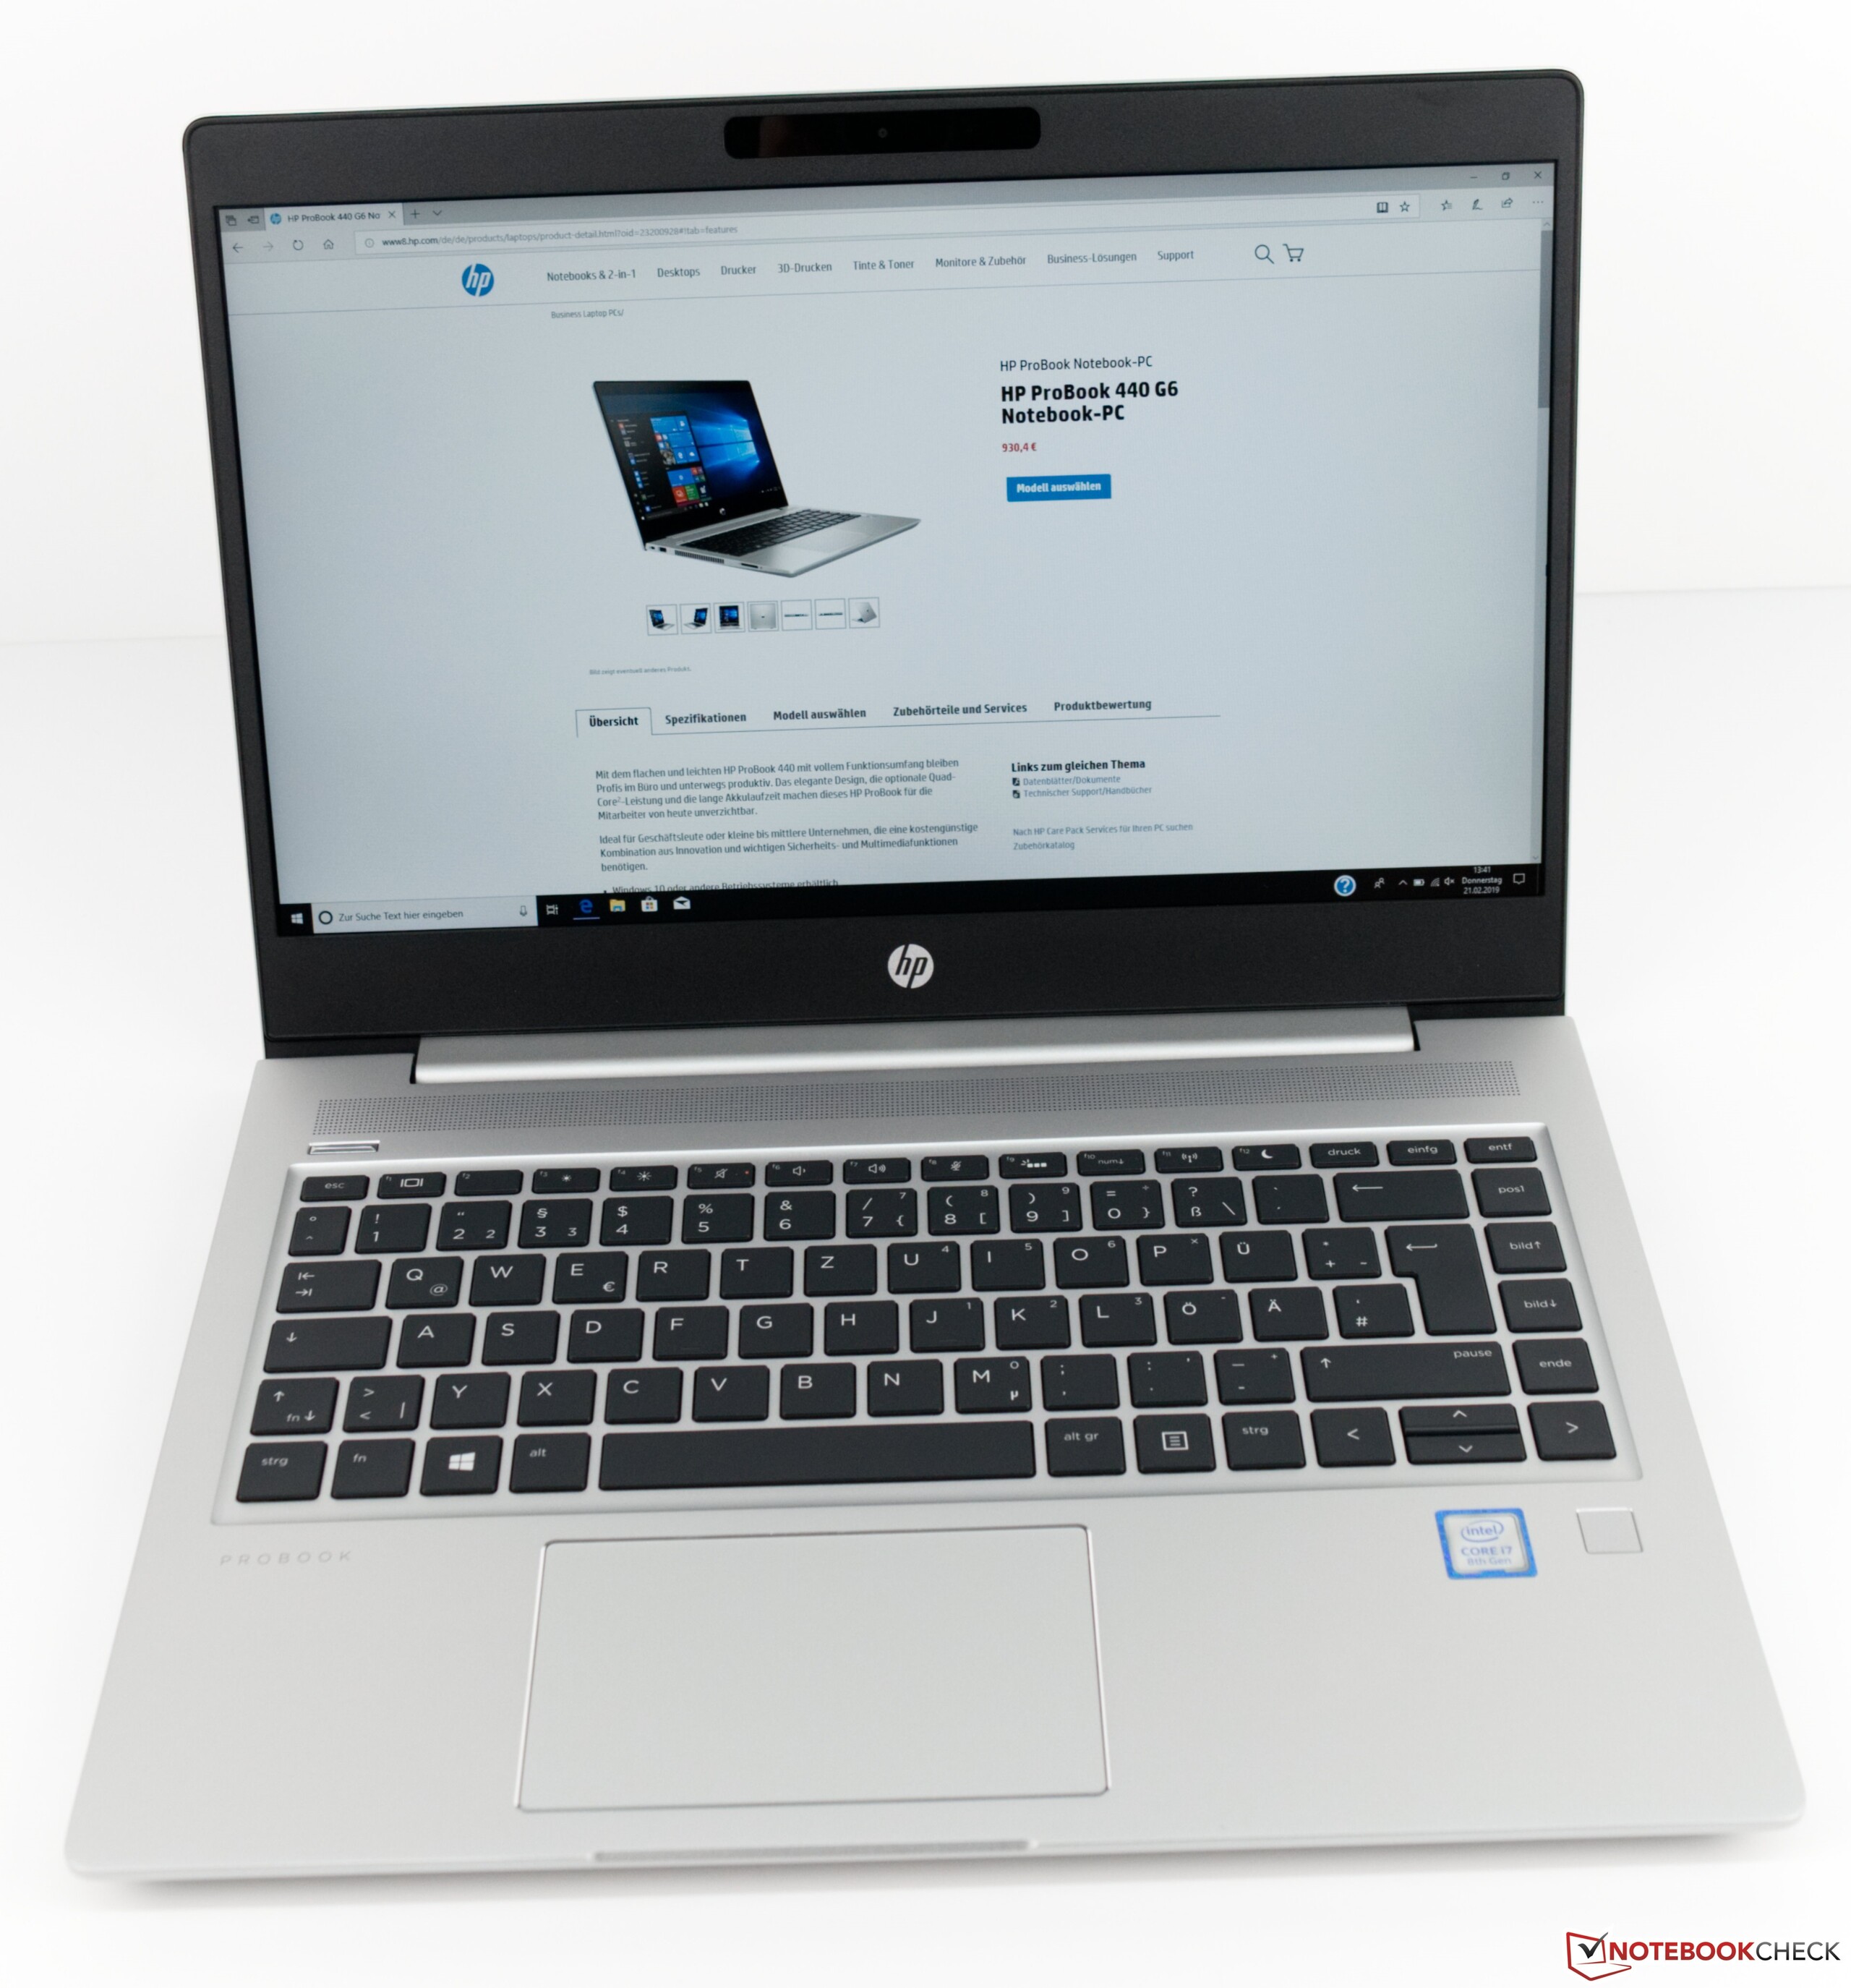
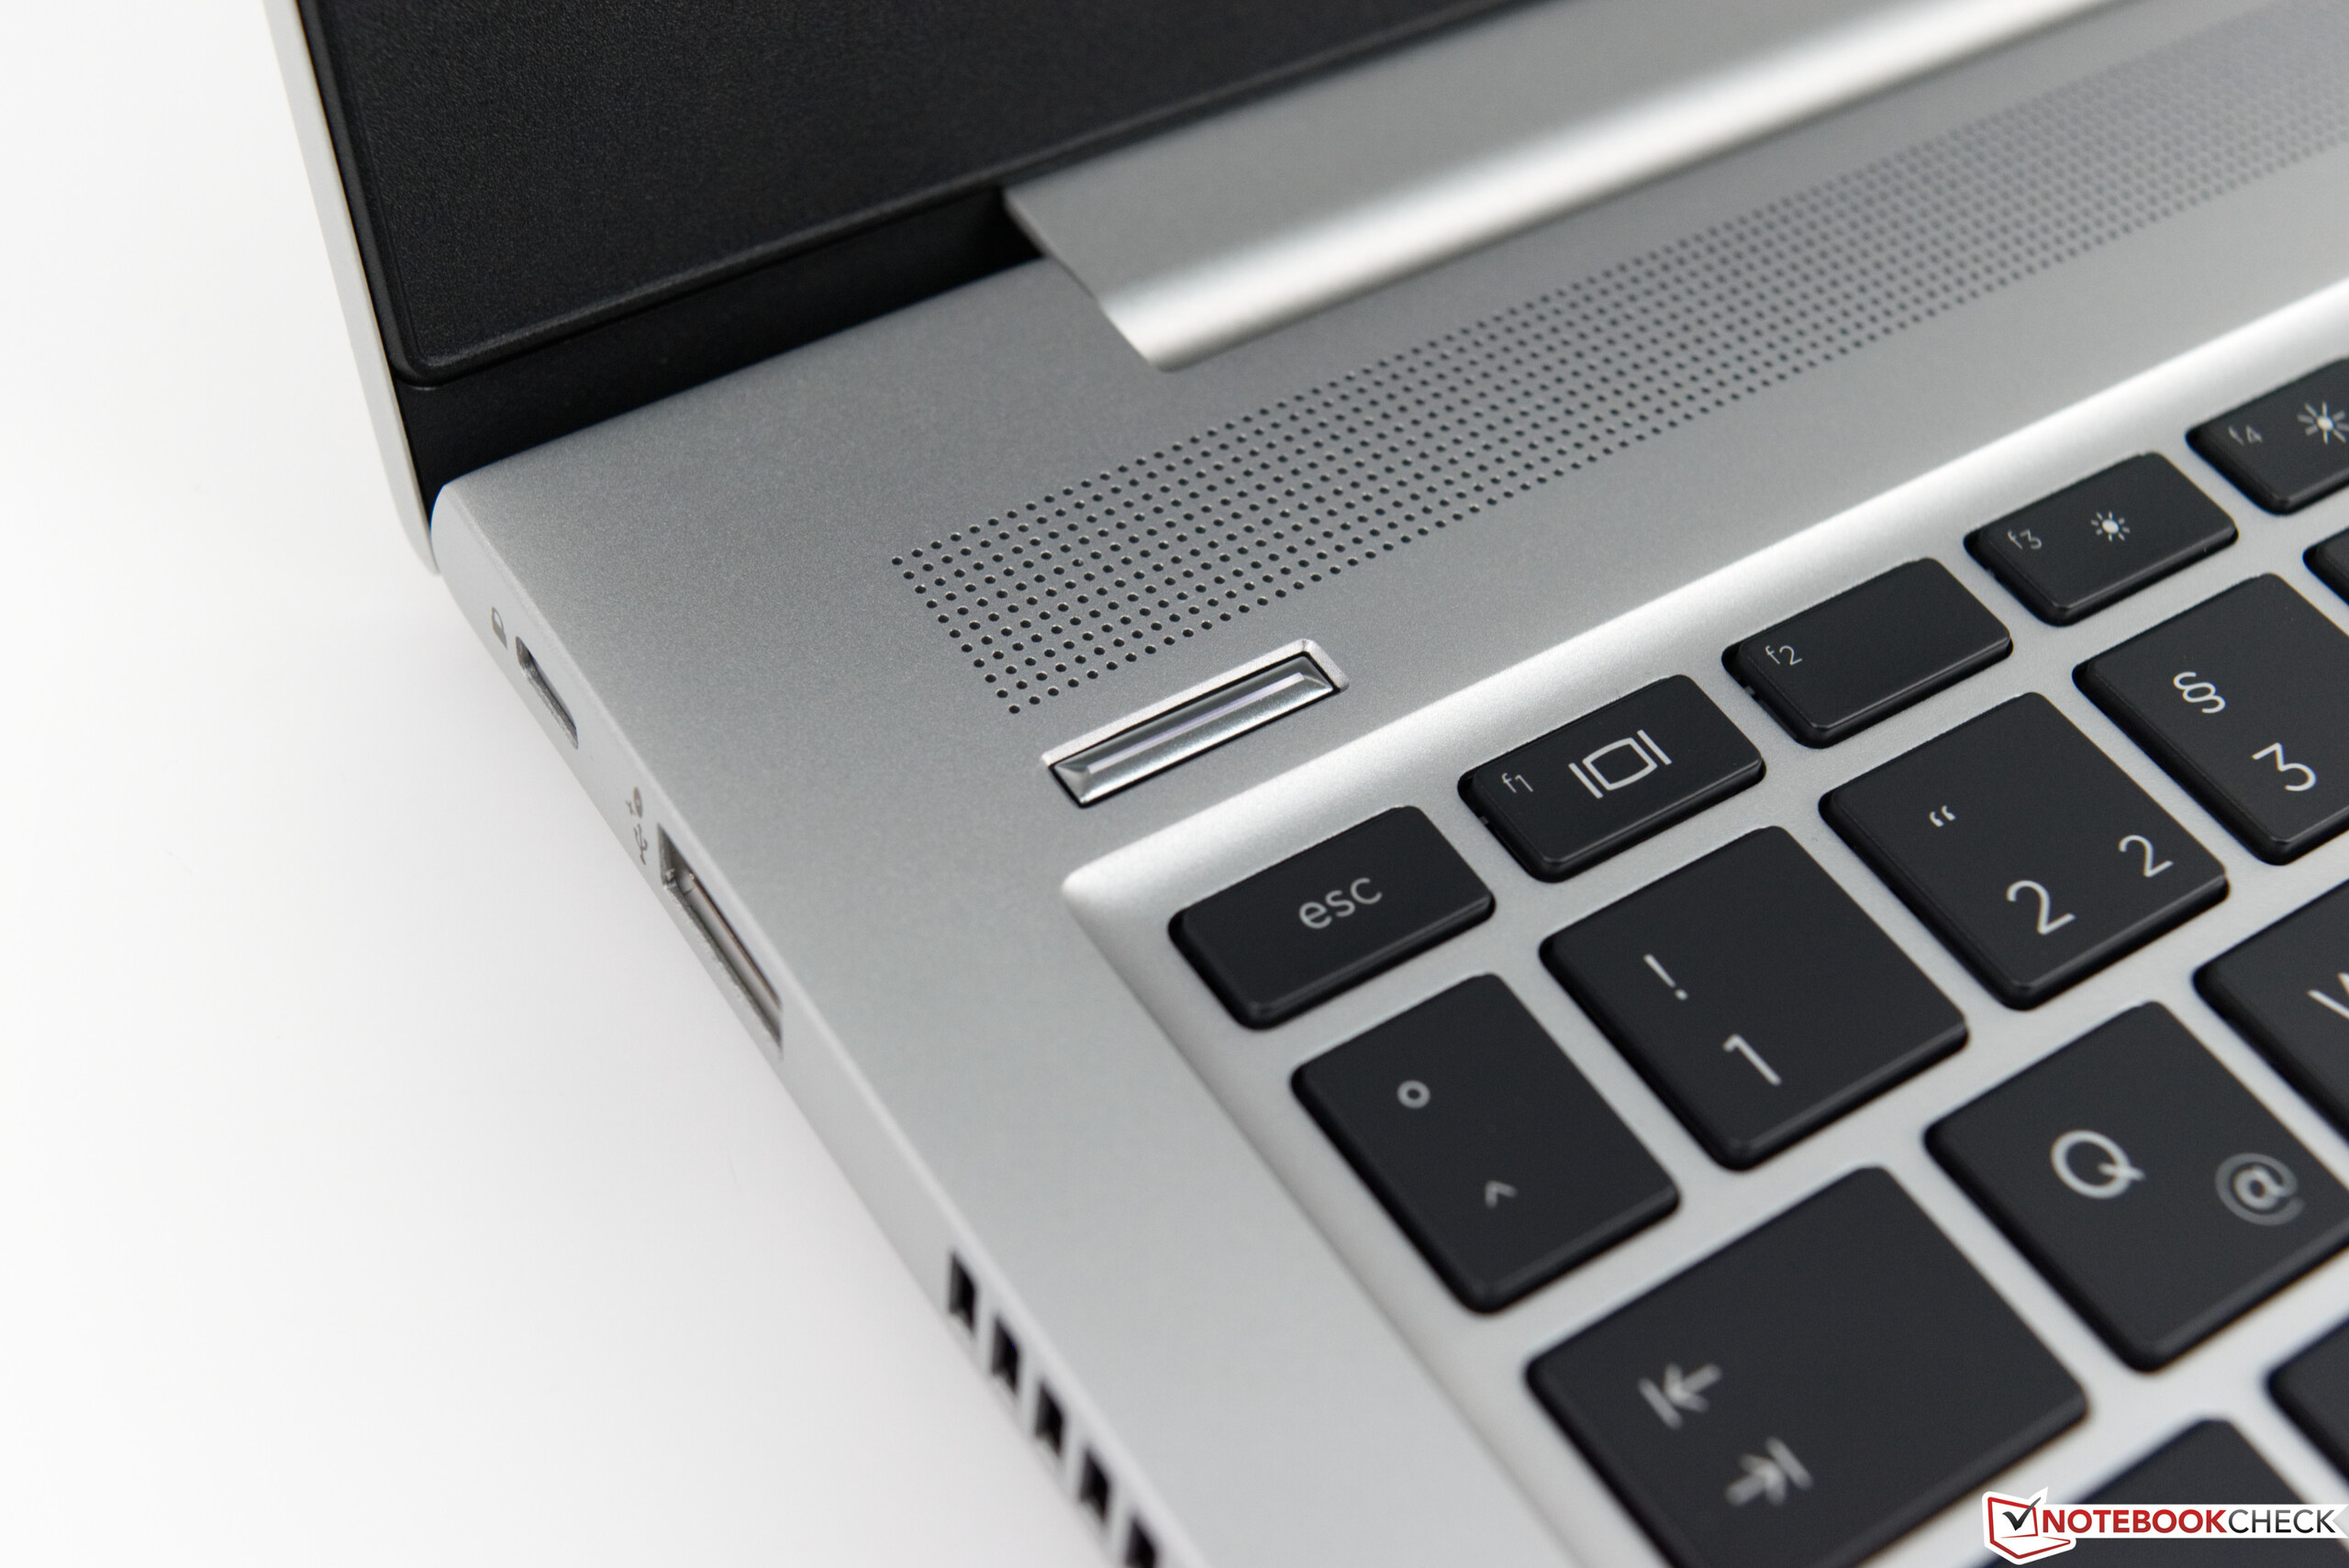
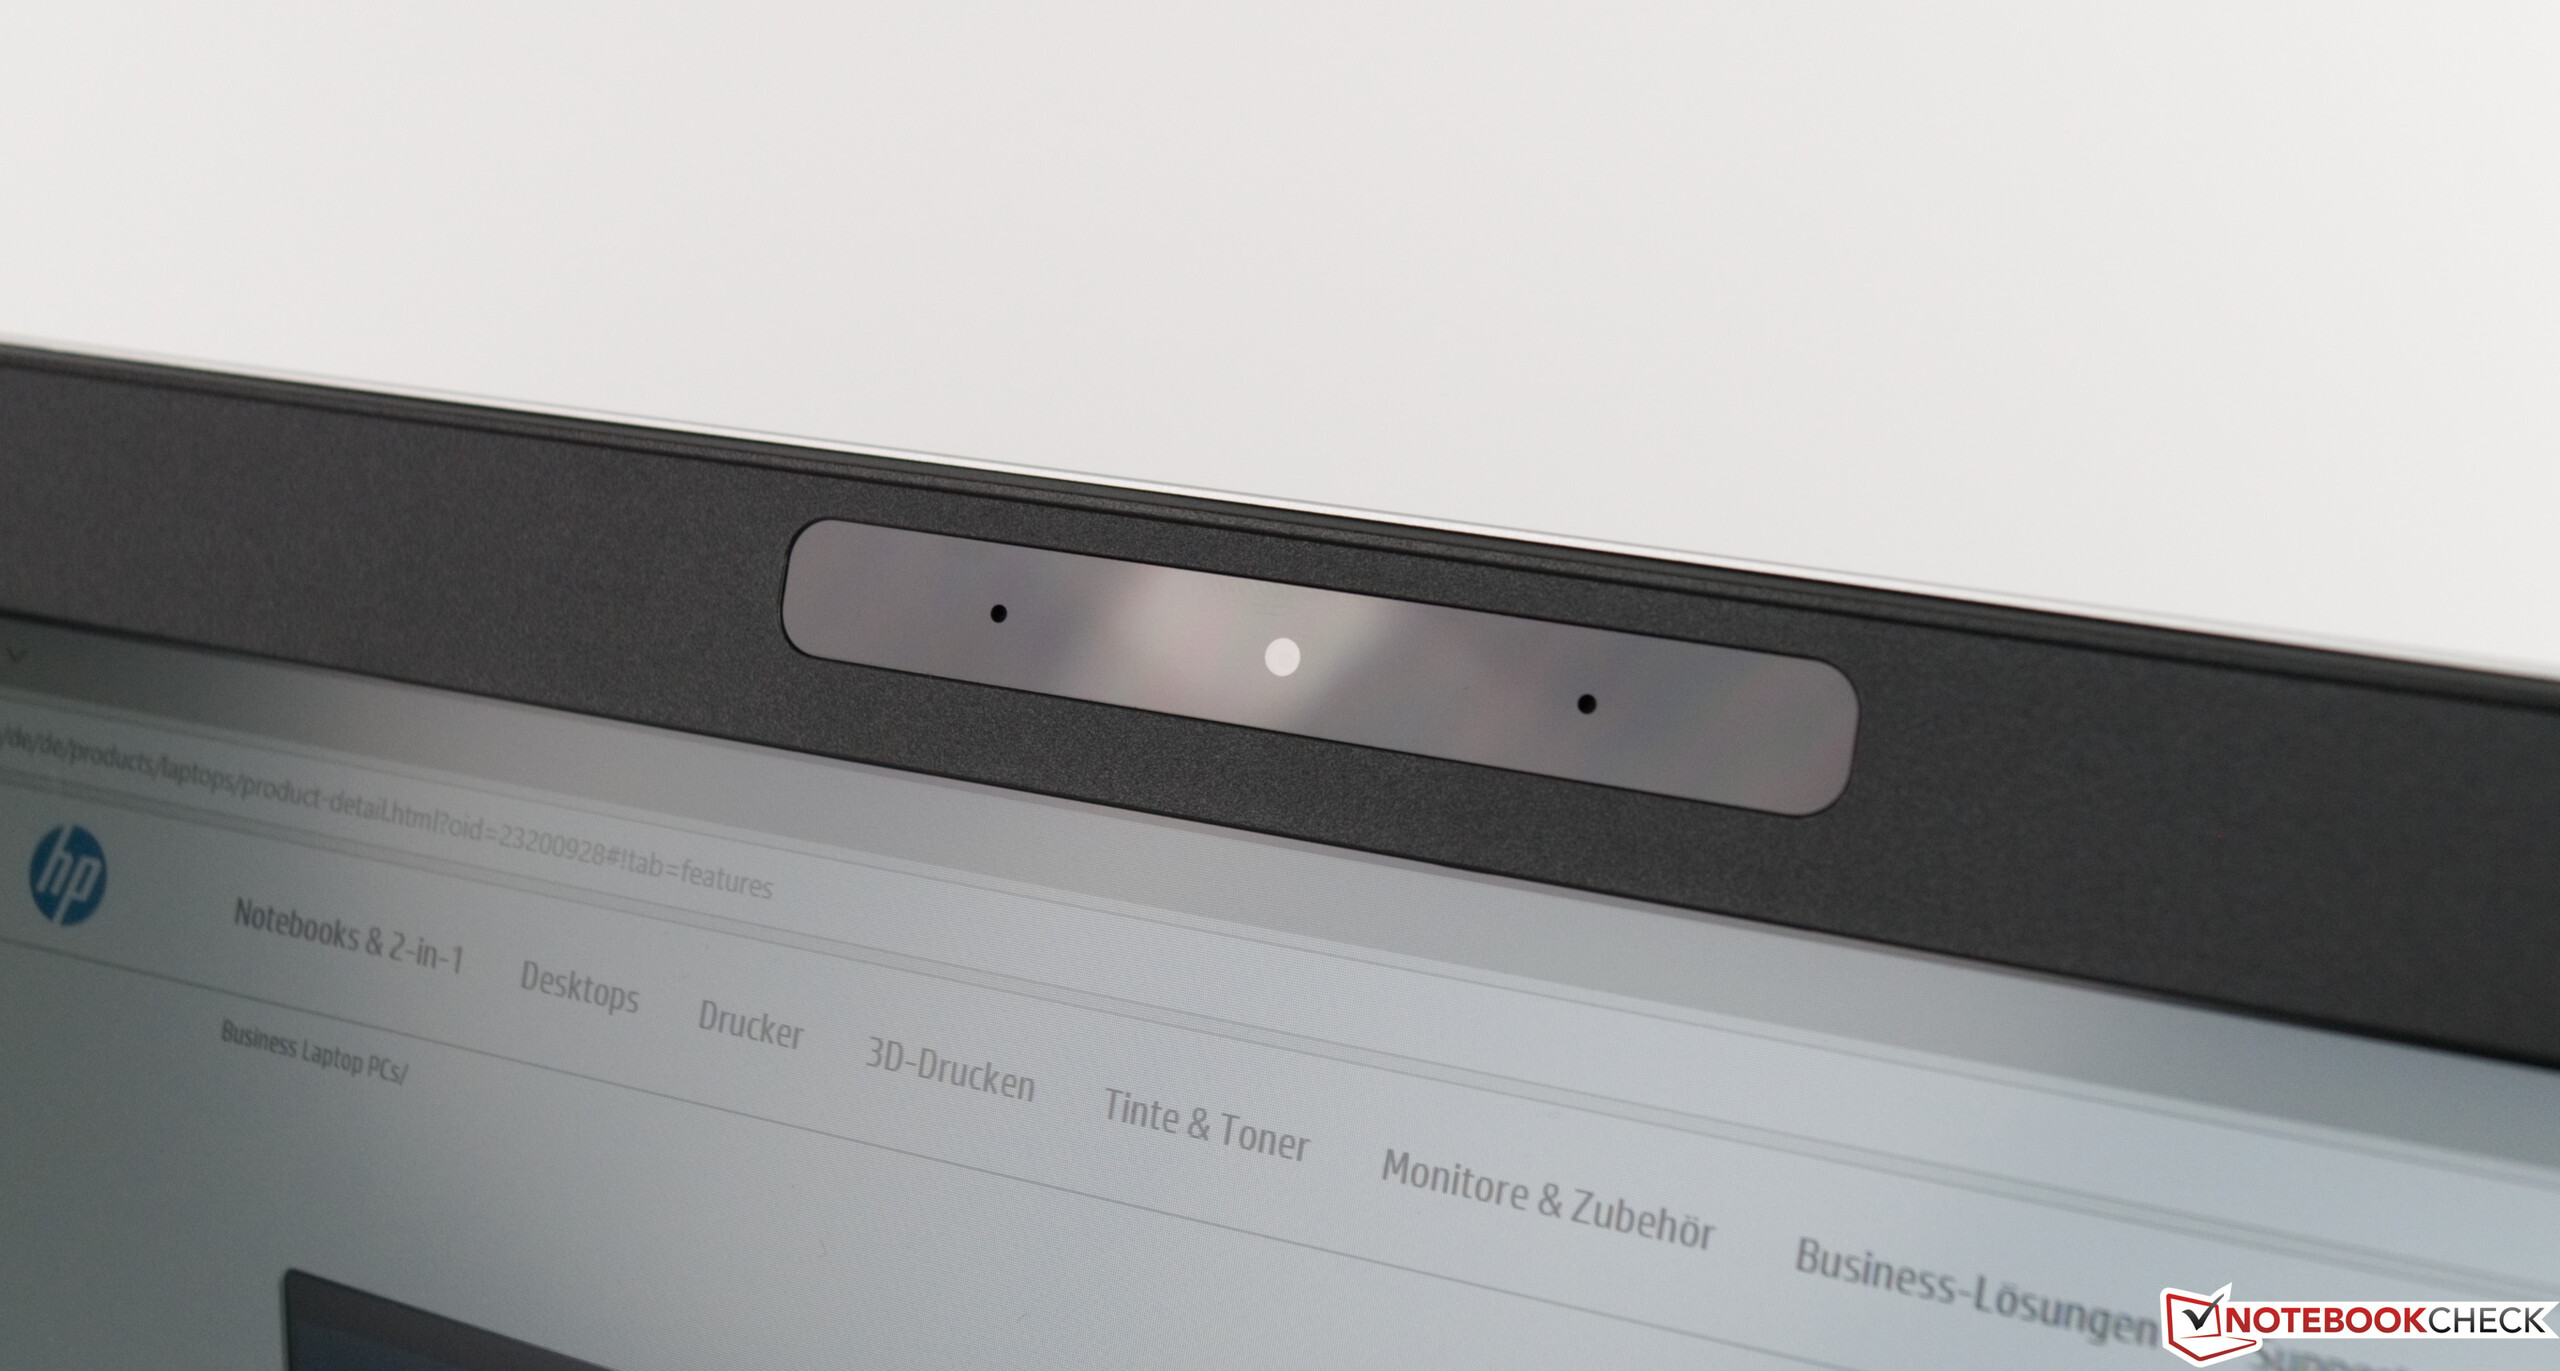
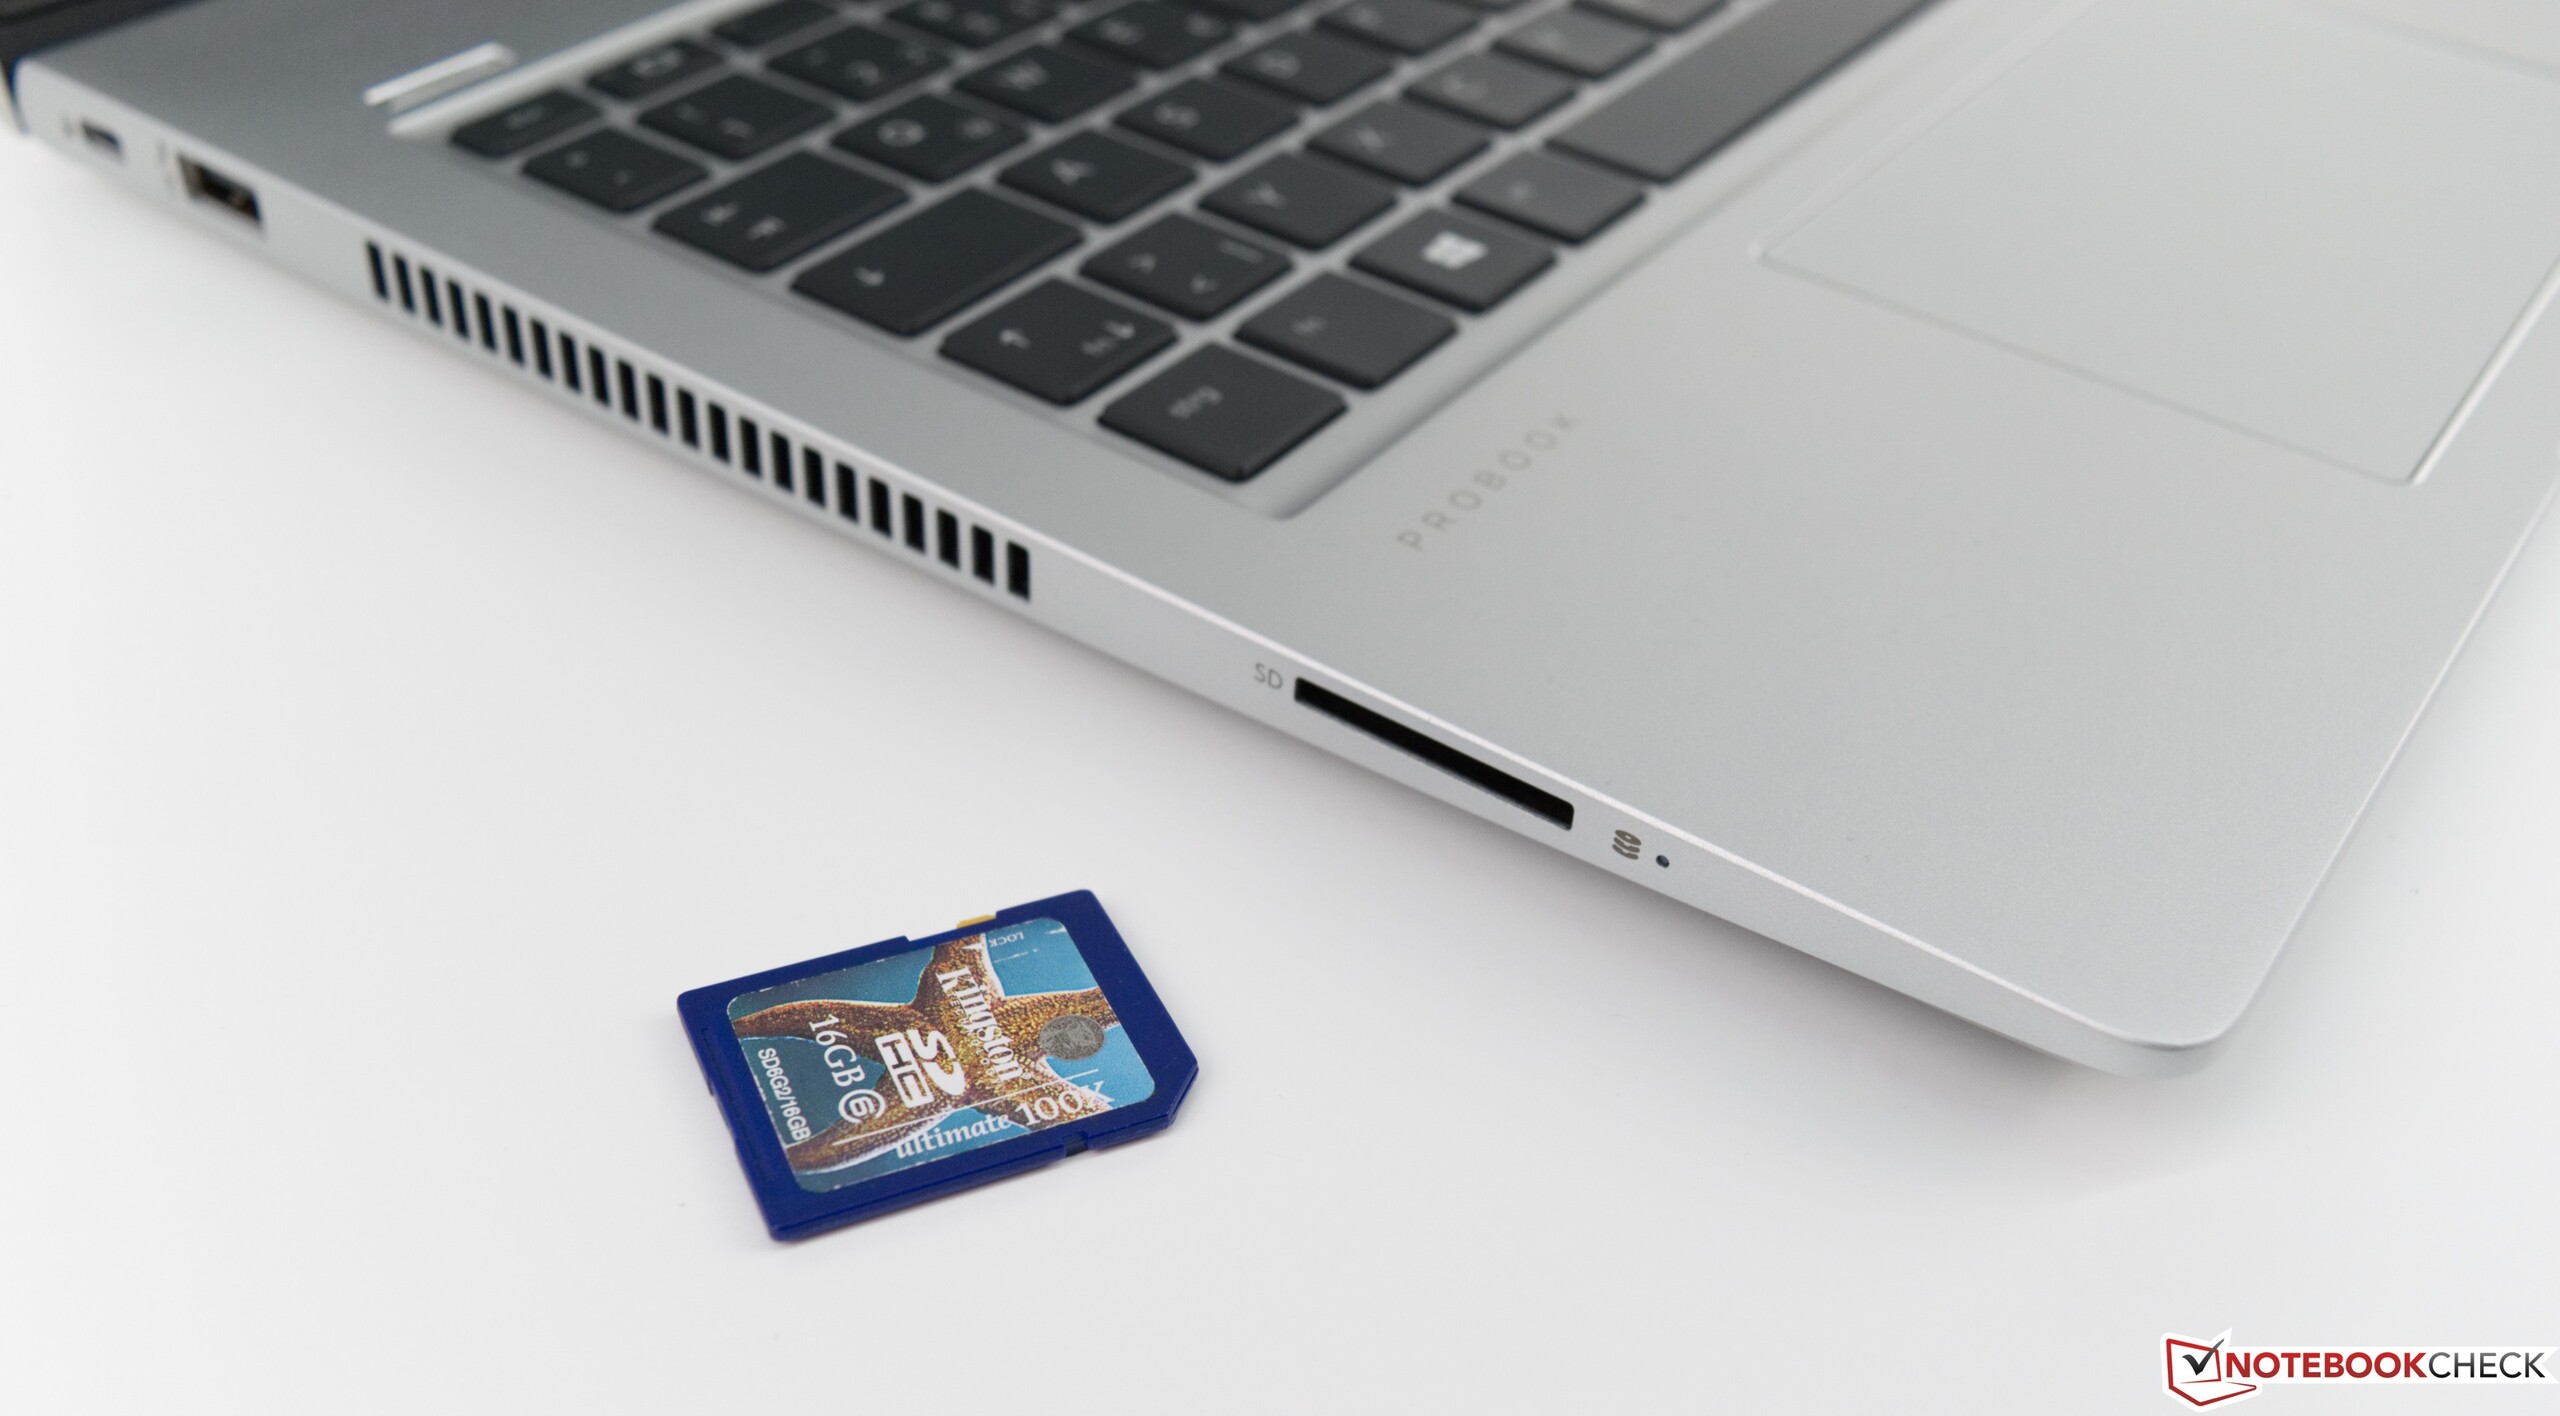
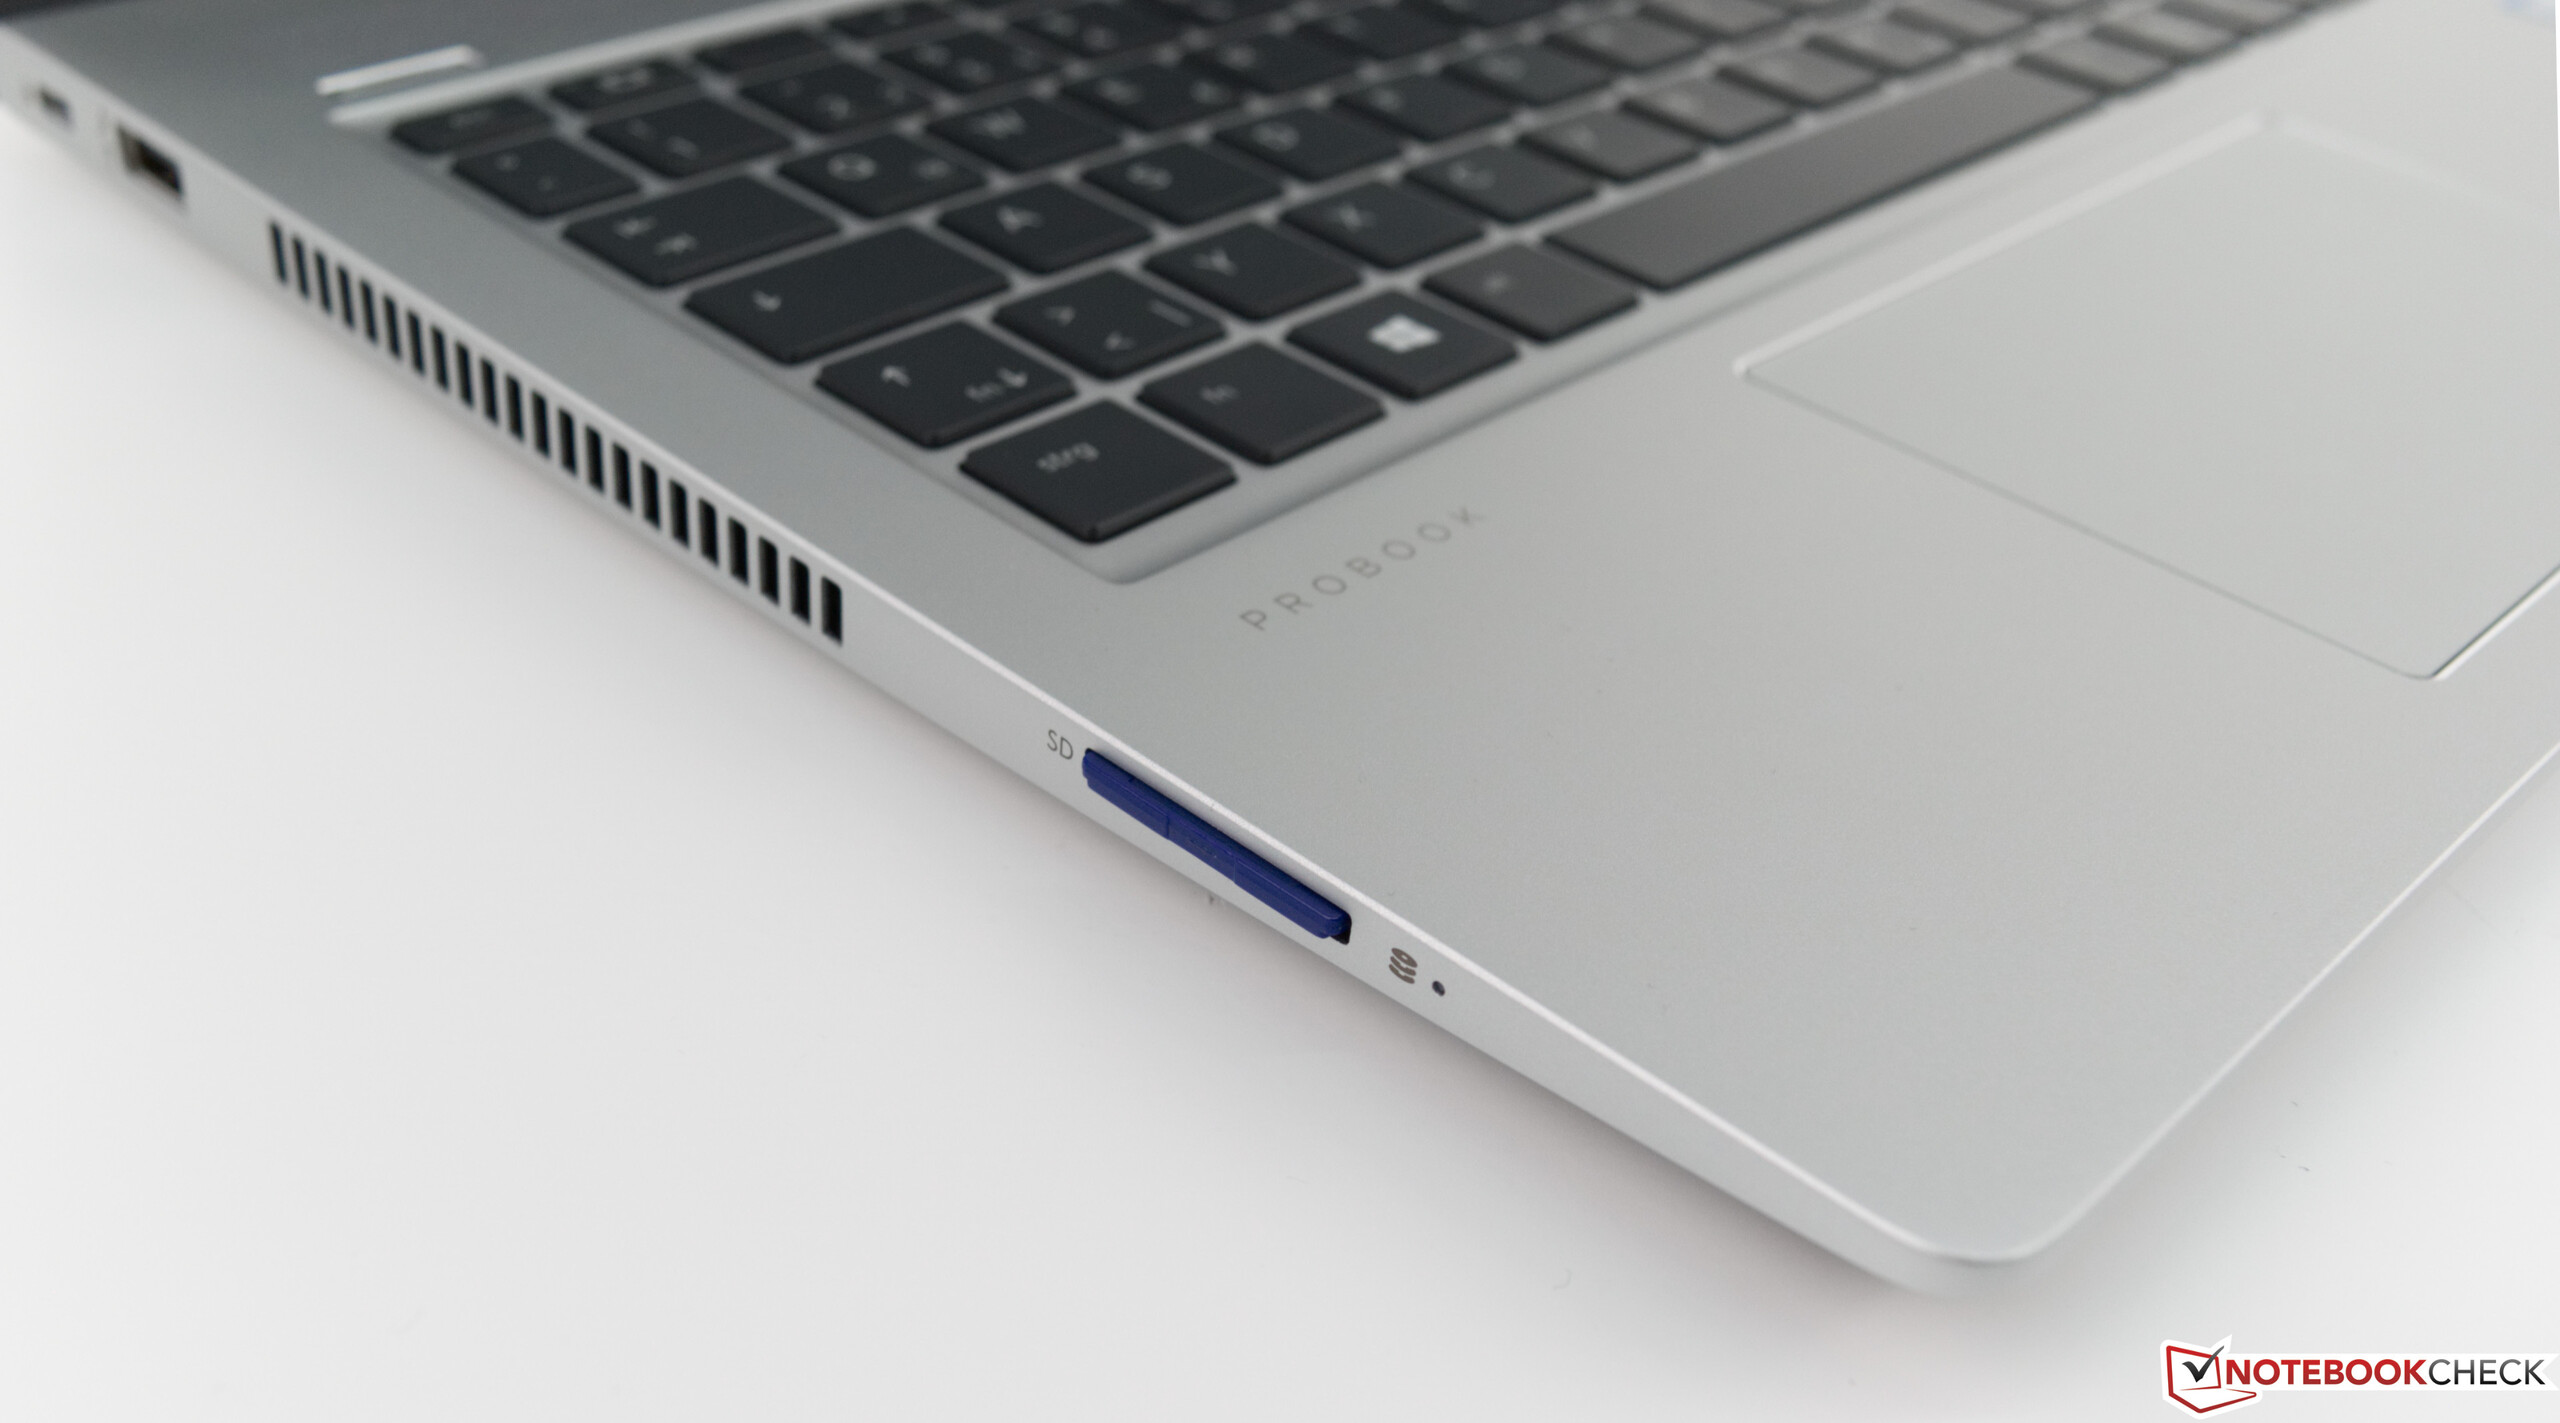
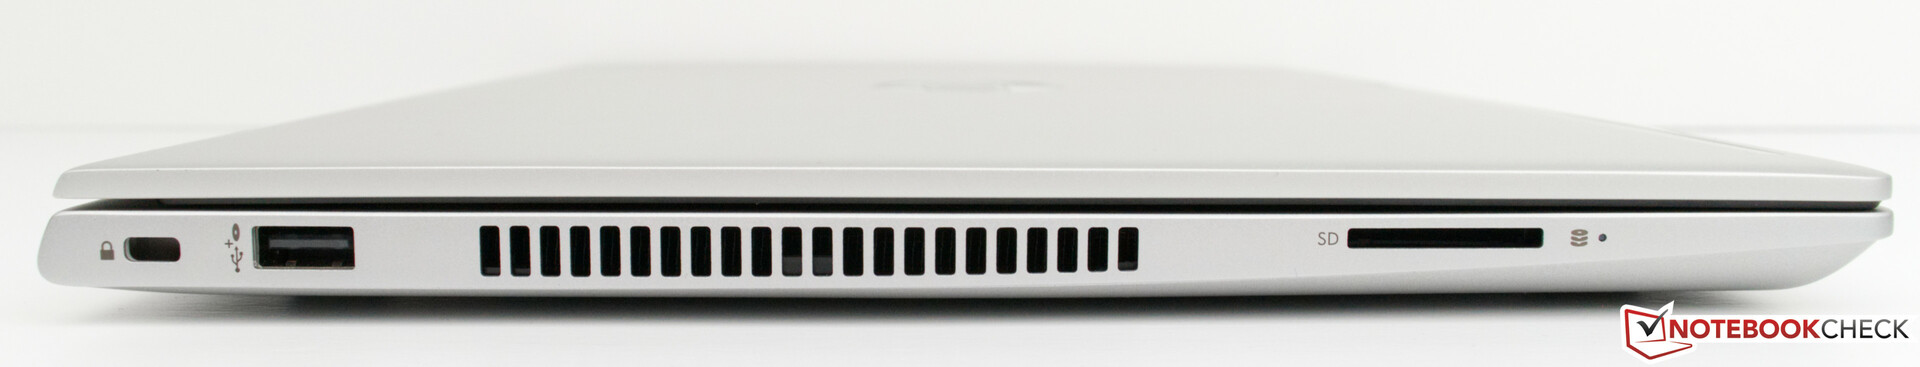
Gostaríamos de destacar os bons resultados de emissões. O baixo consumo de energia garante longos tempos de duração da bateria e o cauteloso ventilador de resfriamento significa baixas emissões de ruído. Também ficamos impressionados com os recursos de segurança (leitor de digitais e câmera IR), que funcionaram perfeitamente. A presença de um leitor de cartões SD também deve ser mencionada, já que, hoje em dia, muitos fabricantes tendem a deixar isso de lado ou apenas oferecem um leitor de cartão microSD.
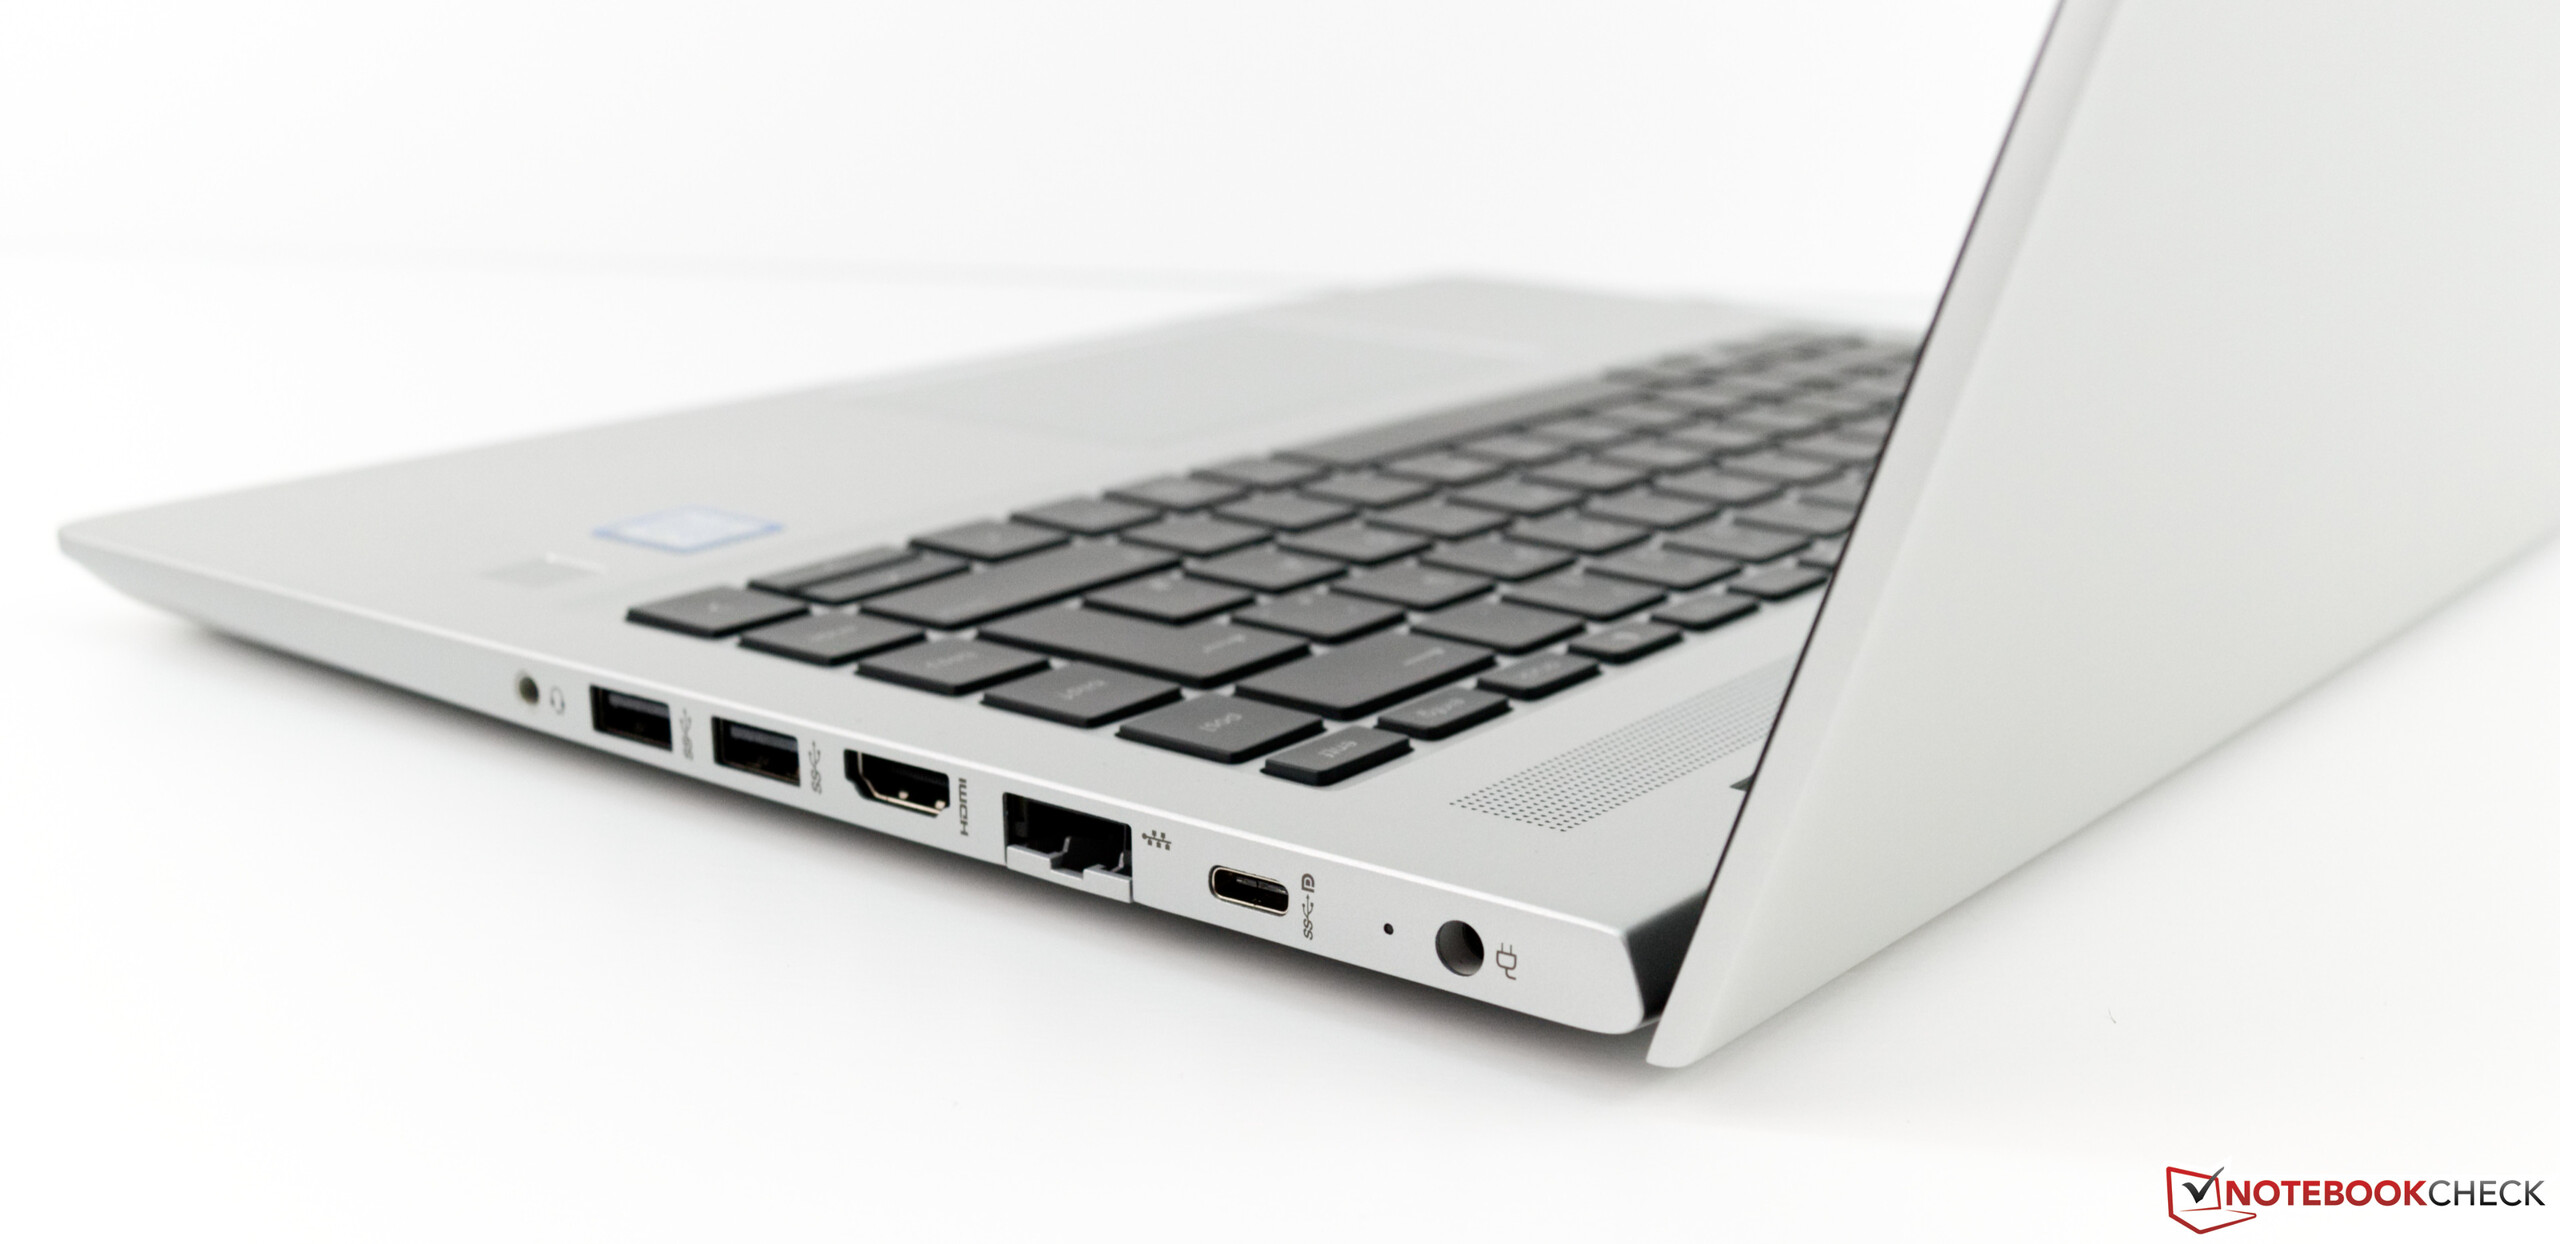
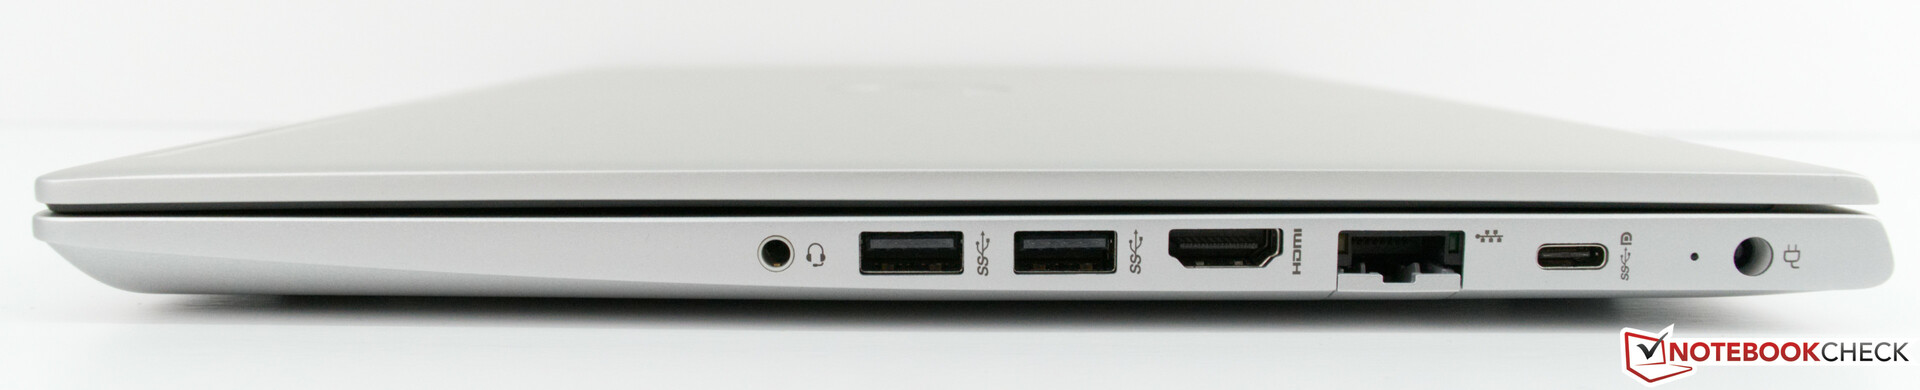
No entanto, um portátil empresarial completo também deve incluir um leitor de cartão inteligente - que o HP ProBook 440 G6 não possui. Também poderia ter sido uma boa ideia incluir uma porta Type-C que suporte Thunderbolt 3. Isso teria distinguido o dispositivo da multidão.
HP ProBook 440 G6-5TK01EA
- 03/08/2019 v6 (old)
Sebastian Bade
Price comparison
