Breve Análise do Portátil Lenovo ThinkPad L380 (i5-8250U, UHD620)
| SD Card Reader | |
| average JPG Copy Test (av. of 3 runs) | |
| Dell Latitude 7390 (Toshiba Exceria Pro M501) | |
| HP Spectre x360 13-ae048ng (Toshiba Exceria Pro M501 microSDXC 64GB) | |
| HP ProBook 430 G5-3KX72ES (Toshiba Exceria Pro SDXC 64 GB UHS-II) | |
| Lenovo ThinkPad L380 Yoga-20M7001BGE (Toshiba Exceria Pro M501 microSDXC 64GB) | |
| Lenovo ThinkPad L380-20M5000WGE (Toshiba Exceria Pro M501 microSDXC 64GB) | |
| Média da turma Office (19.8 - 198.5, n=22, últimos 2 anos) | |
| maximum AS SSD Seq Read Test (1GB) | |
| HP Spectre x360 13-ae048ng (Toshiba Exceria Pro M501 microSDXC 64GB) | |
| Dell Latitude 7390 (Toshiba Exceria Pro M501) | |
| Lenovo ThinkPad L380 Yoga-20M7001BGE (Toshiba Exceria Pro M501 microSDXC 64GB) | |
| HP ProBook 430 G5-3KX72ES (Toshiba Exceria Pro SDXC 64 GB UHS-II) | |
| Lenovo ThinkPad L380-20M5000WGE (Toshiba Exceria Pro M501 microSDXC 64GB) | |
| Média da turma Office (27.4 - 249, n=21, últimos 2 anos) | |
| Networking | |
| iperf3 transmit AX12 | |
| Lenovo ThinkPad L380 Yoga-20M7001BGE | |
| Lenovo ThinkPad L380-20M5000WGE | |
| HP Spectre x360 13-ae048ng | |
| HP ProBook 430 G5-3KX72ES | |
| Dell Latitude 7390 | |
| Xiaomi Mi Notebook Air 13.3 2018 | |
| iperf3 receive AX12 | |
| HP ProBook 430 G5-3KX72ES | |
| Dell Latitude 7390 | |
| Xiaomi Mi Notebook Air 13.3 2018 | |
| Lenovo ThinkPad L380-20M5000WGE | |
| HP Spectre x360 13-ae048ng | |
| Lenovo ThinkPad L380 Yoga-20M7001BGE | |
| |||||||||||||||||||||||||
iluminação: 89 %
iluminação com acumulador: 271 cd/m²
Contraste: 1594:1 (Preto: 0.17 cd/m²)
ΔE ColorChecker Calman: 14.89 | ∀{0.5-29.43 Ø4.71}
calibrated: 4.43
ΔE Greyscale Calman: 2.51 | ∀{0.09-98 Ø4.96}
60% sRGB (Argyll 1.6.3 3D)
38% AdobeRGB 1998 (Argyll 1.6.3 3D)
41.69% AdobeRGB 1998 (Argyll 3D)
60.7% sRGB (Argyll 3D)
40.34% Display P3 (Argyll 3D)
Gamma: 2.14
CCT: 6455 K
| Lenovo ThinkPad L380-20M5000WGE Lenovo LEN4094, , 1920x1080, 13.3" | Dell Latitude 7390 AU Optronics AUO462D / B133HAN [DELL P/N:F7VDJ], , 1920x1080, 13.3" | HP ProBook 430 G5-3KX72ES LGD052D, , 1920x1080, 13.3" | Xiaomi Mi Notebook Air 13.3 2018 SHARP LQ133M1JW15, , 1920x1080, 13.3" | Lenovo ThinkPad L380 Yoga-20M7001BGE M133NWF4-R3, , 1920x1080, 13.3" | |
|---|---|---|---|---|---|
| Display | 56% | -0% | 62% | 59% | |
| Display P3 Coverage (%) | 40.34 | 65.1 61% | 40.23 0% | 67.8 68% | 65.1 61% |
| sRGB Coverage (%) | 60.7 | 90.8 50% | 60.3 -1% | 91.6 51% | 95.5 57% |
| AdobeRGB 1998 Coverage (%) | 41.69 | 65.9 58% | 41.59 0% | 69.8 67% | 66.9 60% |
| Response Times | -23% | 0% | -2% | -8% | |
| Response Time Grey 50% / Grey 80% * (ms) | 44 ? | 48.8 ? -11% | 41.6 ? 5% | 39.6 ? 10% | 47 ? -7% |
| Response Time Black / White * (ms) | 26 ? | 35.2 ? -35% | 27.2 ? -5% | 29.3 ? -13% | 28 ? -8% |
| PWM Frequency (Hz) | 20490 ? | 220 ? | 217 ? | ||
| Screen | 22% | -7% | 4% | 9% | |
| Brightness middle (cd/m²) | 271 | 329 21% | 262 -3% | 370 37% | 323 19% |
| Brightness (cd/m²) | 253 | 316 25% | 253 0% | 355 40% | 310 23% |
| Brightness Distribution (%) | 89 | 92 3% | 82 -8% | 90 1% | 88 -1% |
| Black Level * (cd/m²) | 0.17 | 0.25 -47% | 0.28 -65% | 0.23 -35% | 0.22 -29% |
| Contrast (:1) | 1594 | 1316 -17% | 936 -41% | 1609 1% | 1468 -8% |
| Colorchecker dE 2000 * | 14.89 | 4.3 71% | 5.7 62% | 6.9 54% | 5 66% |
| Colorchecker dE 2000 max. * | 31.08 | 7.8 75% | 22.4 28% | 12.2 61% | 9.56 69% |
| Colorchecker dE 2000 calibrated * | 4.43 | 2.5 44% | 4.8 -8% | 1.4 68% | |
| Greyscale dE 2000 * | 2.51 | 3.6 -43% | 3.6 -43% | 7.4 -195% | 6.64 -165% |
| Gamma | 2.14 103% | 2.43 91% | 2.15 102% | 1.76 125% | 2.2 100% |
| CCT | 6455 101% | 6928 94% | 7096 92% | 7529 86% | 6638 98% |
| Color Space (Percent of AdobeRGB 1998) (%) | 38 | 59.1 56% | 38.3 1% | 61 61% | |
| Color Space (Percent of sRGB) (%) | 60 | 90.6 51% | 60.1 0% | 95 58% | |
| Média Total (Programa/Configurações) | 18% /
23% | -2% /
-5% | 21% /
15% | 20% /
17% |
* ... menor é melhor
Exibir tempos de resposta
| ↔ Tempo de resposta preto para branco | ||
|---|---|---|
| 26 ms ... ascensão ↗ e queda ↘ combinadas | ↗ 14 ms ascensão | 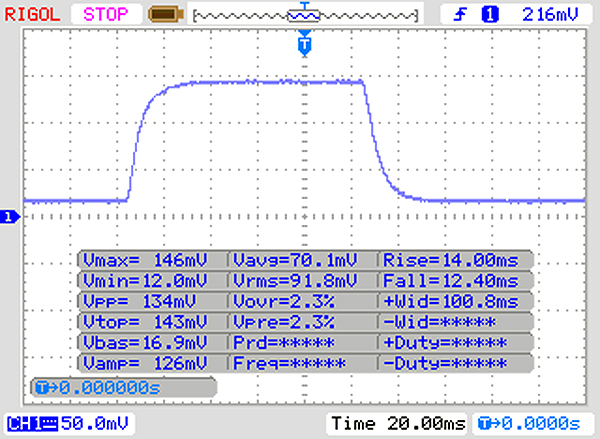 |
| ↘ 12 ms queda | ||
| A tela mostra taxas de resposta relativamente lentas em nossos testes e pode ser muito lenta para os jogadores. Em comparação, todos os dispositivos testados variam de 0.1 (mínimo) a 240 (máximo) ms. » 63 % de todos os dispositivos são melhores. Isso significa que o tempo de resposta medido é pior que a média de todos os dispositivos testados (19.8 ms). | ||
| ↔ Tempo de resposta 50% cinza a 80% cinza | ||
| 44 ms ... ascensão ↗ e queda ↘ combinadas | ↗ 21 ms ascensão | 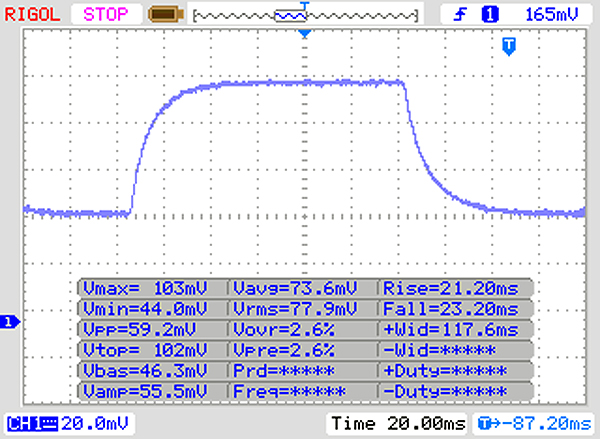 |
| ↘ 23 ms queda | ||
| A tela mostra taxas de resposta lentas em nossos testes e será insatisfatória para os jogadores. Em comparação, todos os dispositivos testados variam de 0.165 (mínimo) a 636 (máximo) ms. » 73 % de todos os dispositivos são melhores. Isso significa que o tempo de resposta medido é pior que a média de todos os dispositivos testados (30.9 ms). | ||
Cintilação da tela / PWM (modulação por largura de pulso)
| Tela tremeluzindo / PWM não detectado |  | ||
[pwm_comparison] Em comparação: 52 % de todos os dispositivos testados não usam PWM para escurecer a tela. Se PWM foi detectado, uma média de 7744 (mínimo: 5 - máximo: 343500) Hz foi medida. | |||

| PCMark 8 Home Score Accelerated v2 | 3553 pontos | |
| PCMark 8 Work Score Accelerated v2 | 4589 pontos | |
| PCMark 10 Score | 3461 pontos | |
Ajuda | ||
| Lenovo ThinkPad L380-20M5000WGE Samsung PM961 MZVLW256HEHP | Dell Latitude 7390 SK hynix SC311 M.2 | HP ProBook 430 G5-3KX72ES Toshiba XG5 KXG50ZNV512G | Xiaomi Mi Notebook Air 13.3 2018 Samsung PM961 MZVLW256HEHP | Lenovo ThinkPad L380 Yoga-20M7001BGE Samsung PM961 MZVLW256HEHP | Média Samsung PM961 MZVLW256HEHP | |
|---|---|---|---|---|---|---|
| CrystalDiskMark 3.0 | -54% | -21% | -4% | 3% | -4% | |
| Read Seq (MB/s) | 2093 | 493.4 -76% | 1440 -31% | 1288 -38% | 2073 -1% | 1627 ? -22% |
| Write Seq (MB/s) | 879 | 413.4 -53% | 522 -41% | 1160 32% | 943 7% | 1136 ? 29% |
| Read 512 (MB/s) | 1211 | 354.6 -71% | 947 -22% | 751 -38% | 1221 1% | 887 ? -27% |
| Write 512 (MB/s) | 793 | 322.6 -59% | 517 -35% | 843 6% | 819 3% | 781 ? -2% |
| Read 4k (MB/s) | 52.7 | 27.63 -48% | 33.63 -36% | 59.2 12% | 53.5 2% | 53 ? 1% |
| Write 4k (MB/s) | 121.2 | 64.7 -47% | 118.5 -2% | 146.9 21% | 127.4 5% | 126.7 ? 5% |
| Read 4k QD32 (MB/s) | 378.8 | 284.4 -25% | 386.6 2% | 425.9 12% | 396.6 5% | 419 ? 11% |
| Write 4k QD32 (MB/s) | 513 | 254.5 -50% | 510 -1% | 325 -37% | 538 5% | 384 ? -25% |

| 3DMark | |
| 1280x720 Cloud Gate Standard Graphics | |
| Média da turma Office (11640 - 118515, n=38, últimos 2 anos) | |
| Xiaomi Mi Notebook Air 13.3 2018 | |
| Razer Blade Stealth QHD i7-8550U | |
| Média Intel UHD Graphics 620 (6205 - 16400, n=225) | |
| HP ProBook 430 G5-3KX72ES | |
| HP Spectre x360 13-ae048ng | |
| Lenovo ThinkPad L380-20M5000WGE | |
| Dell Latitude 7390 | |
| Lenovo ThinkPad L380 Yoga-20M7001BGE | |
| 1920x1080 Fire Strike Graphics | |
| Média da turma Office (736 - 21871, n=75, últimos 2 anos) | |
| Xiaomi Mi Notebook Air 13.3 2018 | |
| Média Intel UHD Graphics 620 (557 - 2608, n=213) | |
| HP ProBook 430 G5-3KX72ES | |
| HP Spectre x360 13-ae048ng | |
| Lenovo ThinkPad L380-20M5000WGE | |
| Lenovo ThinkPad L380 Yoga-20M7001BGE | |
| Dell Latitude 7390 | |
| 3DMark 11 Performance | 1738 pontos | |
| 3DMark Cloud Gate Standard Score | 7394 pontos | |
| 3DMark Fire Strike Score | 940 pontos | |
Ajuda | ||
| BioShock Infinite | |
| 1920x1080 Ultra Preset, DX11 (DDOF) | |
| Xiaomi Mi Notebook Air 13.3 2018 | |
| HP ProBook 430 G5-3KX72ES | |
| Média Intel UHD Graphics 620 (4.5 - 17, n=176) | |
| Lenovo ThinkPad L380-20M5000WGE | |
| 1366x768 High Preset | |
| HP ProBook 430 G5-3KX72ES | |
| Média Intel UHD Graphics 620 (8.1 - 35.9, n=187) | |
| Lenovo ThinkPad L380 Yoga-20M7001BGE | |
| Lenovo ThinkPad L380-20M5000WGE | |
| 1366x768 Medium Preset | |
| HP ProBook 430 G5-3KX72ES | |
| Média Intel UHD Graphics 620 (11.5 - 45.5, n=187) | |
| Lenovo ThinkPad L380 Yoga-20M7001BGE | |
| Lenovo ThinkPad L380-20M5000WGE | |
| 1280x720 Very Low Preset | |
| HP ProBook 430 G5-3KX72ES | |
| Média Intel UHD Graphics 620 (18.3 - 90.2, n=187) | |
| Lenovo ThinkPad L380 Yoga-20M7001BGE | |
| Lenovo ThinkPad L380-20M5000WGE | |
| Rise of the Tomb Raider | |
| 1920x1080 High Preset AA:FX AF:4x | |
| Média Intel UHD Graphics 620 (4.9 - 32, n=42) | |
| Lenovo ThinkPad L380-20M5000WGE | |
| 1366x768 Medium Preset AF:2x | |
| Média Intel UHD Graphics 620 (6.5 - 49.3, n=62) | |
| Lenovo ThinkPad L380-20M5000WGE | |
| 1024x768 Lowest Preset | |
| Média Intel UHD Graphics 620 (10.4 - 110.7, n=82) | |
| Dell Latitude 7390 | |
| Lenovo ThinkPad L380-20M5000WGE | |
| Lenovo ThinkPad L380 Yoga-20M7001BGE | |
| Thief | |
| 1366x768 Normal Preset AA:FX | |
| Média Intel UHD Graphics 620 (10.4 - 19.7, n=10) | |
| Lenovo ThinkPad L380-20M5000WGE | |
| 1024x768 Very Low Preset | |
| Média Intel UHD Graphics 620 (16.3 - 34.3, n=10) | |
| Lenovo ThinkPad L380-20M5000WGE | |
| baixo | média | alto | ultra | |
|---|---|---|---|---|
| BioShock Infinite (2013) | 47.3 | 26.1 | 22.4 | 7.6 |
| Thief (2014) | 18.1 | 12.4 | ||
| Rise of the Tomb Raider (2016) | 19.1 | 11.6 | 5.9 |
Barulho
| Ocioso |
| 30 / 30 / 30 dB |
| Carga |
| 33.1 / 32.6 dB |
 | ||
30 dB silencioso 40 dB(A) audível 50 dB(A) ruidosamente alto |
||
min: | ||
(±) A temperatura máxima no lado superior é 41 °C / 106 F, em comparação com a média de 34.3 °C / 94 F , variando de 21.2 a 62.5 °C para a classe Office.
(±) A parte inferior aquece até um máximo de 42.6 °C / 109 F, em comparação com a média de 36.8 °C / 98 F
(+) Em uso inativo, a temperatura média para o lado superior é 25.5 °C / 78 F, em comparação com a média do dispositivo de 29.5 °C / ### class_avg_f### F.
(+) Os apoios para as mãos e o touchpad são mais frios que a temperatura da pele, com um máximo de 26 °C / 78.8 F e, portanto, são frios ao toque.
(±) A temperatura média da área do apoio para as mãos de dispositivos semelhantes foi 27.6 °C / 81.7 F (+1.6 °C / 2.9 F).
Lenovo ThinkPad L380-20M5000WGE análise de áudio
(-) | alto-falantes não muito altos (###valor### dB)
Graves 100 - 315Hz
(-) | quase nenhum baixo - em média 17.4% menor que a mediana
(±) | a linearidade dos graves é média (12.6% delta para a frequência anterior)
Médios 400 - 2.000 Hz
(+) | médios equilibrados - apenas 1.9% longe da mediana
(+) | médios são lineares (5.6% delta para frequência anterior)
Altos 2 - 16 kHz
(+) | agudos equilibrados - apenas 2.8% longe da mediana
(+) | os máximos são lineares (6.6% delta da frequência anterior)
Geral 100 - 16.000 Hz
(±) | a linearidade do som geral é média (17% diferença em relação à mediana)
Comparado com a mesma classe
» 24% de todos os dispositivos testados nesta classe foram melhores, 7% semelhantes, 68% piores
» O melhor teve um delta de 7%, a média foi 21%, o pior foi 53%
Comparado com todos os dispositivos testados
» 31% de todos os dispositivos testados foram melhores, 8% semelhantes, 61% piores
» O melhor teve um delta de 4%, a média foi 23%, o pior foi 134%
Apple MacBook 12 (Early 2016) 1.1 GHz análise de áudio
(+) | os alto-falantes podem tocar relativamente alto (###valor### dB)
Graves 100 - 315Hz
(±) | graves reduzidos - em média 11.3% menor que a mediana
(±) | a linearidade dos graves é média (14.2% delta para a frequência anterior)
Médios 400 - 2.000 Hz
(+) | médios equilibrados - apenas 2.4% longe da mediana
(+) | médios são lineares (5.5% delta para frequência anterior)
Altos 2 - 16 kHz
(+) | agudos equilibrados - apenas 2% longe da mediana
(+) | os máximos são lineares (4.5% delta da frequência anterior)
Geral 100 - 16.000 Hz
(+) | o som geral é linear (10.2% diferença em relação à mediana)
Comparado com a mesma classe
» 7% de todos os dispositivos testados nesta classe foram melhores, 2% semelhantes, 90% piores
» O melhor teve um delta de 5%, a média foi 18%, o pior foi 53%
Comparado com todos os dispositivos testados
» 5% de todos os dispositivos testados foram melhores, 1% semelhantes, 94% piores
» O melhor teve um delta de 4%, a média foi 23%, o pior foi 134%
| desligado | |
| Ocioso | |
| Carga |
|
Key:
min: | |
| Lenovo ThinkPad L380-20M5000WGE i5-8250U, UHD Graphics 620, Samsung PM961 MZVLW256HEHP, IPS, 1920x1080, 13.3" | Dell Latitude 7390 i5-8350U, UHD Graphics 620, SK hynix SC311 M.2, IPS, 1920x1080, 13.3" | HP ProBook 430 G5-3KX72ES i5-8250U, UHD Graphics 620, Toshiba XG5 KXG50ZNV512G, IPS LED, 1920x1080, 13.3" | Xiaomi Mi Notebook Air 13.3 2018 i5-8250U, GeForce MX150, Samsung PM961 MZVLW256HEHP, IPS, 1920x1080, 13.3" | Lenovo ThinkPad L380 Yoga-20M7001BGE i5-8250U, UHD Graphics 620, Samsung PM961 MZVLW256HEHP, IPS LED, 1920x1080, 13.3" | Média Intel UHD Graphics 620 | Média da turma Office | |
|---|---|---|---|---|---|---|---|
| Power Consumption | -25% | -32% | -36% | -7% | -27% | -48% | |
| Idle Minimum * (Watt) | 2.7 | 2.34 13% | 4.5 -67% | 3.9 -44% | 3.44 -27% | 3.81 ? -41% | 4.25 ? -57% |
| Idle Average * (Watt) | 5.6 | 5.6 -0% | 6.8 -21% | 7 -25% | 6.9 -23% | 6.94 ? -24% | 7.3 ? -30% |
| Idle Maximum * (Watt) | 9.2 | 6.5 29% | 8.8 4% | 7.5 18% | 9.2 -0% | 8.75 ? 5% | 8.57 ? 7% |
| Load Average * (Watt) | 30 | 43 -43% | 36.8 -23% | 44.4 -48% | 27.6 8% | 35 ? -17% | 43.8 ? -46% |
| Load Maximum * (Watt) | 30.4 | 67.4 -122% | 46.2 -52% | 55.1 -81% | 29 5% | 47.5 ? -56% | 64.5 ? -112% |
| Witcher 3 ultra * (Watt) | 32.8 |
* ... menor é melhor
| Lenovo ThinkPad L380-20M5000WGE i5-8250U, UHD Graphics 620, 45 Wh | Dell Latitude 7390 i5-8350U, UHD Graphics 620, 60 Wh | HP ProBook 430 G5-3KX72ES i5-8250U, UHD Graphics 620, 48 Wh | Xiaomi Mi Notebook Air 13.3 2018 i5-8250U, GeForce MX150, 39 Wh | Razer Blade Stealth QHD i7-8550U i5-8550U, UHD Graphics 620, 53.6 Wh | Lenovo ThinkPad L380 Yoga-20M7001BGE i5-8250U, UHD Graphics 620, 45 Wh | HP Spectre x360 13-ae048ng i5-8550U, UHD Graphics 620, 60 Wh | Média da turma Office | |
|---|---|---|---|---|---|---|---|---|
| Duração da bateria | 11% | -40% | -38% | -48% | -27% | 8% | 7% | |
| Reader / Idle (h) | 18.8 | 27.7 47% | 13 -31% | 13.9 -26% | 22.2 ? 18% | |||
| WiFi v1.3 (h) | 11.6 | 7 -40% | 6.1 -47% | 6 -48% | 7 -40% | 8.8 -24% | 13.2 ? 14% | |
| Load (h) | 2 | 1.5 -25% | 1.3 -35% | 1.7 -15% | 2.8 40% | 1.808 ? -10% | ||
| Witcher 3 ultra (h) | 1.4 | 1.9 |
Pro
Contra
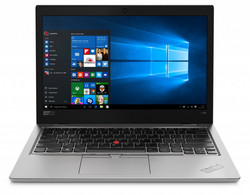
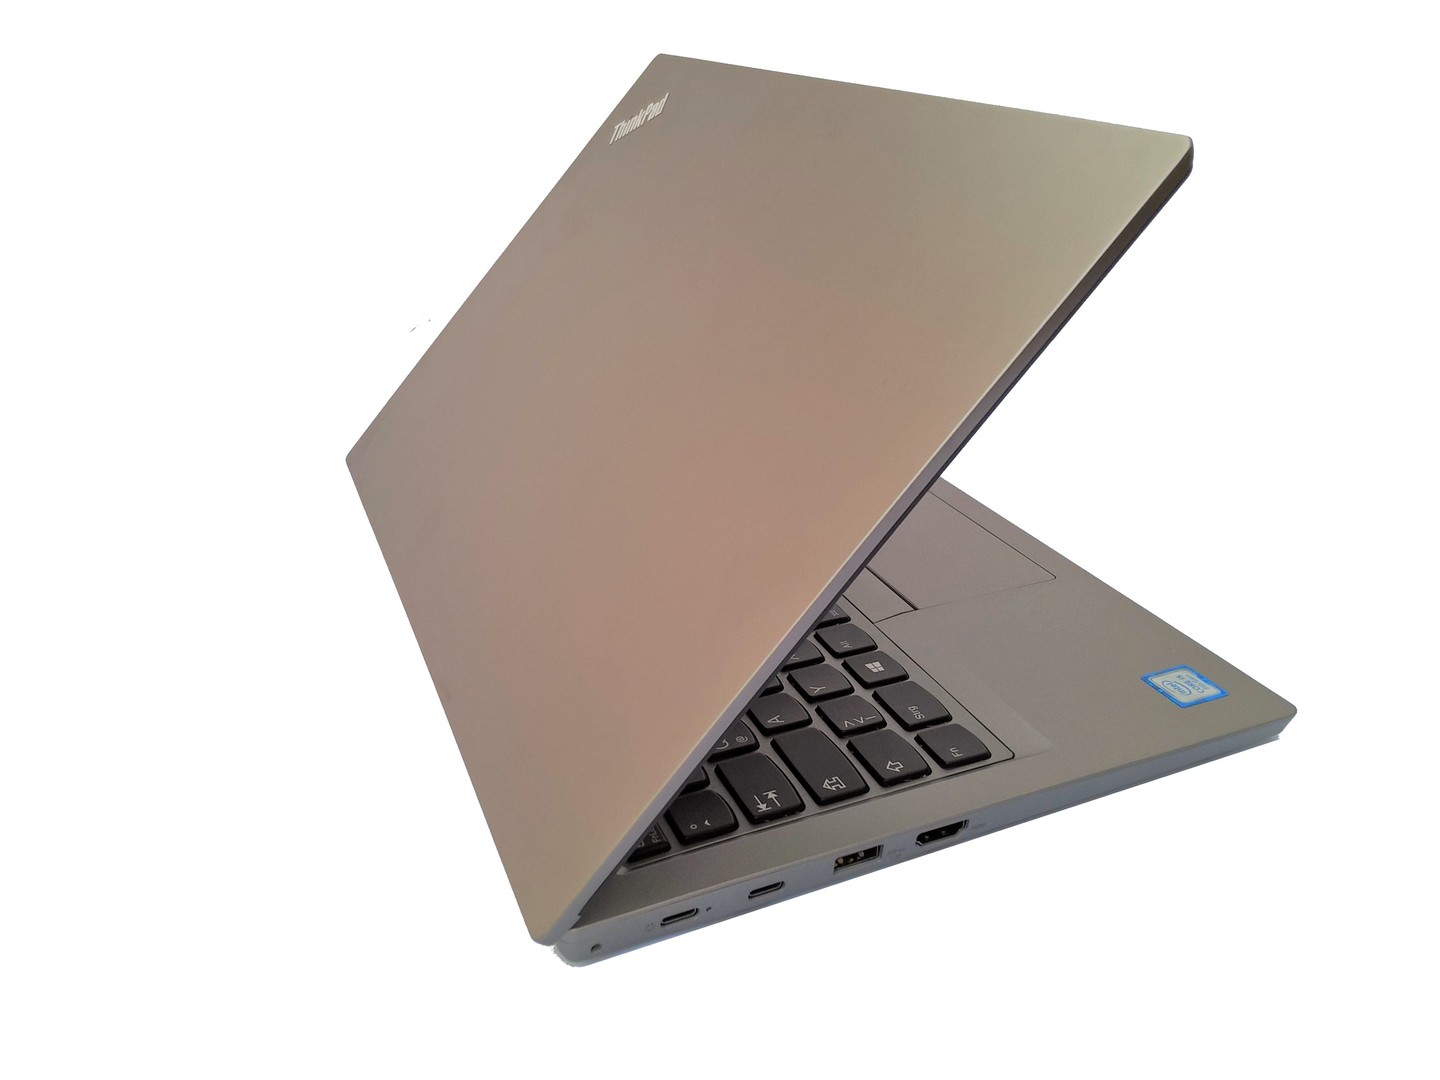
O ThinkPad L380 da Lenovo mostra-se como um dispositivo sólido em todo o nosso teste. Com um tamanho de 13 polegadas, ainda é pequeno o suficiente para ficar na estrada o dia todo, e o desempenho é mais do que suficiente para a maioria das aplicações do trabalho diário. Devido ao rápido SSD da Samsung, você também não precisa esperar longos períodos de carregamento. Com as opções de manutenção disponíveis, o ThinkPad L380 também pode ser atualizado facilmente.
Com o ThinkPad L380, a Lenovo oferece um portátil sólido de 13 polegadas, que pode brilhar com uma longa duração da bateria e bom desempenho do sistema durante o trabalho diário.
No entanto, os compradores também têm que viver com um dispositivo que é utilizável em exteriores de forma limitada. A tela não brilha o suficiente para um dia de verão. O painel IPS da L380 provavelmente também é insuficiente para aqueles que querem uma cobertura de espaço de cor tão alta quanto possível e os jogos não devem desempenhar nenhuma função na sua decisão de compra.
Lenovo ThinkPad L380-20M5000WGE
- 04/20/2018 v6 (old)
Mike Wobker