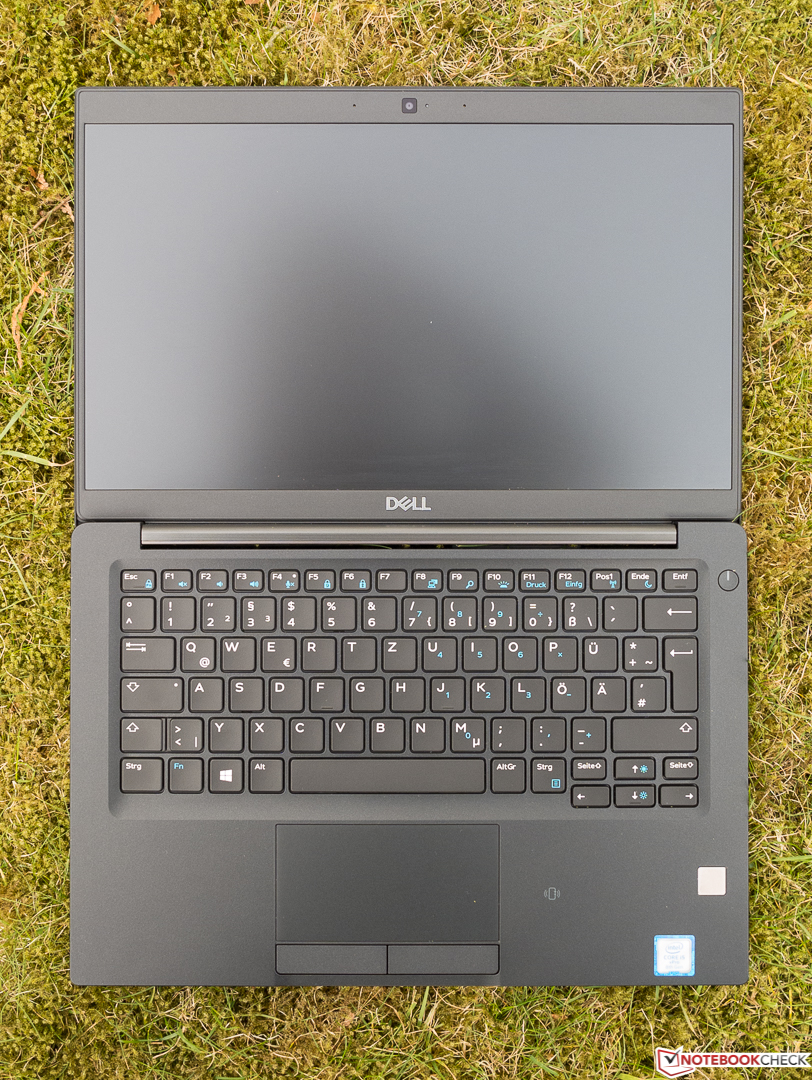
Breve Análise do Portátil Dell Latitude 7390 (i5-8350U, SSD 256 GB)
| SD Card Reader | |
| average JPG Copy Test (av. of 3 runs) | |
| Dell Latitude 7390 (Toshiba Exceria Pro M501) | |
| Dell Latitude 13 7380 (Toshiba Exceria Pro SDXC 64 GB UHS-II) | |
| Toshiba Portege X30-D (PT274U-01N001) (Toshiba Exceria Pro M401) | |
| Média da turma Office (19.8 - 198.5, n=22, últimos 2 anos) | |
| Asus Zenbook UX3430UQ-GV012T (Toshiba Exceria Pro SDXC 64 GB UHS-II) | |
| maximum AS SSD Seq Read Test (1GB) | |
| Dell Latitude 7390 (Toshiba Exceria Pro M501) | |
| Toshiba Portege X30-D (PT274U-01N001) (Toshiba Exceria Pro M401) | |
| Dell Latitude 13 7380 (Toshiba Exceria Pro SDXC 64 GB UHS-II) | |
| Média da turma Office (27.4 - 249, n=21, últimos 2 anos) | |
| Asus Zenbook UX3430UQ-GV012T | |
| |||||||||||||||||||||||||
iluminação: 92 %
iluminação com acumulador: 332 cd/m²
Contraste: 1316:1 (Preto: 0.25 cd/m²)
ΔE ColorChecker Calman: 4.3 | ∀{0.5-29.43 Ø4.71}
calibrated: 2.5
ΔE Greyscale Calman: 3.6 | ∀{0.09-98 Ø4.96}
90.6% sRGB (Argyll 1.6.3 3D)
59.1% AdobeRGB 1998 (Argyll 1.6.3 3D)
65.9% AdobeRGB 1998 (Argyll 3D)
90.8% sRGB (Argyll 3D)
65.1% Display P3 (Argyll 3D)
Gamma: 2.43
CCT: 6928 K
| Dell Latitude 7390 AU Optronics AUO462D / B133HAN [DELL P/N:F7VDJ], , 1920x1080, 13.3" | Asus Zenbook UX3430UQ-GV012T Chi Mei CMN14D2 / N140HCE-EN1, , 1920x1080, 14" | HP EliteBook x360 1030 G2 CMN1374, , 1920x1080, 13.3" | Toshiba Portege X30-D (PT274U-01N001) Toshiba TOS508F, , 1920x1080, 13.3" | Dell Latitude 13 7380 LGD0589, , 1920x1080, 13.3" | |
|---|---|---|---|---|---|
| Display | 6% | -1% | 2% | 1% | |
| Display P3 Coverage (%) | 65.1 | 67.1 3% | 65.5 1% | 66.4 2% | 65.5 1% |
| sRGB Coverage (%) | 90.8 | 98.7 9% | 88.8 -2% | 93.5 3% | 91.8 1% |
| AdobeRGB 1998 Coverage (%) | 65.9 | 69.3 5% | 64.9 -2% | 66.6 1% | 65.8 0% |
| Response Times | 19% | 5% | 21% | 23% | |
| Response Time Grey 50% / Grey 80% * (ms) | 48.8 ? | 40 ? 18% | 55.2 ? -13% | 36.8 ? 25% | 34 ? 30% |
| Response Time Black / White * (ms) | 35.2 ? | 28 ? 20% | 27.2 ? 23% | 29.6 ? 16% | 29.6 ? 16% |
| PWM Frequency (Hz) | |||||
| Screen | 1% | -19% | 7% | -25% | |
| Brightness middle (cd/m²) | 329 | 353 7% | 262 -20% | 332.6 1% | 317 -4% |
| Brightness (cd/m²) | 316 | 366 16% | 256 -19% | 323 2% | 295 -7% |
| Brightness Distribution (%) | 92 | 88 -4% | 83 -10% | 86 -7% | 87 -5% |
| Black Level * (cd/m²) | 0.25 | 0.34 -36% | 0.25 -0% | 0.28 -12% | 0.3 -20% |
| Contrast (:1) | 1316 | 1038 -21% | 1048 -20% | 1188 -10% | 1057 -20% |
| Colorchecker dE 2000 * | 4.3 | 2.88 33% | 5.13 -19% | 2.6 40% | 6.3 -47% |
| Colorchecker dE 2000 max. * | 7.8 | 6.61 15% | 9.46 -21% | 6.7 14% | 10.4 -33% |
| Colorchecker dE 2000 calibrated * | 2.5 | ||||
| Greyscale dE 2000 * | 3.6 | 4.24 -18% | 6.23 -73% | 2.5 31% | 7.8 -117% |
| Gamma | 2.43 91% | 2.38 92% | 2.45 90% | 2.12 104% | 1.81 122% |
| CCT | 6928 94% | 7380 88% | 6413 101% | 6720 97% | 7120 91% |
| Color Space (Percent of AdobeRGB 1998) (%) | 59.1 | 64 8% | 57.84 -2% | 62 5% | 61 3% |
| Color Space (Percent of sRGB) (%) | 90.6 | 99 9% | 88.57 -2% | 94 4% | 92 2% |
| Média Total (Programa/Configurações) | 9% /
4% | -5% /
-12% | 10% /
8% | -0% /
-13% |
* ... menor é melhor
Exibir tempos de resposta
| ↔ Tempo de resposta preto para branco | ||
|---|---|---|
| 35.2 ms ... ascensão ↗ e queda ↘ combinadas | ↗ 21.2 ms ascensão | 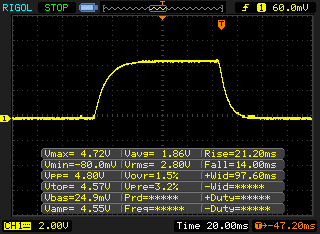 |
| ↘ 14 ms queda | ||
| A tela mostra taxas de resposta lentas em nossos testes e será insatisfatória para os jogadores. Em comparação, todos os dispositivos testados variam de 0.1 (mínimo) a 240 (máximo) ms. » 93 % de todos os dispositivos são melhores. Isso significa que o tempo de resposta medido é pior que a média de todos os dispositivos testados (19.8 ms). | ||
| ↔ Tempo de resposta 50% cinza a 80% cinza | ||
| 48.8 ms ... ascensão ↗ e queda ↘ combinadas | ↗ 24.8 ms ascensão | 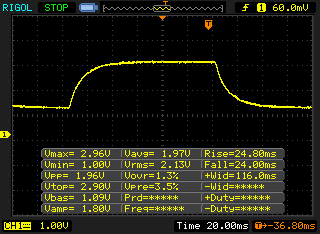 |
| ↘ 24 ms queda | ||
| A tela mostra taxas de resposta lentas em nossos testes e será insatisfatória para os jogadores. Em comparação, todos os dispositivos testados variam de 0.165 (mínimo) a 636 (máximo) ms. » 84 % de todos os dispositivos são melhores. Isso significa que o tempo de resposta medido é pior que a média de todos os dispositivos testados (31 ms). | ||
Cintilação da tela / PWM (modulação por largura de pulso)
| Tela tremeluzindo / PWM não detectado | 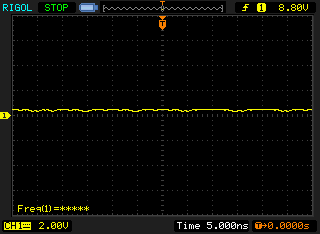 | ||
[pwm_comparison] Em comparação: 52 % de todos os dispositivos testados não usam PWM para escurecer a tela. Se PWM foi detectado, uma média de 7757 (mínimo: 5 - máximo: 343500) Hz foi medida. | |||
| PCMark 8 Home Score Accelerated v2 | 3600 pontos | |
| PCMark 8 Work Score Accelerated v2 | 4768 pontos | |
| PCMark 10 Score | 3577 pontos | |
Ajuda | ||
| Dell Latitude 7390 SK hynix SC311 M.2 | Asus Zenbook UX3430UQ-GV012T SanDisk SD8SN8U512G1002 | HP EliteBook x360 1030 G2 Sandisk SD8TN8U-256G-1006 | Toshiba Portege X30-D (PT274U-01N001) Samsung PM961 MZVLW256HEHP | Média SK hynix SC311 M.2 | |
|---|---|---|---|---|---|
| CrystalDiskMark 3.0 | 5% | -1% | 129% | 1% | |
| Read Seq (MB/s) | 493.4 | 500 1% | 467.1 -5% | 1270 157% | 494 ? 0% |
| Write Seq (MB/s) | 413.4 | 457.4 11% | 443.6 7% | 1213 193% | 401 ? -3% |
| Read 512 (MB/s) | 354.6 | 345.6 -3% | 312.3 -12% | 858 142% | 365 ? 3% |
| Write 512 (MB/s) | 322.6 | 415 29% | 372.5 15% | 763 137% | 323 ? 0% |
| Read 4k (MB/s) | 27.63 | 28.34 3% | 29.43 7% | 40.9 48% | 27.2 ? -2% |
| Write 4k (MB/s) | 64.7 | 56.8 -12% | 56.5 -13% | 143.6 122% | 68.3 ? 6% |
| Read 4k QD32 (MB/s) | 284.4 | 311.3 9% | 311.3 9% | 626 120% | 284 ? 0% |
| Write 4k QD32 (MB/s) | 254.5 | 251.1 -1% | 225.2 -12% | 536 111% | 267 ? 5% |

| 3DMark 11 Performance | 1755 pontos | |
| 3DMark Cloud Gate Standard Score | 7618 pontos | |
| 3DMark Fire Strike Score | 901 pontos | |
Ajuda | ||
| baixo | média | alto | ultra | |
|---|---|---|---|---|
| Rise of the Tomb Raider (2016) | 19.6 | |||
| Farming Simulator 17 (2016) | 51.2 | 19.7 | ||
| Final Fantasy XV Benchmark (2018) | 8.8 |
Barulho
| Ocioso |
| 29.5 / 29.5 / 29.5 dB |
| Carga |
| 32.4 / 39.9 dB |
 | ||
30 dB silencioso 40 dB(A) audível 50 dB(A) ruidosamente alto |
||
min: | ||
(±) A temperatura máxima no lado superior é 43.1 °C / 110 F, em comparação com a média de 34.3 °C / 94 F , variando de 21.2 a 62.5 °C para a classe Office.
(-) A parte inferior aquece até um máximo de 55.2 °C / 131 F, em comparação com a média de 36.8 °C / 98 F
(+) Em uso inativo, a temperatura média para o lado superior é 23.1 °C / 74 F, em comparação com a média do dispositivo de 29.5 °C / ### class_avg_f### F.
(+) Os apoios para as mãos e o touchpad são mais frios que a temperatura da pele, com um máximo de 28.4 °C / 83.1 F e, portanto, são frios ao toque.
(±) A temperatura média da área do apoio para as mãos de dispositivos semelhantes foi 27.5 °C / 81.5 F (-0.9 °C / -1.6 F).
Dell Latitude 7390 análise de áudio
(+) | os alto-falantes podem tocar relativamente alto (###valor### dB)
Graves 100 - 315Hz
(-) | quase nenhum baixo - em média 22.5% menor que a mediana
(±) | a linearidade dos graves é média (10.7% delta para a frequência anterior)
Médios 400 - 2.000 Hz
(±) | médios mais altos - em média 5% maior que a mediana
(+) | médios são lineares (4.7% delta para frequência anterior)
Altos 2 - 16 kHz
(±) | máximos mais altos - em média 5.8% maior que a mediana
(+) | os máximos são lineares (6% delta da frequência anterior)
Geral 100 - 16.000 Hz
(±) | a linearidade do som geral é média (20.7% diferença em relação à mediana)
Comparado com a mesma classe
» 48% de todos os dispositivos testados nesta classe foram melhores, 10% semelhantes, 42% piores
» O melhor teve um delta de 7%, a média foi 21%, o pior foi 53%
Comparado com todos os dispositivos testados
» 56% de todos os dispositivos testados foram melhores, 8% semelhantes, 36% piores
» O melhor teve um delta de 4%, a média foi 23%, o pior foi 134%
Asus Zenbook UX3430UQ-GV012T análise de áudio
(±) | o volume do alto-falante é médio, mas bom (###valor### dB)
Graves 100 - 315Hz
(-) | quase nenhum baixo - em média 18.9% menor que a mediana
(±) | a linearidade dos graves é média (12.2% delta para a frequência anterior)
Médios 400 - 2.000 Hz
(+) | médios equilibrados - apenas 3.4% longe da mediana
(+) | médios são lineares (6.9% delta para frequência anterior)
Altos 2 - 16 kHz
(+) | agudos equilibrados - apenas 2.7% longe da mediana
(+) | os máximos são lineares (5% delta da frequência anterior)
Geral 100 - 16.000 Hz
(±) | a linearidade do som geral é média (20.4% diferença em relação à mediana)
Comparado com a mesma classe
» 65% de todos os dispositivos testados nesta classe foram melhores, 8% semelhantes, 26% piores
» O melhor teve um delta de 5%, a média foi 18%, o pior foi 53%
Comparado com todos os dispositivos testados
» 54% de todos os dispositivos testados foram melhores, 8% semelhantes, 38% piores
» O melhor teve um delta de 4%, a média foi 23%, o pior foi 134%
HP EliteBook x360 1030 G2 análise de áudio
(+) | os alto-falantes podem tocar relativamente alto (###valor### dB)
Analysis not possible as minimum curve is missing or too high
Toshiba Portege X30-D (PT274U-01N001) análise de áudio
(±) | o volume do alto-falante é médio, mas bom (###valor### dB)
Graves 100 - 315Hz
(-) | quase nenhum baixo - em média 16.7% menor que a mediana
(±) | a linearidade dos graves é média (14.2% delta para a frequência anterior)
Médios 400 - 2.000 Hz
(+) | médios equilibrados - apenas 2.6% longe da mediana
(+) | médios são lineares (6.8% delta para frequência anterior)
Altos 2 - 16 kHz
(+) | agudos equilibrados - apenas 3.5% longe da mediana
(±) | a linearidade dos máximos é média (9.3% delta para frequência anterior)
Geral 100 - 16.000 Hz
(±) | a linearidade do som geral é média (19.7% diferença em relação à mediana)
Comparado com a mesma classe
» 41% de todos os dispositivos testados nesta classe foram melhores, 7% semelhantes, 51% piores
» O melhor teve um delta de 7%, a média foi 21%, o pior foi 53%
Comparado com todos os dispositivos testados
» 50% de todos os dispositivos testados foram melhores, 7% semelhantes, 43% piores
» O melhor teve um delta de 4%, a média foi 23%, o pior foi 134%
Dell Latitude 13 7380 análise de áudio
(-) | alto-falantes não muito altos (###valor### dB)
Graves 100 - 315Hz
(±) | graves reduzidos - em média 12.8% menor que a mediana
(±) | a linearidade dos graves é média (12.8% delta para a frequência anterior)
Médios 400 - 2.000 Hz
(+) | médios equilibrados - apenas 1.9% longe da mediana
(±) | a linearidade dos médios é média (7.2% delta para frequência anterior)
Altos 2 - 16 kHz
(+) | agudos equilibrados - apenas 4.5% longe da mediana
(±) | a linearidade dos máximos é média (12.1% delta para frequência anterior)
Geral 100 - 16.000 Hz
(±) | a linearidade do som geral é média (22.8% diferença em relação à mediana)
Comparado com a mesma classe
» 63% de todos os dispositivos testados nesta classe foram melhores, 8% semelhantes, 29% piores
» O melhor teve um delta de 7%, a média foi 21%, o pior foi 53%
Comparado com todos os dispositivos testados
» 68% de todos os dispositivos testados foram melhores, 5% semelhantes, 27% piores
» O melhor teve um delta de 4%, a média foi 23%, o pior foi 134%
| desligado | |
| Ocioso | |
| Carga |
|
Key:
min: | |
| Dell Latitude 7390 i5-8350U, UHD Graphics 620, SK hynix SC311 M.2, IPS, 1920x1080, 13.3" | Asus Zenbook UX3430UQ-GV012T i7-7500U, GeForce 940MX, SanDisk SD8SN8U512G1002, IPS, 1920x1080, 14" | HP EliteBook x360 1030 G2 i5-7300U, HD Graphics 620, Sandisk SD8TN8U-256G-1006, IPS, 1920x1080, 13.3" | Toshiba Portege X30-D (PT274U-01N001) i7-7600U, HD Graphics 620, Samsung PM961 MZVLW256HEHP, IPS, 1920x1080, 13.3" | Dell Latitude 13 7380 i7-7600U, HD Graphics 620, Samsung PM961 MZVLW256HEHP, IPS, 1920x1080, 13.3" | |
|---|---|---|---|---|---|
| Power Consumption | 4% | 7% | -11% | 11% | |
| Idle Minimum * (Watt) | 2.34 | 2.6 -11% | 3.2 -37% | 4.6 -97% | 3.2 -37% |
| Idle Average * (Watt) | 5.6 | 5.9 -5% | 5.5 2% | 7.6 -36% | 5.5 2% |
| Idle Maximum * (Watt) | 6.5 | 6.25 4% | 6.5 -0% | 8.2 -26% | 6.1 6% |
| Load Average * (Watt) | 43 | 42 2% | 29.7 31% | 23.8 45% | 29.5 31% |
| Load Maximum * (Watt) | 67.4 | 46 32% | 41.3 39% | 28 58% | 32 53% |
* ... menor é melhor
| Dell Latitude 7390 i5-8350U, UHD Graphics 620, 60 Wh | Asus Zenbook UX3430UQ-GV012T i7-7500U, GeForce 940MX, 50 Wh | HP EliteBook x360 1030 G2 i5-7300U, HD Graphics 620, 57 Wh | Toshiba Portege X30-D (PT274U-01N001) i7-7600U, HD Graphics 620, 48 Wh | Dell Latitude 13 7380 i7-7600U, HD Graphics 620, 60 Wh | Média da turma Office | |
|---|---|---|---|---|---|---|
| Duração da bateria | -8% | 48% | -7% | 28% | 11% | |
| Reader / Idle (h) | 27.7 | 21.5 -22% | 23.1 -17% | 15 -46% | 26.6 -4% | 24.5 ? -12% |
| H.264 (h) | 12.5 | 11 -12% | 15.5 ? 24% | |||
| Load (h) | 1.5 | 1.6 7% | 4.1 173% | 2 33% | 2.4 60% | 1.808 ? 21% |
| WiFi v1.3 (h) | 8.8 | 10.5 | 7.2 | 10.5 | 13.2 ? |
Pro
Contra
Com o novo Latitude 7390, a Dell fez quase tudo certo. Por, não tão altos, 1400 Euros (~$1732) para o modelo que testamos, você recebe um pacote completo com apenas alguns pontos fracos.
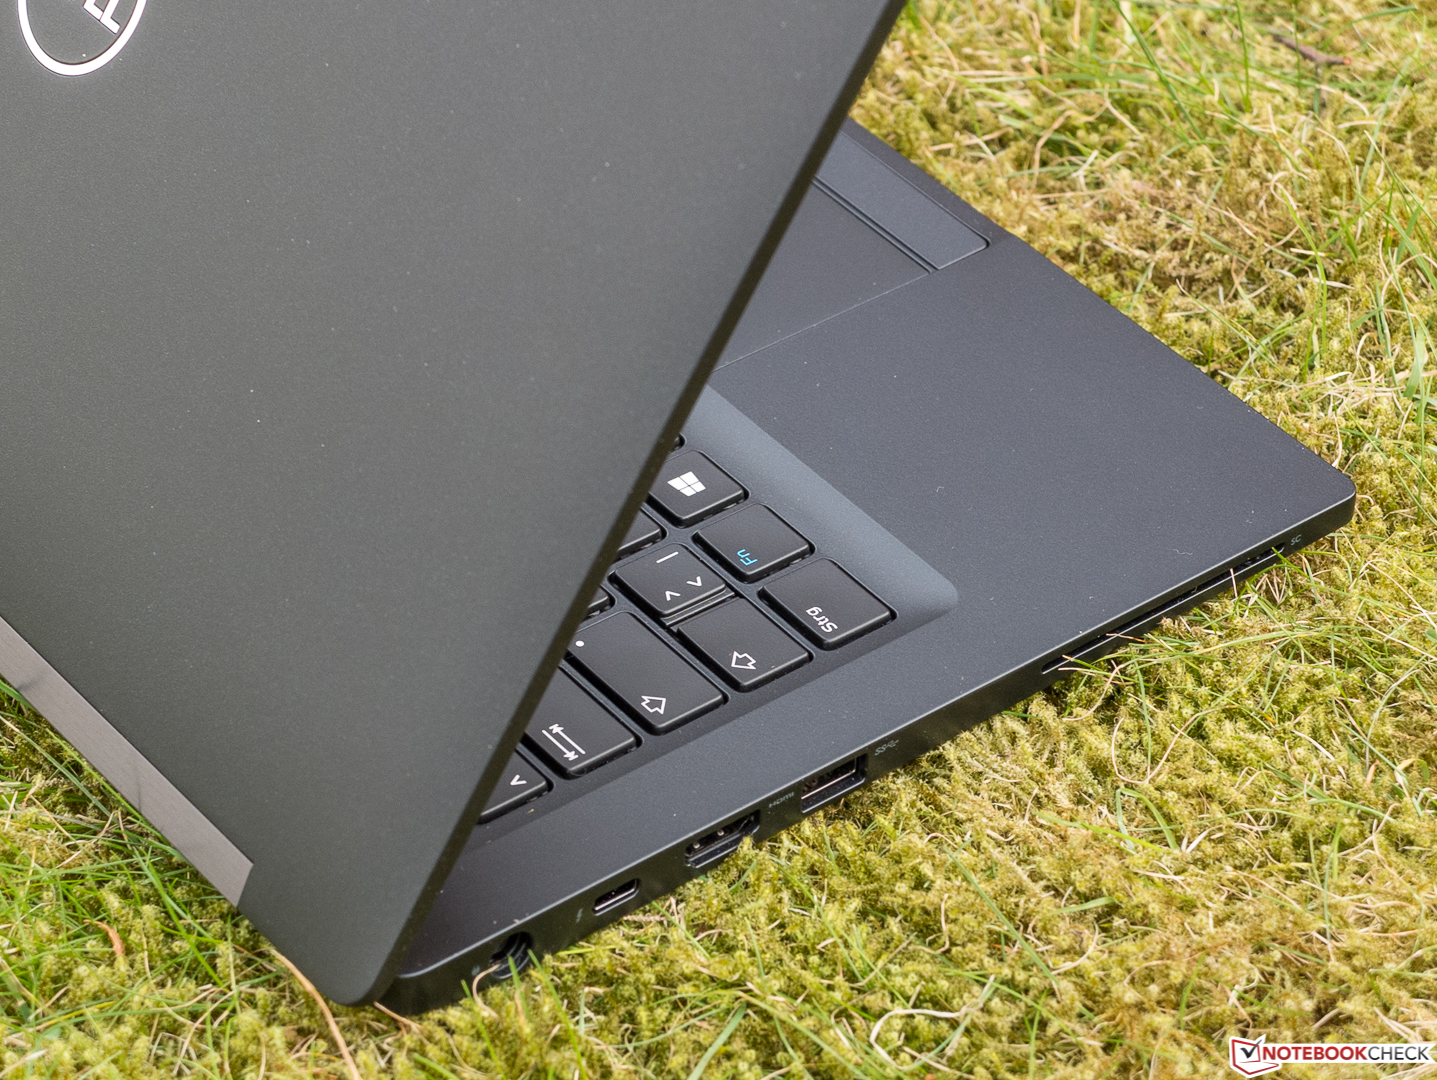
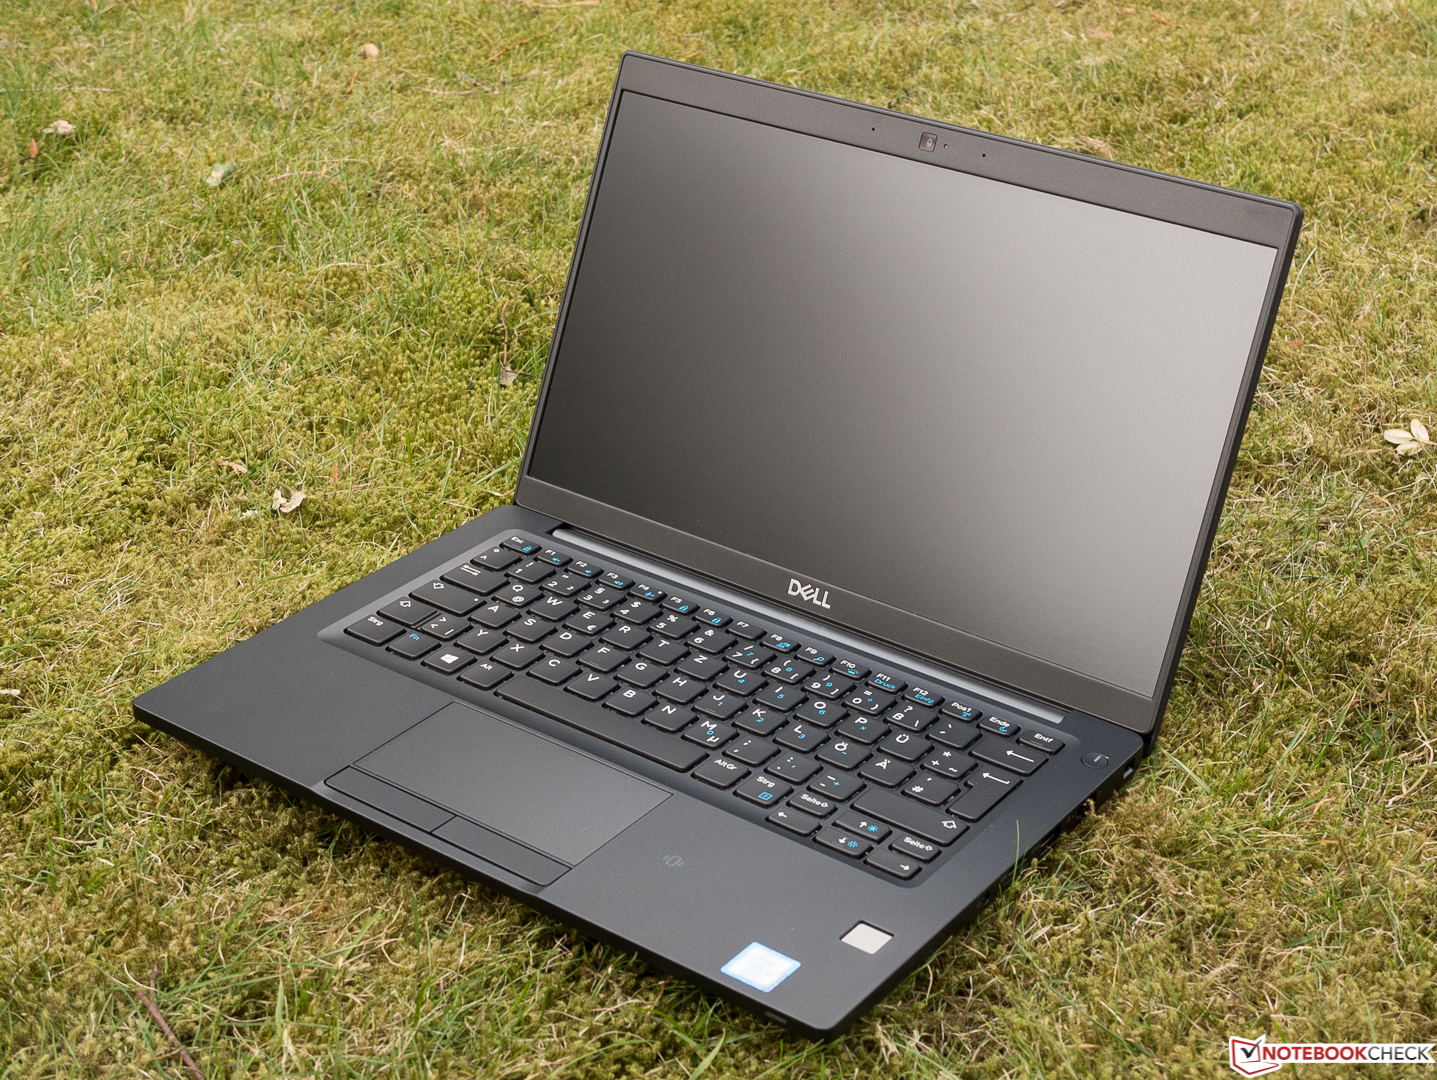
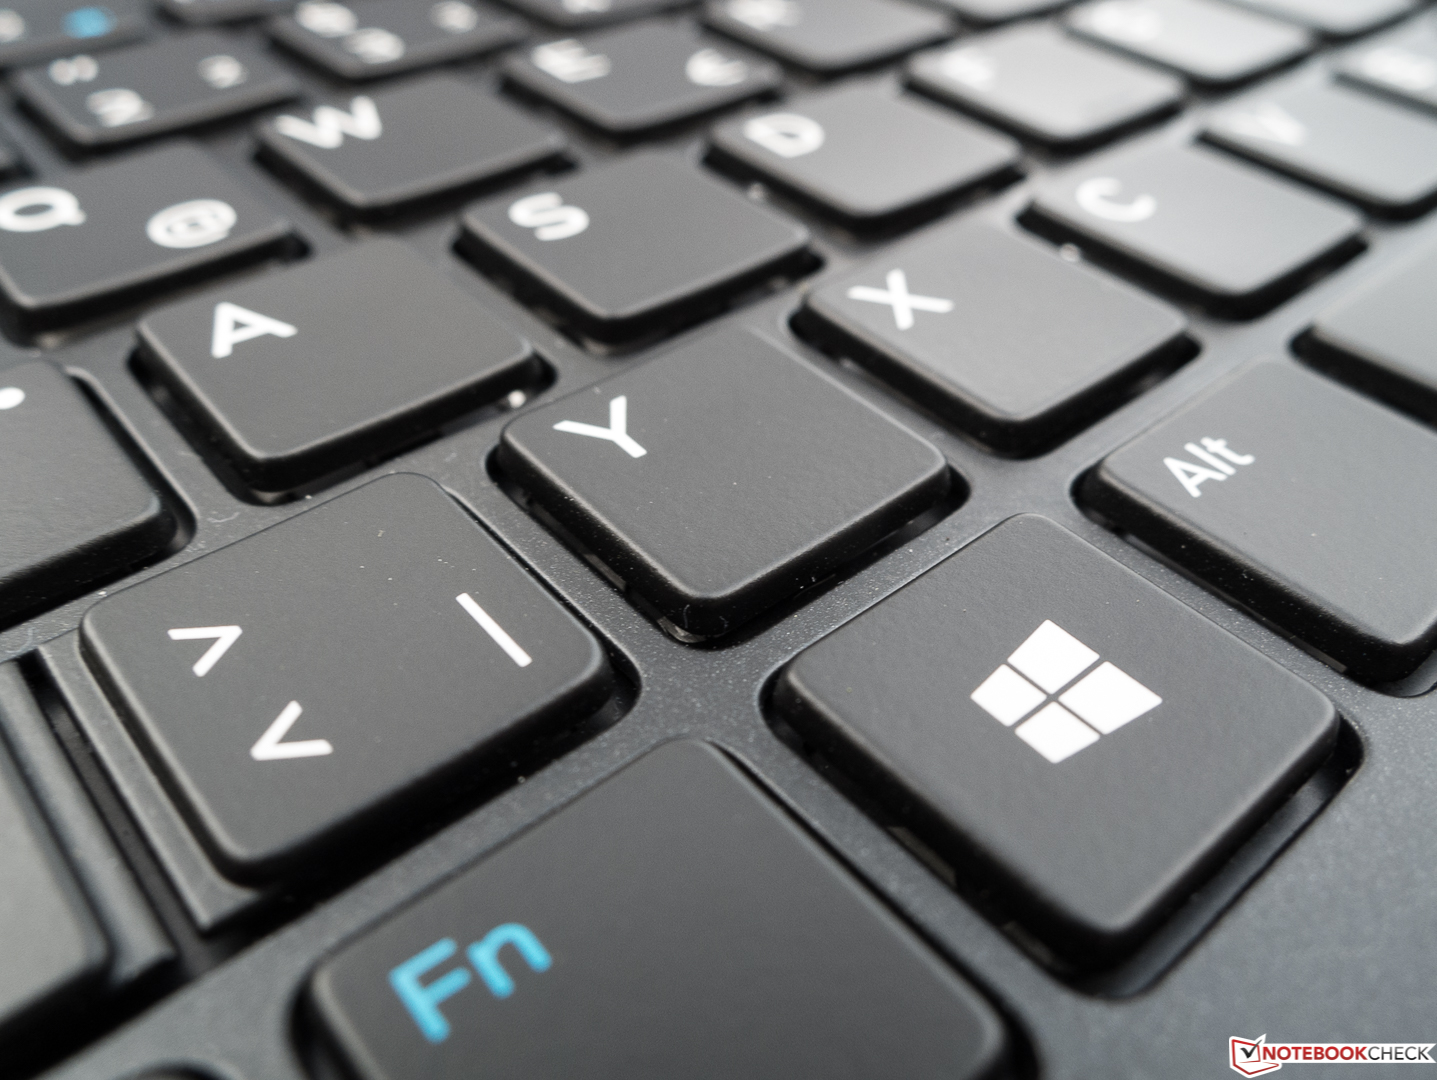
Devemos mencionar aqui o teclado um pouco pequeno, mas que na maioria das vezes é bem-sucedido, as medíocres teclas do mouse, a falta do Thunderbolt 3 e a ruidosa tecla de espaço. É um erro de projeto menor que a tampa levanta a base a partir de um ângulo de abertura acima de 135 °. A única coisa que realmente não gostamos foi o som detestável e o sensor de digitais sub-ótimo.
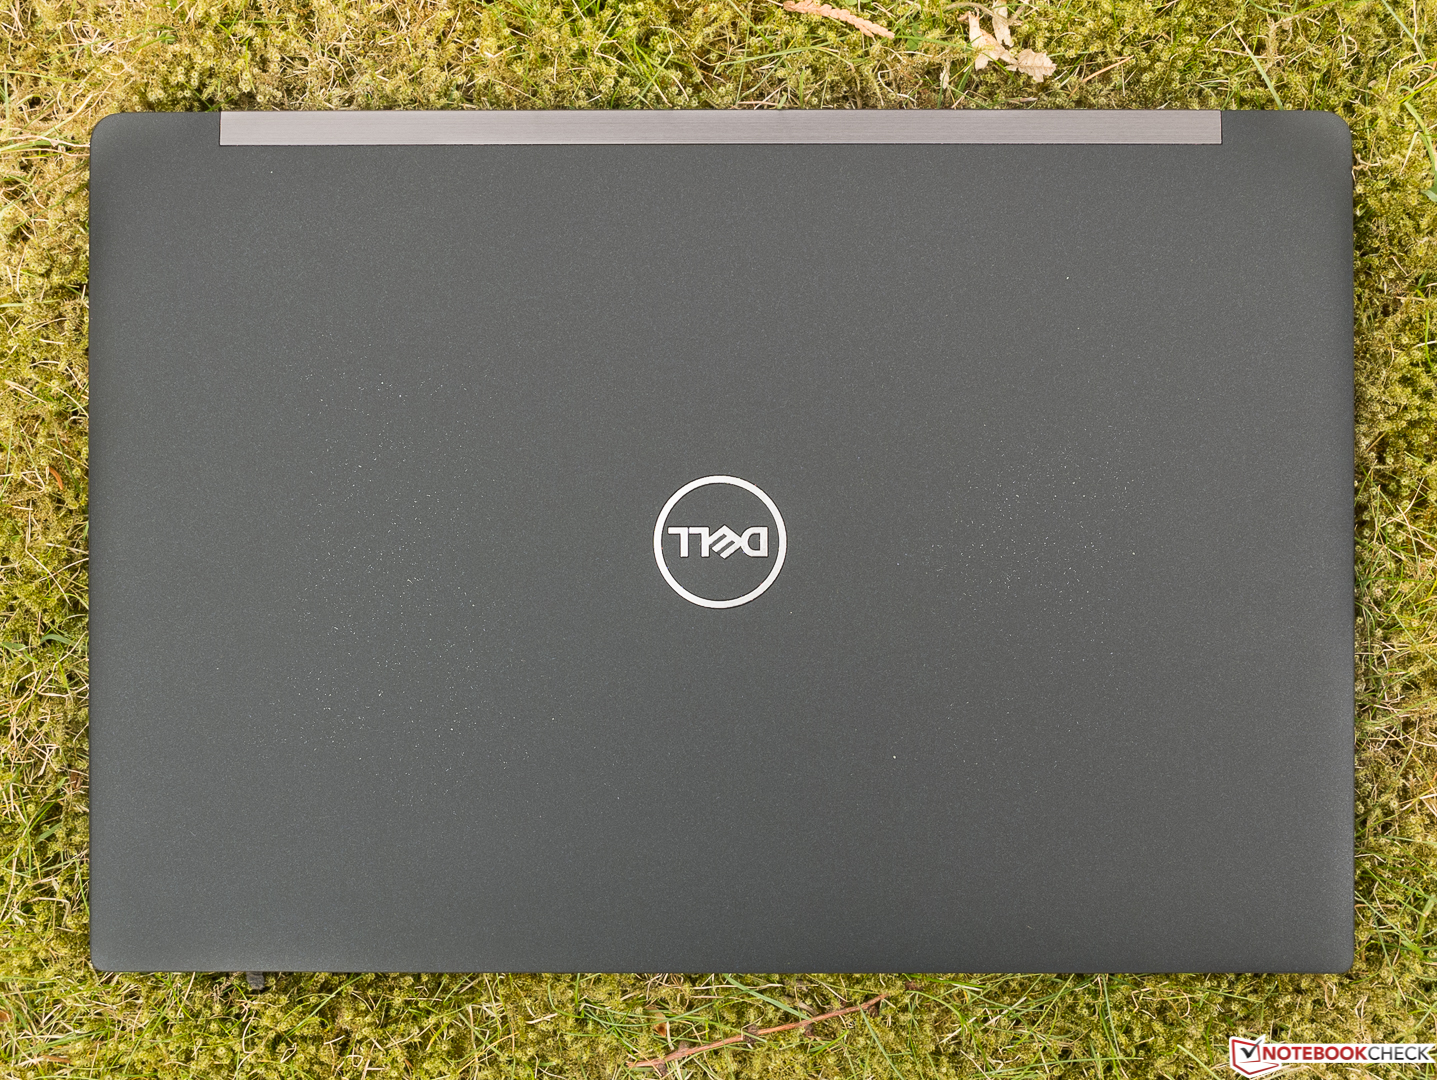
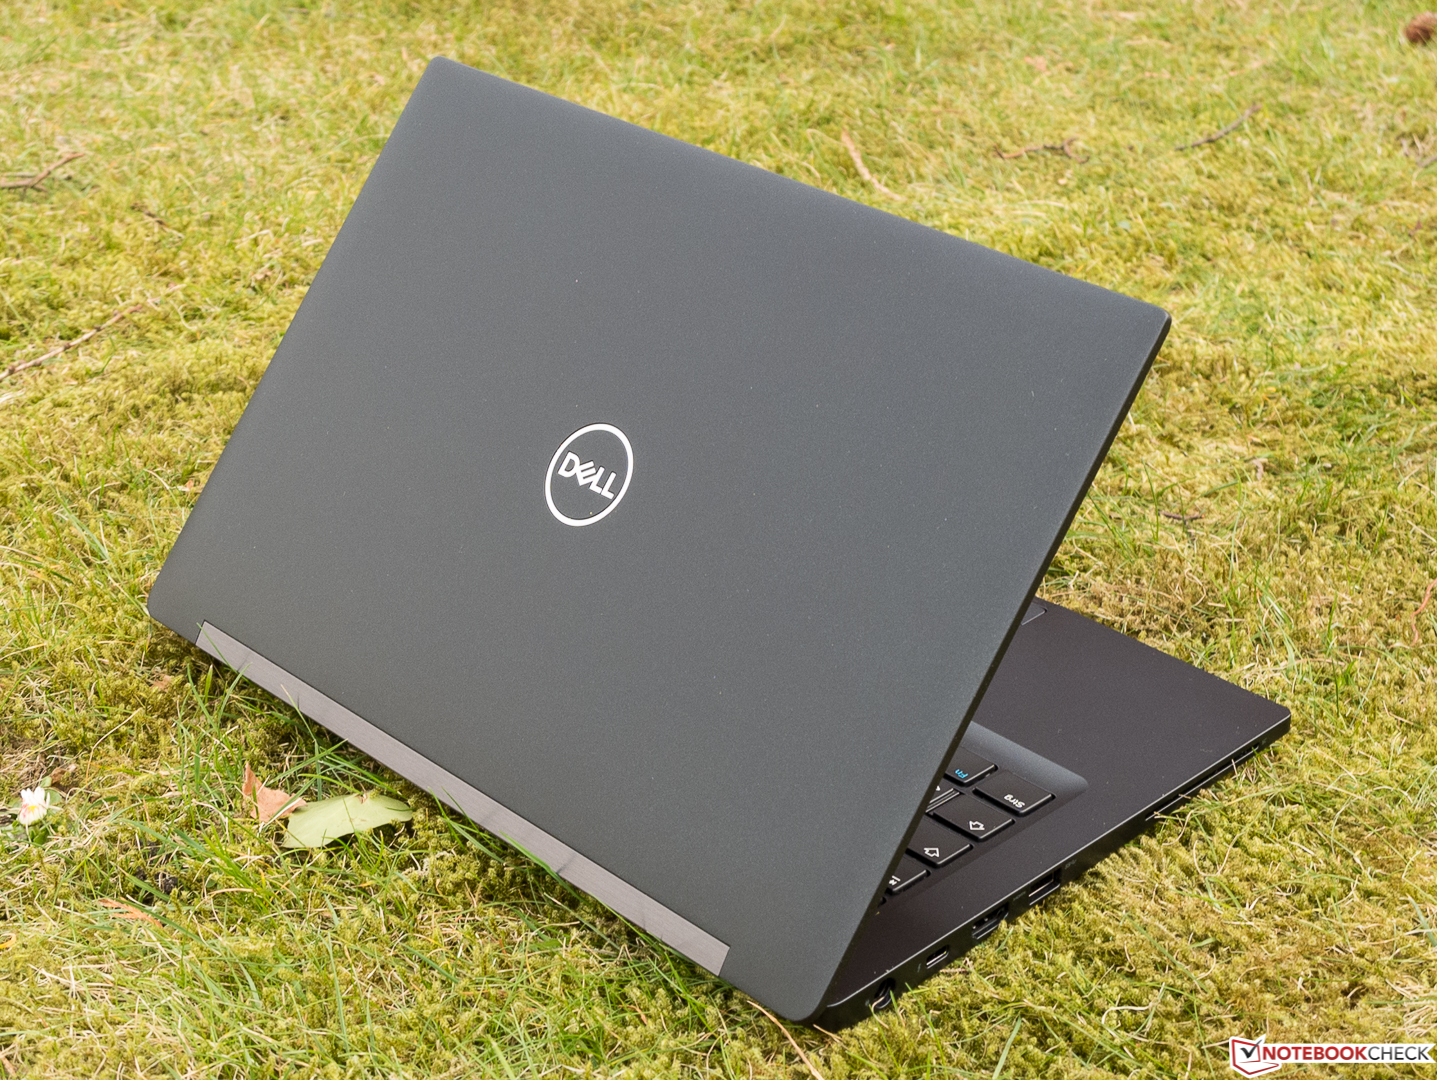
Não apenas os pontos da lista dos "Pros" são mais numerosos, mas principalmente os mais importantes. Mesmo com o seu i5-8350U, o Latitude é um pouco exagerado para tarefas de escritório, dado que a duração da bateria ainda está em um nível alto, dizemos que mais energia nunca faz mal. A carcaça de design simples, mas de alta qualidade, os dispositivos de entrada bons a muito bons, o equipamento de segurança completo, as conexões sensatas, a tela de alto contraste, o Windows 10 Pro e, finalmente, os 3 anos de garantia junto com a operação silenciosa, merecem uma recomendação de compra clara.
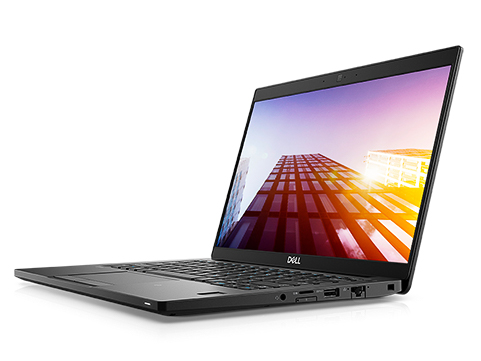
Dell Latitude 7390
- 04/05/2018 v6 (old)
Sven Kloevekorn