Breve Análise do Xiaomi Mi Notebook Air 13.3 2018 (i5-8250U MX150)
| |||||||||||||||||||||||||
iluminação: 90 %
iluminação com acumulador: 370 cd/m²
Contraste: 1609:1 (Preto: 0.23 cd/m²)
ΔE ColorChecker Calman: 6.9 | ∀{0.5-29.43 Ø4.71}
calibrated: 1.4
ΔE Greyscale Calman: 7.4 | ∀{0.09-98 Ø4.96}
69.8% AdobeRGB 1998 (Argyll 3D)
91.6% sRGB (Argyll 3D)
67.8% Display P3 (Argyll 3D)
Gamma: 1.76
CCT: 7529 K
| Xiaomi Mi Notebook Air 13.3 2018 SHARP LQ133M1JW15, , 1920x1080, 13.3" | Asus ZenBook 13 UX331UN AU Optronics B133HAN04.9, , 1920x1080, 13.3" | Lenovo Ideapad 720S-13IKB LG Philips LGD04EF, , 1920x1080, 13.3" | HP Envy 13-ad006ng BOE070E, , 1920x1080, 13.3" | Apple MacBook Pro 13 2017 Touchbar i5 APPA034, , 2560x1600, 13.3" | Xiaomi Mi Notebook Pro i7 BOEhydis NV156FHM-N61, , 1920x1080, 15.6" | Xiaomi Mi Notebook Air 13.3 2016 Samsung LTN133HL09-M01, , 1920x1080, 13.3" | |
|---|---|---|---|---|---|---|---|
| Display | -7% | -10% | -6% | 26% | -1% | ||
| Display P3 Coverage (%) | 67.8 | 63.3 -7% | 64.3 -5% | 66.8 -1% | 98.6 45% | 66 -3% | |
| sRGB Coverage (%) | 91.6 | 86.7 -5% | 82.3 -10% | 86.3 -6% | 100 9% | 95.5 4% | |
| AdobeRGB 1998 Coverage (%) | 69.8 | 63.4 -9% | 60.2 -14% | 63.1 -10% | 86.5 24% | 67.8 -3% | |
| Response Times | 4% | 14% | -15% | -18% | -8% | ||
| Response Time Grey 50% / Grey 80% * (ms) | 39.6 ? | 44 ? -11% | 35 ? 12% | 48 ? -21% | 48 ? -21% | 49 ? -24% | |
| Response Time Black / White * (ms) | 29.3 ? | 24 ? 18% | 25 ? 15% | 32 ? -9% | 33.6 ? -15% | 27 ? 8% | |
| PWM Frequency (Hz) | 220 ? | 131000 ? | 1000 ? | 119000 ? | 50 ? | ||
| Screen | 7% | -13% | -2% | 27% | -0% | 13% | |
| Brightness middle (cd/m²) | 370 | 329 -11% | 335 -9% | 281 -24% | 551 49% | 317 -14% | 347 -6% |
| Brightness (cd/m²) | 355 | 306 -14% | 303 -15% | 264 -26% | 514 45% | 334 -6% | |
| Brightness Distribution (%) | 90 | 86 -4% | 85 -6% | 83 -8% | 88 -2% | 80 -11% | |
| Black Level * (cd/m²) | 0.23 | 0.3 -30% | 0.46 -100% | 0.23 -0% | 0.48 -109% | 0.352 -53% | 0.27 -17% |
| Contrast (:1) | 1609 | 1097 -32% | 728 -55% | 1222 -24% | 1148 -29% | 901 -44% | 1285 -20% |
| Colorchecker dE 2000 * | 6.9 | 4.07 41% | 5.09 26% | 4.83 30% | 0.8 88% | 4.5 35% | 3.29 52% |
| Colorchecker dE 2000 max. * | 12.2 | 7.05 42% | 11.92 2% | 8.89 27% | 1.4 89% | 9 26% | 4.69 62% |
| Colorchecker dE 2000 calibrated * | 1.4 | ||||||
| Greyscale dE 2000 * | 7.4 | 2.76 63% | 3.23 56% | 6.63 10% | 1 86% | 3.8 49% | 3.62 51% |
| Gamma | 1.76 125% | 2.56 86% | 2.18 101% | 1.85 119% | 2.16 102% | 2.17 101% | 2.23 99% |
| CCT | 7529 86% | 6915 94% | 6214 105% | 6794 96% | 6672 97% | 7307 89% | |
| Color Space (Percent of AdobeRGB 1998) (%) | 56 | 54 | 56 | 62 | |||
| Color Space (Percent of sRGB) (%) | 86 | 82 | 86 | 95 | |||
| Média Total (Programa/Configurações) | 1% /
3% | -3% /
-8% | -8% /
-5% | 12% /
20% | 0% /
-0% | 1% /
7% |
* ... menor é melhor
Exibir tempos de resposta
| ↔ Tempo de resposta preto para branco | ||
|---|---|---|
| 29.3 ms ... ascensão ↗ e queda ↘ combinadas | ↗ 14.8 ms ascensão | 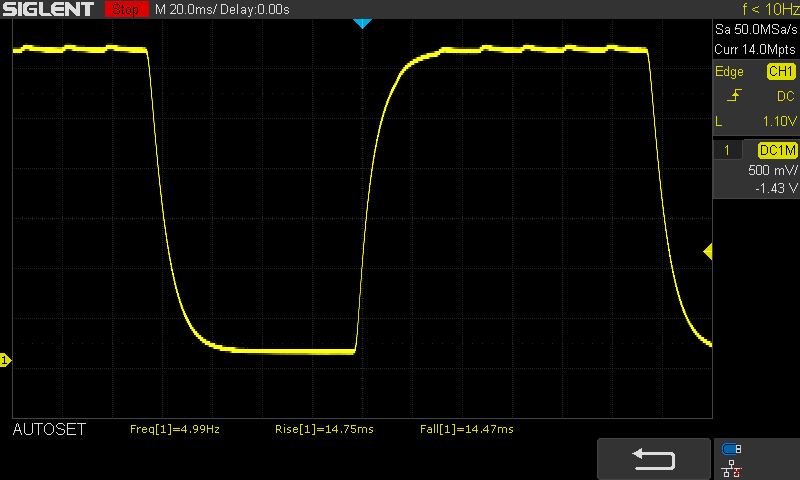 |
| ↘ 14.5 ms queda | ||
| A tela mostra taxas de resposta relativamente lentas em nossos testes e pode ser muito lenta para os jogadores. Em comparação, todos os dispositivos testados variam de 0.1 (mínimo) a 240 (máximo) ms. » 79 % de todos os dispositivos são melhores. Isso significa que o tempo de resposta medido é pior que a média de todos os dispositivos testados (19.8 ms). | ||
| ↔ Tempo de resposta 50% cinza a 80% cinza | ||
| 39.6 ms ... ascensão ↗ e queda ↘ combinadas | ↗ 18.4 ms ascensão | 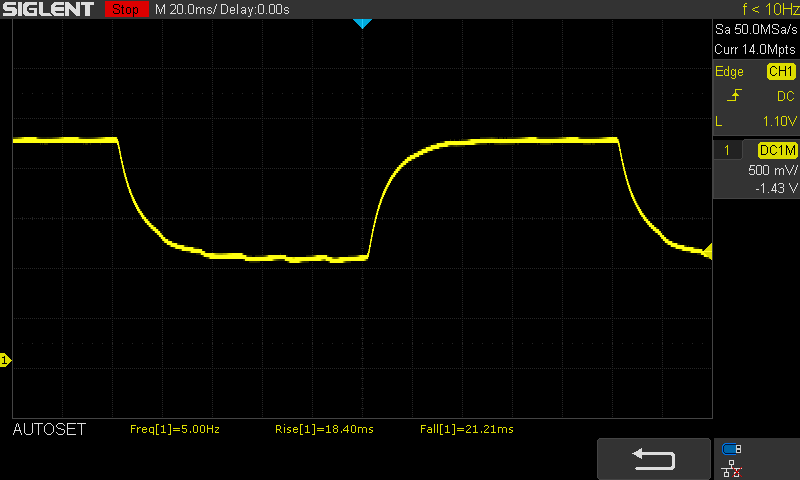 |
| ↘ 21.2 ms queda | ||
| A tela mostra taxas de resposta lentas em nossos testes e será insatisfatória para os jogadores. Em comparação, todos os dispositivos testados variam de 0.165 (mínimo) a 636 (máximo) ms. » 61 % de todos os dispositivos são melhores. Isso significa que o tempo de resposta medido é pior que a média de todos os dispositivos testados (31 ms). | ||
Cintilação da tela / PWM (modulação por largura de pulso)
| Tela tremeluzindo/PWM detectado | 220 Hz | ≤ 18 % configuração de brilho | 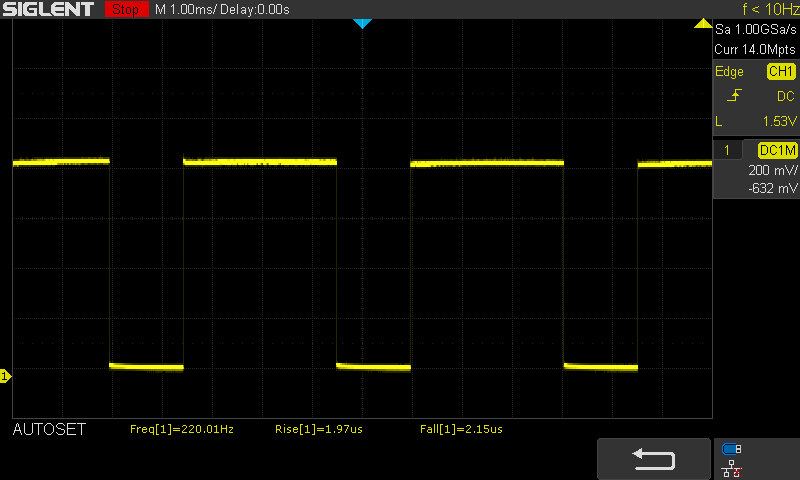 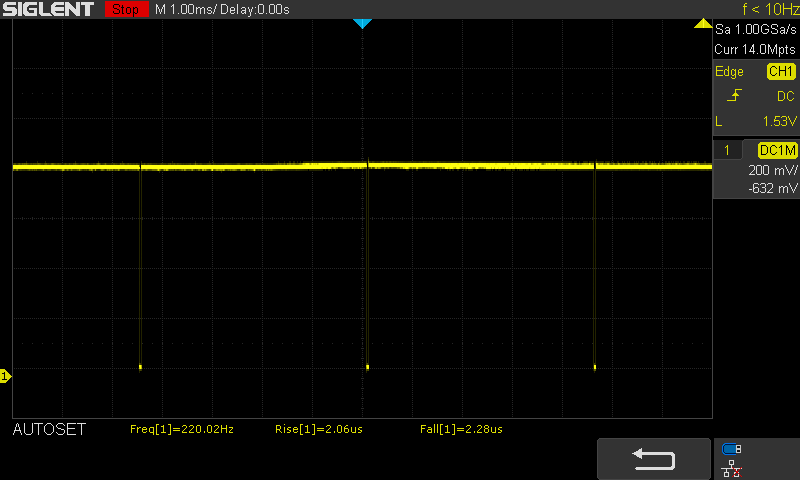 |
| ≤ 100 brilho cd/m² | |||
A luz de fundo da tela pisca em 220 Hz (pior caso, por exemplo, utilizando PWM) Cintilação detectada em uma configuração de brilho de 18 % (100 cd/m²) e abaixo. Não deve haver cintilação ou PWM acima desta configuração de brilho. A frequência de 220 Hz é relativamente baixa, portanto, usuários sensíveis provavelmente notarão cintilação e sentirão fadiga ocular na configuração de brilho indicada e abaixo. A cintilação ocorre em configurações de brilho relativamente baixas, portanto, o uso prolongado nesta configuração de brilho ou inferior pode causar fadiga ocular. [pwm_comparison] Em comparação: 52 % de todos os dispositivos testados não usam PWM para escurecer a tela. Se PWM foi detectado, uma média de 7754 (mínimo: 5 - máximo: 343500) Hz foi medida. | |||
| PCMark 8 Home Score Accelerated v2 | 3656 pontos | |
| PCMark 8 Creative Score Accelerated v2 | 5244 pontos | |
| PCMark 8 Work Score Accelerated v2 | 4811 pontos | |
| PCMark 10 Score | 3467 pontos | |
Ajuda | ||
| Xiaomi Mi Notebook Air 13.3 2018 Samsung PM961 MZVLW256HEHP | Asus ZenBook 13 UX331UN SK Hynix HFS256G39TND-N210A | Lenovo IdeaPad 320S-13IKB Samsung PM961 NVMe MZVLW512HMJP | HP Envy 13-ad006ng Toshiba NVMe THNSN5256GPUK | Dell XPS 13 9370 FHD i5 Toshiba XG5 KXG50ZNV256G | Xiaomi Mi Notebook Air 13.3 2016 Samsung PM951 NVMe MZVLV256 | Média Samsung PM961 MZVLW256HEHP | |
|---|---|---|---|---|---|---|---|
| CrystalDiskMark 3.0 | -51% | 5% | -36% | -16% | -15% | 3% | |
| Read Seq (MB/s) | 1288 | 435.6 -66% | 1372 7% | 1019 -21% | 1875 46% | 1209 -6% | 1627 ? 26% |
| Write Seq (MB/s) | 1160 | 263 -77% | 1010 -13% | 195.4 -83% | 352.7 -70% | 314 -73% | 1136 ? -2% |
| Read 512 (MB/s) | 751 | 258.1 -66% | 821 9% | 735 -2% | 840 12% | 887 ? 18% | |
| Write 512 (MB/s) | 843 | 256.6 -70% | 636 -25% | 172.3 -80% | 353.9 -58% | 781 ? -7% | |
| Read 4k (MB/s) | 59.2 | 30.37 -49% | 56.8 -4% | 34.5 -42% | 34.18 -42% | 43.4 -27% | 53 ? -10% |
| Write 4k (MB/s) | 146.9 | 78.6 -46% | 142.6 -3% | 109.4 -26% | 127.5 -13% | 153.4 4% | 126.7 ? -14% |
| Read 4k QD32 (MB/s) | 425.9 | 356.8 -16% | 537 26% | 494.6 16% | 381.8 -10% | 487.6 14% | 419 ? -2% |
| Write 4k QD32 (MB/s) | 325 | 257.2 -21% | 475 46% | 161.3 -50% | 339.9 5% | 312.2 -4% | 384 ? 18% |

| 3DMark 11 - 1280x720 Performance GPU | |
| Média da turma Subnotebook (995 - 18489, n=54, últimos 2 anos) | |
| Média NVIDIA GeForce MX150 (2796 - 4905, n=47) | |
| Xiaomi Mi Notebook Air 13.3 2018 | |
| 3DMark | |
| 1280x720 Cloud Gate Standard Graphics | |
| Média da turma Subnotebook (5577 - 61591, n=28, últimos 2 anos) | |
| Média NVIDIA GeForce MX150 (16227 - 22183, n=43) | |
| Xiaomi Mi Notebook Air 13.3 2018 | |
| 1920x1080 Fire Strike Graphics | |
| Média da turma Subnotebook (832 - 32931, n=56, últimos 2 anos) | |
| Média NVIDIA GeForce MX150 (2323 - 3739, n=44) | |
| Xiaomi Mi Notebook Air 13.3 2018 | |
| 3DMark 06 Standard Score | 19210 pontos | |
| 3DMark 11 Performance | 3820 pontos | |
| 3DMark Cloud Gate Standard Score | 12569 pontos | |
| 3DMark Fire Strike Score | 2617 pontos | |
Ajuda | ||
| Clock Speed | |
| 1280x720 GPU Clock Speed Furmark 1.19 GPU Stress Test | |
| Xiaomi Mi Notebook Pro i5 | |
| Xiaomi Mi Notebook Pro i7 | |
| Xiaomi Mi Notebook Air 13.3 2018 | |
| GPU Clock Witcher 3 ultra | |
| Xiaomi Mi Notebook Pro i7 | |
| Xiaomi Mi Notebook Pro i5 | |
| Xiaomi Mi Notebook Air 13.3 2018 | |
| GPU Clock Speed GPU-Z Render Test (max.) | |
| Xiaomi Mi Notebook Pro i7 | |
| Xiaomi Mi Notebook Pro i5 | |
| Xiaomi Mi Notebook Air 13.3 2018 | |
| Temperatures | |
| GPU Temperature Witcher 3 ultra | |
| Xiaomi Mi Notebook Air 13.3 2018 | |
| Xiaomi Mi Notebook Pro i7 | |
| Xiaomi Mi Notebook Pro i5 | |
| 1280x720 GPU Temperature Furmark 1.19 | |
| Xiaomi Mi Notebook Air 13.3 2018 | |
| Xiaomi Mi Notebook Pro i7 | |
| Xiaomi Mi Notebook Pro i5 | |
| Final Fantasy XV Benchmark - 1280x720 Lite Quality | |
| Média da turma Subnotebook (21.4 - 129.8, n=54, últimos 2 anos) | |
| Xiaomi Mi Notebook Pro i7 | |
| Média NVIDIA GeForce MX150 (23 - 36.9, n=7) | |
| Xiaomi Mi Notebook Air 13.3 2018 | |
| Asus ZenBook 13 UX331UN | |
| Rainbow Six Siege | |
| 1366x768 Medium Preset AA:T AF:2x | |
| Média NVIDIA GeForce MX150 (69.7 - 87, n=4) | |
| Xiaomi Mi Notebook Air 13.3 2018 | |
| 1920x1080 High Preset AA:T AF:4x | |
| Média NVIDIA GeForce MX150 (37.9 - 45.8, n=4) | |
| Xiaomi Mi Notebook Air 13.3 2018 | |
| 1920x1080 Ultra Preset AA:T AF:16x | |
| Média NVIDIA GeForce MX150 (18.3 - 31.3, n=4) | |
| Xiaomi Mi Notebook Air 13.3 2018 | |
| The Division | |
| 1920x1080 High Preset AF:8x | |
| Média NVIDIA GeForce MX150 (17.5 - 22.4, n=3) | |
| Xiaomi Mi Notebook Air 13.3 2018 | |
| 1280x720 Low Preset AF:1x | |
| Média NVIDIA GeForce MX150 (59.5 - 75, n=3) | |
| Xiaomi Mi Notebook Air 13.3 2018 | |
| 1366x768 Medium Preset AF:4x | |
| Média NVIDIA GeForce MX150 (38.1 - 47.1, n=3) | |
| Xiaomi Mi Notebook Air 13.3 2018 | |
| Overwatch | |
| 1920x1080 High (Render Scale 100 %) AA:SM AF:4x | |
| Acer Swift 3 SF315-51G-57E5 | |
| Média NVIDIA GeForce MX150 (38.2 - 74.5, n=9) | |
| Xiaomi Mi Notebook Pro i7 | |
| Samsung Notebook 9 NP900X5T-X01US | |
| Xiaomi Mi Notebook Pro i5 | |
| Xiaomi Mi Notebook Air 13.3 2018 | |
| 1920x1080 Epic (Render Scale 100 %) AA:SM AF:16x | |
| Acer Swift 3 SF315-51G-57E5 | |
| Média NVIDIA GeForce MX150 (25.1 - 41.9, n=9) | |
| Xiaomi Mi Notebook Pro i7 | |
| Xiaomi Mi Notebook Pro i5 | |
| Samsung Notebook 9 NP900X5T-X01US | |
| Xiaomi Mi Notebook Air 13.3 2018 | |
| For Honor | |
| 1280x720 Low Preset | |
| Média NVIDIA GeForce MX150 (60 - 91, n=4) | |
| Xiaomi Mi Notebook Air 13.3 2018 | |
| 1920x1080 High Preset AA:T AF:8x | |
| Média NVIDIA GeForce MX150 (25.2 - 30.7, n=3) | |
| Xiaomi Mi Notebook Air 13.3 2018 | |
| 1920x1080 Extreme Preset AA:T AF:16x | |
| Média NVIDIA GeForce MX150 (19.4 - 22.5, n=3) | |
| Xiaomi Mi Notebook Air 13.3 2018 | |
| Ghost Recon Wildlands - 1280x720 Low Preset | |
| Média NVIDIA GeForce MX150 (39.5 - 54, n=3) | |
| Xiaomi Mi Notebook Air 13.3 2018 | |
| Rocket League | |
| 1280x720 Performance | |
| Xiaomi Mi Notebook Air 13.3 2018 | |
| Média NVIDIA GeForce MX150 (127.6 - 160, n=4) | |
| 1920x1080 Quality AA:Medium FX | |
| Média NVIDIA GeForce MX150 (54.3 - 76.1, n=5) | |
| Xiaomi Mi Notebook Air 13.3 2018 | |
| 1920x1080 High Quality AA:High FX | |
| Média NVIDIA GeForce MX150 (37.8 - 59.8, n=6) | |
| Xiaomi Mi Notebook Air 13.3 2018 | |
| Destiny 2 | |
| 1280x720 Low Preset | |
| Xiaomi Mi Notebook Air 13.3 2018 | |
| Asus ZenBook 13 UX331UN | |
| Média NVIDIA GeForce MX150 (29.1 - 62.2, n=4) | |
| Samsung Notebook 9 NP900X5T-X01US | |
| 1920x1080 Medium Preset AA:FX AF:2x | |
| Xiaomi Mi Notebook Air 13.3 2018 | |
| Asus ZenBook 13 UX331UN | |
| Média NVIDIA GeForce MX150 (10.8 - 34.7, n=4) | |
| Samsung Notebook 9 NP900X5T-X01US | |
| Assassin´s Creed Origins | |
| 1280x720 Very Low Preset | |
| Média NVIDIA GeForce MX150 (42 - 47, n=3) | |
| Xiaomi Mi Notebook Air 13.3 2018 | |
| Xiaomi Mi Notebook Pro i7 | |
| 1920x1080 Medium Preset | |
| Xiaomi Mi Notebook Pro i7 | |
| Média NVIDIA GeForce MX150 (18 - 22, n=3) | |
| Xiaomi Mi Notebook Air 13.3 2018 | |
| Kingdom Come: Deliverance | |
| 1280x720 Low Preset | |
| Média NVIDIA GeForce MX150 (40.1 - 51.6, n=2) | |
| Média da turma Subnotebook (n=1últimos 2 anos) | |
| Xiaomi Mi Notebook Air 13.3 2018 | |
| 1920x1080 Medium Preset | |
| Média da turma Subnotebook (n=1últimos 2 anos) | |
| Média NVIDIA GeForce MX150 (18.4 - 22.1, n=2) | |
| Xiaomi Mi Notebook Air 13.3 2018 | |
| baixo | média | alto | ultra | |
|---|---|---|---|---|
| BioShock Infinite (2013) | 29.7 | |||
| The Witcher 3 (2015) | 9.7 | |||
| World of Warships (2015) | 42.1 | |||
| Rainbow Six Siege (2015) | 74 | 38 | 24.3 | |
| The Division (2016) | 59.5 | 38.1 | 17 | |
| Overwatch (2016) | 42.9 | 26.9 | ||
| Civilization 6 (2016) | 76 | 44.8 | 20.3 | |
| For Honor (2017) | 60 | 26.5 | 25.2 | 19.4 |
| Ghost Recon Wildlands (2017) | 39.5 | 18.8 | ||
| Warhammer 40.000: Dawn of War III (2017) | 60 | |||
| Rocket League (2017) | 156 | 57.1 | 39.9 | |
| Middle-earth: Shadow of War (2017) | 56.3 | 27.7 | 14.6 | 11.1 |
| Destiny 2 (2017) | 51.6 | 29.7 | ||
| Assassin´s Creed Origins (2017) | 44 | 18 | ||
| Final Fantasy XV Benchmark (2018) | 29.3 | |||
| Kingdom Come: Deliverance (2018) | 40.1 | 18.4 | ||
| X-Plane 11.11 (2018) | 57 | 46 | 41.8 |
Barulho
| Ocioso |
| 30.6 / 30.6 / 31.4 dB |
| Carga |
| 43.6 / 44.2 dB |
 | ||
30 dB silencioso 40 dB(A) audível 50 dB(A) ruidosamente alto |
||
min: | ||
(-) A temperatura máxima no lado superior é 50 °C / 122 F, em comparação com a média de 35.9 °C / 97 F , variando de 21.4 a 59 °C para a classe Subnotebook.
(-) A parte inferior aquece até um máximo de 47 °C / 117 F, em comparação com a média de 39.2 °C / 103 F
(+) Em uso inativo, a temperatura média para o lado superior é 25.8 °C / 78 F, em comparação com a média do dispositivo de 30.8 °C / ### class_avg_f### F.
(±) Jogando The Witcher 3, a temperatura média para o lado superior é 36.3 °C / 97 F, em comparação com a média do dispositivo de 30.8 °C / ## #class_avg_f### F.
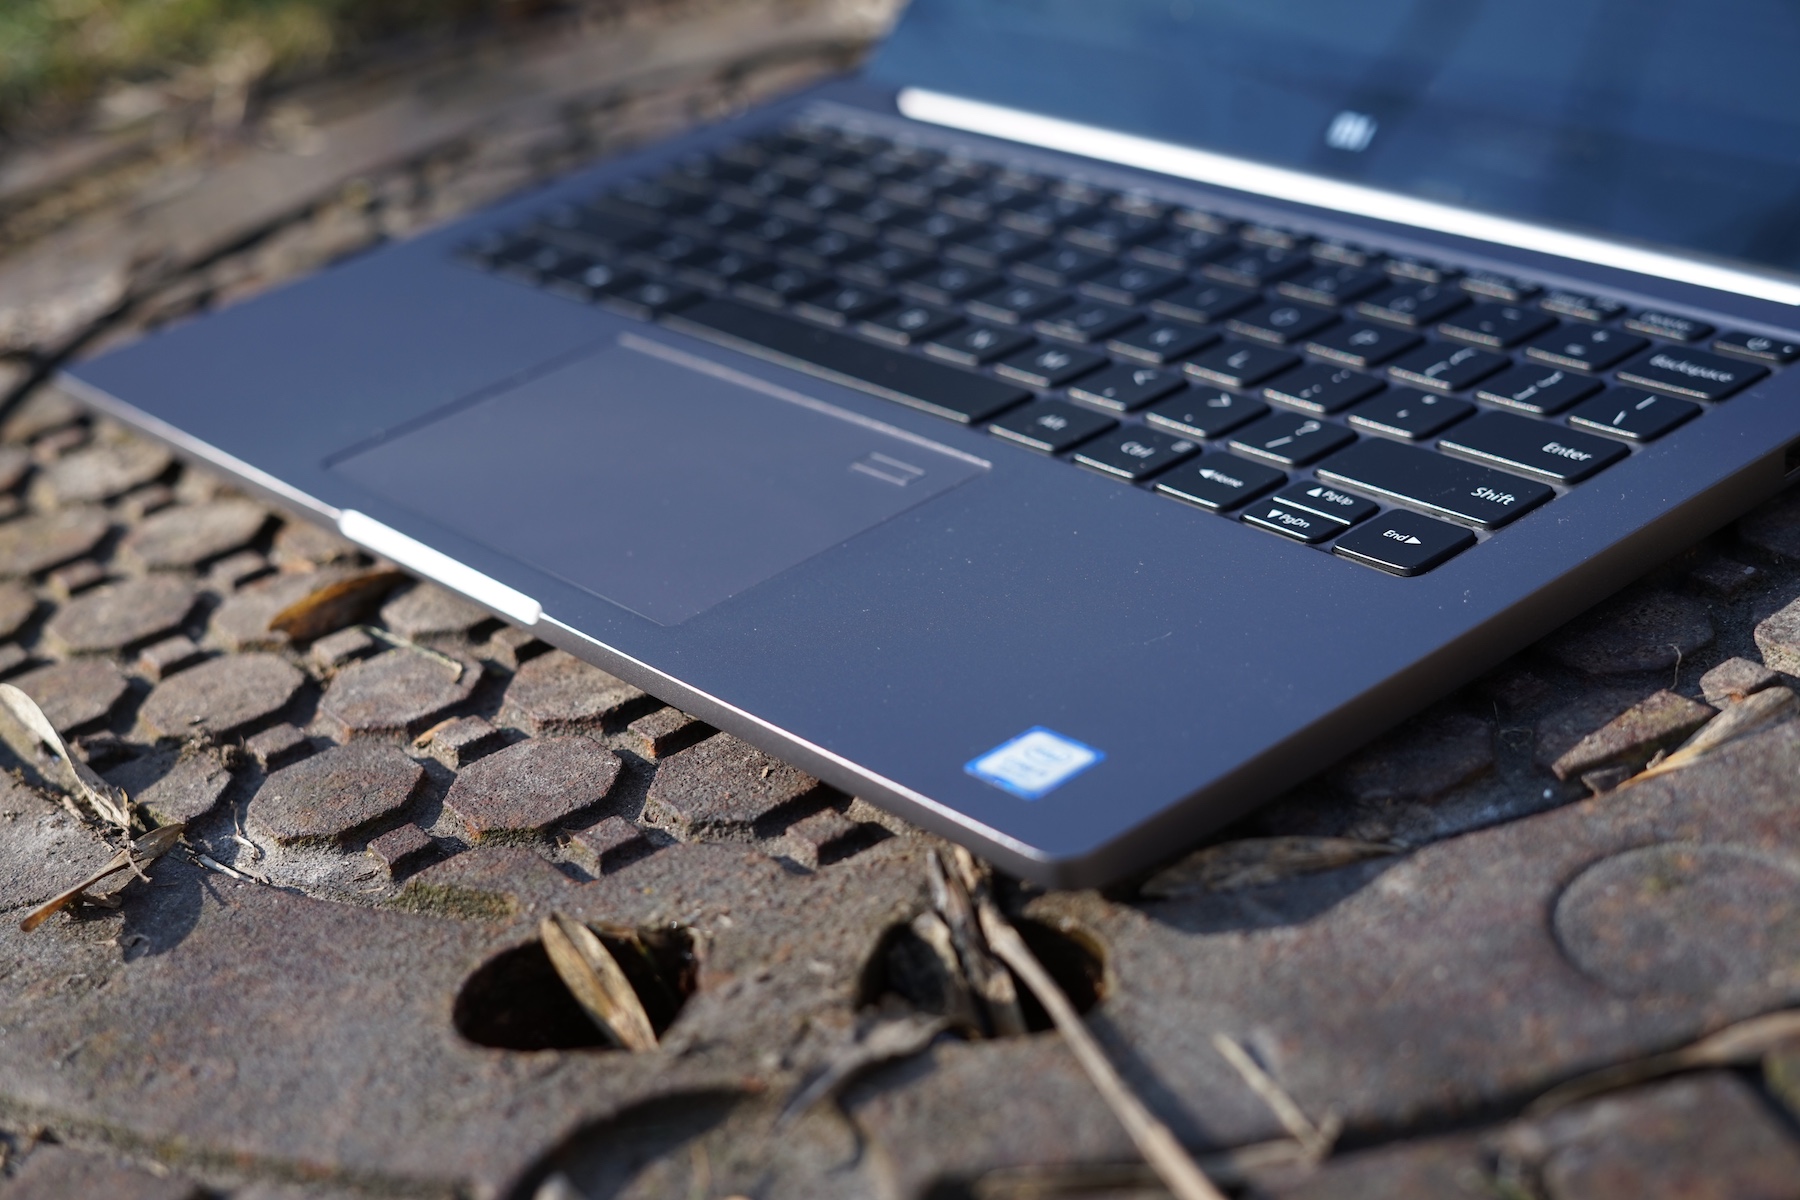
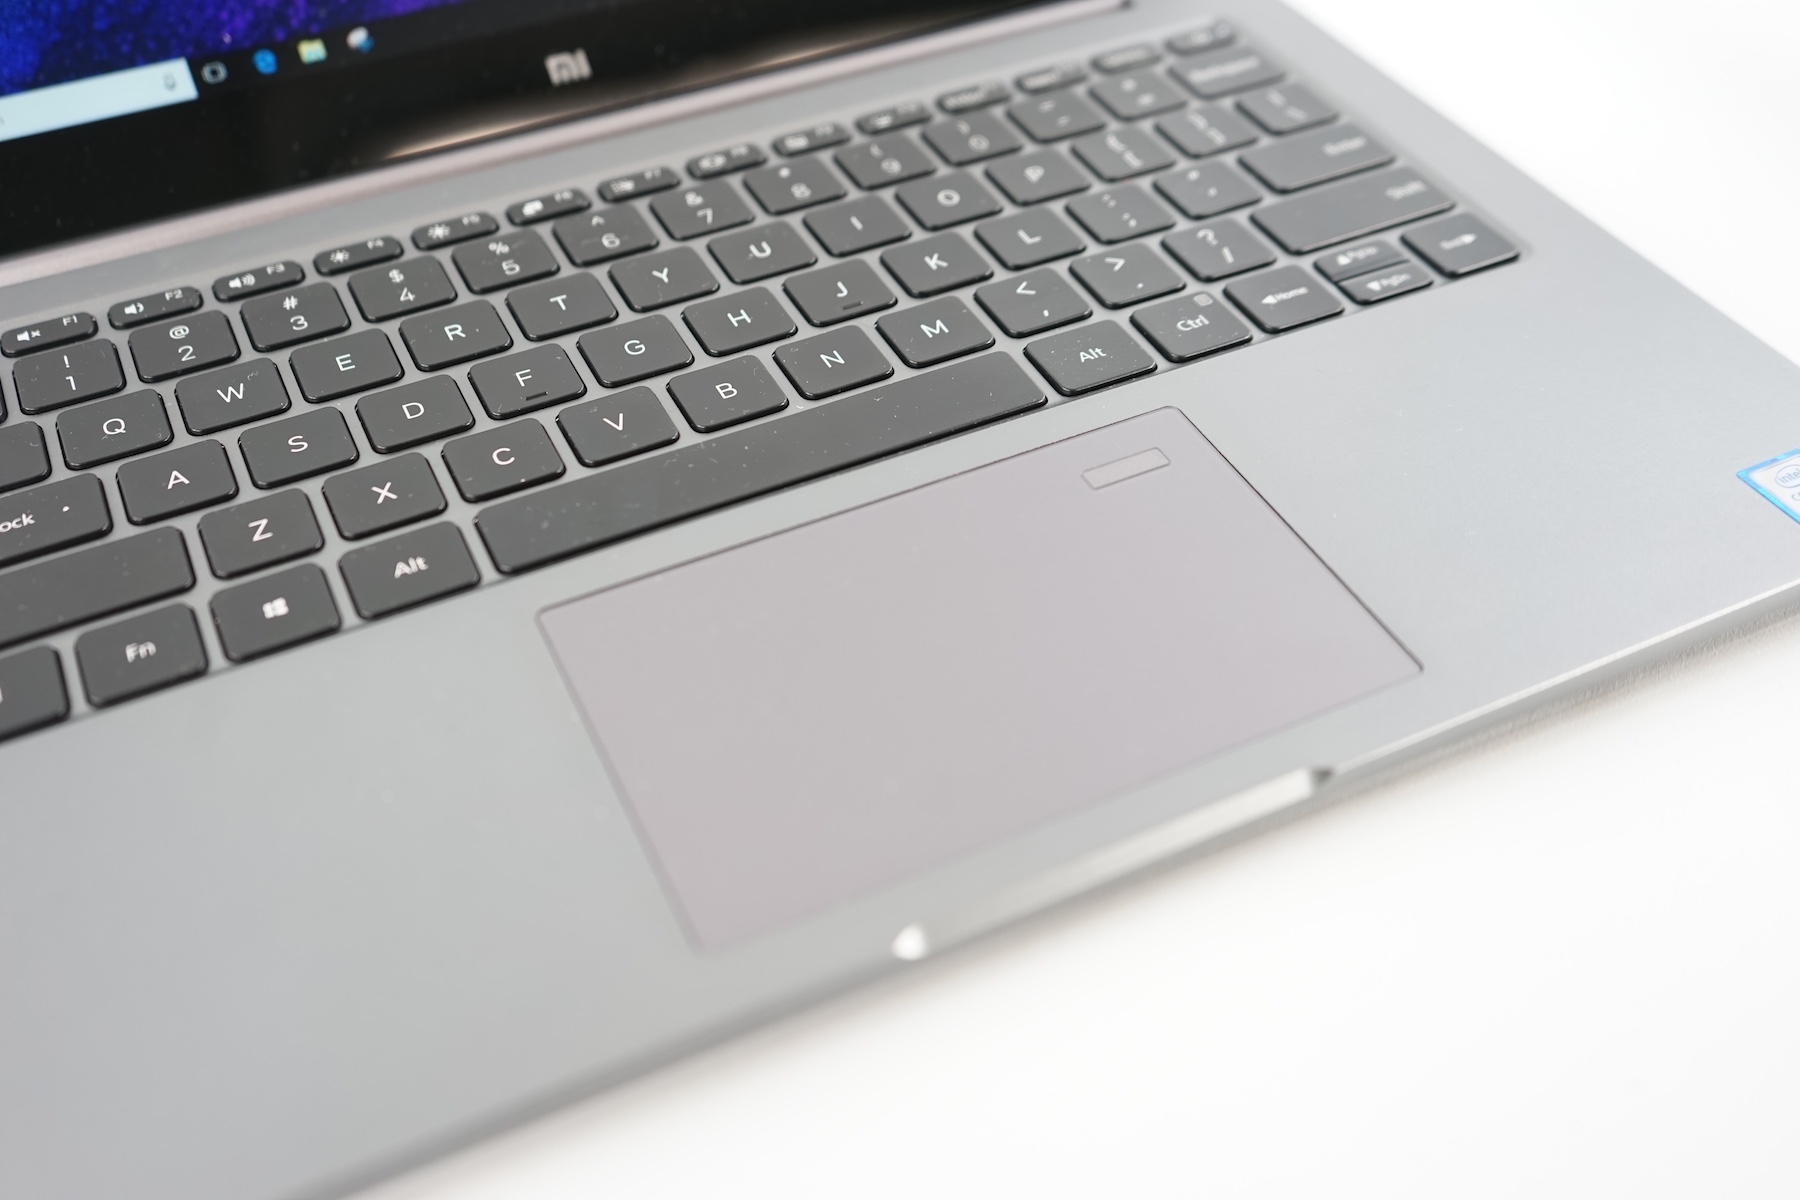
(+) Os apoios para as mãos e o touchpad estão atingindo a temperatura máxima da pele (34 °C / 93.2 F) e, portanto, não estão quentes.
(-) A temperatura média da área do apoio para as mãos de dispositivos semelhantes foi 28.2 °C / 82.8 F (-5.8 °C / -10.4 F).
Xiaomi Mi Notebook Air 13.3 2018 análise de áudio
(±) | o volume do alto-falante é médio, mas bom (###valor### dB)
Graves 100 - 315Hz
(-) | quase nenhum baixo - em média 21.5% menor que a mediana
(±) | a linearidade dos graves é média (13.9% delta para a frequência anterior)
Médios 400 - 2.000 Hz
(+) | médios equilibrados - apenas 2.2% longe da mediana
(+) | médios são lineares (3.7% delta para frequência anterior)
Altos 2 - 16 kHz
(+) | agudos equilibrados - apenas 2.4% longe da mediana
(+) | os máximos são lineares (3% delta da frequência anterior)
Geral 100 - 16.000 Hz
(±) | a linearidade do som geral é média (20.4% diferença em relação à mediana)
Comparado com a mesma classe
» 65% de todos os dispositivos testados nesta classe foram melhores, 8% semelhantes, 26% piores
» O melhor teve um delta de 5%, a média foi 18%, o pior foi 53%
Comparado com todos os dispositivos testados
» 54% de todos os dispositivos testados foram melhores, 8% semelhantes, 38% piores
» O melhor teve um delta de 4%, a média foi 23%, o pior foi 134%
Apple MacBook 12 (Early 2016) 1.1 GHz análise de áudio
(+) | os alto-falantes podem tocar relativamente alto (###valor### dB)
Graves 100 - 315Hz
(±) | graves reduzidos - em média 11.3% menor que a mediana
(±) | a linearidade dos graves é média (14.2% delta para a frequência anterior)
Médios 400 - 2.000 Hz
(+) | médios equilibrados - apenas 2.4% longe da mediana
(+) | médios são lineares (5.5% delta para frequência anterior)
Altos 2 - 16 kHz
(+) | agudos equilibrados - apenas 2% longe da mediana
(+) | os máximos são lineares (4.5% delta da frequência anterior)
Geral 100 - 16.000 Hz
(+) | o som geral é linear (10.2% diferença em relação à mediana)
Comparado com a mesma classe
» 7% de todos os dispositivos testados nesta classe foram melhores, 2% semelhantes, 90% piores
» O melhor teve um delta de 5%, a média foi 18%, o pior foi 53%
Comparado com todos os dispositivos testados
» 5% de todos os dispositivos testados foram melhores, 1% semelhantes, 94% piores
» O melhor teve um delta de 4%, a média foi 23%, o pior foi 134%
| Xiaomi Mi Notebook Air 13.3 2018 i5-8250U, GeForce MX150, Samsung PM961 MZVLW256HEHP, IPS, 1920x1080, 13.3" | Asus ZenBook 13 UX331UN i5-8550U, GeForce MX150, SK Hynix HFS256G39TND-N210A, IPS, 1920x1080, 13.3" | Lenovo IdeaPad 320S-13IKB i5-8250U, GeForce MX150, Samsung PM961 NVMe MZVLW512HMJP, IPS LED, 1920x1080, 13.3" | HP Envy 13-ad006ng i7-7500U, GeForce MX150, Toshiba NVMe THNSN5256GPUK, IPS LED, 1920x1080, 13.3" | Apple MacBook Pro 13 2017 Touchbar i5 i5-7267U, Iris Plus Graphics 650, Apple SSD AP0256, IPS, 2560x1600, 13.3" | Dell XPS 13 9370 FHD i5 i5-8250U, UHD Graphics 620, Toshiba XG5 KXG50ZNV256G, IPS, 1920x1080, 13.3" | Xiaomi Mi Notebook Air 13.3 2016 6200U, GeForce 940MX, Samsung PM951 NVMe MZVLV256, IPS, 1920x1080, 13.3" | Média Intel Core i5-8250U, NVIDIA GeForce MX150 | Média da turma Subnotebook | |
|---|---|---|---|---|---|---|---|---|---|
| Power Consumption | 20% | -0% | 7% | -22% | 17% | 3% | -11% | -1% | |
| Idle Minimum * (Watt) | 3.9 | 2.2 44% | 3.4 13% | 2.8 28% | 2.8 28% | 3.14 19% | 4 -3% | 3.97 ? -2% | 3.73 ? 4% |
| Idle Average * (Watt) | 7 | 5 29% | 6.1 13% | 5.8 17% | 10.9 -56% | 5.22 25% | 6.6 6% | 7.34 ? -5% | 6.51 ? 7% |
| Idle Maximum * (Watt) | 7.5 | 8 -7% | 7.7 -3% | 7.7 -3% | 11.4 -52% | 6 20% | 7.4 1% | 9.14 ? -22% | 7.88 ? -5% |
| Load Average * (Watt) | 44.4 | 33 26% | 44.2 -0% | 48 -8% | 55.4 -25% | 38.5 13% | 41.7 6% | 50.2 ? -13% | 42.3 ? 5% |
| Witcher 3 ultra * (Watt) | 32.8 | 37.6 -15% | 35 -7% | ||||||
| Load Maximum * (Watt) | 55.1 | 49.4 10% | 60.3 -9% | 48 13% | 57.5 -4% | 50.4 9% | 52.4 5% | 61.2 ? -11% | 64.8 ? -18% |
* ... menor é melhor
| Xiaomi Mi Notebook Air 13.3 2018 i5-8250U, GeForce MX150, 39 Wh | Asus ZenBook 13 UX331UN i5-8550U, GeForce MX150, 50 Wh | Lenovo IdeaPad 320S-13IKB i5-8250U, GeForce MX150, 36 Wh | HP Envy 13-ad006ng i7-7500U, GeForce MX150, 51 Wh | Apple MacBook Pro 13 2017 Touchbar i5 i5-7267U, Iris Plus Graphics 650, 49.2 Wh | Dell XPS 13 9370 FHD i5 i5-8250U, UHD Graphics 620, 52 Wh | Xiaomi Mi Notebook Air 13.3 2016 6200U, GeForce 940MX, 40 Wh | Média da turma Subnotebook | |
|---|---|---|---|---|---|---|---|---|
| Duração da bateria | 39% | -12% | 31% | 7% | 71% | -1% | 99% | |
| Reader / Idle (h) | 13 | 20.7 59% | 12.3 -5% | 20 54% | 23.6 82% | 12 -8% | 28.6 ? 120% | |
| H.264 (h) | 8 | 8.9 11% | 5.8 -27% | 7.9 -1% | 6.9 -14% | 13.9 74% | 7.1 -11% | 15.3 ? 91% |
| WiFi v1.3 (h) | 6.1 | 9 48% | 5.7 -7% | 7.1 16% | 8.7 43% | 10.7 75% | 6.5 7% | 14 ? 130% |
| Witcher 3 ultra (h) | 1.4 | |||||||
| Load (h) | 1.3 | 1.8 38% | 1.2 -8% | 2 54% | 1.2 -8% | 2 54% | 1.4 8% | 1.998 ? 54% |
Pro
Contra
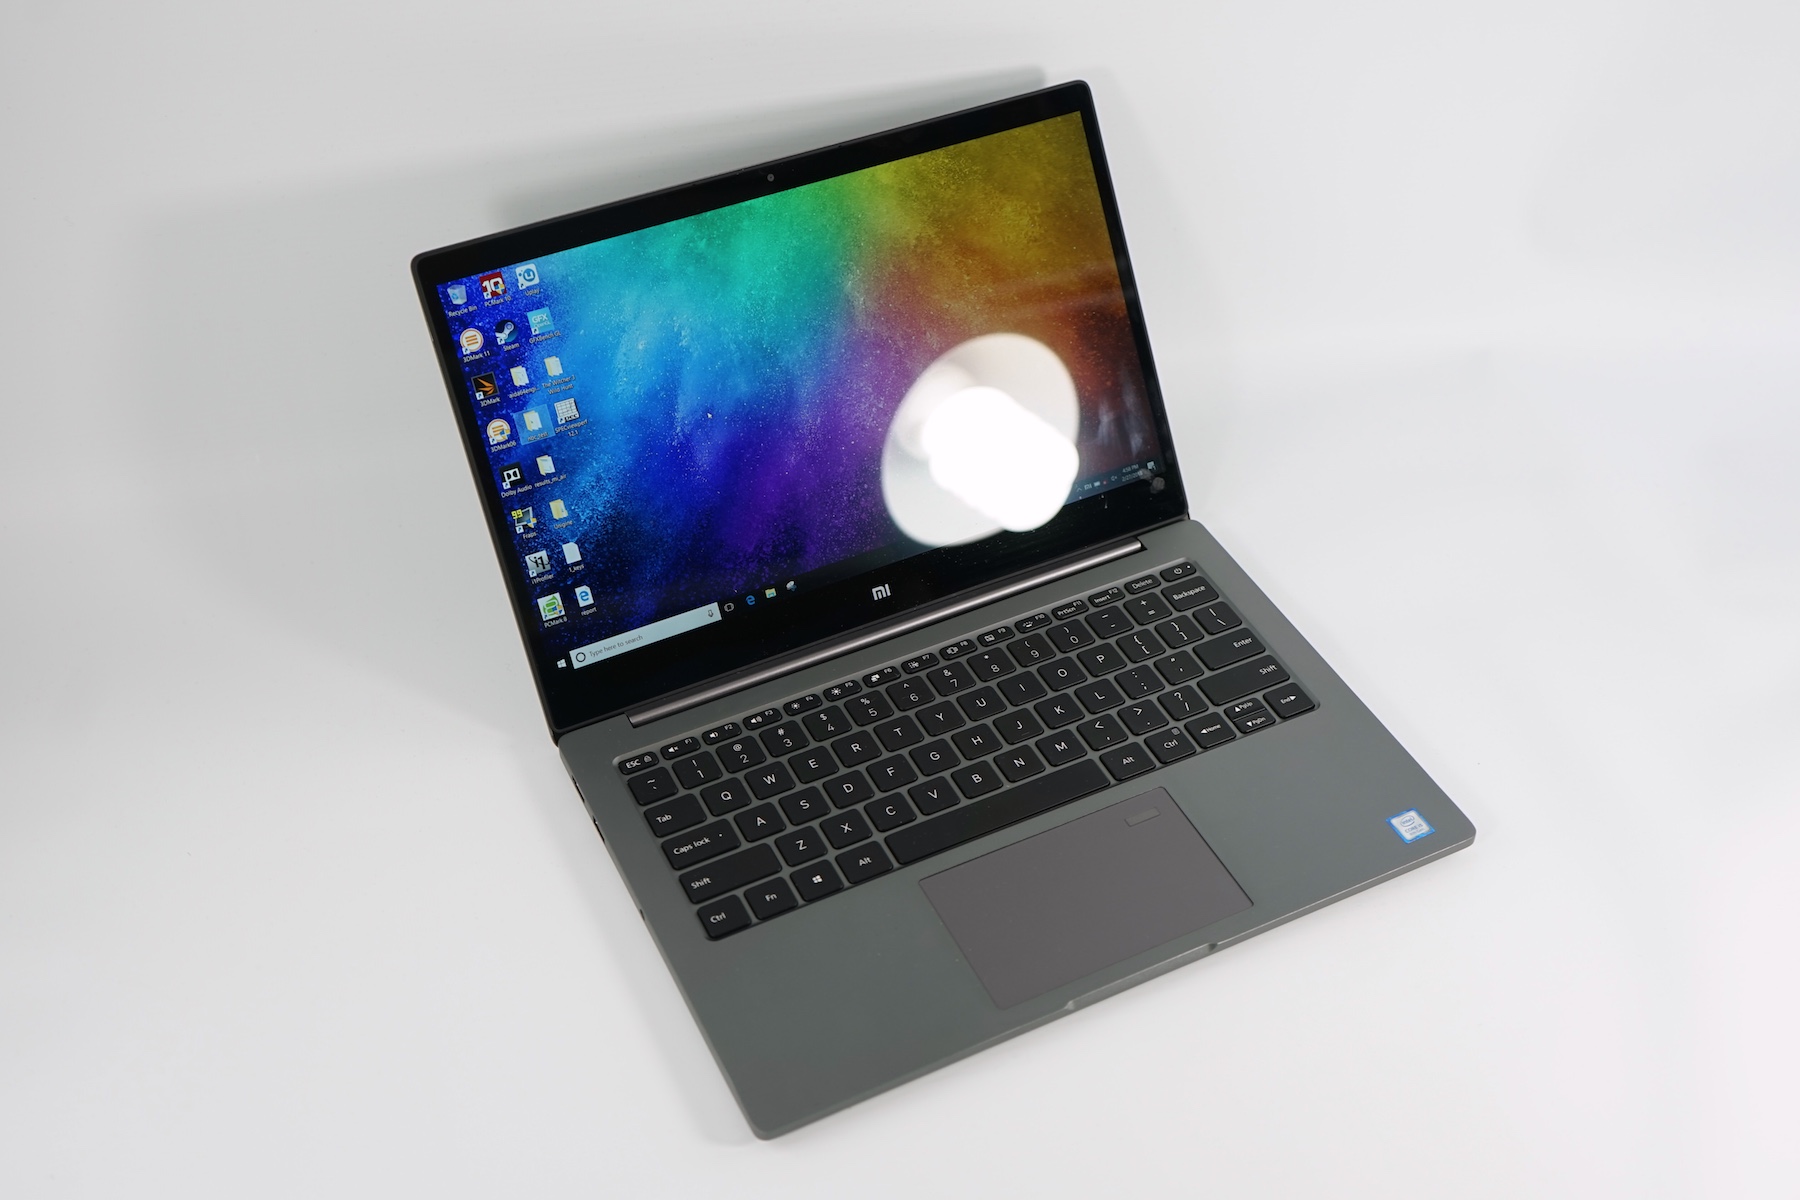
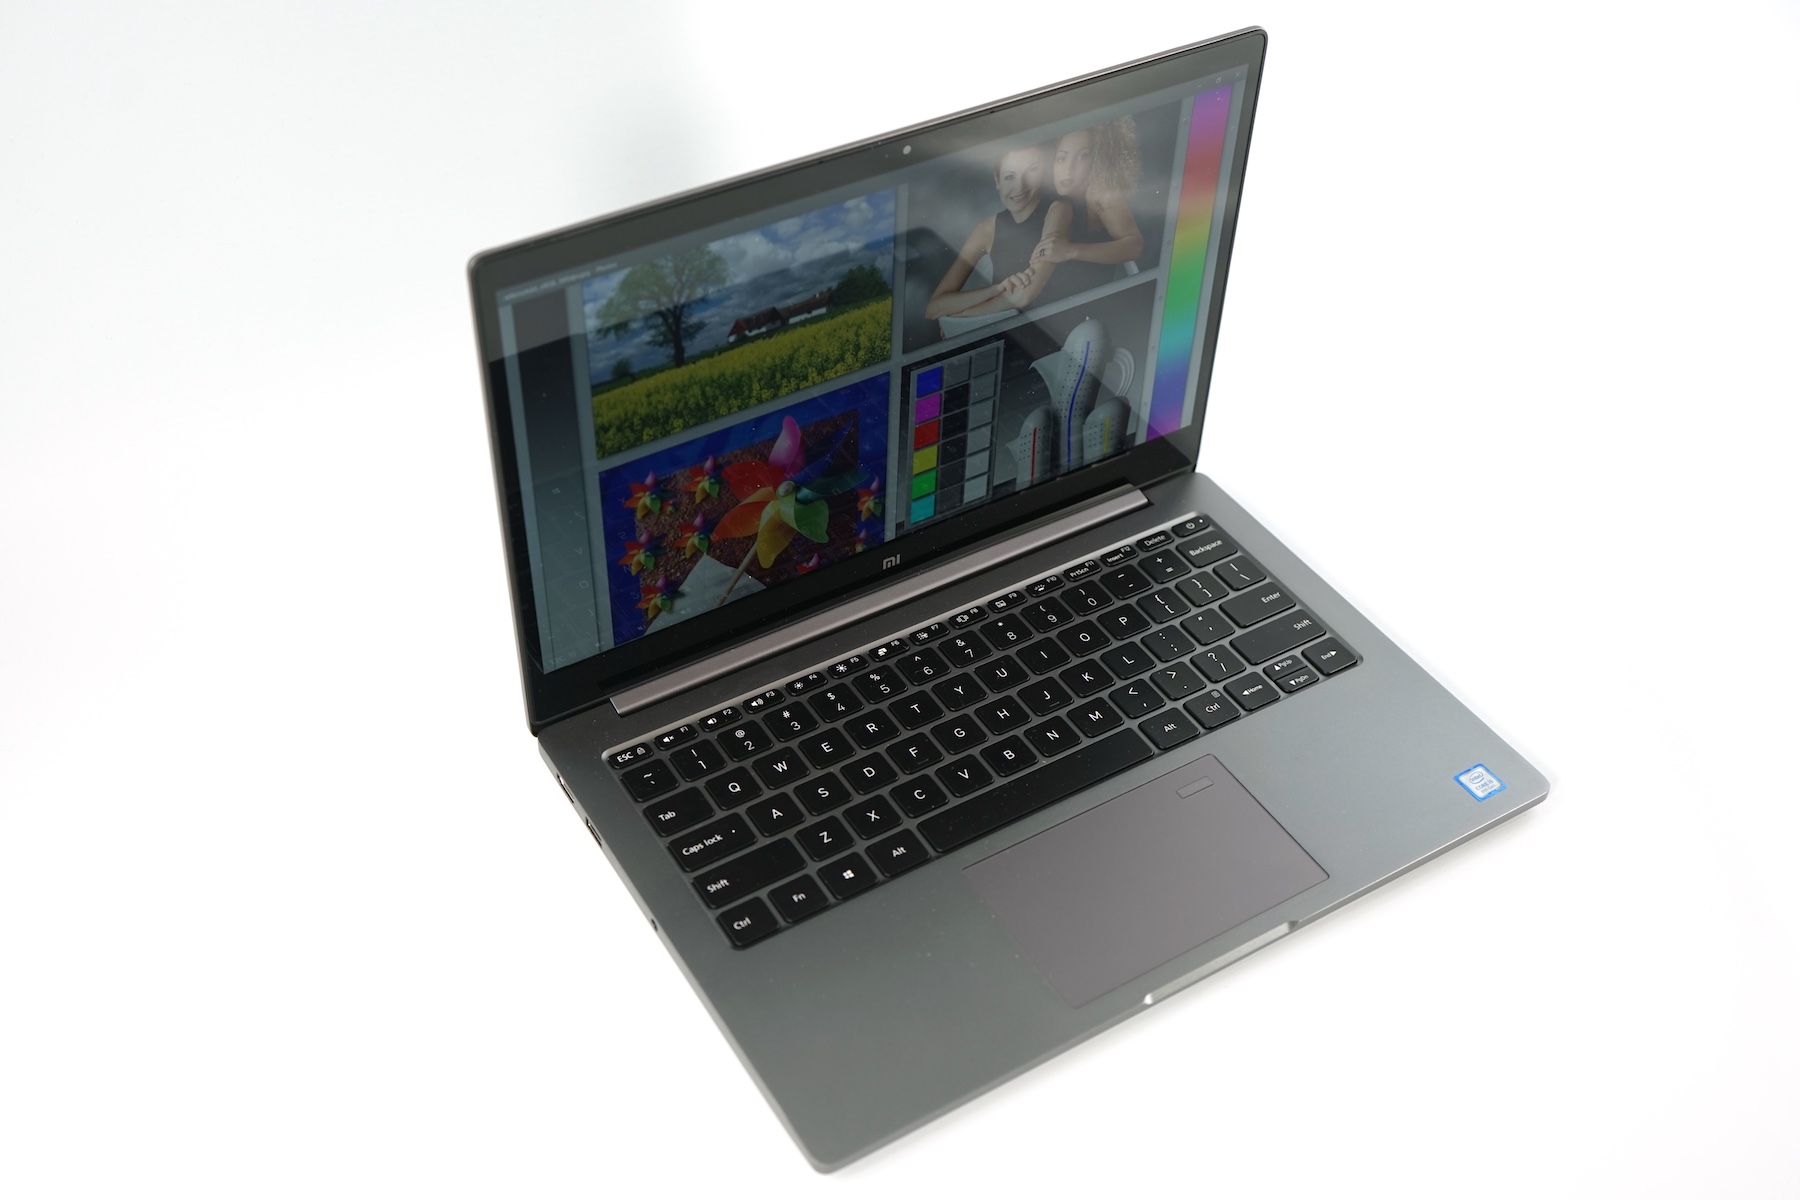
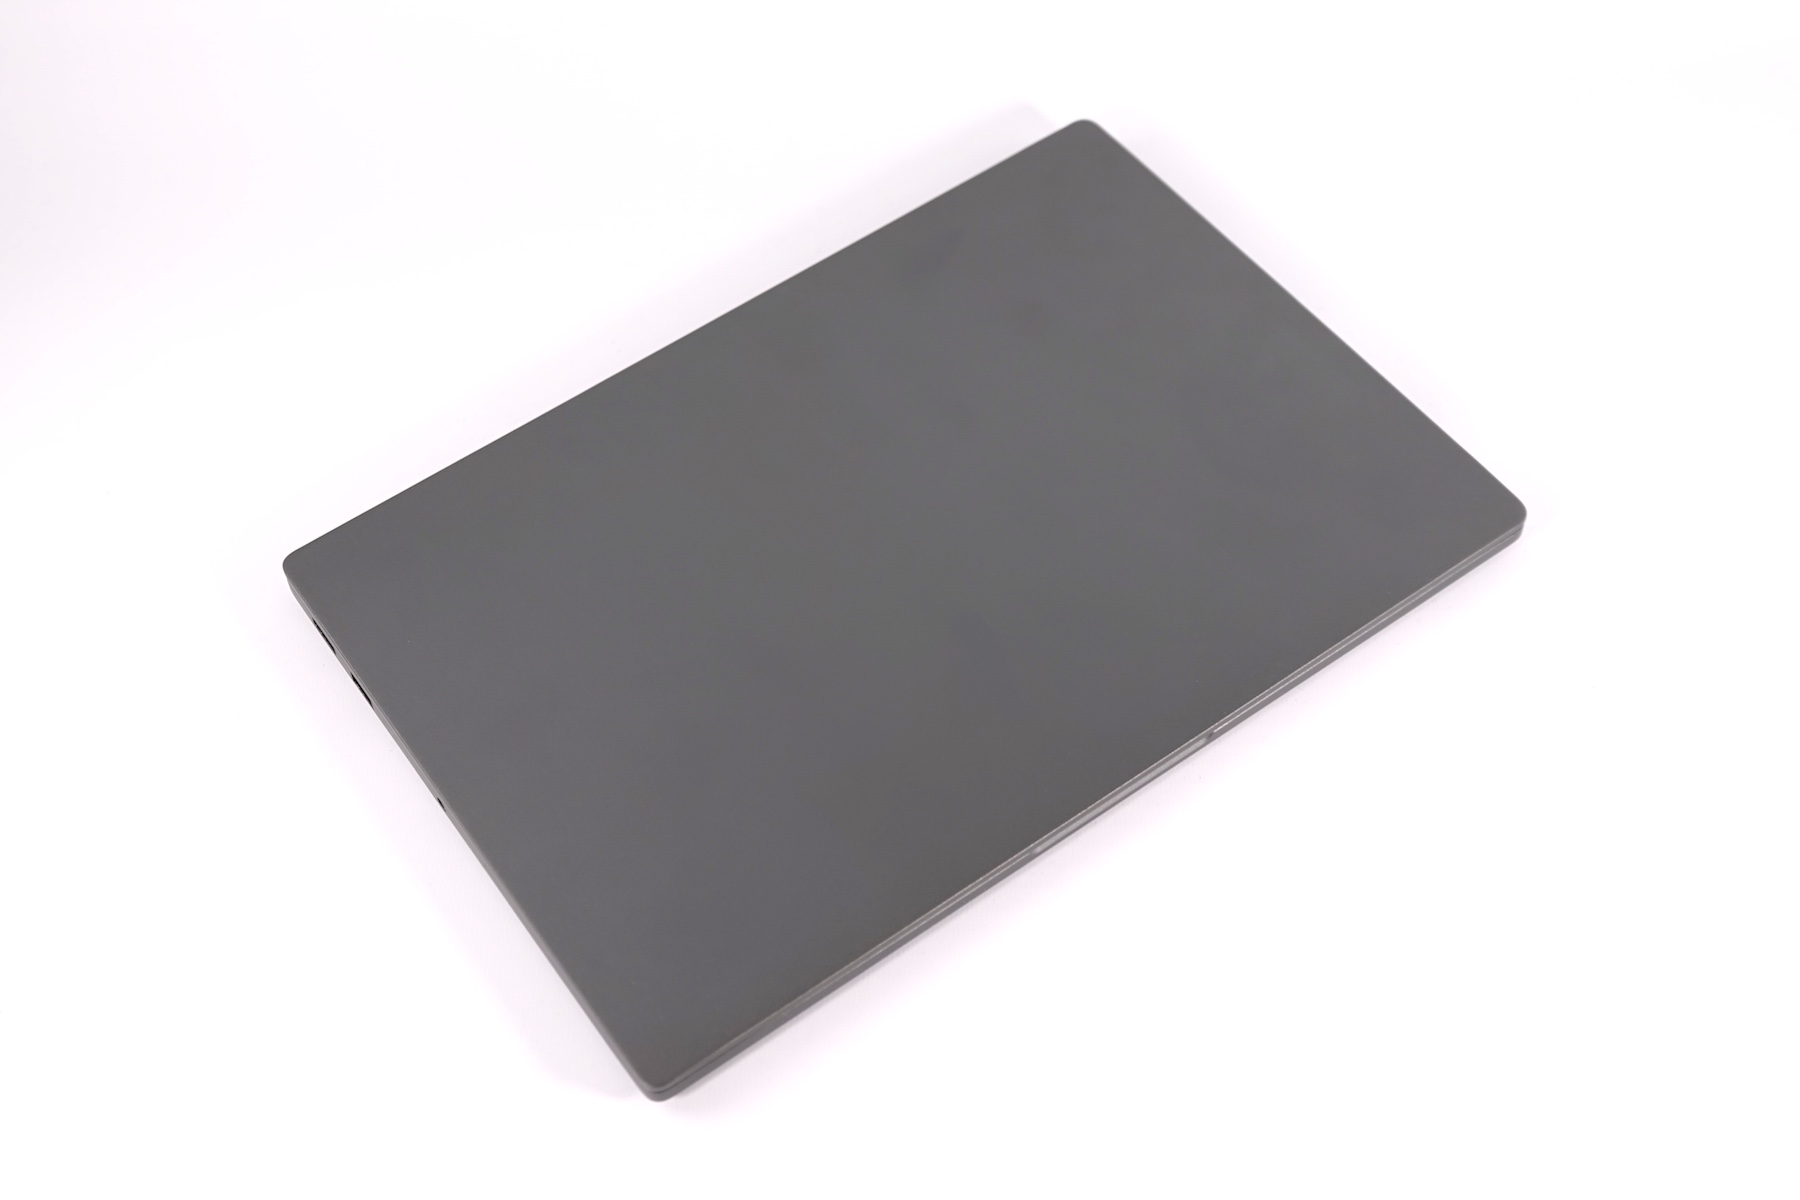
Ao importar um dispositivo diretamente da China, uma das justificativas mais importantes é geralmente o baixo preço do dispositivo. Dado que o portátil ainda não está disponível fora da China, deve se superar vários obstáculos ao longo do caminho, entre outros, o fato de toda a decisão de compra se basear unicamente nos comentários de outras pessoas, pois não há maneira de olhar mais de perto dispositivo em uma loja próxima. Pelo menos no que diz respeito à qualidade, podemos garantir que nossa unidade de análise foi muito mais do que apenas aceitável. Tenha em mente que os custos de envio, alfândega e impostos de importação podem tornar o dispositivo muito mais caro no final e que a uma reivindicação de garantia desde outro continente tem o potencial de se transformar em um pesadelo em um piscar de olhos. Uma vez comprado, enviado e recebido, os compradores são encaram uma versão chinesa do Windows que, a menos que estejam confortáveis com o mandarim, deve ser substituída por uma versão em inglês do sistema operacional.
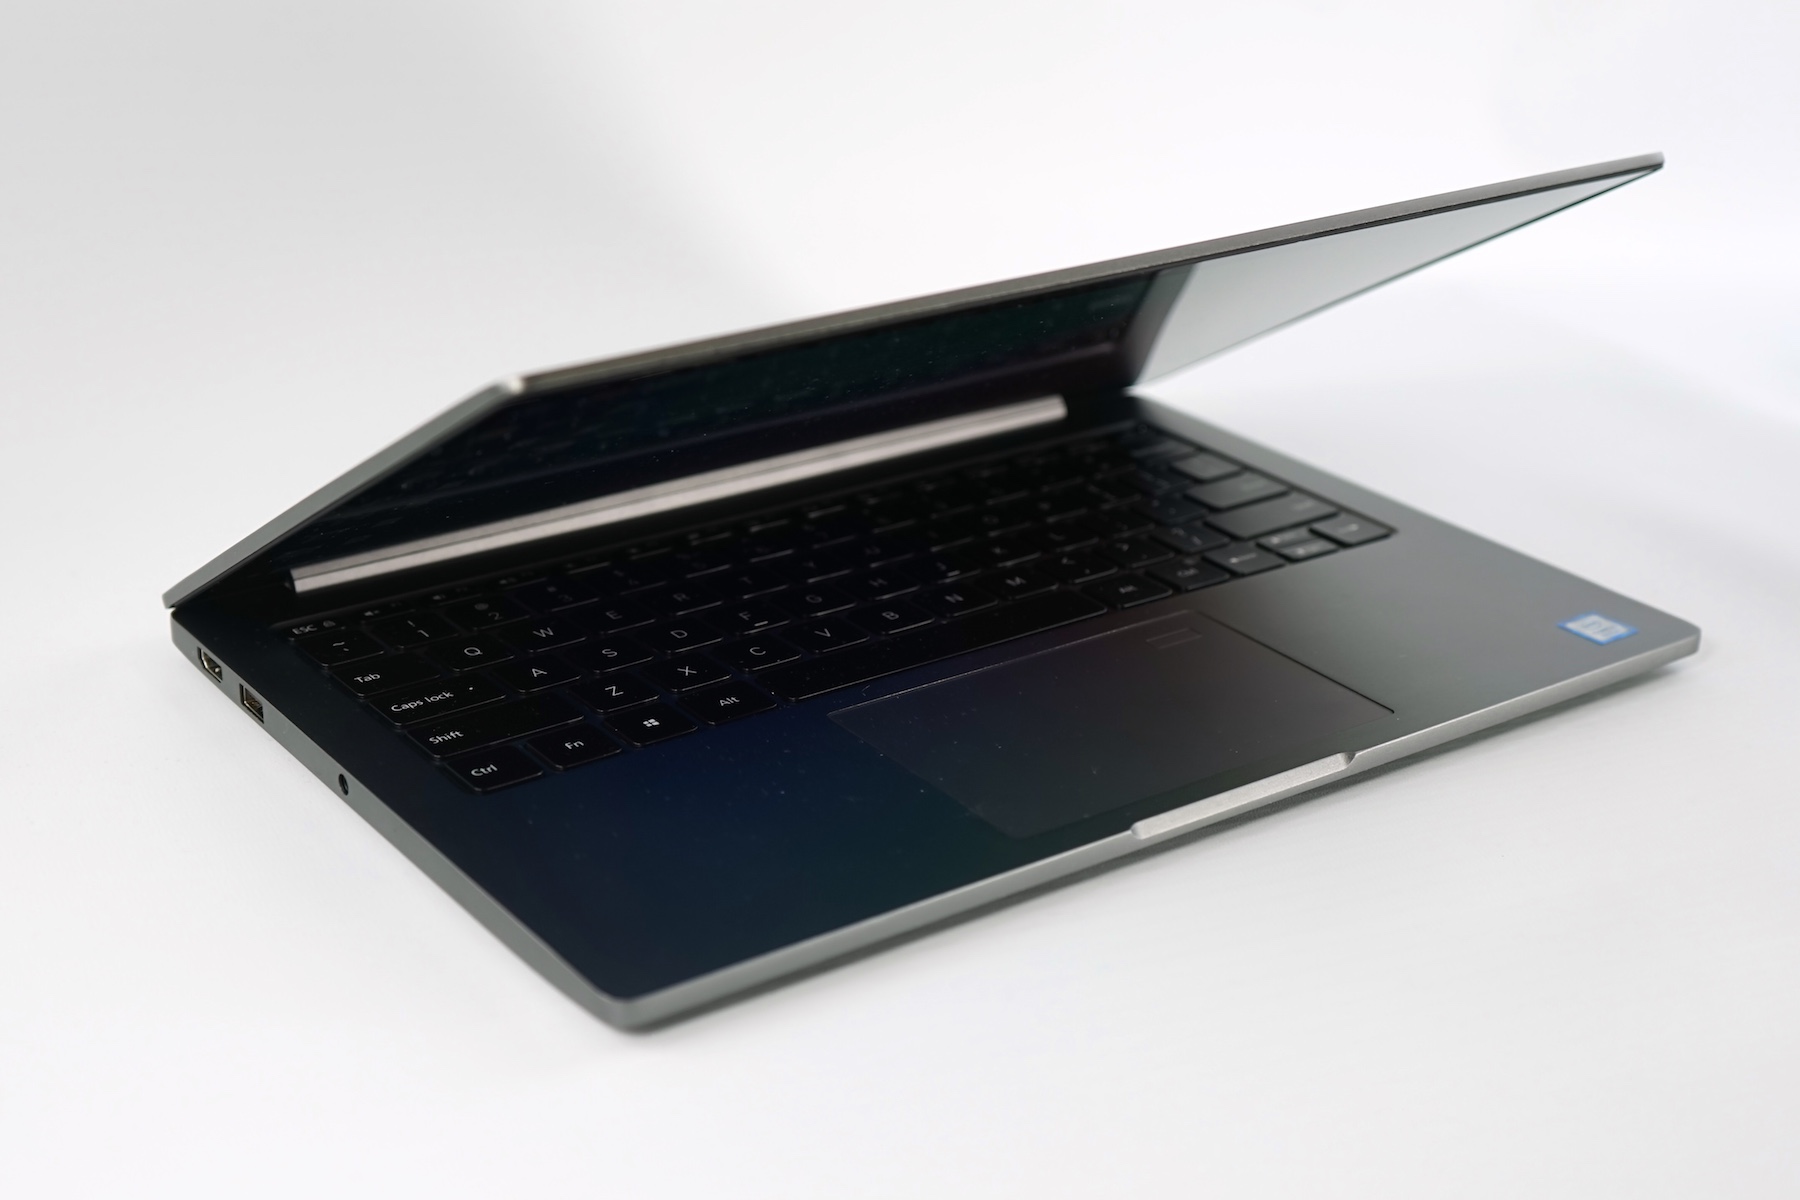
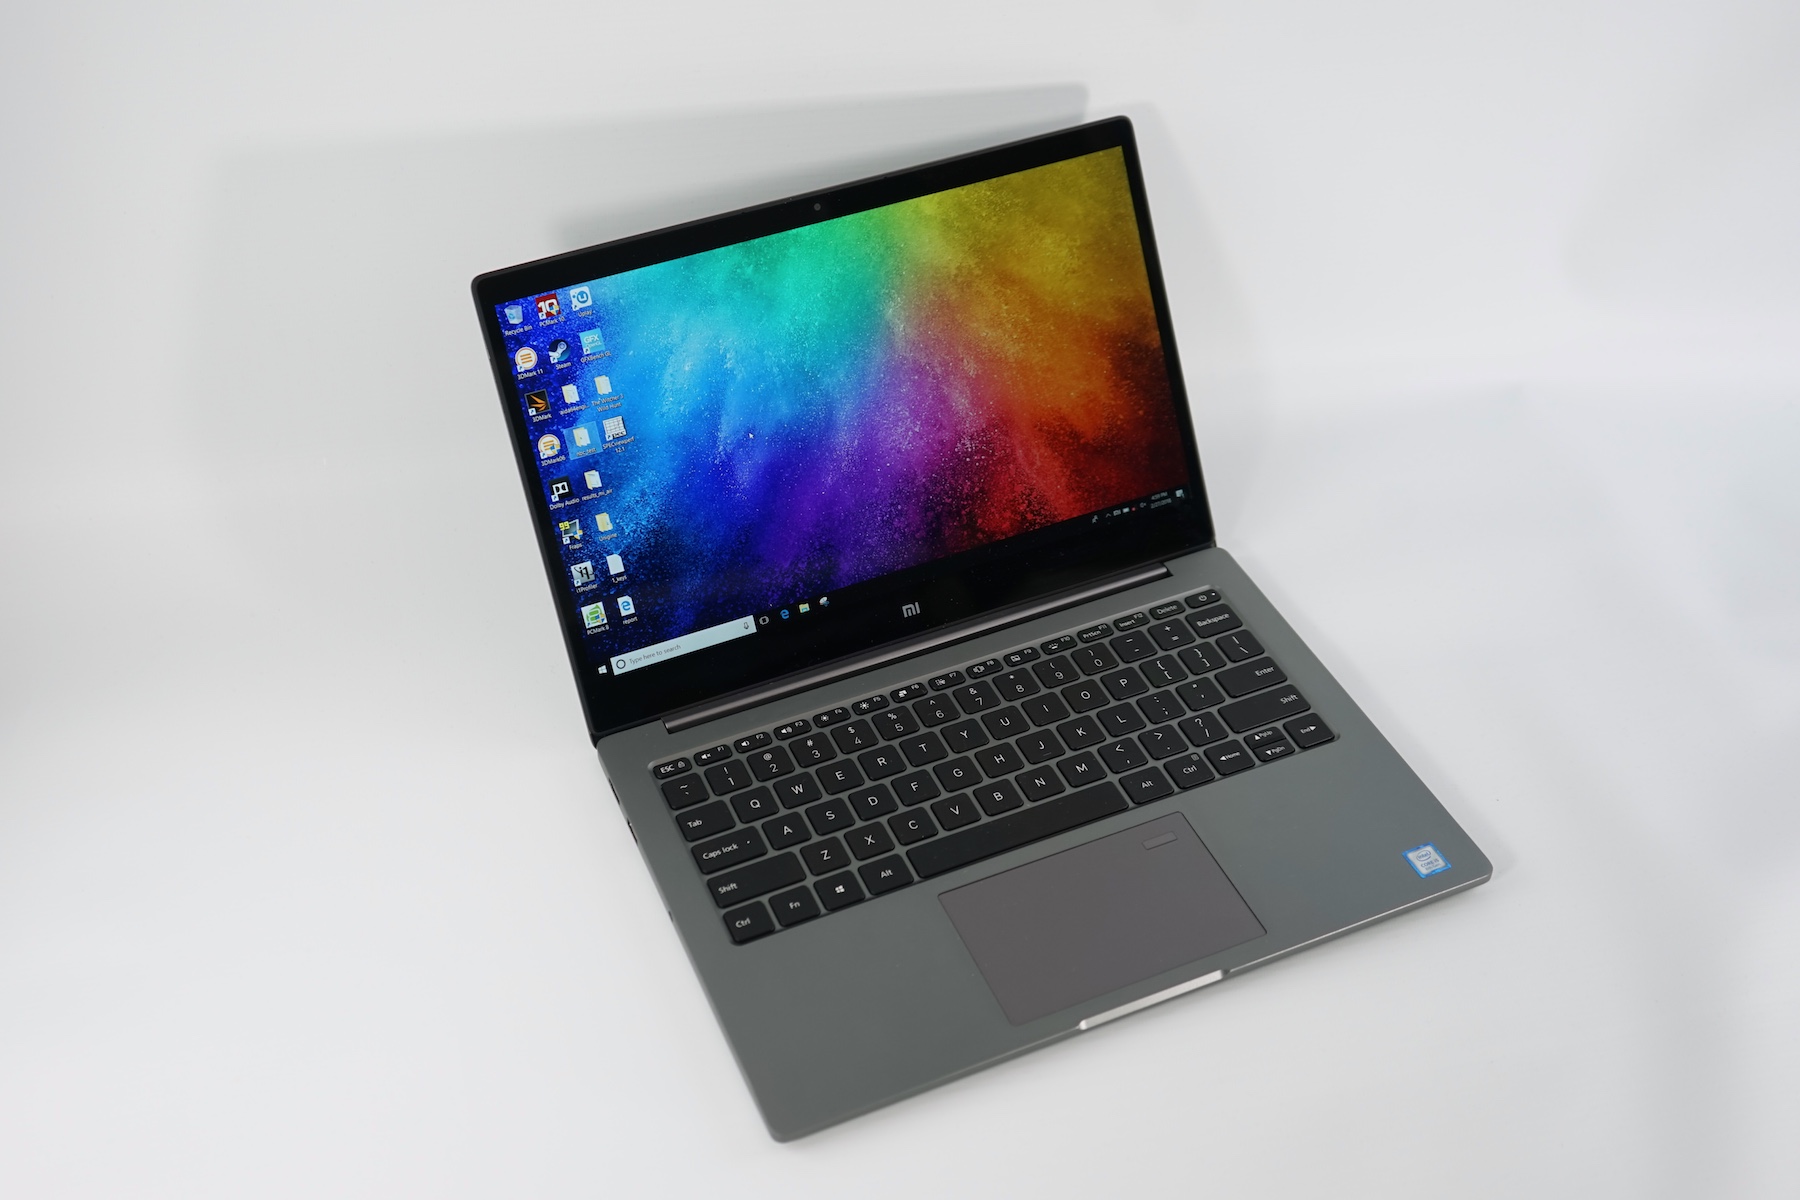
De um modo geral, o Mi Notebook Air equipado com MX150 é bastante decente. Apesar do carcaça fina e compacta, é capaz de curtos períodos de alto desempenho de CPU, e o desempenho da GPU é adequado para muitos jogos atuais.
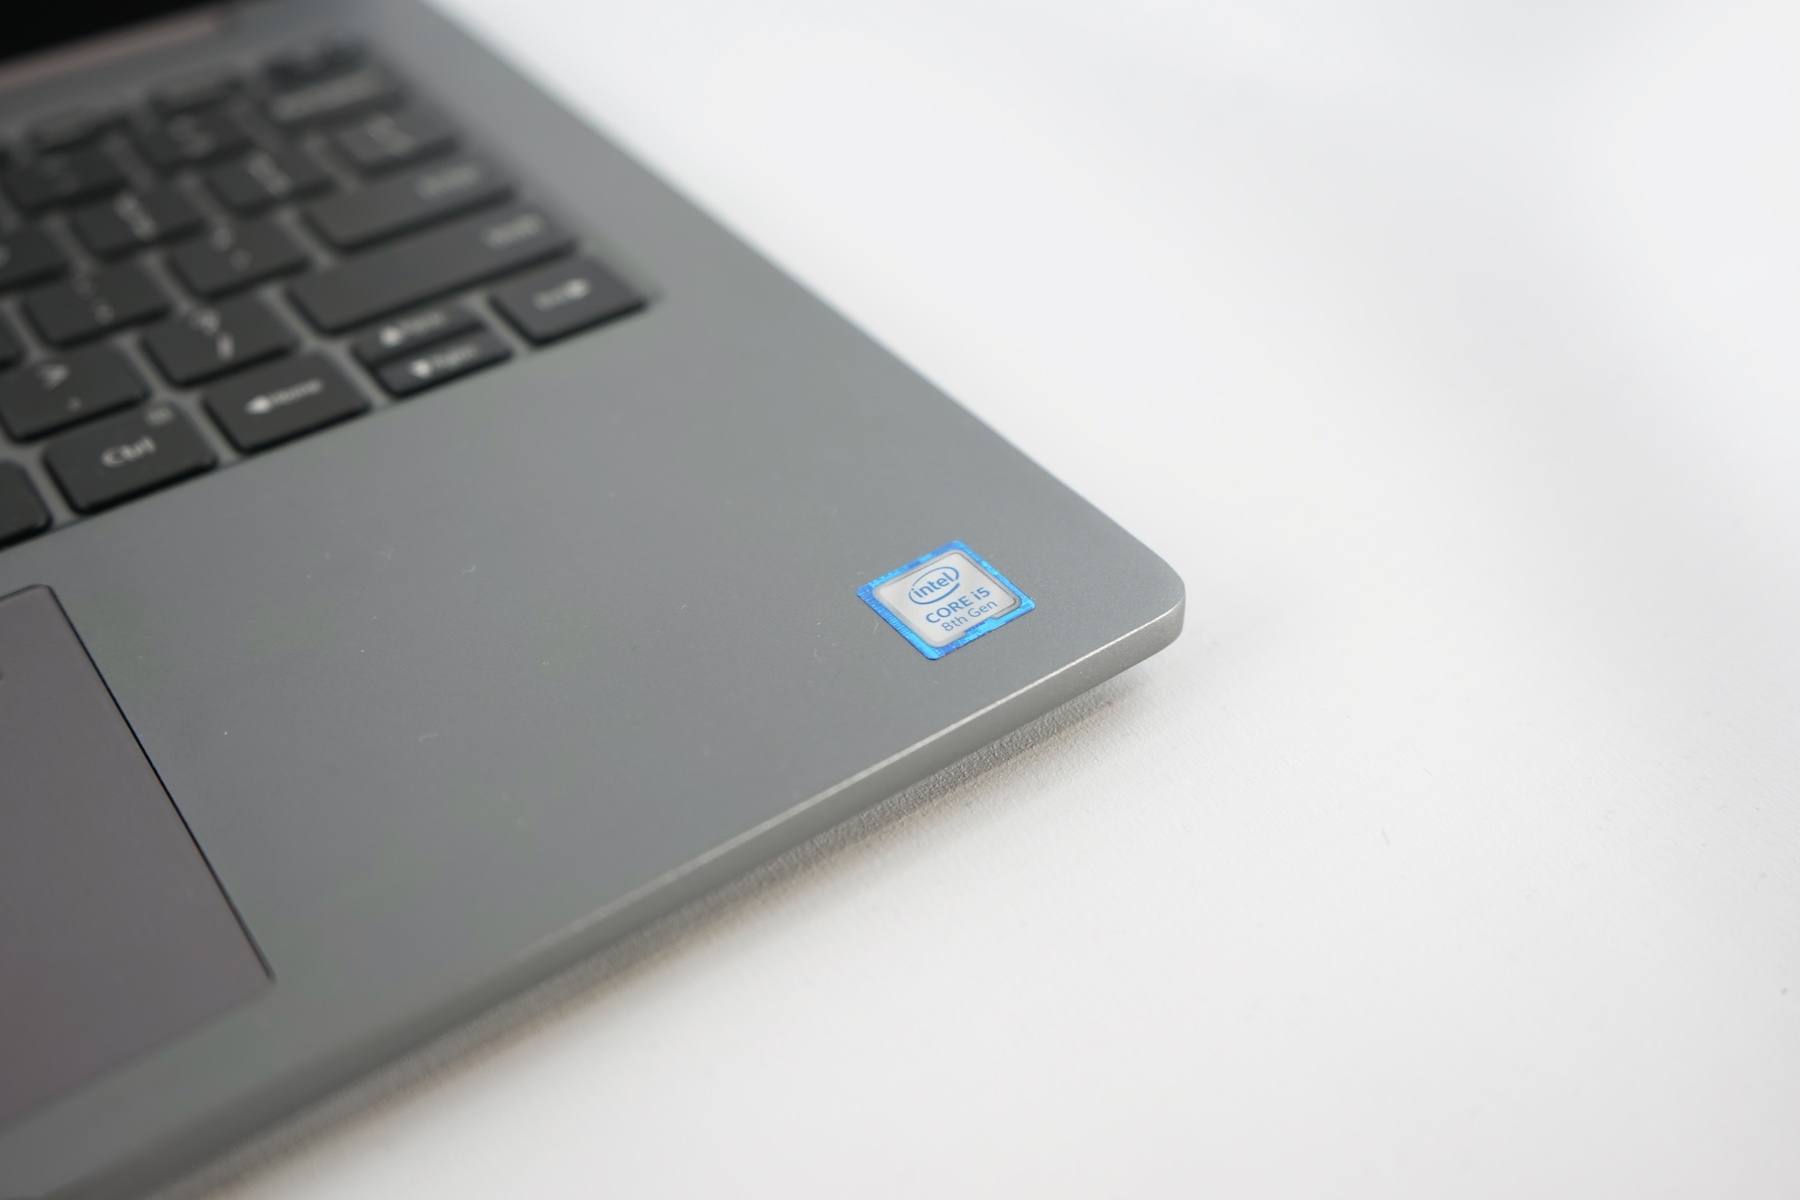
Infelizmente, o calor e o ruído sob carga eram muito altos, e o Mi Notebook Air certamente teria se beneficiado de uma carcaça atualizada e modificada. As altas temperaturas da superfície, o afogamento térmico e as quedas rápidas no desempenho da CPU são indicações claras de uma carcaça sobrecarregada por seus poderosos componentes internos. Optar pelo SKW MX150 de 10 W também não ajudou muito, e se você precisar de mais desempenho, o modelo de 15 polegadas provavelmente seria a melhor opção.
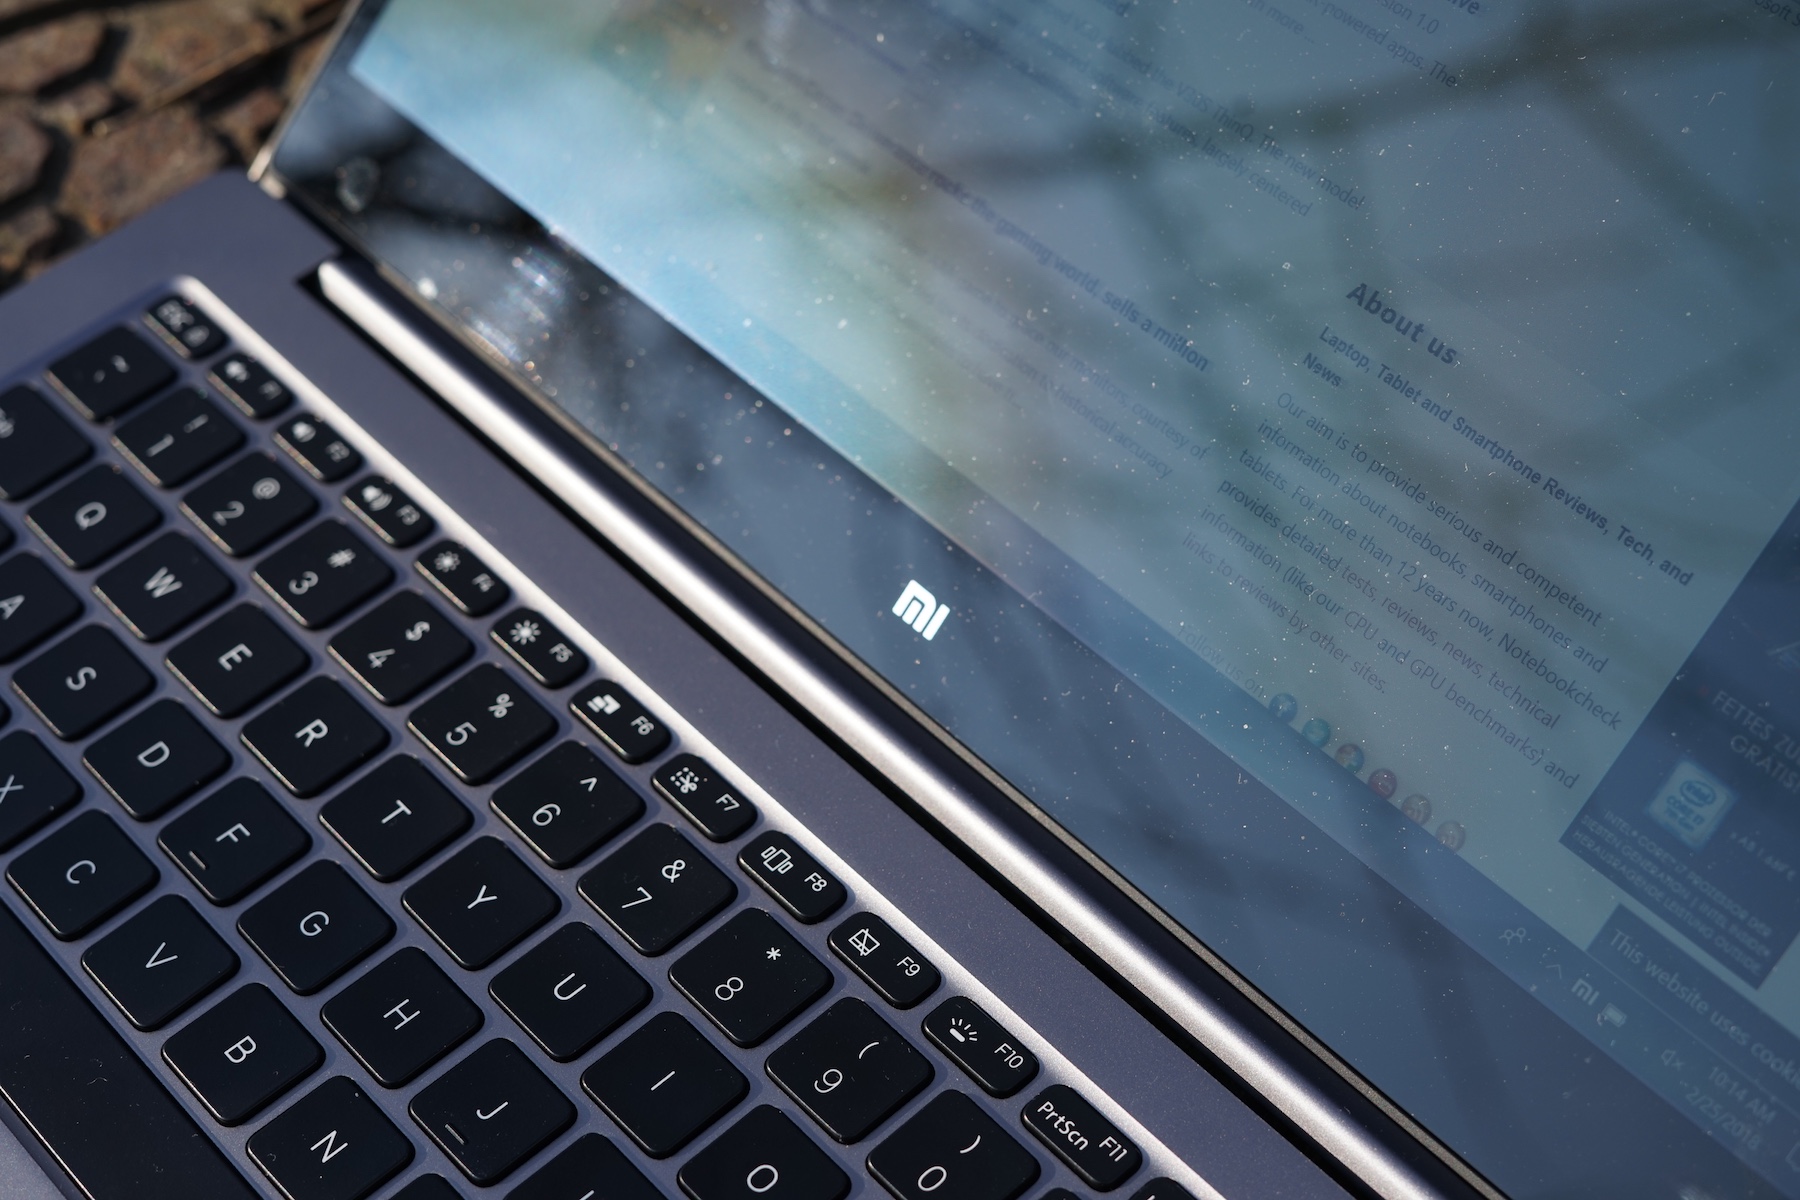
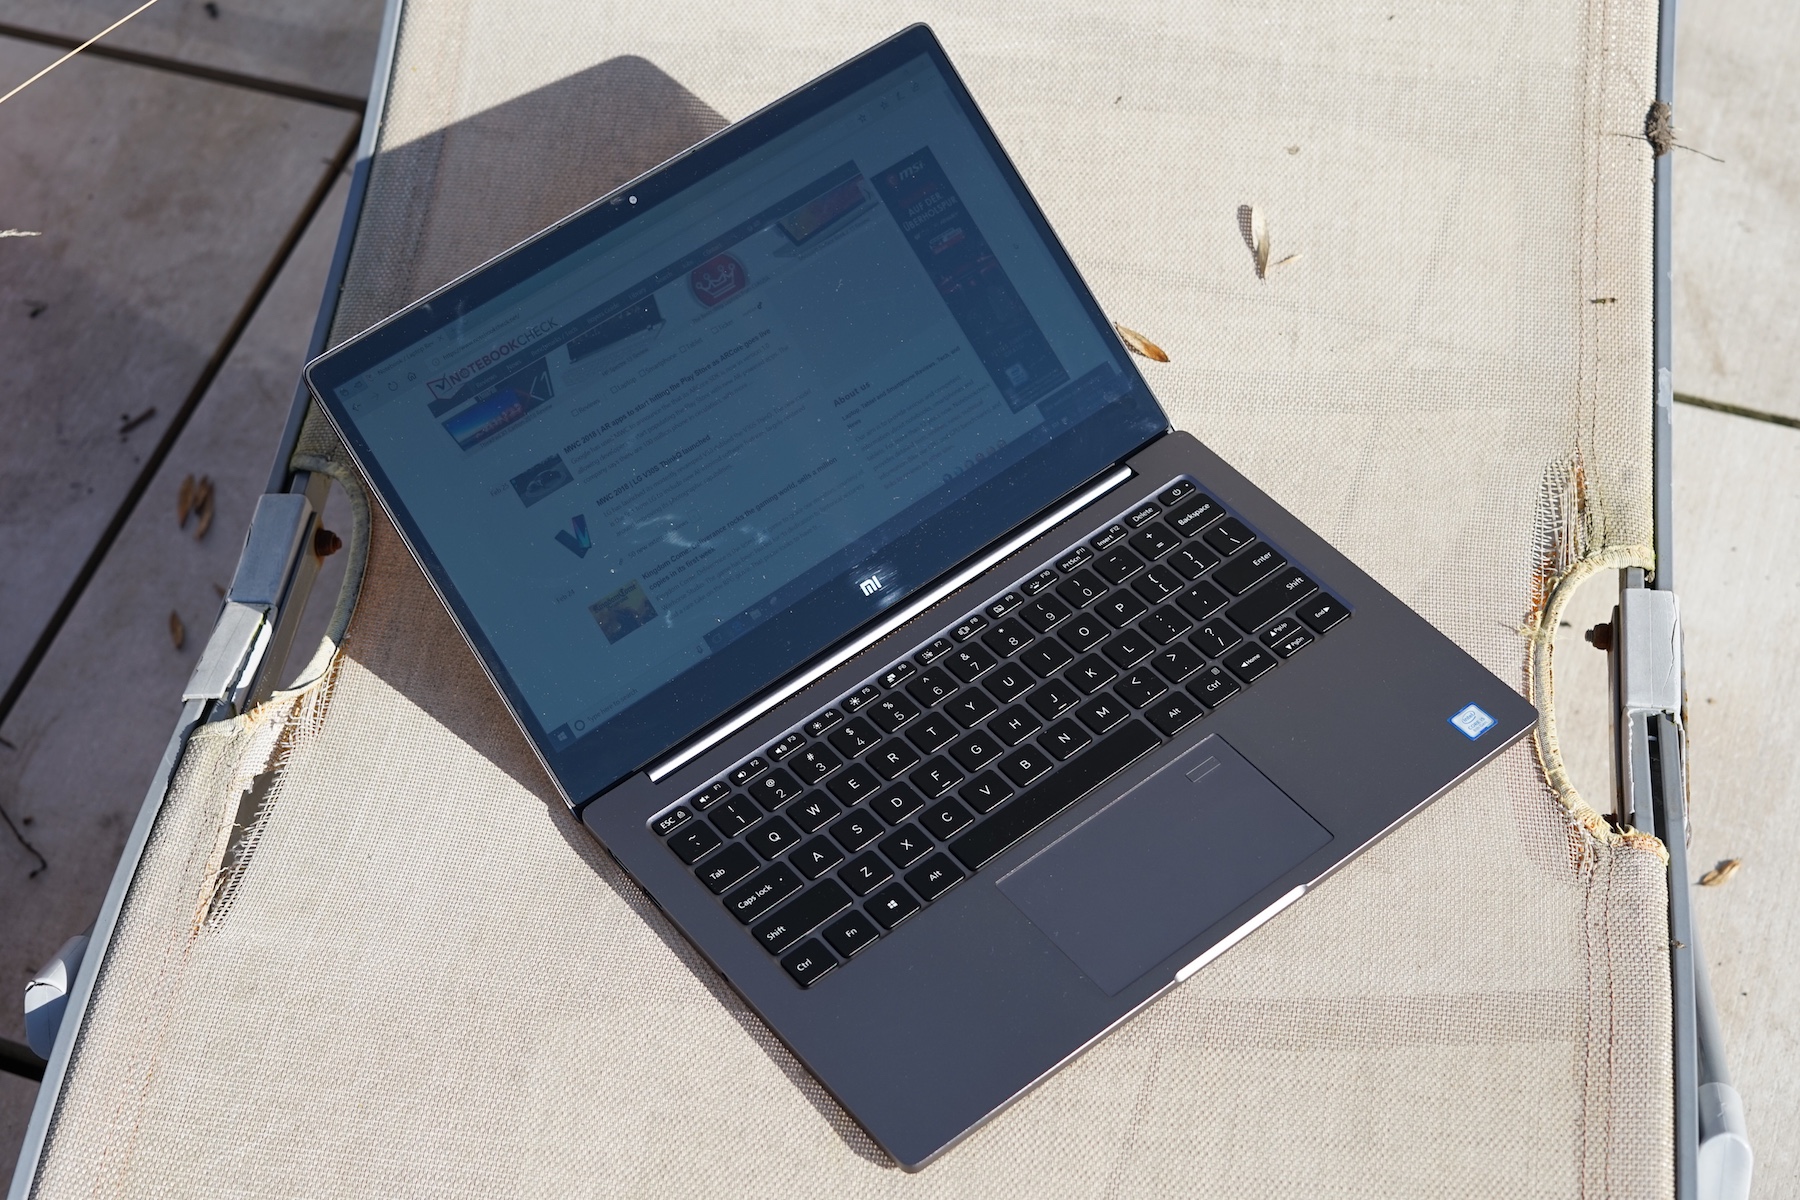
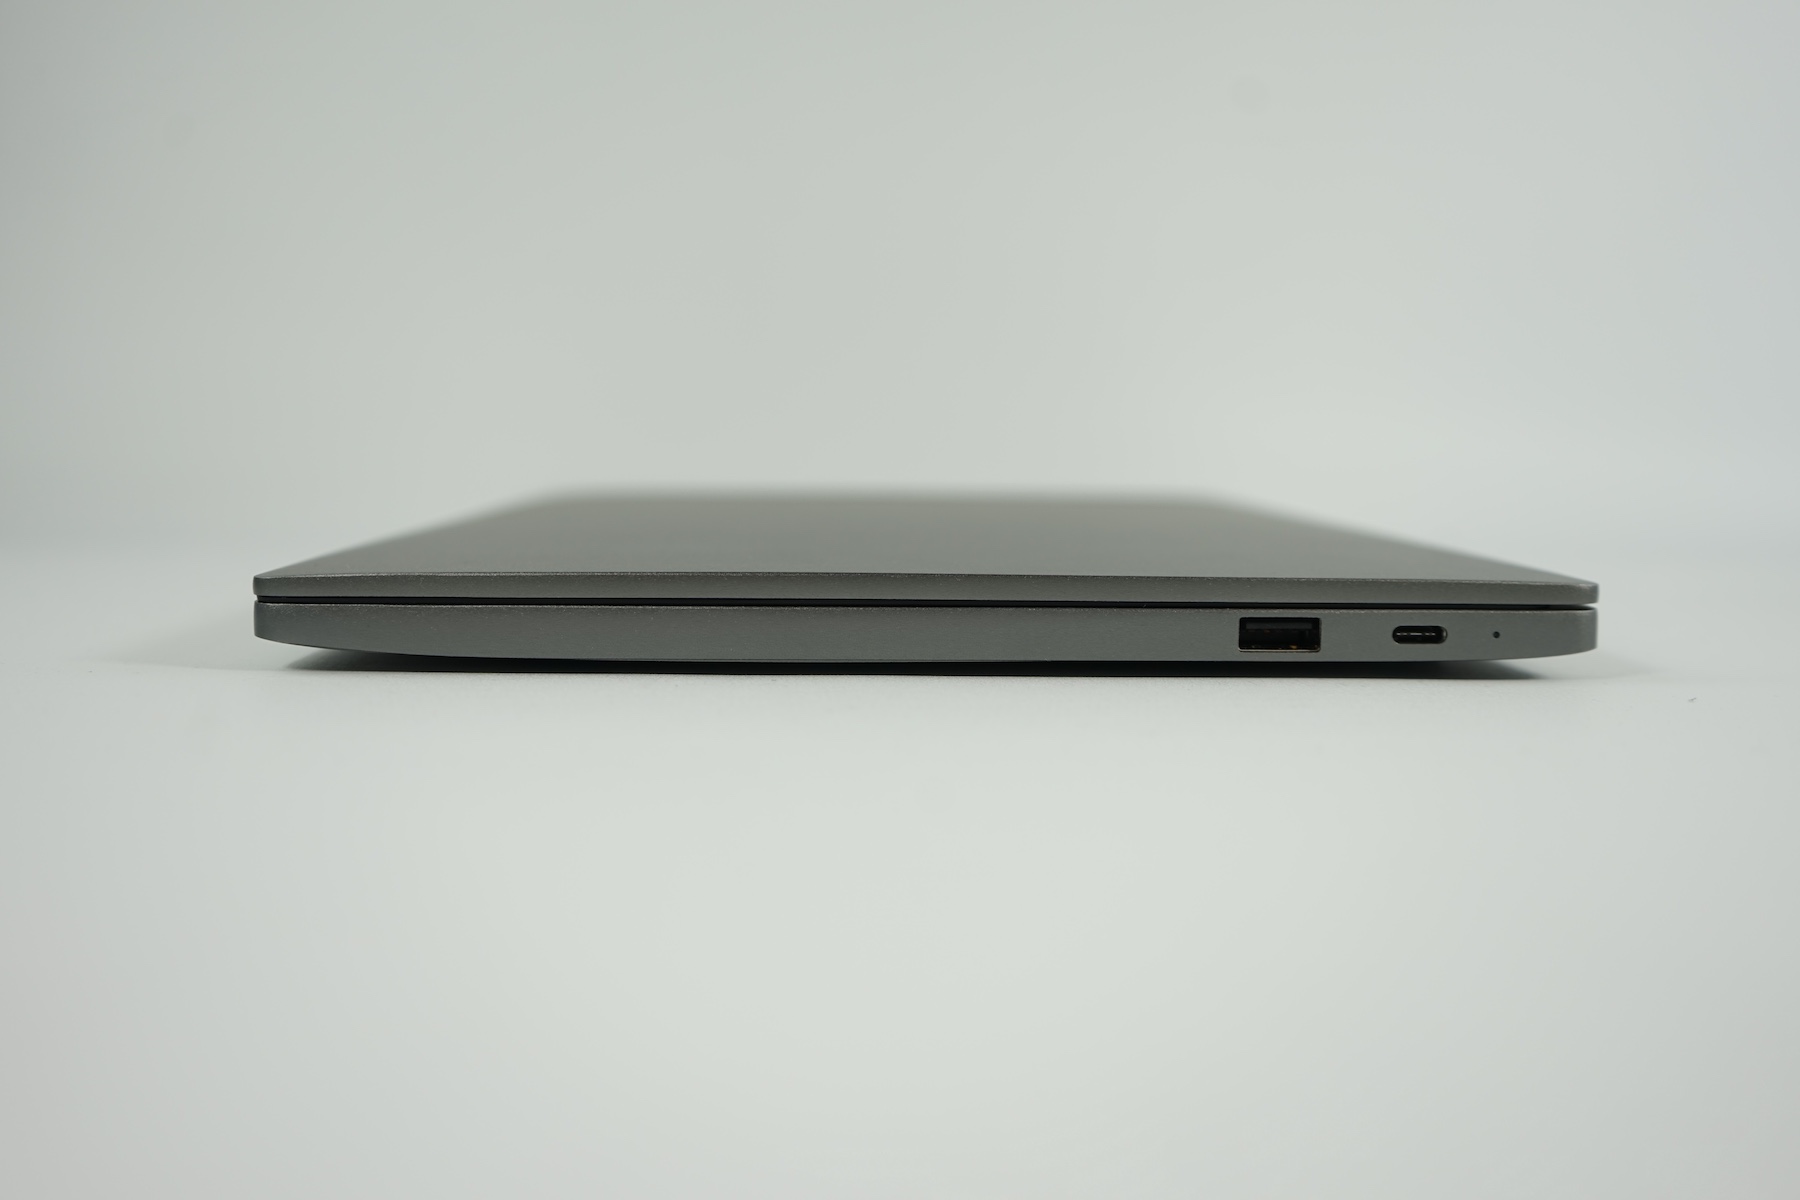
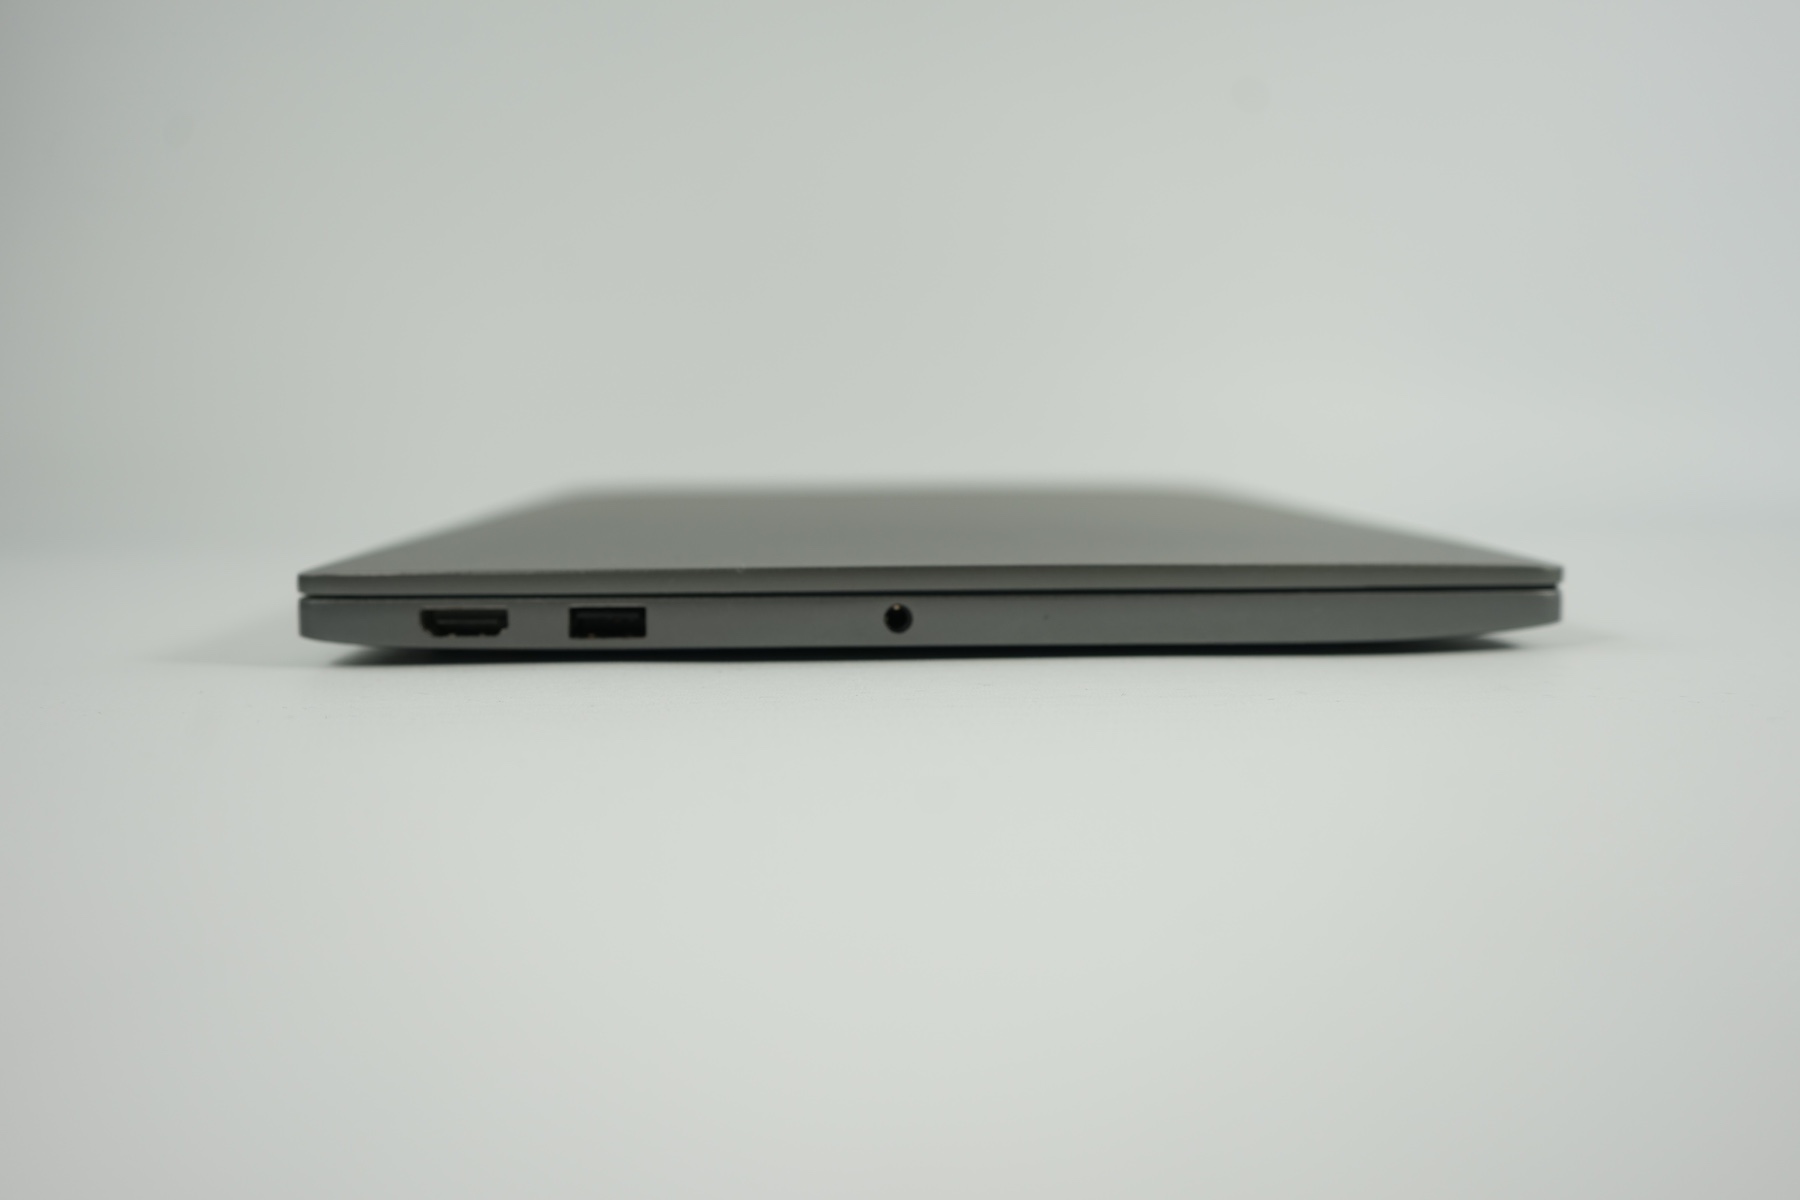
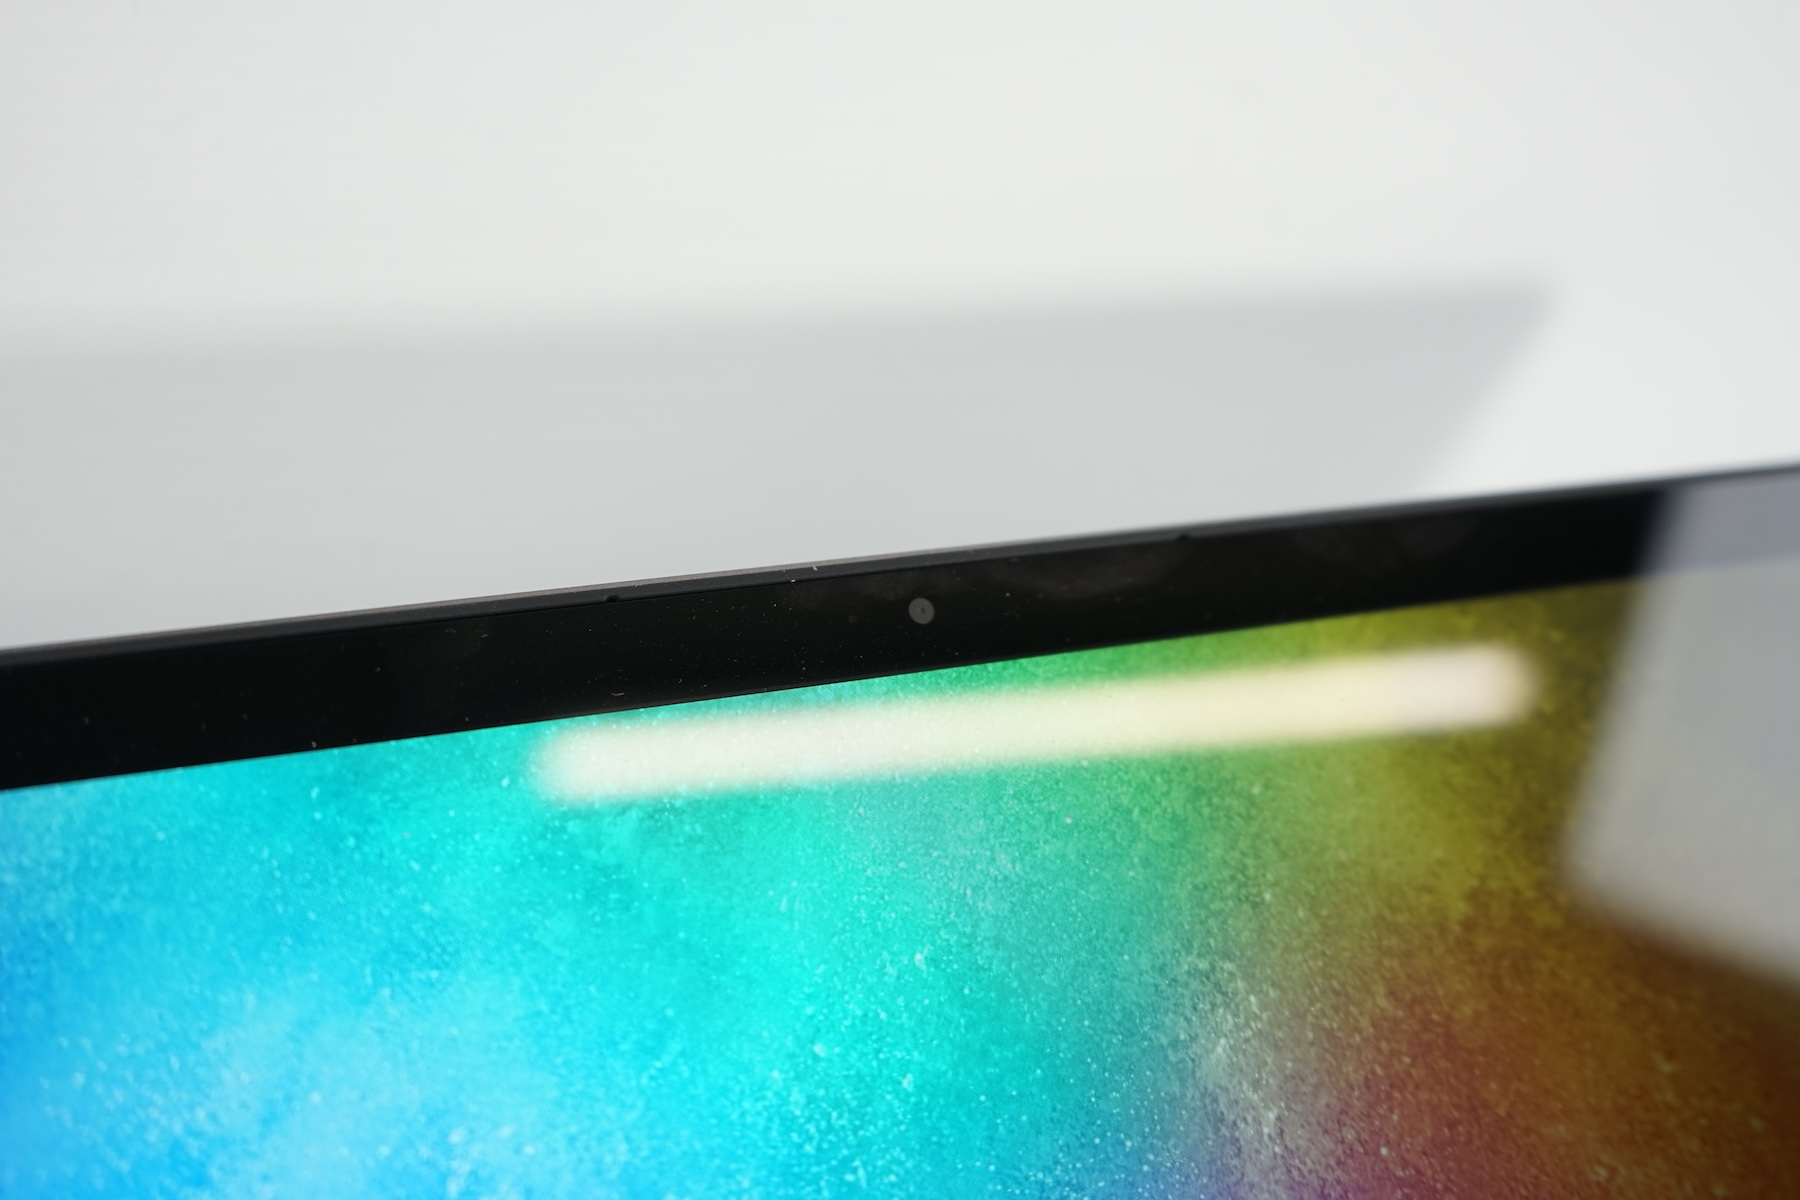
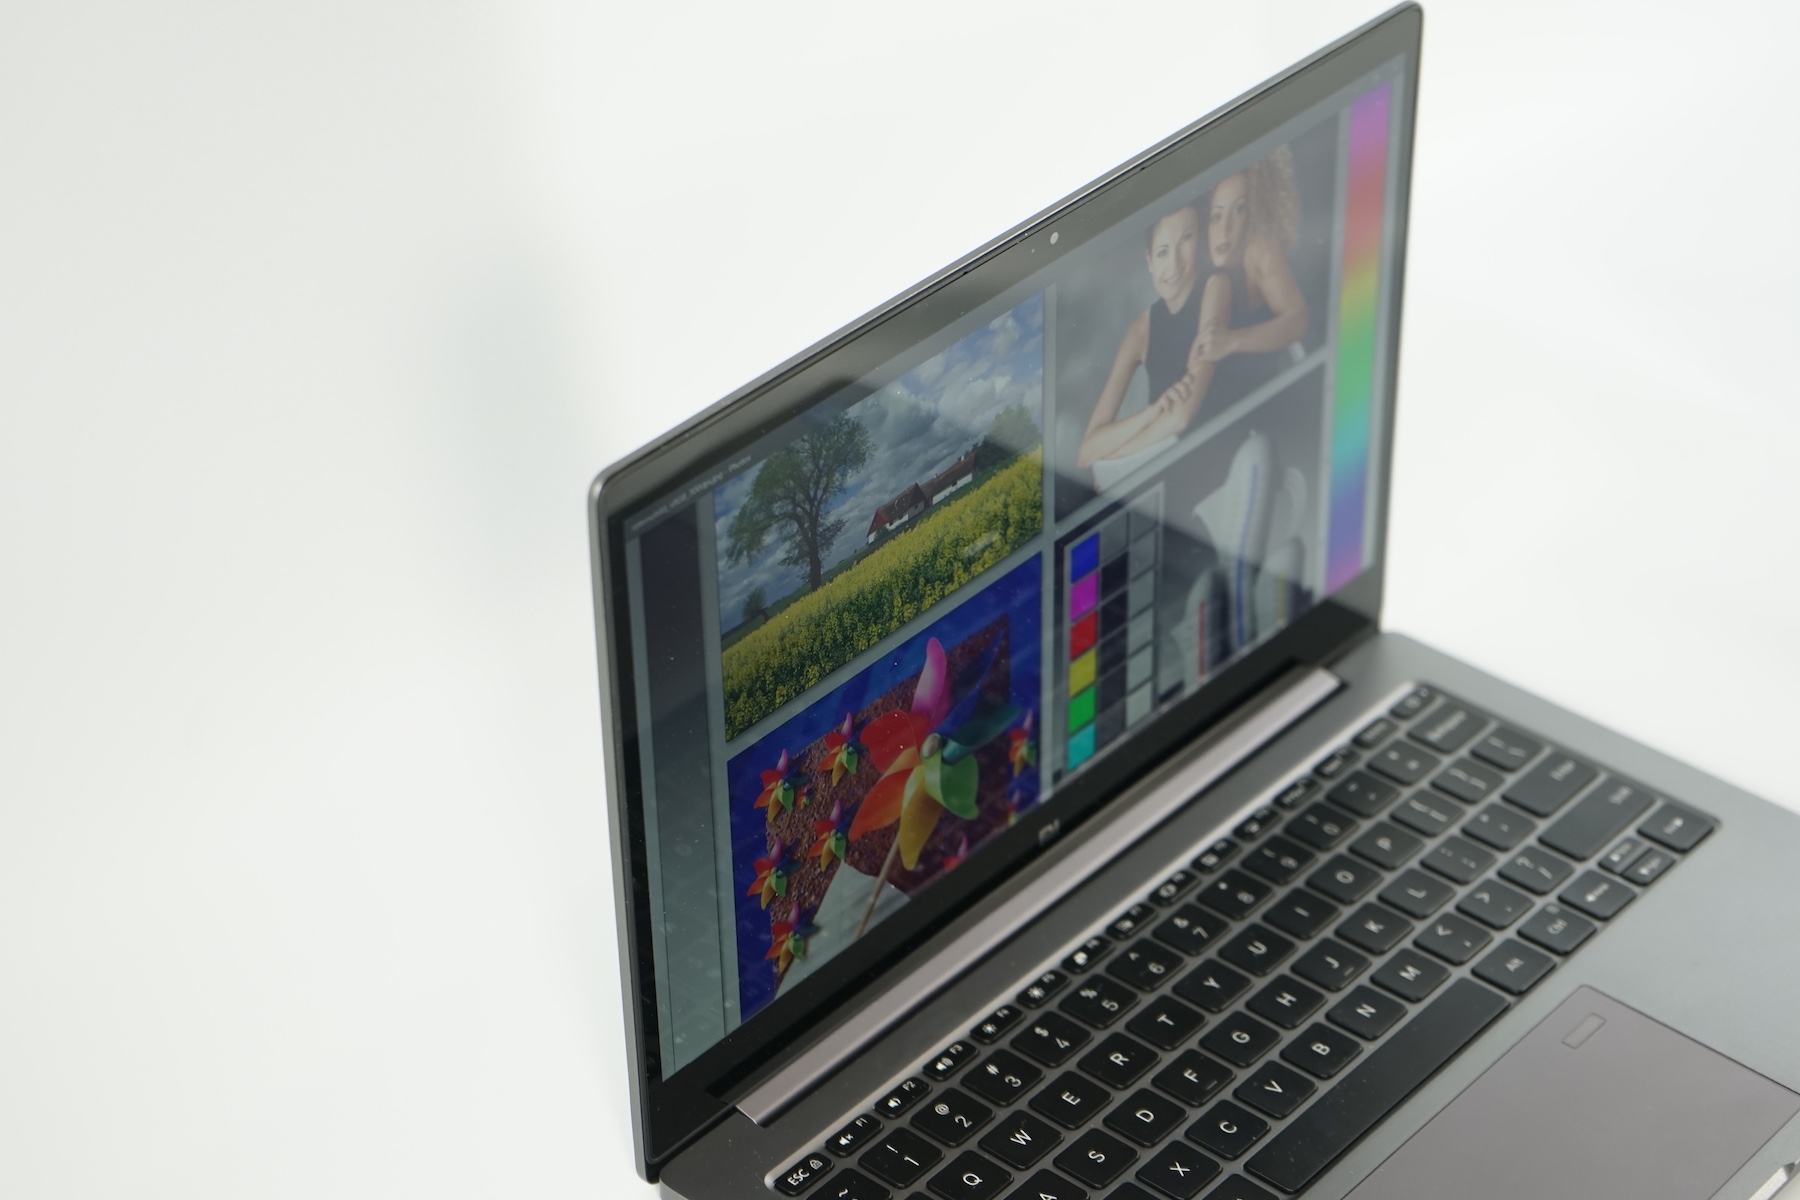
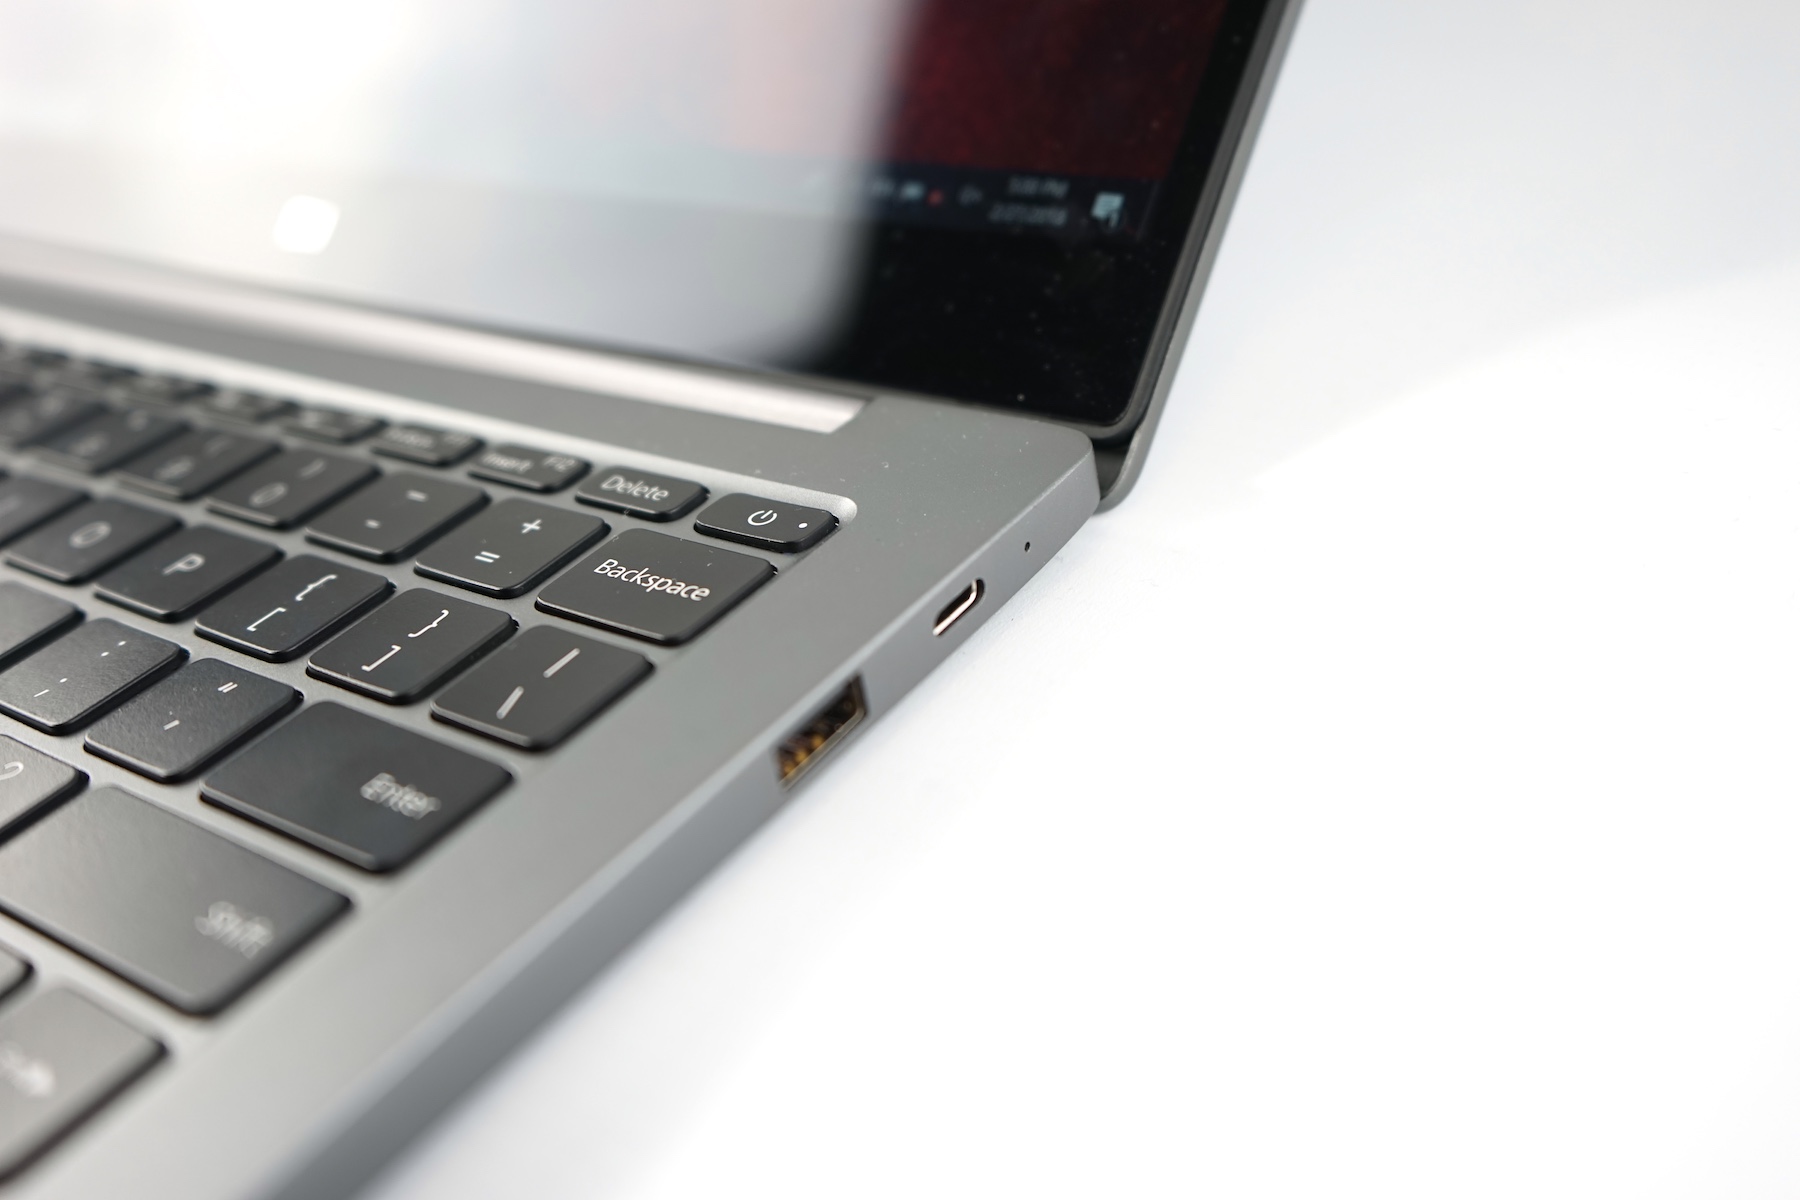
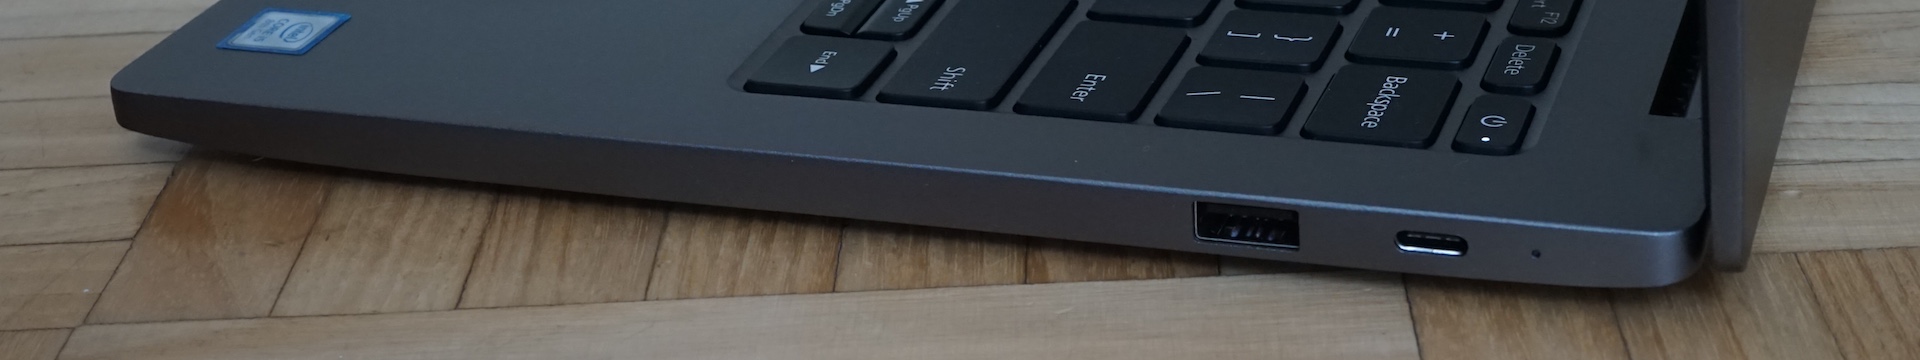
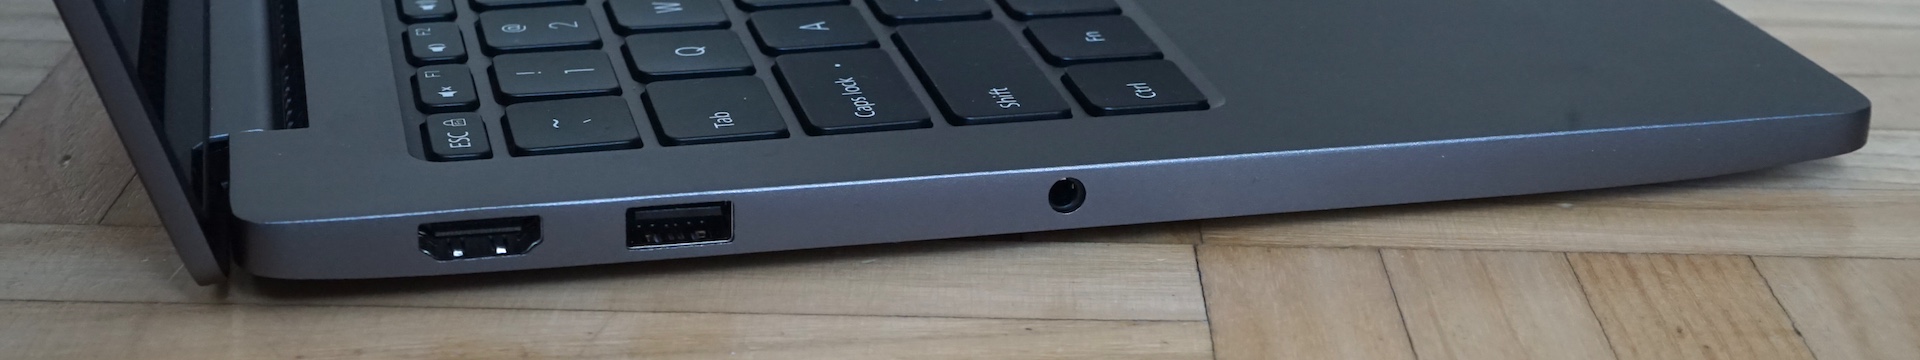
A tela brilhante de 13 polegadas era muito boa, embora também fosse altamente refletiva pelo design. Aqueles de nossos leitores que planejam usar o portátil principalmente de forma estacionária, conectado a um monitor externo devem manter a limitação de 30 Hz da porta HDMI em mente. Embora a porta USB-C suporte 60 Hz, é mais provável que ela seja conectada na tomada neste cenário. A duração da bateria estava abaixo do padrão e mais ou menos a par com o antecessor mais lento do dispositivo.
Alternativas de 13 polegadas equipadas com um MX150 são raras na faixa de preços do Mi Air, o que torna este portátil muito mais interessante. O Lenovo IdeaPad 320S (13 polegadas, Core i5-8250U) foi consideravelmente mais lento em todos os benchmarks de CPU e GPU, e o HP Envy 13 ao mesmo tempo em que consegue acompanhar o desempenho da GPU (graças à sua GPU MX150) quando comparado ao desempenho da CPU obteve 32% menos no teste multicore do Cinebench devido ao seu processador dual-core Core i7-7500U mais antigo. Por outro lado, suas pontuações PCMark foram semelhantes às do Air. No entanto, o chip de sétima geração da Intel com apenas dois núcleos, é uma notícia antiga em 2018.
Por isso, se você estiver procurando por um subportátil de 13 polegadas acessível e um pouco receptivo a jogos e não se importar com a importação potencialmente aventureira da China, o Xiaomi Mi Notebook Air pode ser a combinação perfeita. No entanto, aconselhamos aos compradores em potencial que também analisem o Xiaomi Mi Notebook Pro de 15 polegadas (Core i5-8250U, GeForce MX150) com um sistema de resfriamento muito mais potente.
Xiaomi Mi Notebook Air 13.3 2018
- 03/20/2018 v6 (old)
Klaus Hinum, Daniel Puschina
Price comparison
