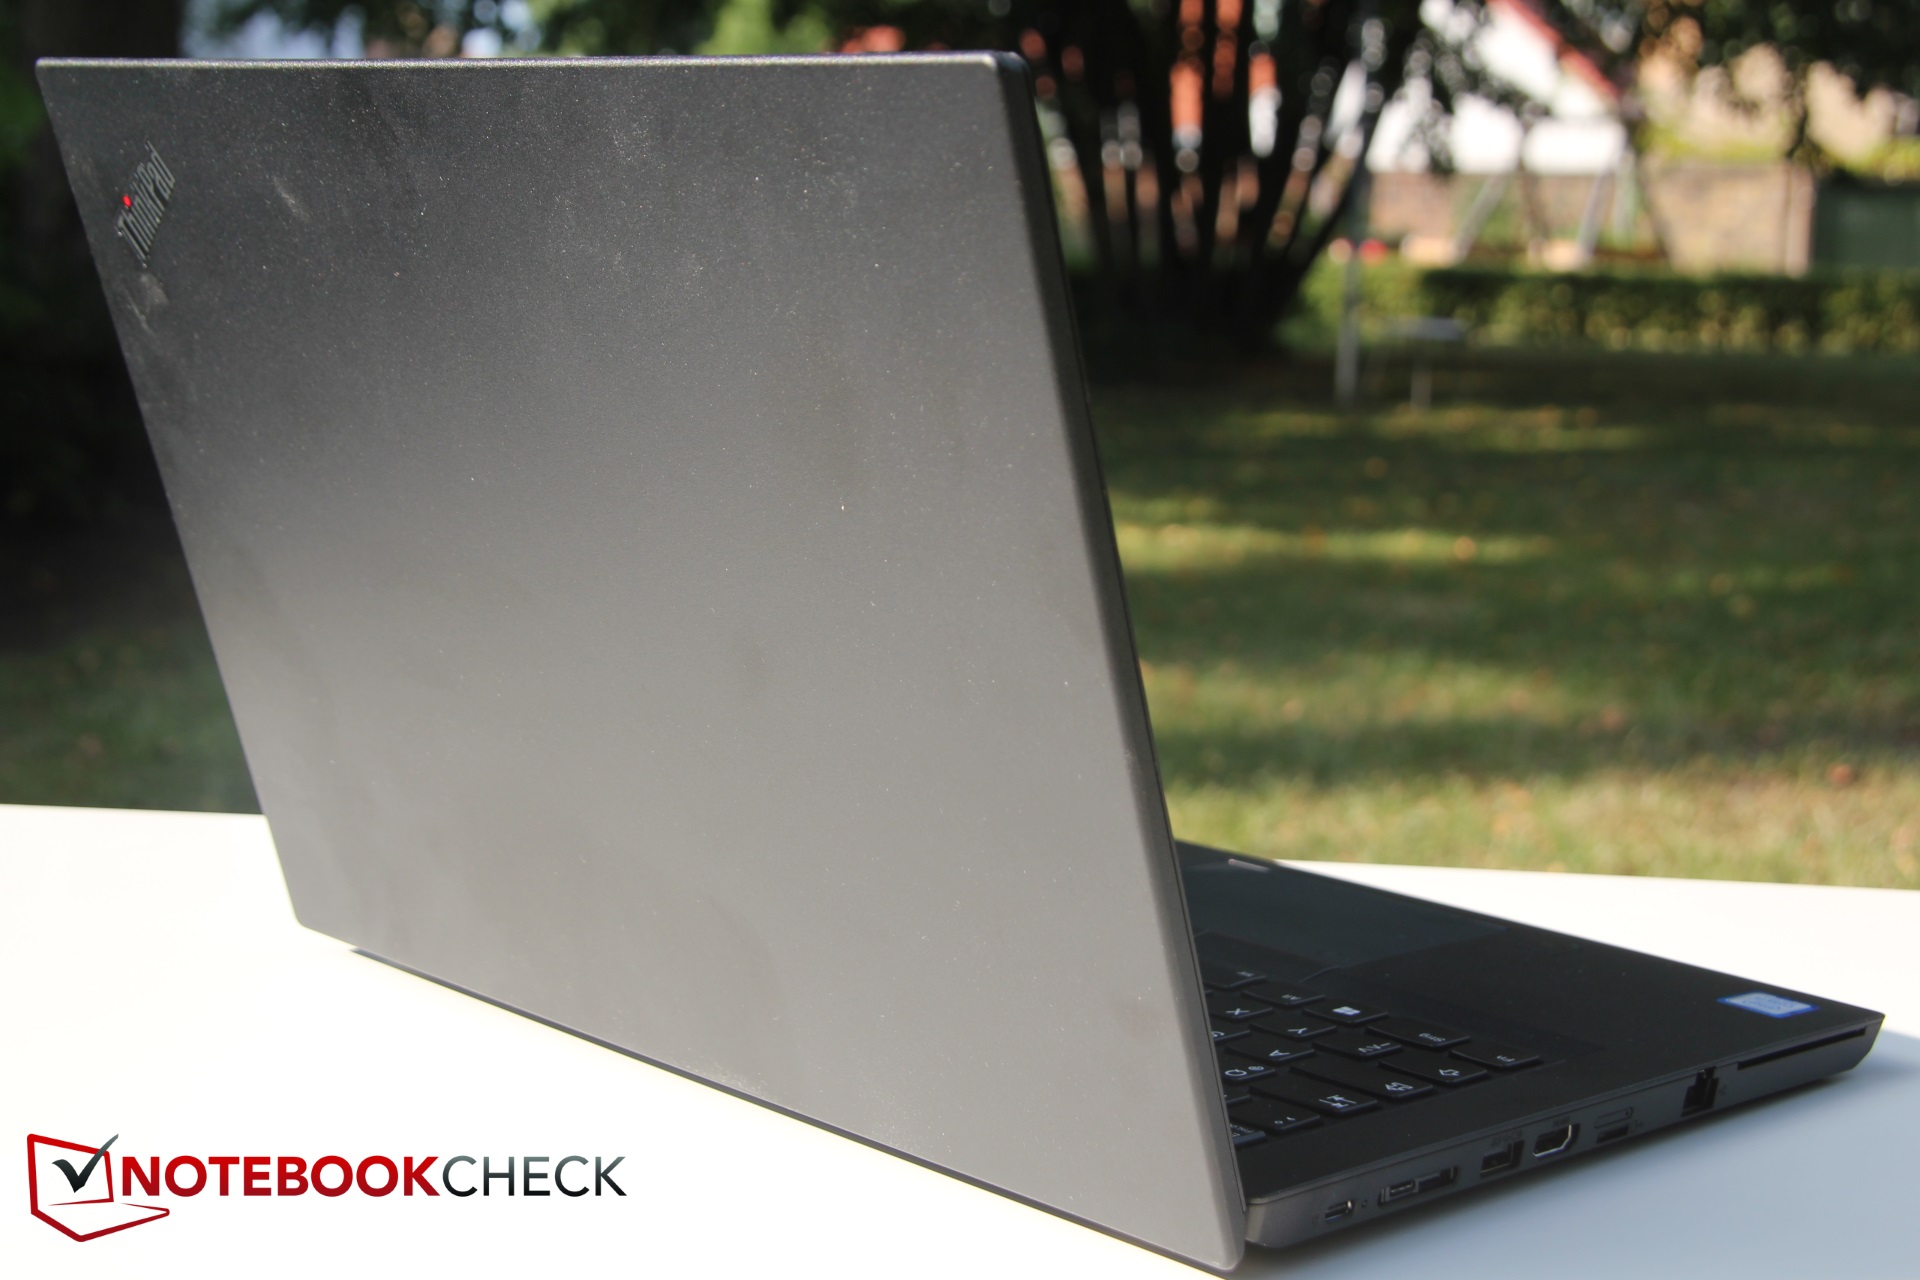
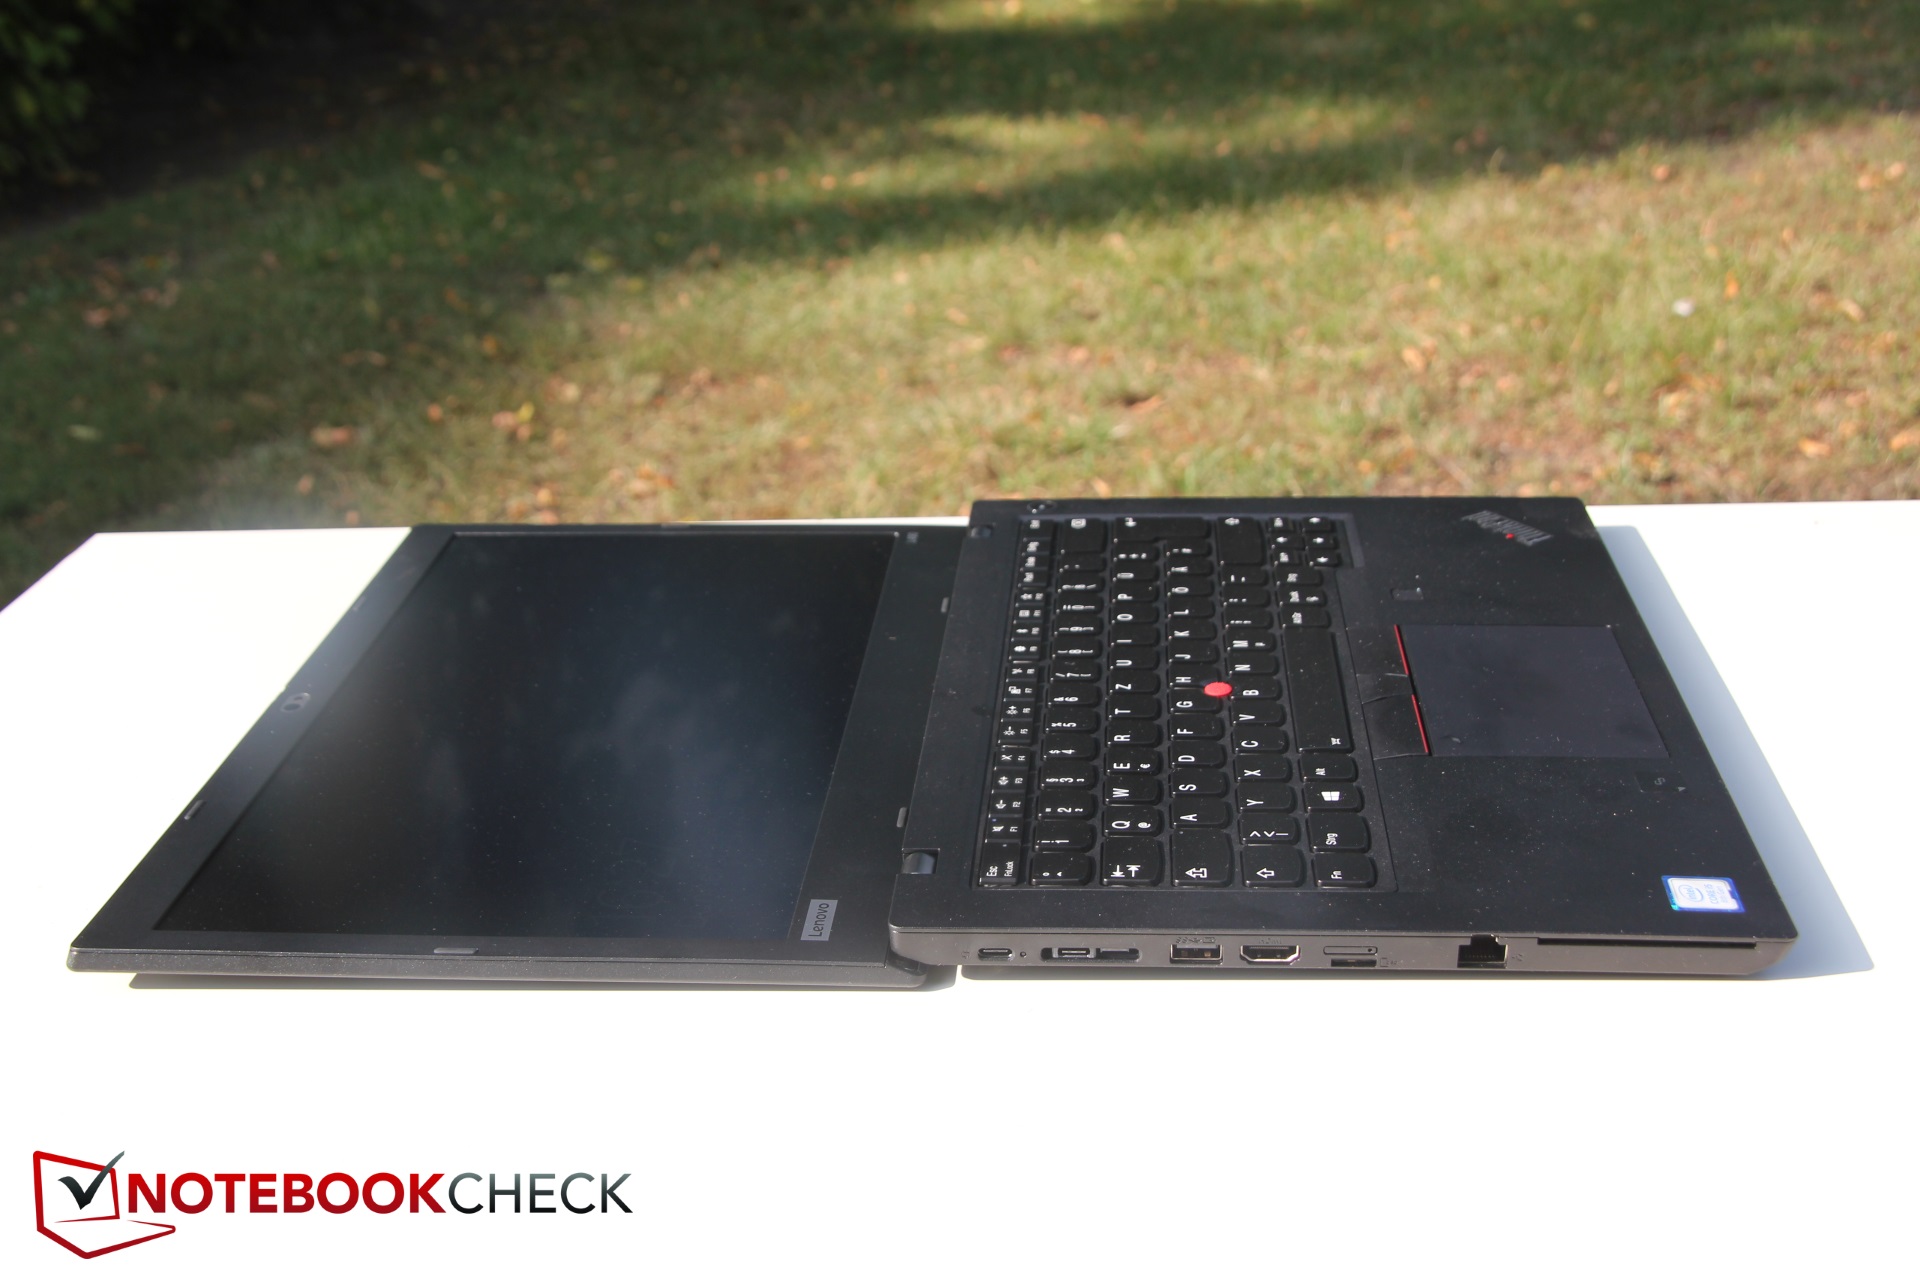
Breve Análise do Portátil Lenovo ThinkPad L490: Whiskey Lake decepciona em portátil empresarial
| SD Card Reader | |
| average JPG Copy Test (av. of 3 runs) | |
| Lenovo Flex 14IWL (Toshiba Exceria Pro SDXC 64 GB UHS-II) | |
| Lenovo ThinkPad L490 20Q6S08600 (Toshiba Exceria Pro M501 64 GB UHS-II) | |
| Lenovo ThinkPad E490-20N8000RGE (Toshiba Exceria Pro M501) | |
| Lenovo ThinkPad L480-20LS001AGE (Toshiba Exceria Pro M501 microSDXC 64GB) | |
| Schenker Slim 15-RE-E19 (Toshiba Exceria Pro SDXC 64 GB UHS-II) | |
| Média da turma Office (19.8 - 198.5, n=22, últimos 2 anos) | |
| HP 250 G7 6HM85ES (Toshiba Exceria Pro SDXC 64 GB UHS-II) | |
| maximum AS SSD Seq Read Test (1GB) | |
| Lenovo ThinkPad L480-20LS001AGE (Toshiba Exceria Pro M501 microSDXC 64GB) | |
| Lenovo ThinkPad E490-20N8000RGE (Toshiba Exceria Pro M501) | |
| Lenovo Flex 14IWL (Toshiba Exceria Pro SDXC 64 GB UHS-II) | |
| Lenovo ThinkPad L490 20Q6S08600 (Toshiba Exceria Pro M501 64 GB UHS-II) | |
| Schenker Slim 15-RE-E19 (Toshiba Exceria Pro SDXC 64 GB UHS-II) | |
| Média da turma Office (27.4 - 249, n=21, últimos 2 anos) | |
| HP 250 G7 6HM85ES (Toshiba Exceria Pro SDXC 64 GB UHS-II) | |
| Networking | |
| iperf3 transmit AX12 | |
| Lenovo ThinkPad E490-20N8000RGE | |
| Lenovo Flex 14IWL | |
| Lenovo ThinkPad L480-20LS001AGE | |
| Schenker Slim 15-RE-E19 | |
| Lenovo ThinkPad L490 20Q6S08600 | |
| HP 250 G7 6HM85ES | |
| iperf3 receive AX12 | |
| Lenovo Flex 14IWL | |
| Lenovo ThinkPad L490 20Q6S08600 | |
| Lenovo ThinkPad E490-20N8000RGE | |
| Schenker Slim 15-RE-E19 | |
| Lenovo ThinkPad L480-20LS001AGE | |
| HP 250 G7 6HM85ES | |
| |||||||||||||||||||||||||
iluminação: 82 %
iluminação com acumulador: 251 cd/m²
Contraste: 788:1 (Preto: 0.32 cd/m²)
ΔE ColorChecker Calman: 4.6 | ∀{0.5-29.43 Ø4.71}
calibrated: 4
ΔE Greyscale Calman: 2 | ∀{0.09-98 Ø4.96}
62.7% sRGB (Argyll 1.6.3 3D)
40% AdobeRGB 1998 (Argyll 1.6.3 3D)
43.35% AdobeRGB 1998 (Argyll 3D)
62.8% sRGB (Argyll 3D)
41.93% Display P3 (Argyll 3D)
Gamma: 2
CCT: 6524 K
| Lenovo ThinkPad L490 20Q6S08600 Lenovo LEN40A9, , 1920x1080, 14" | Lenovo ThinkPad L480-20LS001AGE B140HAN02.4, , 1920x1080, 14" | Lenovo ThinkPad E490-20N8000RGE Lenovo NV140FHM-N49, , 1920x1080, 14" | Lenovo Flex 14IWL BOE BOE06F2, , 1920x1080, 14" | HP 250 G7 6HM85ES BOE0687, , 1920x1080, 15.6" | Schenker Slim 15-RE-E19 Chi Mei CMN15E8, , 2x1, 15.6" | |
|---|---|---|---|---|---|---|
| Display | -13% | -6% | -5% | -6% | 46% | |
| Display P3 Coverage (%) | 41.93 | 36.37 -13% | 39.85 -5% | 40 -5% | 39.61 -6% | 63.7 52% |
| sRGB Coverage (%) | 62.8 | 54.7 -13% | 58.6 -7% | 59 -6% | 59.5 -5% | 87.7 40% |
| AdobeRGB 1998 Coverage (%) | 43.35 | 37.57 -13% | 41.18 -5% | 41.32 -5% | 40.93 -6% | 63.9 47% |
| Response Times | -60% | -37% | -3% | 23% | 6% | |
| Response Time Grey 50% / Grey 80% * (ms) | 37.6 ? | 73 ? -94% | 48.4 ? -29% | 30.4 ? 19% | 41 ? -9% | 37 ? 2% |
| Response Time Black / White * (ms) | 26.4 ? | 33 ? -25% | 38.4 ? -45% | 32.8 ? -24% | 12 ? 55% | 24 ? 9% |
| PWM Frequency (Hz) | 25000 ? | 1250 ? | 352.1 ? | 25000 ? | 25000 ? | |
| Screen | 15% | 7% | -15% | -73% | 10% | |
| Brightness middle (cd/m²) | 252 | 222 -12% | 305 21% | 284.2 13% | 205 -19% | 289 15% |
| Brightness (cd/m²) | 238 | 209 -12% | 295 24% | 271 14% | 205 -14% | 280 18% |
| Brightness Distribution (%) | 82 | 73 -11% | 90 10% | 89 9% | 88 7% | 87 6% |
| Black Level * (cd/m²) | 0.32 | 0.17 47% | 0.23 28% | 0.49 -53% | 0.52 -63% | 0.36 -13% |
| Contrast (:1) | 788 | 1306 66% | 1326 68% | 580 -26% | 394 -50% | 803 2% |
| Colorchecker dE 2000 * | 4.6 | 3.91 15% | 5.3 -15% | 4.59 -0% | 11.15 -142% | 3.93 15% |
| Colorchecker dE 2000 max. * | 18.5 | 7.74 58% | 18.9 -2% | 18.03 3% | 19.08 -3% | 6.98 62% |
| Colorchecker dE 2000 calibrated * | 4 | 5 -25% | 4.57 -14% | 2.98 25% | ||
| Greyscale dE 2000 * | 2 | 1.56 22% | 2.3 -15% | 3.9 -95% | 12.62 -531% | 3.73 -87% |
| Gamma | 2 110% | 2.53 87% | 2.09 105% | 2.123 104% | 2.38 92% | 2.42 91% |
| CCT | 6524 100% | 6701 97% | 6246 104% | 6679 97% | 14189 46% | 6802 96% |
| Color Space (Percent of AdobeRGB 1998) (%) | 40 | 35 -12% | 37.7 -6% | 38 -5% | 38 -5% | 57 43% |
| Color Space (Percent of sRGB) (%) | 62.7 | 55 -12% | 58.2 -7% | 59 -6% | 59 -6% | 87 39% |
| Média Total (Programa/Configurações) | -19% /
-1% | -12% /
-1% | -8% /
-11% | -19% /
-48% | 21% /
17% |
* ... menor é melhor
Exibir tempos de resposta
| ↔ Tempo de resposta preto para branco | ||
|---|---|---|
| 26.4 ms ... ascensão ↗ e queda ↘ combinadas | ↗ 14 ms ascensão | 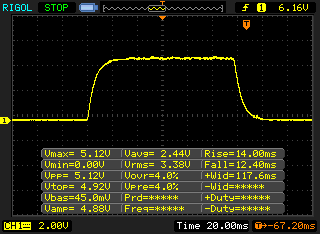 |
| ↘ 12.4 ms queda | ||
| A tela mostra taxas de resposta relativamente lentas em nossos testes e pode ser muito lenta para os jogadores. Em comparação, todos os dispositivos testados variam de 0.1 (mínimo) a 240 (máximo) ms. » 66 % de todos os dispositivos são melhores. Isso significa que o tempo de resposta medido é pior que a média de todos os dispositivos testados (19.8 ms). | ||
| ↔ Tempo de resposta 50% cinza a 80% cinza | ||
| 37.6 ms ... ascensão ↗ e queda ↘ combinadas | ↗ 20.4 ms ascensão | 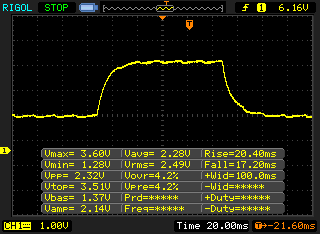 |
| ↘ 17.2 ms queda | ||
| A tela mostra taxas de resposta lentas em nossos testes e será insatisfatória para os jogadores. Em comparação, todos os dispositivos testados variam de 0.165 (mínimo) a 636 (máximo) ms. » 55 % de todos os dispositivos são melhores. Isso significa que o tempo de resposta medido é pior que a média de todos os dispositivos testados (30.9 ms). | ||
Cintilação da tela / PWM (modulação por largura de pulso)
| Tela tremeluzindo/PWM detectado | 25000 Hz | ≤ 40 % configuração de brilho | 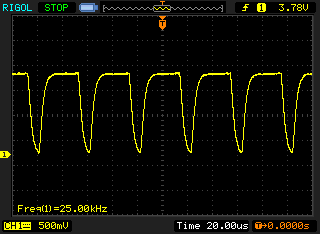 |
A luz de fundo da tela pisca em 25000 Hz (pior caso, por exemplo, utilizando PWM) Cintilação detectada em uma configuração de brilho de 40 % e abaixo. Não deve haver cintilação ou PWM acima desta configuração de brilho. A frequência de 25000 Hz é bastante alta, então a maioria dos usuários sensíveis ao PWM não deve notar nenhuma oscilação. [pwm_comparison] Em comparação: 52 % de todos os dispositivos testados não usam PWM para escurecer a tela. Se PWM foi detectado, uma média de 7744 (mínimo: 5 - máximo: 343500) Hz foi medida. | |||
| PCMark 8 Home Score Accelerated v2 | 3252 pontos | |
| PCMark 8 Work Score Accelerated v2 | 4700 pontos | |
| PCMark 10 Score | 3790 pontos | |
Ajuda | ||
| Lenovo ThinkPad L490 20Q6S08600 Intel SSD Pro 7600p SSDPEKKF512G8L | Lenovo ThinkPad L480-20LS001AGE Toshiba KXG5AZNV256G | Lenovo ThinkPad E490-20N8000RGE SK hynix BC501 HFM256GDHTNG | Lenovo Flex 14IWL Samsung SSD PM981 MZVLB256HAHQ | HP 250 G7 6HM85ES WDC PC SN520 SDAPNUW-512G | Schenker Slim 15-RE-E19 Samsung SSD 970 EVO Plus 500GB | Média Intel SSD Pro 7600p SSDPEKKF512G8L | |
|---|---|---|---|---|---|---|---|
| CrystalDiskMark 5.2 / 6 | -23% | -19% | 14% | 11% | 46% | 23% | |
| Write 4K (MB/s) | 128.3 | 110.8 -14% | 110.7 -14% | 136.5 6% | 179.3 40% | 187.2 46% | 133.9 ? 4% |
| Read 4K (MB/s) | 61.6 | 36.46 -41% | 41.02 -33% | 45.74 -26% | 47.7 -23% | 51.8 -16% | 59.1 ? -4% |
| Write Seq (MB/s) | 846 | 482.4 -43% | 757 -11% | 1265 50% | 1438 70% | 1378 ? 63% | |
| Read Seq (MB/s) | 1425 | 1425 0% | 1037 -27% | 1184 -17% | 1347 -5% | 2341 ? 64% | |
| Write 4K Q32T1 (MB/s) | 503 | 355.6 -29% | 359 -29% | 380.5 -24% | 450.6 -10% | 396.7 -21% | 355 ? -29% |
| Read 4K Q32T1 (MB/s) | 418.7 | 405.6 -3% | 402.4 -4% | 437.5 4% | 556 33% | 534 28% | 429 ? 2% |
| Write Seq Q32T1 (MB/s) | 1391 | 495.2 -64% | 833 -40% | 1502 8% | 1455 5% | 3280 136% | 1514 ? 9% |
| Read Seq Q32T1 (MB/s) | 1570 | 1777 13% | 1635 4% | 3357 114% | 1717 9% | 3556 126% | 2677 ? 71% |
| Write 4K Q8T8 (MB/s) | 1435 | 1018 ? | |||||
| Read 4K Q8T8 (MB/s) | 572 | 901 ? | |||||
| AS SSD | -108% | -36% | 17% | 7% | 65% | 19% | |
| Seq Read (MB/s) | 1262 | 1274 1% | 1420 13% | 2533 101% | 1477 17% | 2661 111% | 2408 ? 91% |
| Seq Write (MB/s) | 735 | 461.8 -37% | 552 -25% | 1438 96% | 1339 82% | 2426 230% | 1318 ? 79% |
| 4K Read (MB/s) | 46.44 | 29.74 -36% | 42.31 -9% | 51.7 11% | 46.26 0% | 59 27% | 60.9 ? 31% |
| 4K Write (MB/s) | 137.5 | 110.3 -20% | 112.1 -18% | 109.4 -20% | 143.9 5% | 166 21% | 153.3 ? 11% |
| 4K-64 Read (MB/s) | 685 | 415.8 -39% | 510 -26% | 771 13% | 937 37% | 1314 92% | 811 ? 18% |
| 4K-64 Write (MB/s) | 905 | 268.8 -70% | 357.9 -60% | 1268 40% | 1190 31% | 1494 65% | 895 ? -1% |
| Access Time Read * (ms) | 0.025 | 0.247 -888% | 0.053 -112% | 0.053 -112% | 0.046 -84% | 0.046 -84% | 0.0376 ? -50% |
| Access Time Write * (ms) | 0.025 | 0.055 -120% | 0.032 -28% | 0.034 -36% | 0.024 4% | 0.023 8% | 0.0352 ? -41% |
| Score Read (Points) | 858 | 573 -33% | 694 -19% | 1076 25% | 1131 32% | 1639 91% | 1113 ? 30% |
| Score Write (Points) | 1116 | 425 -62% | 525 -53% | 1521 36% | 1468 32% | 1902 70% | 1180 ? 6% |
| Score Total (Points) | 2400 | 1259 -48% | 1544 -36% | 3106 29% | 3181 33% | 4379 82% | 2825 ? 18% |
| Copy ISO MB/s (MB/s) | 1164 | 449.8 -61% | 637 -45% | 765 -34% | 1474 ? 27% | ||
| Copy Program MB/s (MB/s) | 445.1 | 187.8 -58% | 237 -47% | 239.9 -46% | 460 ? 3% | ||
| Copy Game MB/s (MB/s) | 646 | 395.1 -39% | 412 -36% | 528 -18% | 964 ? 49% | ||
| Média Total (Programa/Configurações) | -66% /
-77% | -28% /
-30% | 16% /
16% | 9% /
8% | 56% /
57% | 21% /
21% |
* ... menor é melhor

| 3DMark 11 - 1280x720 Performance GPU | |
| Média da turma Office (2551 - 18313, n=72, últimos 2 anos) | |
| Schenker Slim 15-RE-E19 | |
| Média Intel UHD Graphics 620 (1144 - 3432, n=244) | |
| Lenovo ThinkPad L490 20Q6S08600 | |
| Lenovo Flex 14IWL | |
| Lenovo ThinkPad L480-20LS001AGE | |
| Lenovo ThinkPad E490-20N8000RGE | |
| HP 250 G7 6HM85ES | |
| 3DMark 11 Performance | 1875 pontos | |
| 3DMark Cloud Gate Standard Score | 7673 pontos | |
| 3DMark Fire Strike Score | 1007 pontos | |
Ajuda | ||
| baixo | média | alto | ultra | |
|---|---|---|---|---|
| BioShock Infinite (2013) | 49.23 | 30 | 24.26 | 7.8 |
| Dota 2 Reborn (2015) | 63 | 38.6 | 18 | 15.9 |
| X-Plane 11.11 (2018) | 23.5 | 16.1 | 14.6 |
| Lenovo ThinkPad L490 20Q6S08600 UHD Graphics 620, i5-8265U, Intel SSD Pro 7600p SSDPEKKF512G8L | Lenovo ThinkPad L480-20LS001AGE UHD Graphics 620, i5-8250U, Toshiba KXG5AZNV256G | Lenovo ThinkPad E490-20N8000RGE UHD Graphics 620, i5-8265U, SK hynix BC501 HFM256GDHTNG | Lenovo Flex 14IWL UHD Graphics 620, i5-8265U, Samsung SSD PM981 MZVLB256HAHQ | HP 250 G7 6HM85ES UHD Graphics 620, i5-8265U, WDC PC SN520 SDAPNUW-512G | Schenker Slim 15-RE-E19 UHD Graphics 620, i5-8265U, Samsung SSD 970 EVO Plus 500GB | |
|---|---|---|---|---|---|---|
| Noise | -8% | -1% | -5% | -9% | -20% | |
| desligado / ambiente * (dB) | 28.8 | 30.4 -6% | 29.4 -2% | 28.4 1% | 30.7 -7% | 30.4 -6% |
| Idle Minimum * (dB) | 28.8 | 30.4 -6% | 29.4 -2% | 28.4 1% | 30.9 -7% | 30.4 -6% |
| Idle Average * (dB) | 28.8 | 30.4 -6% | 29.4 -2% | 28.4 1% | 31.6 -10% | 30.4 -6% |
| Idle Maximum * (dB) | 28.8 | 30.4 -6% | 29.4 -2% | 29.1 -1% | 31.6 -10% | 31.6 -10% |
| Load Average * (dB) | 28.8 | 32.3 -12% | 30.2 -5% | 33.8 -17% | 34.3 -19% | 44.8 -56% |
| Load Maximum * (dB) | 33.6 | 37 -10% | 30.9 8% | 37.7 -12% | 33.8 -1% | 44.8 -33% |
* ... menor é melhor
Barulho
| Ocioso |
| 28.8 / 28.8 / 28.8 dB |
| Carga |
| 28.8 / 33.6 dB |
 | ||
30 dB silencioso 40 dB(A) audível 50 dB(A) ruidosamente alto |
||
min: | ||
(-) A temperatura máxima no lado superior é 46.1 °C / 115 F, em comparação com a média de 34.3 °C / 94 F , variando de 21.2 a 62.5 °C para a classe Office.
(-) A parte inferior aquece até um máximo de 46.9 °C / 116 F, em comparação com a média de 36.8 °C / 98 F
(+) Em uso inativo, a temperatura média para o lado superior é 23.7 °C / 75 F, em comparação com a média do dispositivo de 29.5 °C / ### class_avg_f### F.
(+) Os apoios para as mãos e o touchpad são mais frios que a temperatura da pele, com um máximo de 25.4 °C / 77.7 F e, portanto, são frios ao toque.
(+) A temperatura média da área do apoio para as mãos de dispositivos semelhantes foi 27.6 °C / 81.7 F (+2.2 °C / 4 F).
| Lenovo ThinkPad L490 20Q6S08600 UHD Graphics 620, i5-8265U, Intel SSD Pro 7600p SSDPEKKF512G8L | Lenovo ThinkPad L480-20LS001AGE UHD Graphics 620, i5-8250U, Toshiba KXG5AZNV256G | Lenovo ThinkPad E490-20N8000RGE UHD Graphics 620, i5-8265U, SK hynix BC501 HFM256GDHTNG | Lenovo Flex 14IWL UHD Graphics 620, i5-8265U, Samsung SSD PM981 MZVLB256HAHQ | HP 250 G7 6HM85ES UHD Graphics 620, i5-8265U, WDC PC SN520 SDAPNUW-512G | Schenker Slim 15-RE-E19 UHD Graphics 620, i5-8265U, Samsung SSD 970 EVO Plus 500GB | |
|---|---|---|---|---|---|---|
| Heat | 2% | 4% | -10% | 7% | 2% | |
| Maximum Upper Side * (°C) | 46.1 | 43 7% | 39.9 13% | 37.6 18% | 35.1 24% | 40.3 13% |
| Maximum Bottom * (°C) | 46.9 | 41.7 11% | 45 4% | 45.8 2% | 42.4 10% | 47.1 -0% |
| Idle Upper Side * (°C) | 24.7 | 25.7 -4% | 24.7 -0% | 30 -21% | 25.4 -3% | 25 -1% |
| Idle Bottom * (°C) | 25.2 | 27.1 -8% | 25.8 -2% | 35.4 -40% | 25.8 -2% | 26.4 -5% |
* ... menor é melhor
Lenovo ThinkPad L490 20Q6S08600 análise de áudio
(±) | o volume do alto-falante é médio, mas bom (###valor### dB)
Graves 100 - 315Hz
(-) | quase nenhum baixo - em média 25.7% menor que a mediana
(±) | a linearidade dos graves é média (12.2% delta para a frequência anterior)
Médios 400 - 2.000 Hz
(+) | médios equilibrados - apenas 2.9% longe da mediana
(±) | a linearidade dos médios é média (8.6% delta para frequência anterior)
Altos 2 - 16 kHz
(+) | agudos equilibrados - apenas 3% longe da mediana
(+) | os máximos são lineares (4.8% delta da frequência anterior)
Geral 100 - 16.000 Hz
(±) | a linearidade do som geral é média (23.4% diferença em relação à mediana)
Comparado com a mesma classe
» 66% de todos os dispositivos testados nesta classe foram melhores, 8% semelhantes, 26% piores
» O melhor teve um delta de 7%, a média foi 21%, o pior foi 53%
Comparado com todos os dispositivos testados
» 70% de todos os dispositivos testados foram melhores, 6% semelhantes, 24% piores
» O melhor teve um delta de 4%, a média foi 23%, o pior foi 134%
Lenovo ThinkPad L480-20LS001AGE análise de áudio
(-) | alto-falantes não muito altos (###valor### dB)
Graves 100 - 315Hz
(-) | quase nenhum baixo - em média 21.3% menor que a mediana
(±) | a linearidade dos graves é média (10.9% delta para a frequência anterior)
Médios 400 - 2.000 Hz
(+) | médios equilibrados - apenas 4.2% longe da mediana
(±) | a linearidade dos médios é média (14% delta para frequência anterior)
Altos 2 - 16 kHz
(+) | agudos equilibrados - apenas 2.6% longe da mediana
(±) | a linearidade dos máximos é média (9.1% delta para frequência anterior)
Geral 100 - 16.000 Hz
(±) | a linearidade do som geral é média (24.3% diferença em relação à mediana)
Comparado com a mesma classe
» 71% de todos os dispositivos testados nesta classe foram melhores, 8% semelhantes, 21% piores
» O melhor teve um delta de 7%, a média foi 21%, o pior foi 53%
Comparado com todos os dispositivos testados
» 74% de todos os dispositivos testados foram melhores, 6% semelhantes, 21% piores
» O melhor teve um delta de 4%, a média foi 23%, o pior foi 134%
| desligado | |
| Ocioso | |
| Carga |
|
Key:
min: | |
| Lenovo ThinkPad L490 20Q6S08600 i5-8265U, UHD Graphics 620, Intel SSD Pro 7600p SSDPEKKF512G8L, IPS, 1920x1080, 14" | Lenovo ThinkPad L480-20LS001AGE i5-8250U, UHD Graphics 620, Toshiba KXG5AZNV256G, IPS, 1920x1080, 14" | Lenovo ThinkPad E490-20N8000RGE i5-8265U, UHD Graphics 620, SK hynix BC501 HFM256GDHTNG, IPS, 1920x1080, 14" | Lenovo Flex 14IWL i5-8265U, UHD Graphics 620, Samsung SSD PM981 MZVLB256HAHQ, IPS, 1920x1080, 14" | HP 250 G7 6HM85ES i5-8265U, UHD Graphics 620, WDC PC SN520 SDAPNUW-512G, TN, 1920x1080, 15.6" | Schenker Slim 15-RE-E19 i5-8265U, UHD Graphics 620, Samsung SSD 970 EVO Plus 500GB, IPS, 2x1, 15.6" | Média Intel UHD Graphics 620 | Média da turma Office | |
|---|---|---|---|---|---|---|---|---|
| Power Consumption | -3% | 10% | -78% | 6% | -7% | -11% | -29% | |
| Idle Minimum * (Watt) | 3.5 | 3.3 6% | 2.76 21% | 9.4 -169% | 3.2 9% | 3.2 9% | 3.81 ? -9% | 4.25 ? -21% |
| Idle Average * (Watt) | 6.3 | 6.6 -5% | 5.96 5% | 13.3 -111% | 5.7 10% | 6.5 -3% | 6.94 ? -10% | 7.3 ? -16% |
| Idle Maximum * (Watt) | 8.7 | 7.3 16% | 6.57 24% | 13.9 -60% | 6.1 30% | 11.3 -30% | 8.75 ? -1% | 8.57 ? 1% |
| Load Average * (Watt) | 28.7 | 40.4 -41% | 28.2 2% | 39.7 -38% | 36.5 -27% | 32 -11% | 35 ? -22% | 43.8 ? -53% |
| Load Maximum * (Watt) | 41.8 | 37.4 11% | 43.6 -4% | 46.5 -11% | 37.5 10% | 42.2 -1% | 47.5 ? -14% | 64.5 ? -54% |
* ... menor é melhor
| Lenovo ThinkPad L490 20Q6S08600 i5-8265U, UHD Graphics 620, 45 Wh | Lenovo ThinkPad L480-20LS001AGE i5-8250U, UHD Graphics 620, 45 Wh | Lenovo ThinkPad E490-20N8000RGE i5-8265U, UHD Graphics 620, 45 Wh | Lenovo Flex 14IWL i5-8265U, UHD Graphics 620, 45 Wh | HP 250 G7 6HM85ES i5-8265U, UHD Graphics 620, 41 Wh | Schenker Slim 15-RE-E19 i5-8265U, UHD Graphics 620, 36 Wh | Média da turma Office | |
|---|---|---|---|---|---|---|---|
| Duração da bateria | -15% | 2% | -11% | -28% | -43% | 30% | |
| Reader / Idle (h) | 18.6 | 16.9 -9% | 17.7 -5% | 13.6 -27% | 13.9 -25% | 22.2 ? 19% | |
| H.264 (h) | 11.1 | 8 -28% | 11.5 4% | 7.1 -36% | 15.4 ? 39% | ||
| WiFi v1.3 (h) | 7.9 | 7.7 -3% | 8.1 3% | 10.4 32% | 5.7 -28% | 4.5 -43% | 13.2 ? 67% |
| Load (h) | 1.9 | 1.5 -21% | 2 5% | 1.2 -37% | 1.5 -21% | 1.808 ? -5% |
Pro
Contra
Veredicto - Mais forte ou mais fraco que o L480?
Como um computador de escritório e de trabalho, a Lenovo continua errando um pouco com o ThinkPad L490. Escrever com o teclado ainda é rápido e agradável, e a velocidade de trabalho é decente em geral.
No entanto, você precisa dar uma olhada nos detalhes para não perceber a atualização de hardware deste ano como algo supérfluo. Dado que as alterações evidentes - ou seja, a nova tela e o processador Whiskey Lake - não saíram como desejado. A CPU é afogada e, portanto, é mais lenta que a Kaby Lake no predecessor. A tela troca um pouco mais de brilho por um contraste e um valor de preto mais fracos.
Por outro lado, a Lenovo finalmente está incluindo um SSD mais rápido, o Bluetooth 5 está agora a bordo e o computador móvel geralmente é confortavelmente silencioso. Não gostamos muito do sistema de resfriamento; ele se entrega repetidamente a fazer pausas, mesmo sob uso intenso. Mas o silêncio agradável, infelizmente apenas temporário, acontece em detrimento do desempenho e gera temperaturas altamente flutuantes.
O Lenovo ThinkPad L490 continua a impressionar como um portátil de escritório muito bom. Seus dispositivos de entrada, a boa duração da bateria e, finalmente, também um SSD mais rápido tornam o portátil um computador de trabalho apto para empresas, estudantes e qualquer outra pessoa que lida com a escrita e a Web.
Mas, na verdade, não é nada fácil outorgar uma recomendação clara de compra, pois, por um lado, o L490 se diferencia do predecessor com muitos poucos benefícios, e por outro lado, está muito perto do E490. Com o último, aqueles que podem ficar sem um slot ExpressCard obterão a tela consideravelmente mais brilhante e mais rica em contraste com o mesmo desempenho e uma duração de bateria igualmente boa a um preço presumivelmente mais favorável, pelo menos fora do desconto especial para estudantes. Por 699 Euros (~$771), este último pode apertar o gatilho de compra sem hesitação.
Lenovo ThinkPad L490 20Q6S08600
- 09/04/2019 v7 (old)
Christian Hintze