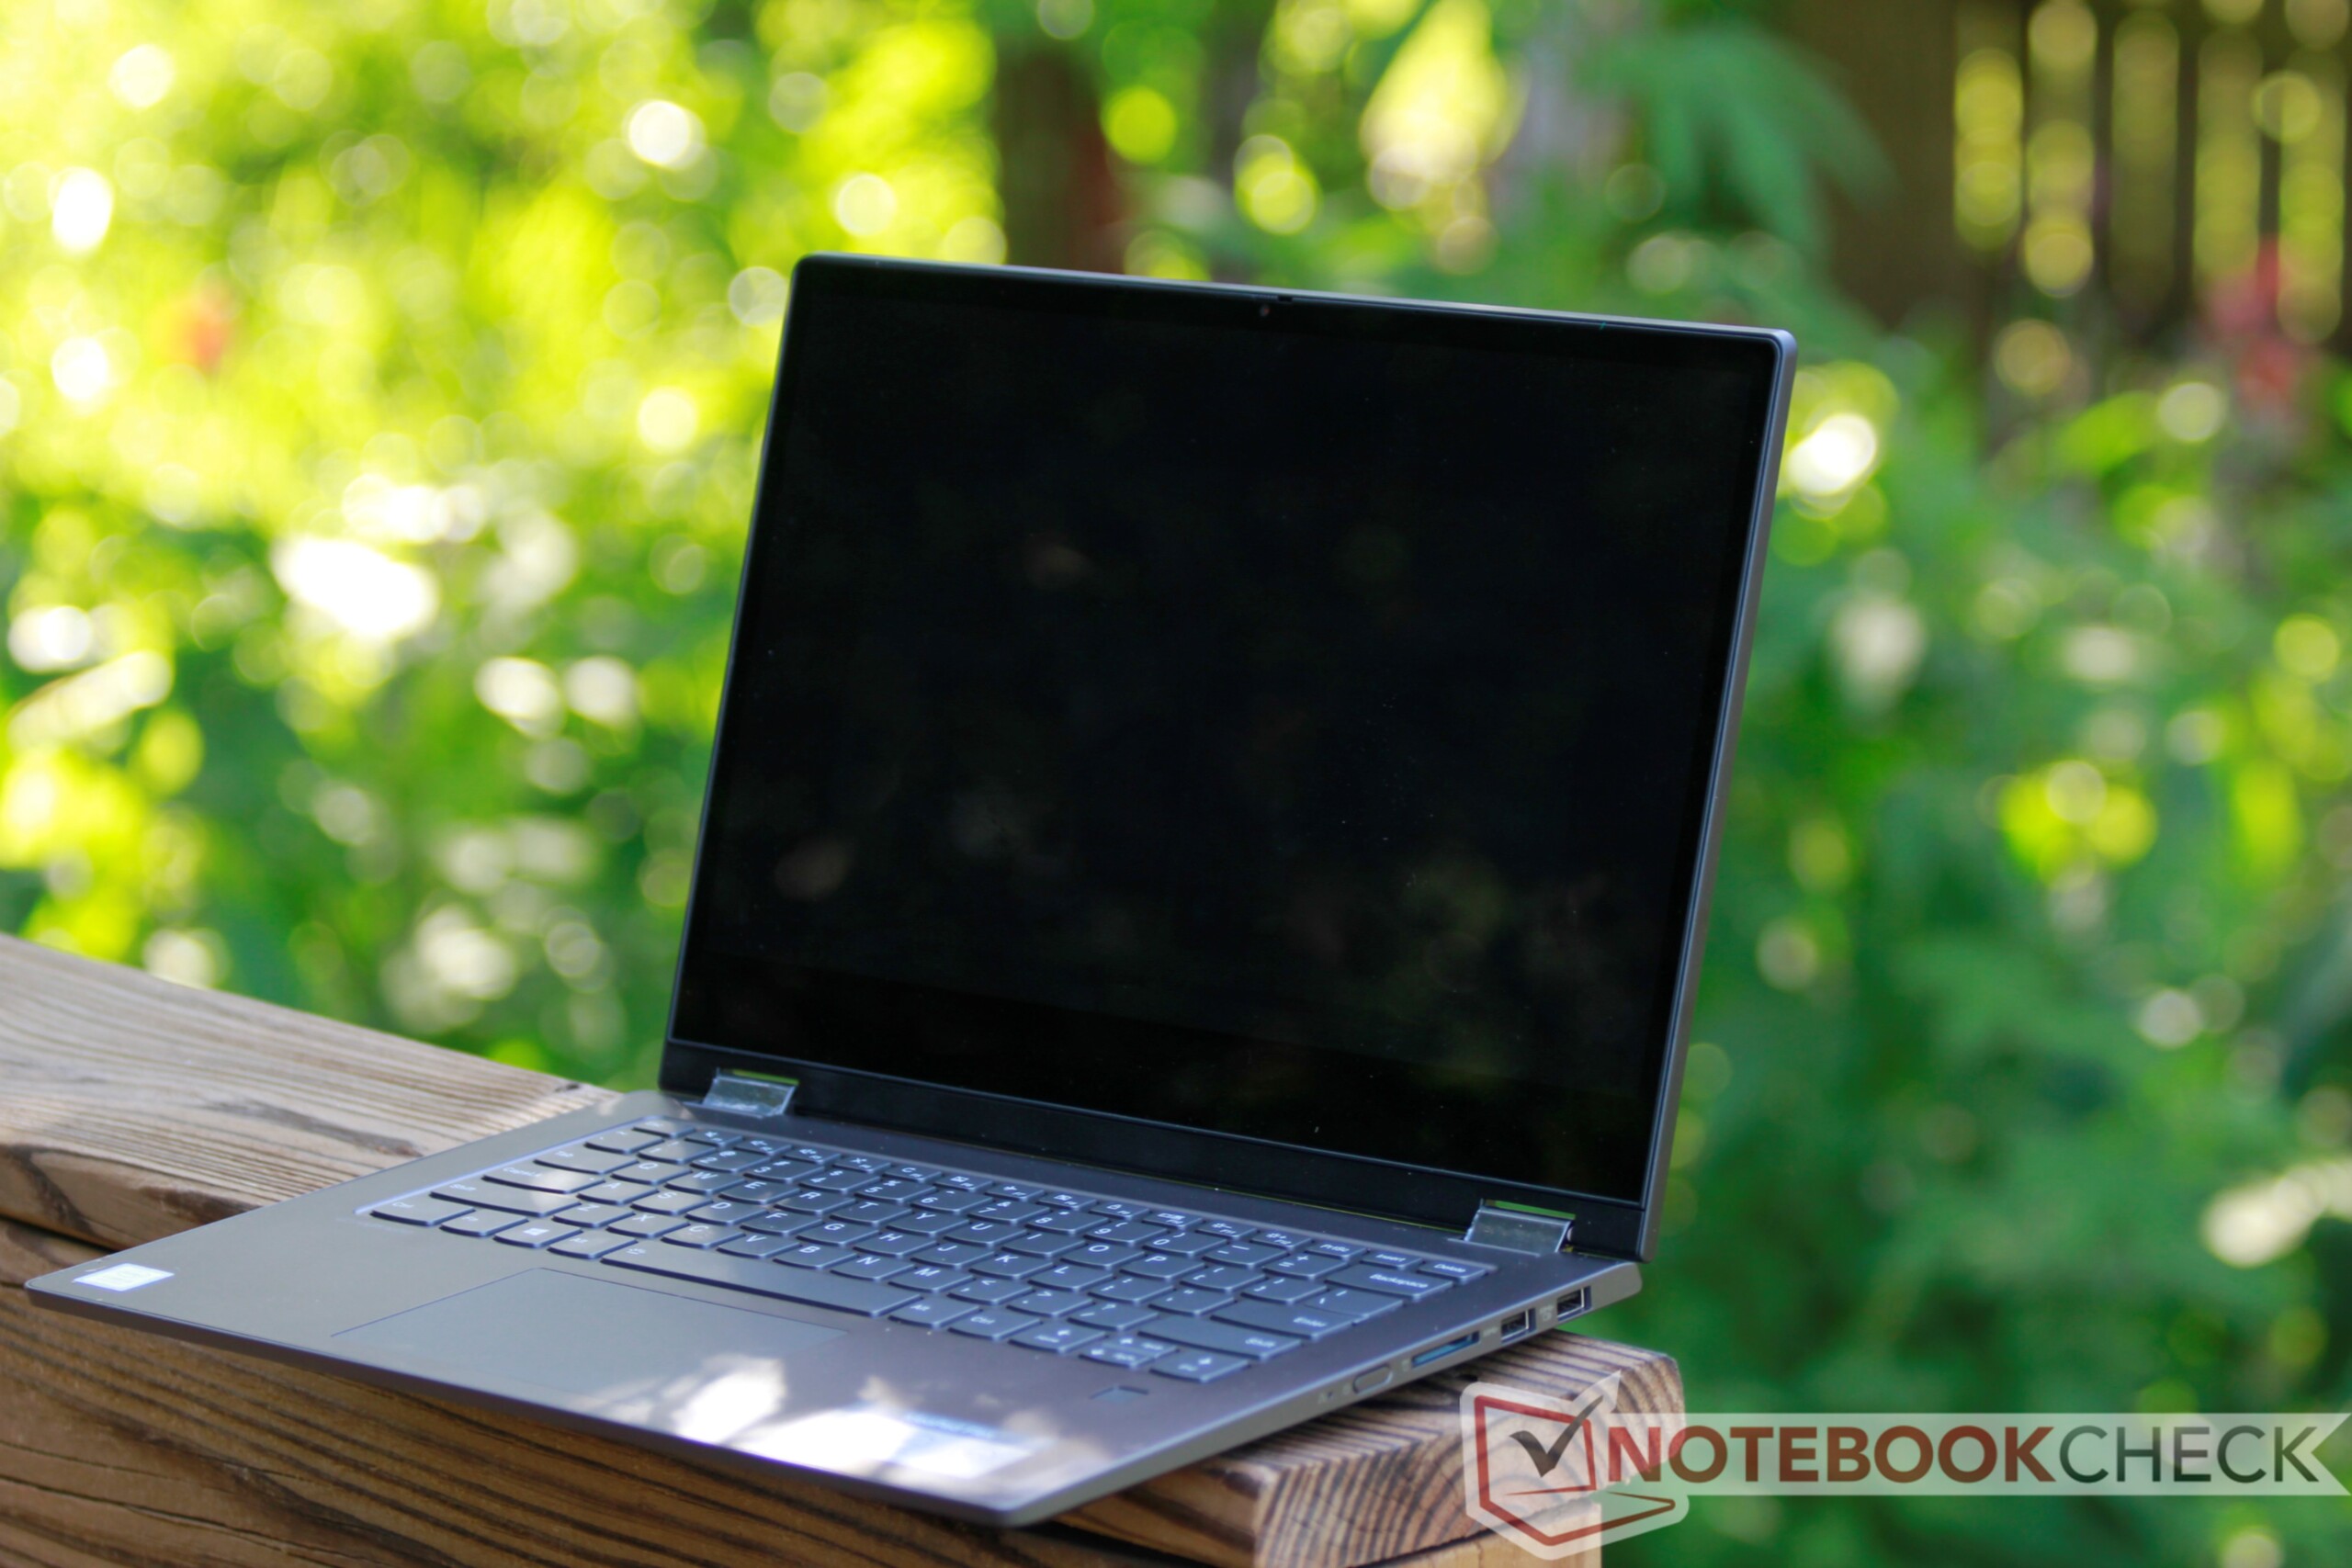
Breve Análise do Portátil Lenovo Flex 14 (2019, Core i5-8265U) - Um conversível médio a um bom preço
| SD Card Reader | |
| average JPG Copy Test (av. of 3 runs) | |
| Lenovo Flex 14IWL (Toshiba Exceria Pro SDXC 64 GB UHS-II) | |
| HP Envy x360 13-ar0601ng (Toshiba Exceria Pro M501 microSDXC 64GB) | |
| Média da turma Convertible (29.4 - 141, n=20, últimos 2 anos) | |
| Dell Inspiron 14 5000 5482 2-in-1 (Toshiba Exceria Pro SDXC 64 GB UHS-II) | |
| Asus VivoBook Flip 14 TP412UA-DB51T (Toshiba Exceria Pro SDXC 64 GB UHS-II) | |
| Acer Spin 5 SP515-51GN-80A3 (Toshiba Exceria Pro SDXC 64 GB UHS-II) | |
| maximum AS SSD Seq Read Test (1GB) | |
| Média da turma Convertible (67.5 - 254, n=19, últimos 2 anos) | |
| HP Envy x360 13-ar0601ng (Toshiba Exceria Pro M501 microSDXC 64GB) | |
| Lenovo Flex 14IWL (Toshiba Exceria Pro SDXC 64 GB UHS-II) | |
| Dell Inspiron 14 5000 5482 2-in-1 (Toshiba Exceria Pro SDXC 64 GB UHS-II) | |
| Asus VivoBook Flip 14 TP412UA-DB51T (Toshiba Exceria Pro SDXC 64 GB UHS-II) | |
| Acer Spin 5 SP515-51GN-80A3 (Toshiba Exceria Pro SDXC 64 GB UHS-II) | |
| |||||||||||||||||||||||||
iluminação: 89 %
iluminação com acumulador: 284.2 cd/m²
Contraste: 580:1 (Preto: 0.49 cd/m²)
ΔE ColorChecker Calman: 4.59 | ∀{0.5-29.43 Ø4.71}
calibrated: 4.57
ΔE Greyscale Calman: 3.9 | ∀{0.09-98 Ø4.96}
59% sRGB (Argyll 1.6.3 3D)
38% AdobeRGB 1998 (Argyll 1.6.3 3D)
41.32% AdobeRGB 1998 (Argyll 3D)
59% sRGB (Argyll 3D)
40% Display P3 (Argyll 3D)
Gamma: 2.123
CCT: 6679 K
| Lenovo Flex 14IWL BOE BOE06F2, IPS, 14", 1920x1080 | HP Envy x360 13-ar0601ng InfoVision, M133NVF3 R2, IPS, 120 Hz, 13.3", 1920x1080 | Dell Inspiron 14 5000 5482 2-in-1 NV14N4H, IPS, 14", 1920x1080 | Asus VivoBook Flip 14 TP412UA-DB51T AUO B140HAN04.0, IPS, 14", 1920x1080 | Acer Spin 5 SP515-51GN-80A3 AUO, B156HAN06.1, a-Si TFT-LCD, LCM, IPS, 15.6", 1920x1080 | |
|---|---|---|---|---|---|
| Display | 55% | 0% | -1% | -2% | |
| Display P3 Coverage (%) | 40 | 63 58% | 40.57 1% | 39.42 -1% | 38.73 -3% |
| sRGB Coverage (%) | 59 | 90.8 54% | 58.6 -1% | 59.2 0% | 58.3 -1% |
| AdobeRGB 1998 Coverage (%) | 41.32 | 63.8 54% | 41.91 1% | 40.73 -1% | 40.02 -3% |
| Response Times | 9% | -47% | -10% | -13% | |
| Response Time Grey 50% / Grey 80% * (ms) | 30.4 ? | 35 ? -15% | 58.8 ? -93% | 38 ? -25% | 42 ? -38% |
| Response Time Black / White * (ms) | 32.8 ? | 22 ? 33% | 33.2 ? -1% | 30.8 ? 6% | 29 ? 12% |
| PWM Frequency (Hz) | 352.1 ? | 4065 ? | 198.4 ? | ||
| Screen | 55% | -5% | 12% | 34% | |
| Brightness middle (cd/m²) | 284.2 | 633 123% | 193.6 -32% | 255.5 -10% | 221 -22% |
| Brightness (cd/m²) | 271 | 675 149% | 181 -33% | 242 -11% | 224 -17% |
| Brightness Distribution (%) | 89 | 75 -16% | 78 -12% | 87 -2% | 89 0% |
| Black Level * (cd/m²) | 0.49 | 0.55 -12% | 0.17 65% | 0.29 41% | 0.12 76% |
| Contrast (:1) | 580 | 1151 98% | 1139 96% | 881 52% | 1842 218% |
| Colorchecker dE 2000 * | 4.59 | 3.12 32% | 6.99 -52% | 4.18 9% | 4.12 10% |
| Colorchecker dE 2000 max. * | 18.03 | 6.37 65% | 23.58 -31% | 19.15 -6% | 6.41 64% |
| Colorchecker dE 2000 calibrated * | 4.57 | 1.83 60% | 4.86 -6% | 3.8 17% | |
| Greyscale dE 2000 * | 3.9 | 3.89 -0% | 5.7 -46% | 2.2 44% | 3.4 13% |
| Gamma | 2.123 104% | 2.39 92% | 2.12 104% | 2.05 107% | 2.54 87% |
| CCT | 6679 97% | 6476 100% | 5845 111% | 6599 98% | 6893 94% |
| Color Space (Percent of AdobeRGB 1998) (%) | 38 | 59 55% | 37.6 -1% | 37.5 -1% | 37 -3% |
| Color Space (Percent of sRGB) (%) | 59 | 91 54% | 59.1 0% | 58 -2% | |
| Média Total (Programa/Configurações) | 40% /
50% | -17% /
-10% | 0% /
7% | 6% /
20% |
* ... menor é melhor
Exibir tempos de resposta
| ↔ Tempo de resposta preto para branco | ||
|---|---|---|
| 32.8 ms ... ascensão ↗ e queda ↘ combinadas | ↗ 21.2 ms ascensão | 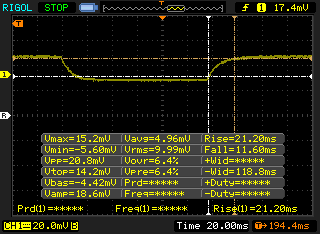 |
| ↘ 11.6 ms queda | ||
| A tela mostra taxas de resposta lentas em nossos testes e será insatisfatória para os jogadores. Em comparação, todos os dispositivos testados variam de 0.1 (mínimo) a 240 (máximo) ms. » 88 % de todos os dispositivos são melhores. Isso significa que o tempo de resposta medido é pior que a média de todos os dispositivos testados (19.8 ms). | ||
| ↔ Tempo de resposta 50% cinza a 80% cinza | ||
| 30.4 ms ... ascensão ↗ e queda ↘ combinadas | ↗ 22 ms ascensão | 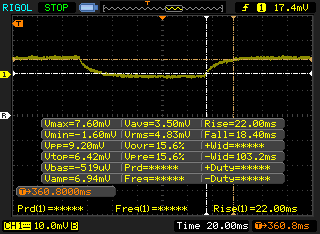 |
| ↘ 18.4 ms queda | ||
| A tela mostra taxas de resposta lentas em nossos testes e será insatisfatória para os jogadores. Em comparação, todos os dispositivos testados variam de 0.165 (mínimo) a 636 (máximo) ms. » 41 % de todos os dispositivos são melhores. Isso significa que o tempo de resposta medido é semelhante à média de todos os dispositivos testados (31 ms). | ||
Cintilação da tela / PWM (modulação por largura de pulso)
| Tela tremeluzindo/PWM detectado | 352.1 Hz | ≤ 99 % configuração de brilho | 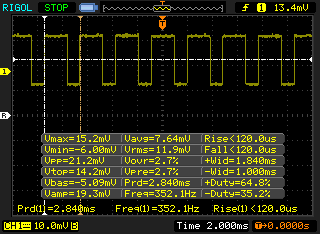 |
A luz de fundo da tela pisca em 352.1 Hz (pior caso, por exemplo, utilizando PWM) Cintilação detectada em uma configuração de brilho de 99 % e abaixo. Não deve haver cintilação ou PWM acima desta configuração de brilho. A frequência de 352.1 Hz é relativamente alta, portanto, a maioria dos usuários sensíveis ao PWM não deve notar nenhuma oscilação. No entanto, há relatos de que alguns usuários ainda são sensíveis ao PWM em 500 Hz e acima, portanto, esteja atento. [pwm_comparison] Em comparação: 52 % de todos os dispositivos testados não usam PWM para escurecer a tela. Se PWM foi detectado, uma média de 7754 (mínimo: 5 - máximo: 343500) Hz foi medida. | |||
| wPrime 2.10 - 1024m | |
| Dell Latitude 7400 2-in-1 | |
| Média Intel Core i5-8265U (371 - 433, n=2) | |
| Média da turma Convertible (262 - 547, n=3, últimos 2 anos) | |
* ... menor é melhor
| PCMark 8 Home Score Accelerated v2 | 3438 pontos | |
| PCMark 8 Work Score Accelerated v2 | 4852 pontos | |
| PCMark 10 Score | 3896 pontos | |
Ajuda | ||
| Lenovo Flex 14IWL Samsung SSD PM981 MZVLB256HAHQ | HP Envy x360 13-ar0601ng SK Hynix BC501 HFM512GDJTNG | Dell Inspiron 14 5000 5482 2-in-1 SK Hynix BC501 NVMe 256 GB | Asus VivoBook Flip 14 TP412UA-DB51T Micron 1100 MTFDDAV256TBN | Acer Spin 5 SP515-51GN-80A3 Intel SSD 600p SSDPEKKW256G7 | |
|---|---|---|---|---|---|
| AS SSD | -36% | -36% | -67% | -45% | |
| Seq Read (MB/s) | 2533 | 1412 -44% | 576 -77% | 437.9 -83% | 1402 -45% |
| Seq Write (MB/s) | 1438 | 540 -62% | 471.6 -67% | 350.3 -76% | 577 -60% |
| 4K Read (MB/s) | 51.7 | 32.24 -38% | 39.48 -24% | 23.31 -55% | 31.89 -38% |
| 4K Write (MB/s) | 109.4 | 74.7 -32% | 112.4 3% | 64.7 -41% | 117.6 7% |
| 4K-64 Read (MB/s) | 771 | 567 -26% | 522 -32% | 234.3 -70% | 278.1 -64% |
| 4K-64 Write (MB/s) | 1268 | 700 -45% | 416.5 -67% | 279.4 -78% | 331.9 -74% |
| Access Time Read * (ms) | 0.053 | 0.049 8% | 0.046 13% | 0.079 -49% | 0.079 -49% |
| Access Time Write * (ms) | 0.034 | 0.048 -41% | 0.032 6% | 0.056 -65% | 0.03 12% |
| Score Read (Points) | 1076 | 741 -31% | 619 -42% | 301 -72% | 450 -58% |
| Score Write (Points) | 1521 | 829 -45% | 576 -62% | 379 -75% | 507 -67% |
| Score Total (Points) | 3106 | 1913 -38% | 1520 -51% | 839 -73% | 1157 -63% |
| Copy ISO MB/s (MB/s) | 521 | 773 | 414.4 | 607 | |
| Copy Program MB/s (MB/s) | 253.1 | 344.4 | 364.3 | 228.5 | |
| Copy Game MB/s (MB/s) | 392.9 | 536 | 354 | 420.5 | |
| CrystalDiskMark 5.2 / 6 | -34% | -22% | -58% | -32% | |
| Write 4K (MB/s) | 136.5 | 88.3 -35% | 111.8 -18% | 66.5 -51% | 132.3 -3% |
| Read 4K (MB/s) | 45.74 | 34.84 -24% | 42.6 -7% | 24.65 -46% | 35.38 -23% |
| Write Seq (MB/s) | 740 | 716 | 413.2 | 592 | |
| Read Seq (MB/s) | 985 | 1107 | 465.2 | 1186 | |
| Write 4K Q32T1 (MB/s) | 380.5 | 313.7 -18% | 451.5 19% | 227 -40% | 323 -15% |
| Read 4K Q32T1 (MB/s) | 437.5 | 243.1 -44% | 316.8 -28% | 188.4 -57% | 289.2 -34% |
| Write Seq Q32T1 (MB/s) | 1502 | 846 -44% | 809 -46% | 439.9 -71% | 593 -61% |
| Read Seq Q32T1 (MB/s) | 3357 | 1783 -47% | 1610 -52% | 533 -84% | 1569 -53% |
| Write 4K Q8T8 (MB/s) | 1435 | 305.7 -79% | |||
| Read 4K Q8T8 (MB/s) | 572 | 698 22% | |||
| Média Total (Programa/Configurações) | -35% /
-35% | -29% /
-31% | -63% /
-64% | -39% /
-40% |
* ... menor é melhor

| 3DMark 11 Performance | 1832 pontos | |
| 3DMark Cloud Gate Standard Score | 7359 pontos | |
| 3DMark Fire Strike Score | 991 pontos | |
Ajuda | ||
| The Witcher 3 | |
| 1024x768 The Witcher 3 low | |
| Média da turma Convertible (22 - 124.6, n=3, últimos 2 anos) | |
| Média Intel UHD Graphics 620 (8.8 - 50.9, n=64) | |
| 1366x768 The Witcher 3 medium | |
| Média da turma Convertible (44.3 - 77.6, n=2, últimos 2 anos) | |
| Média Intel UHD Graphics 620 (8 - 27.9, n=29) | |
| 1920x1080 The Witcher 3 high | |
| Média da turma Convertible (22.9 - 42.8, n=2, últimos 2 anos) | |
| Média Intel UHD Graphics 620 (4.2 - 13.5, n=17) | |
| 1920x1080 The Witcher 3 ultra | |
| Média da turma Convertible (13.4 - 101, n=3, últimos 2 anos) | |
| Média Intel UHD Graphics 620 (2.97 - 5.2, n=7) | |
| baixo | média | alto | ultra | |
|---|---|---|---|---|
| BioShock Infinite (2013) | 40 | 27 | 19 | 7 |
| Farming Simulator 17 (2016) | 52 | 41 | 23 | 13 |
| Rocket League (2017) | 42 | 30 | 23 |
Barulho
| Ocioso |
| 28.4 / 28.4 / 29.1 dB |
| Carga |
| 33.8 / 37.7 dB |
 | ||
30 dB silencioso 40 dB(A) audível 50 dB(A) ruidosamente alto |
||
min: | ||
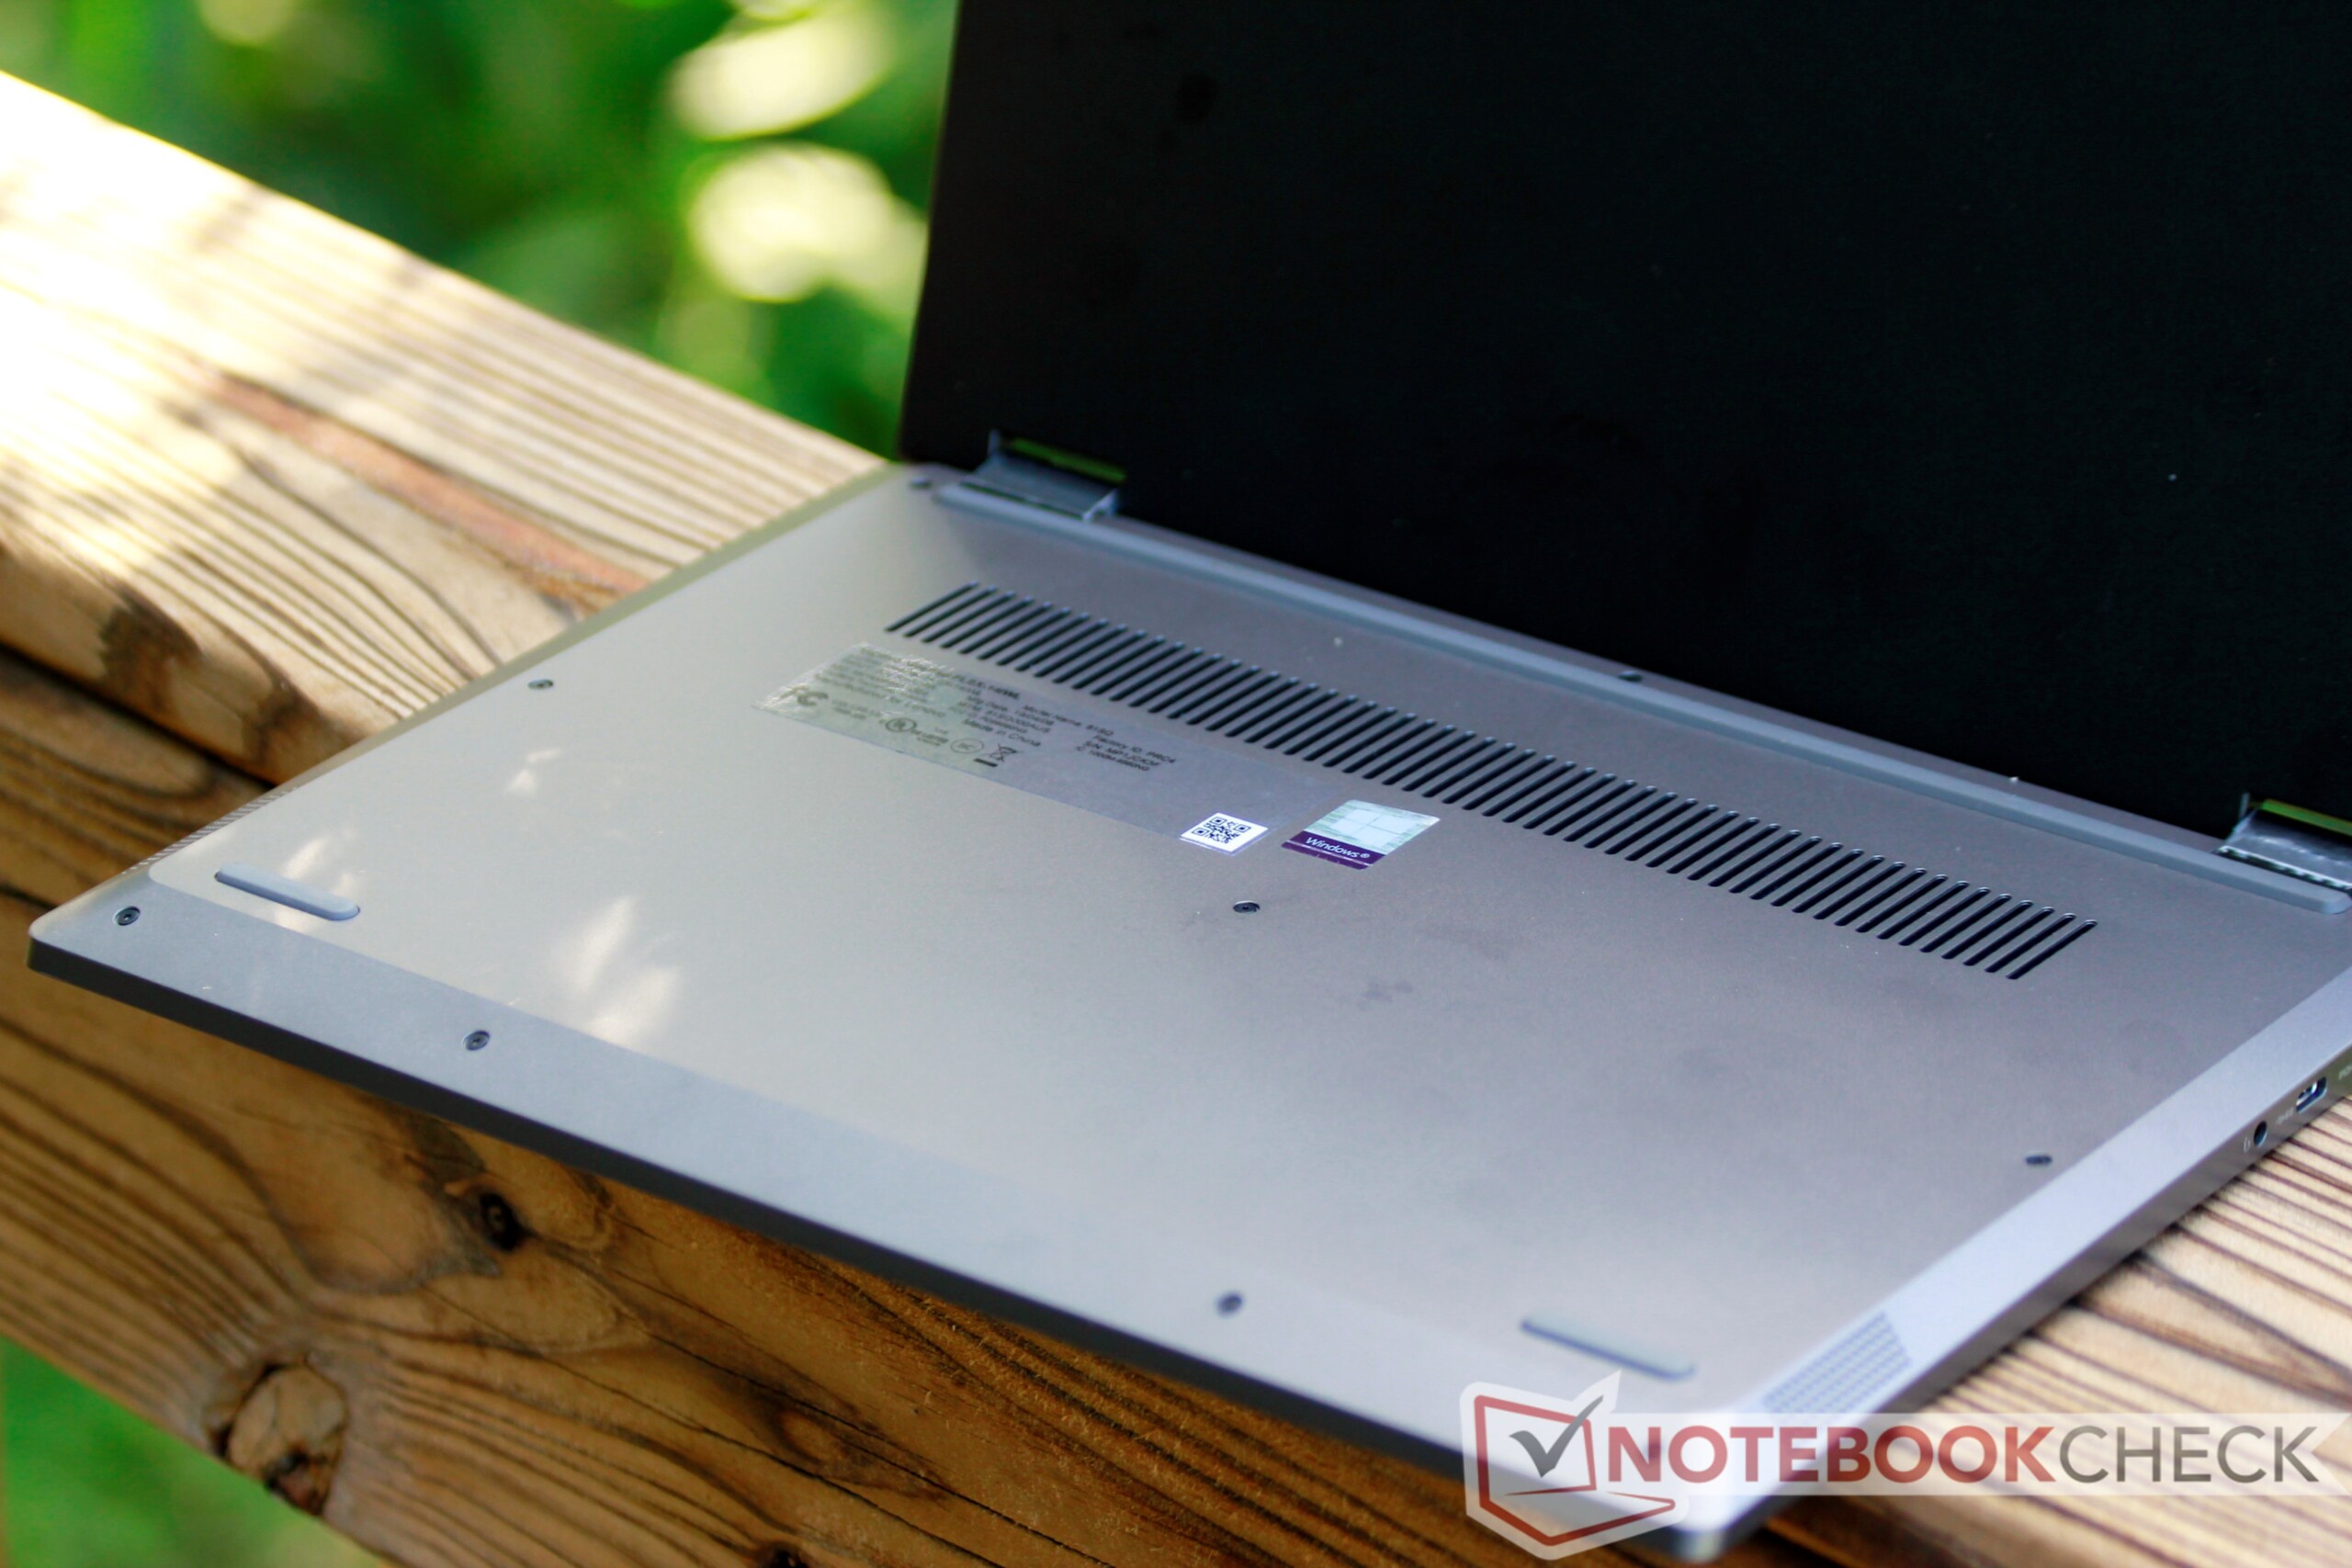
(+) A temperatura máxima no lado superior é 37.6 °C / 100 F, em comparação com a média de 35.4 °C / 96 F , variando de 19.6 a 60 °C para a classe Convertible.
(-) A parte inferior aquece até um máximo de 45.8 °C / 114 F, em comparação com a média de 36.9 °C / 98 F
(+) Em uso inativo, a temperatura média para o lado superior é 26.5 °C / 80 F, em comparação com a média do dispositivo de 30.3 °C / ### class_avg_f### F.
(+) Os apoios para as mãos e o touchpad são mais frios que a temperatura da pele, com um máximo de 25.6 °C / 78.1 F e, portanto, são frios ao toque.
(+) A temperatura média da área do apoio para as mãos de dispositivos semelhantes foi 28 °C / 82.4 F (+2.4 °C / 4.3 F).
Lenovo Flex 14IWL análise de áudio
(±) | o volume do alto-falante é médio, mas bom (###valor### dB)
Graves 100 - 315Hz
(±) | graves reduzidos - em média 11.3% menor que a mediana
(±) | a linearidade dos graves é média (11.1% delta para a frequência anterior)
Médios 400 - 2.000 Hz
(±) | médios mais altos - em média 5.8% maior que a mediana
(+) | médios são lineares (3.6% delta para frequência anterior)
Altos 2 - 16 kHz
(+) | agudos equilibrados - apenas 1.3% longe da mediana
(±) | a linearidade dos máximos é média (7.4% delta para frequência anterior)
Geral 100 - 16.000 Hz
(±) | a linearidade do som geral é média (16.9% diferença em relação à mediana)
Comparado com a mesma classe
» 32% de todos os dispositivos testados nesta classe foram melhores, 7% semelhantes, 61% piores
» O melhor teve um delta de 6%, a média foi 20%, o pior foi 57%
Comparado com todos os dispositivos testados
» 30% de todos os dispositivos testados foram melhores, 8% semelhantes, 62% piores
» O melhor teve um delta de 4%, a média foi 23%, o pior foi 134%
Asus VivoBook Flip 14 TP412UA-DB51T análise de áudio
(±) | o volume do alto-falante é médio, mas bom (###valor### dB)
Graves 100 - 315Hz
(-) | quase nenhum baixo - em média 18.2% menor que a mediana
(±) | a linearidade dos graves é média (12.3% delta para a frequência anterior)
Médios 400 - 2.000 Hz
(+) | médios equilibrados - apenas 3.2% longe da mediana
(+) | médios são lineares (6.4% delta para frequência anterior)
Altos 2 - 16 kHz
(+) | agudos equilibrados - apenas 4.6% longe da mediana
(+) | os máximos são lineares (5.6% delta da frequência anterior)
Geral 100 - 16.000 Hz
(±) | a linearidade do som geral é média (18.4% diferença em relação à mediana)
Comparado com a mesma classe
» 41% de todos os dispositivos testados nesta classe foram melhores, 7% semelhantes, 52% piores
» O melhor teve um delta de 6%, a média foi 20%, o pior foi 57%
Comparado com todos os dispositivos testados
» 41% de todos os dispositivos testados foram melhores, 8% semelhantes, 51% piores
» O melhor teve um delta de 4%, a média foi 23%, o pior foi 134%
| desligado | |
| Ocioso | |
| Carga |
|
Key:
min: | |
| Lenovo Flex 14IWL i5-8265U, UHD Graphics 620, Samsung SSD PM981 MZVLB256HAHQ, IPS, 1920x1080, 14" | HP Envy x360 13-ar0601ng R7 3700U, Vega 10, SK Hynix BC501 HFM512GDJTNG, IPS, 120 Hz, 1920x1080, 13.3" | Dell Inspiron 14 5000 5482 2-in-1 i7-8565U, UHD Graphics 620, SK Hynix BC501 NVMe 256 GB, IPS, 1920x1080, 14" | Asus VivoBook Flip 14 TP412UA-DB51T i5-8250U, UHD Graphics 620, Micron 1100 MTFDDAV256TBN, IPS, 1920x1080, 14" | Acer Spin 5 SP515-51GN-80A3 i5-8550U, GeForce GTX 1050 Mobile, Intel SSD 600p SSDPEKKW256G7, a-Si TFT-LCD, LCM, IPS, 1920x1080, 15.6" | |
|---|---|---|---|---|---|
| Power Consumption | 37% | 32% | 45% | -2% | |
| Idle Minimum * (Watt) | 9.4 | 3.2 66% | 3.4 64% | 3.3 65% | 3.9 59% |
| Idle Average * (Watt) | 13.3 | 2.8 79% | 6.4 52% | 5.2 61% | 6.7 50% |
| Idle Maximum * (Watt) | 13.9 | 12.4 11% | 7.8 44% | 5.6 60% | 8.7 37% |
| Load Average * (Watt) | 39.7 | 24.2 39% | 36.7 8% | 32.9 17% | 74 -86% |
| Load Maximum * (Watt) | 46.5 | 50 -8% | 49.3 -6% | 35.2 24% | 79 -70% |
* ... menor é melhor
| Lenovo Flex 14IWL i5-8265U, UHD Graphics 620, 45 Wh | HP Envy x360 13-ar0601ng R7 3700U, Vega 10, 53 Wh | Dell Inspiron 14 5000 5482 2-in-1 i7-8565U, UHD Graphics 620, 42 Wh | Asus VivoBook Flip 14 TP412UA-DB51T i5-8250U, UHD Graphics 620, 42 Wh | Acer Spin 5 SP515-51GN-80A3 i5-8550U, GeForce GTX 1050 Mobile, 48 Wh | |
|---|---|---|---|---|---|
| Duração da bateria | 10% | -5% | -8% | -7% | |
| Reader / Idle (h) | 13.6 | 10.5 -23% | 12.4 -9% | 12.7 -7% | |
| WiFi v1.3 (h) | 10.4 | 7.3 -30% | 7.2 -31% | 9.6 -8% | 6.2 -40% |
| Load (h) | 1.2 | 2.2 83% | 1.5 25% | 1.5 25% |
Pro
Contra
Verdict - Good, but there are better options
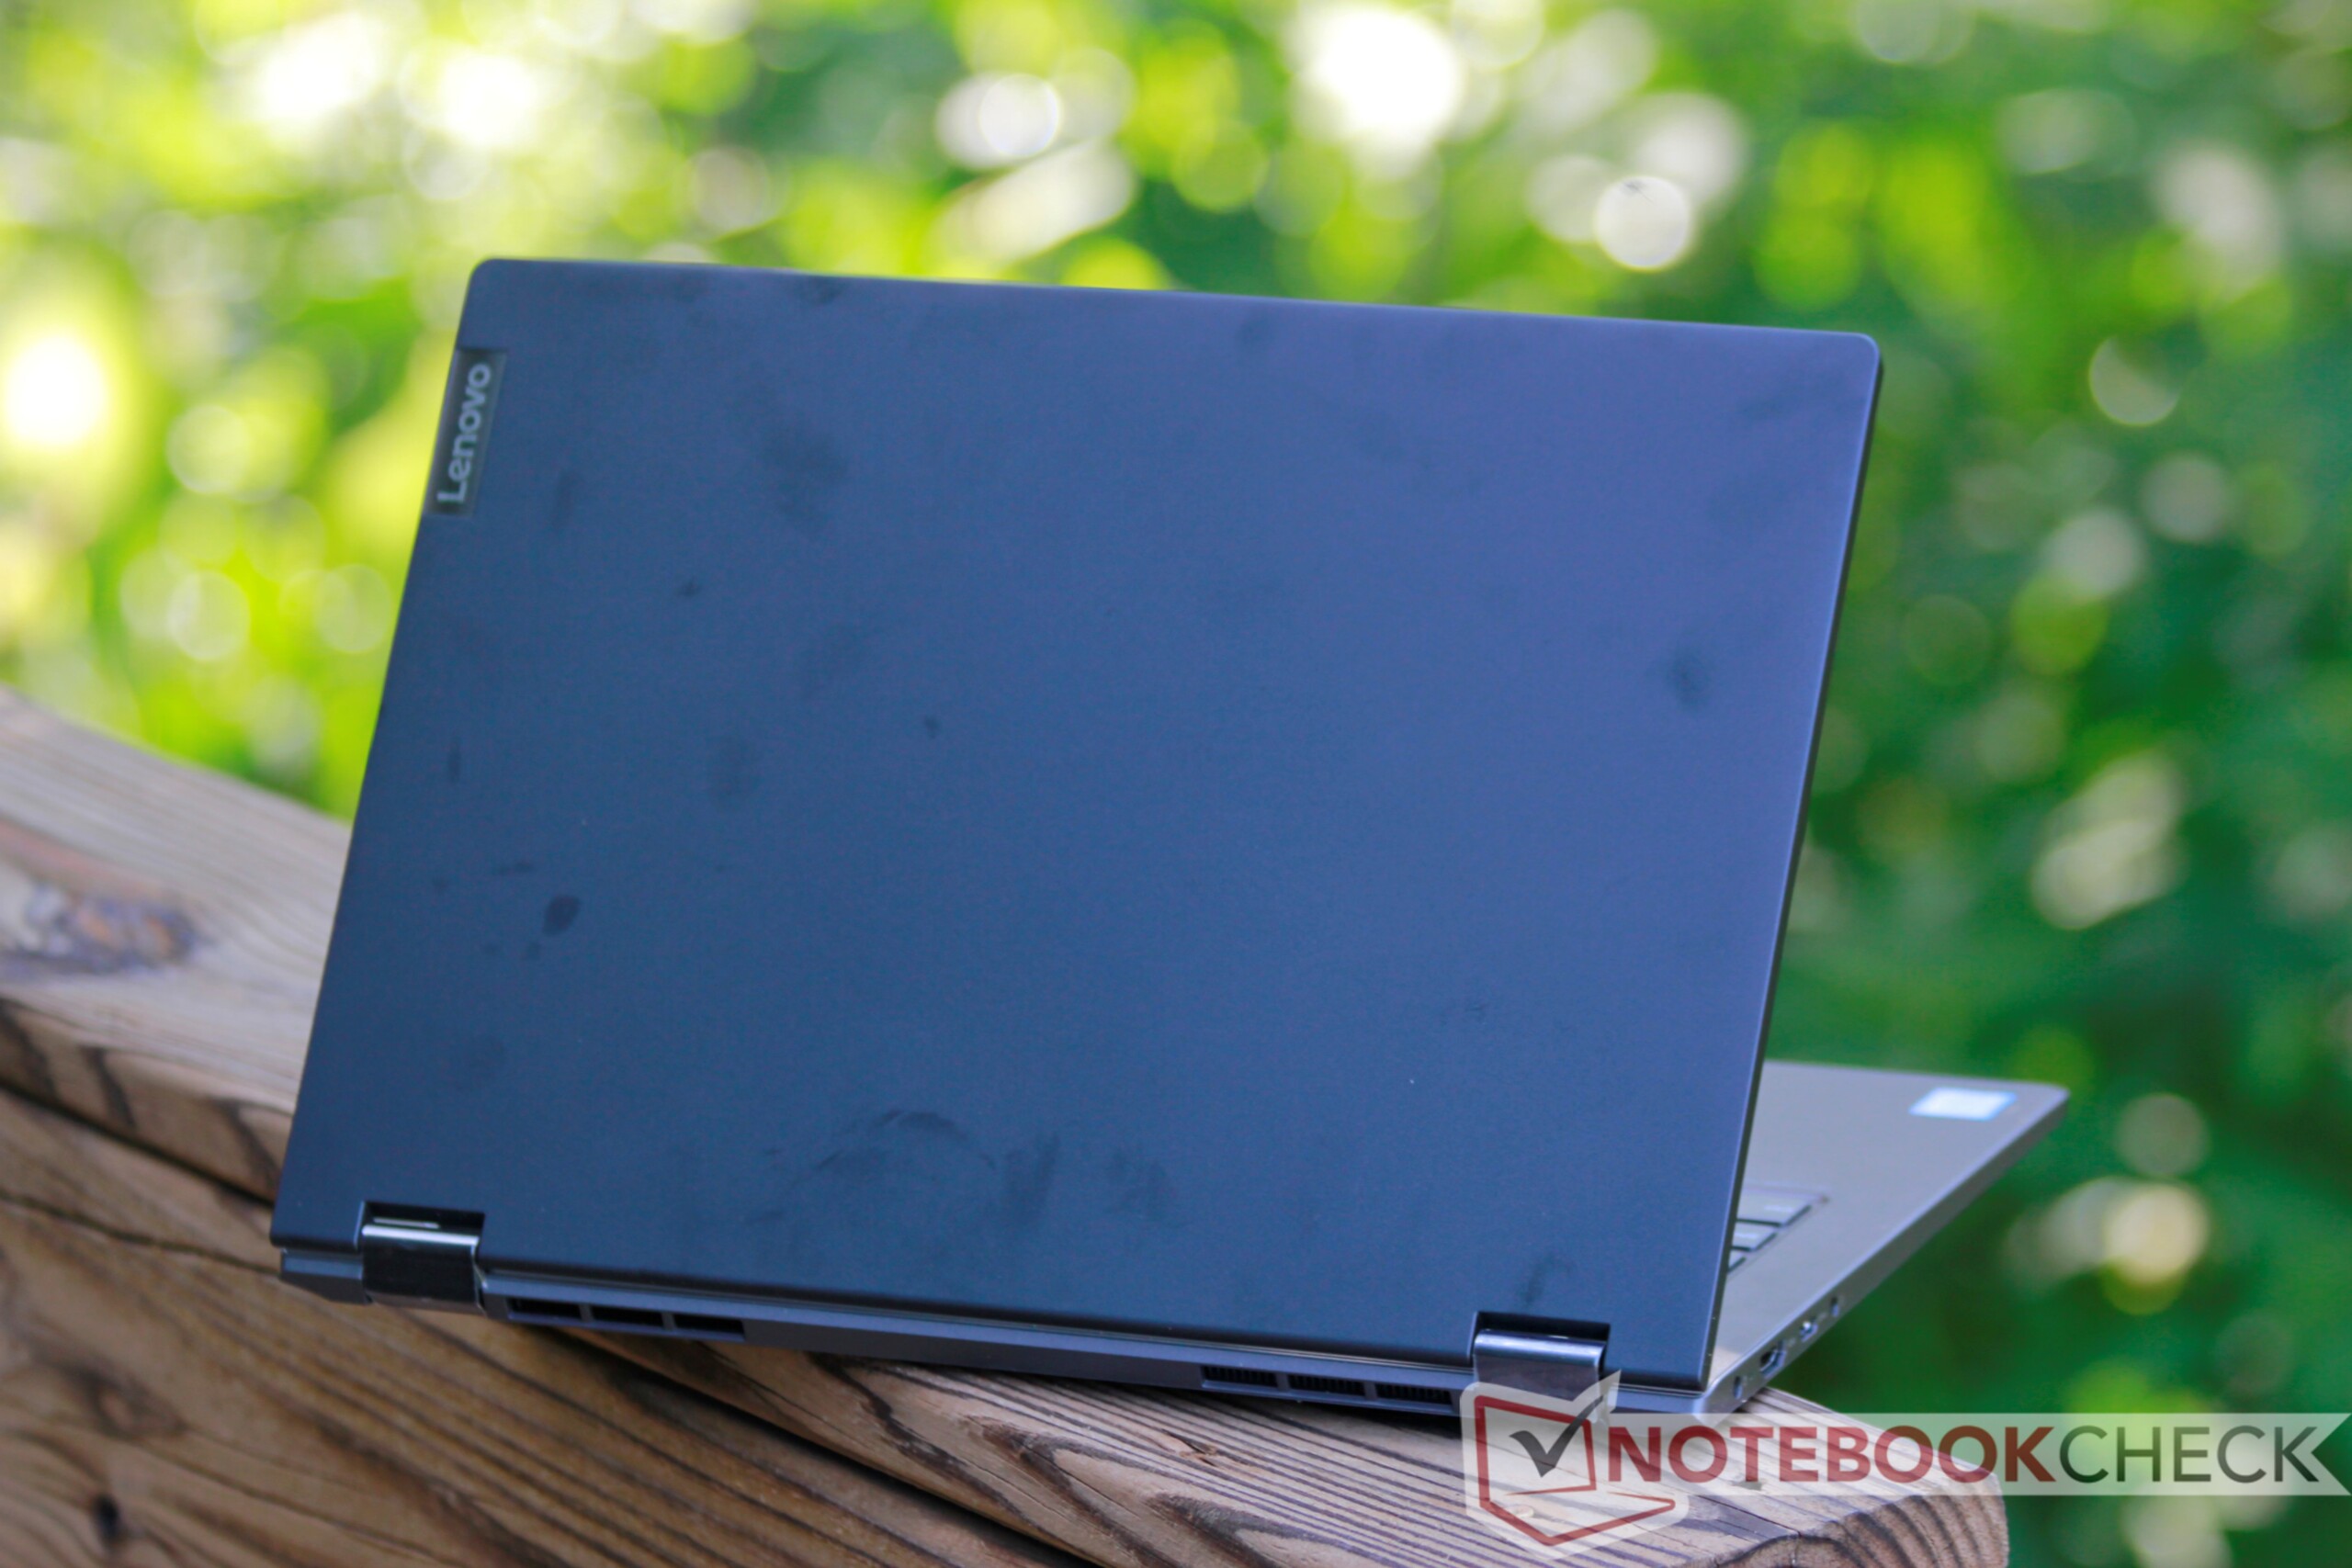
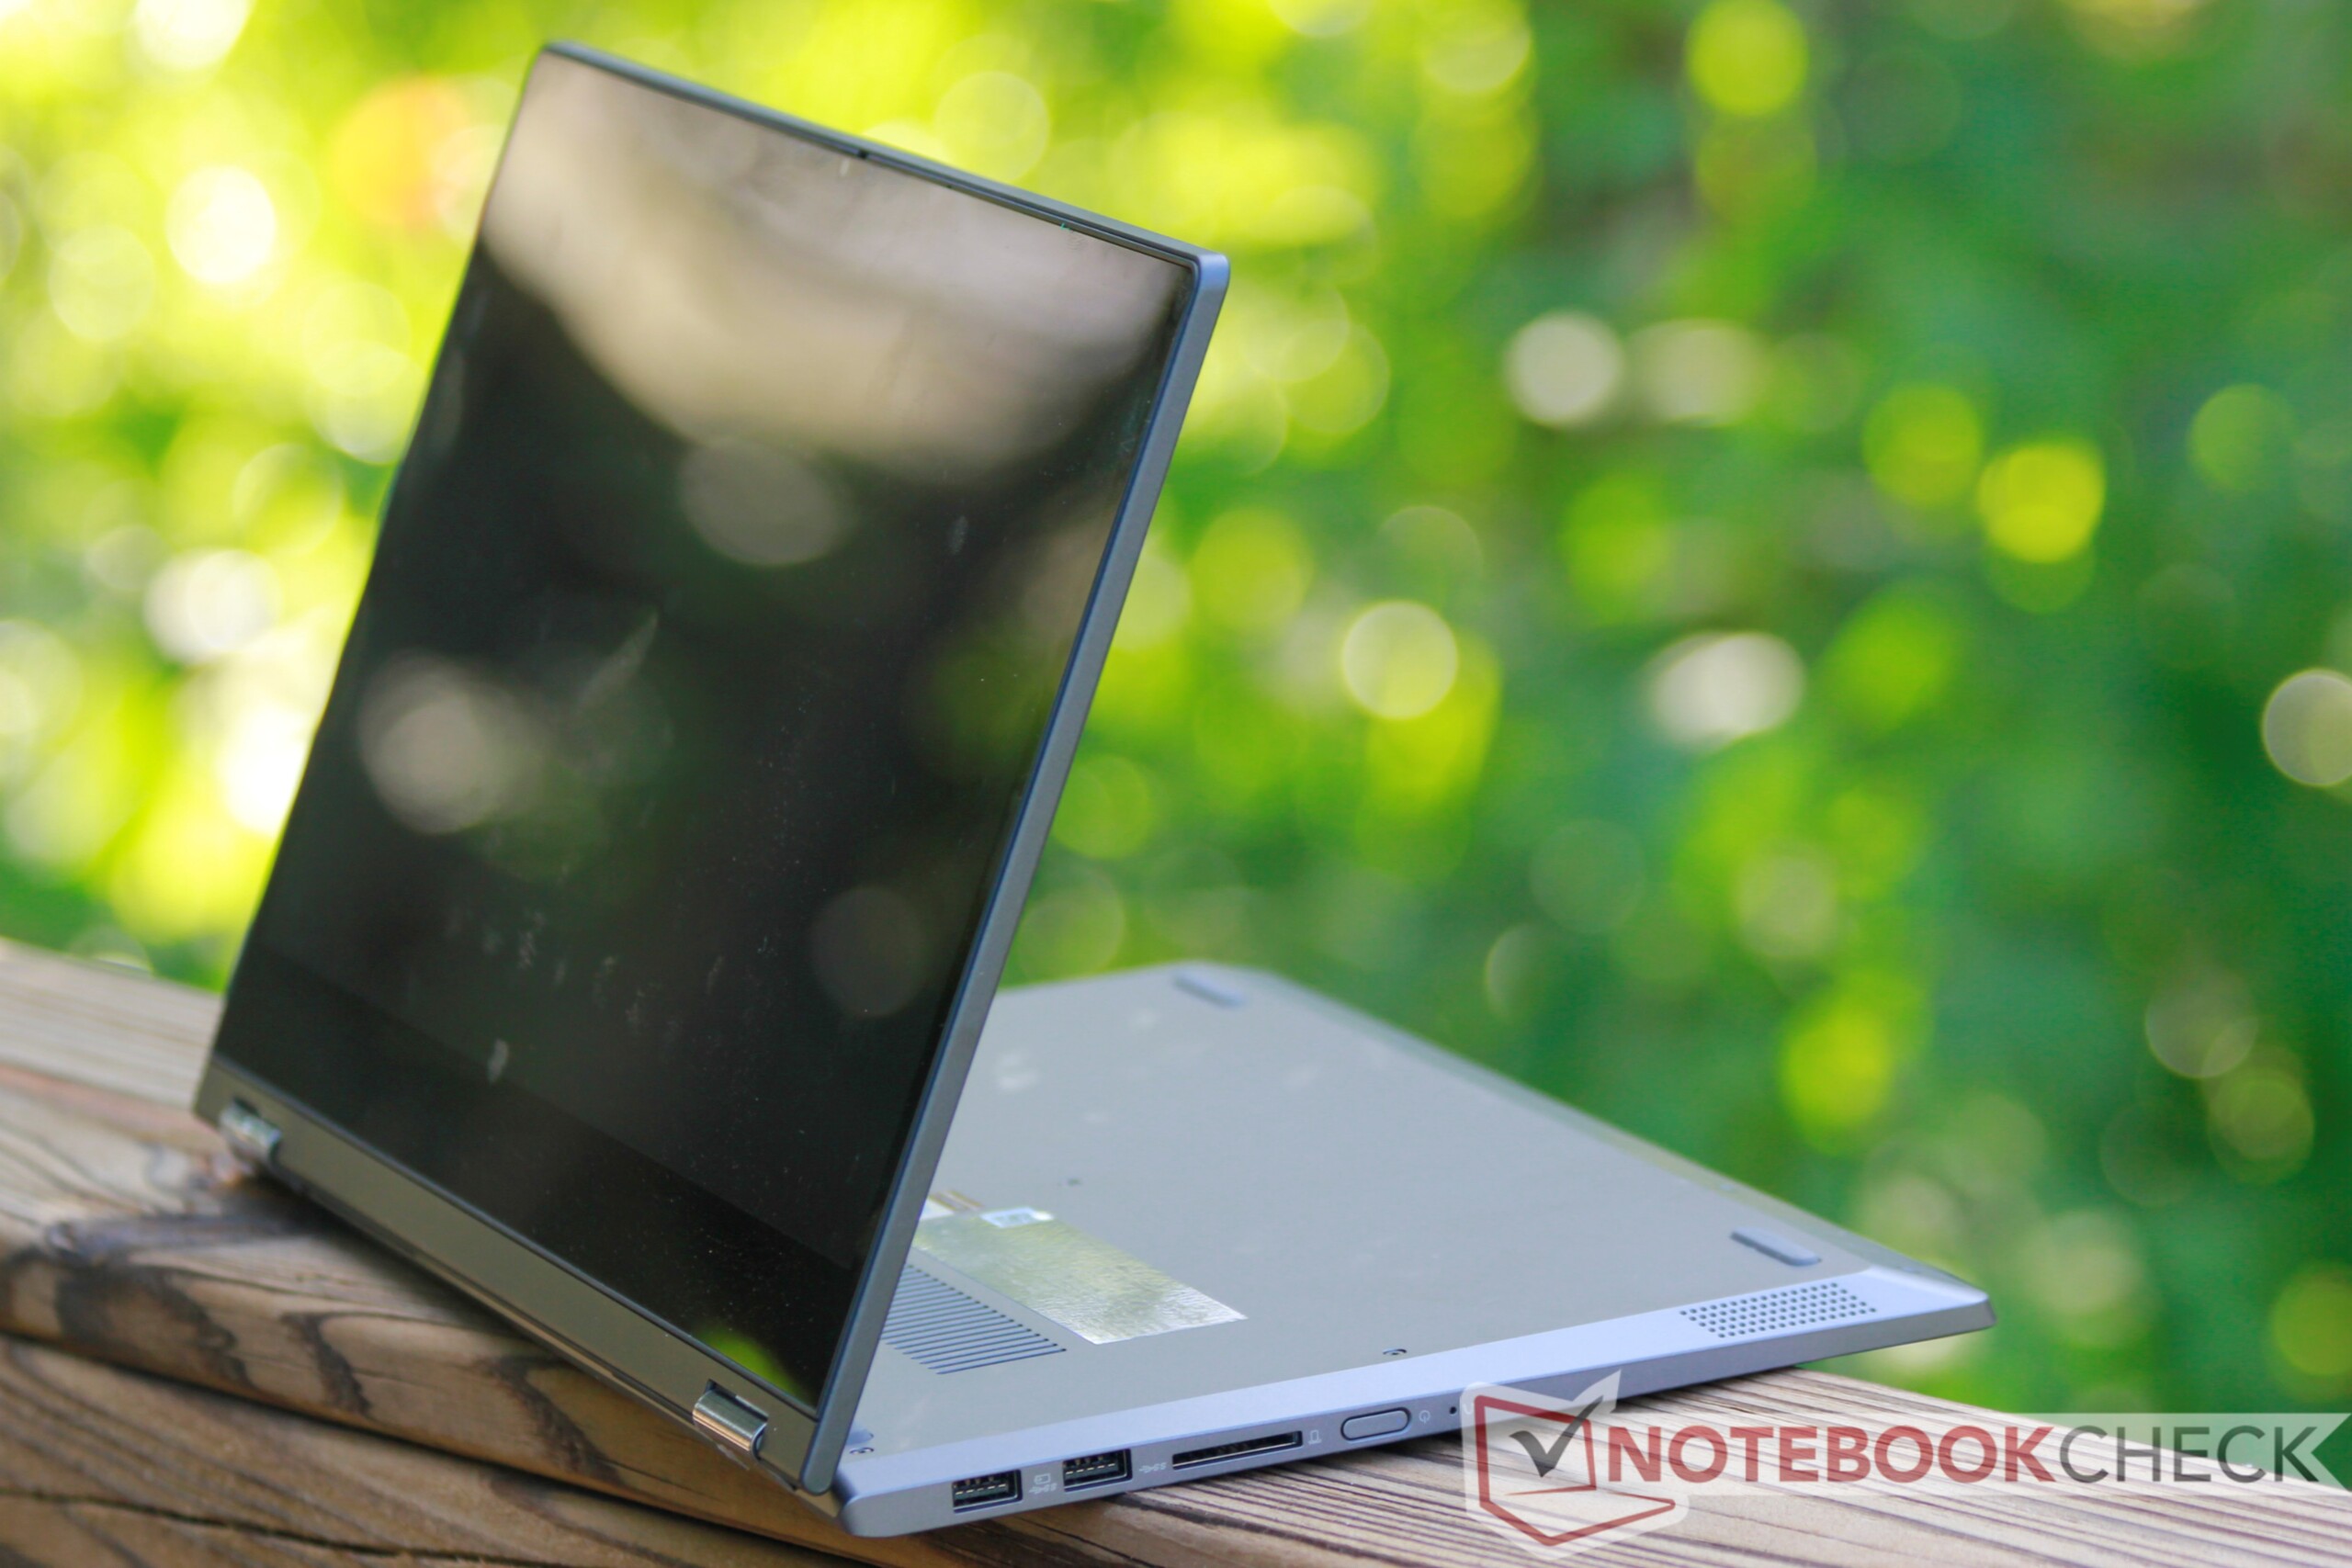
O Lenovo Flex 14 deixa uma impressão confusa. Suas áreas mais fortes estão na duração da bateria e na velocidade de armazenamento. É difícil encontrar um portátil com uma unidade NVMe no preço de US$800, e o fato de o Flex 14 durar o dia inteiro com uma carga é a cereja no topo do bolo. No entanto, o Flex 14 compromete o teclado, um corpo de plástico e uma tela medíocre.
O Flex 14 talvez seja mais adequado para estudantes em busca de um conversível de baixo custo que não se importe em sacrificar no teclado, qualidade de construção e brilho da tela. Existem opções semelhantes disponíveis a um preço mais baixo (como o Asus VivoBook Flip 14). Gastar um pouco mais pode render o superior Yoga 730 ou ThinkPad X390 Yoga, ambos os quais superam o Flex 14 em todas as áreas. O HP Envy x360 13 também é uma opção viável; por US$ 100 a 200 a mais, o Envy x360 garante uma tela mais brilhante, teclado melhor e melhor desempenho gráfico, apesar de sacrificar algumas horas de duração da bateria.
É difícil pegar o Flex 14. Embora não falhe em nenhuma categoria, ele também não se destaca em nenhuma. O Flex 14 é um tipo de portátil "poli funcional, mestre de nenhum" e não se destaca de nenhuma maneira significativa.
Lenovo Flex 14IWL
- 07/10/2019 v6 (old)
Sam Medley
Price comparison
