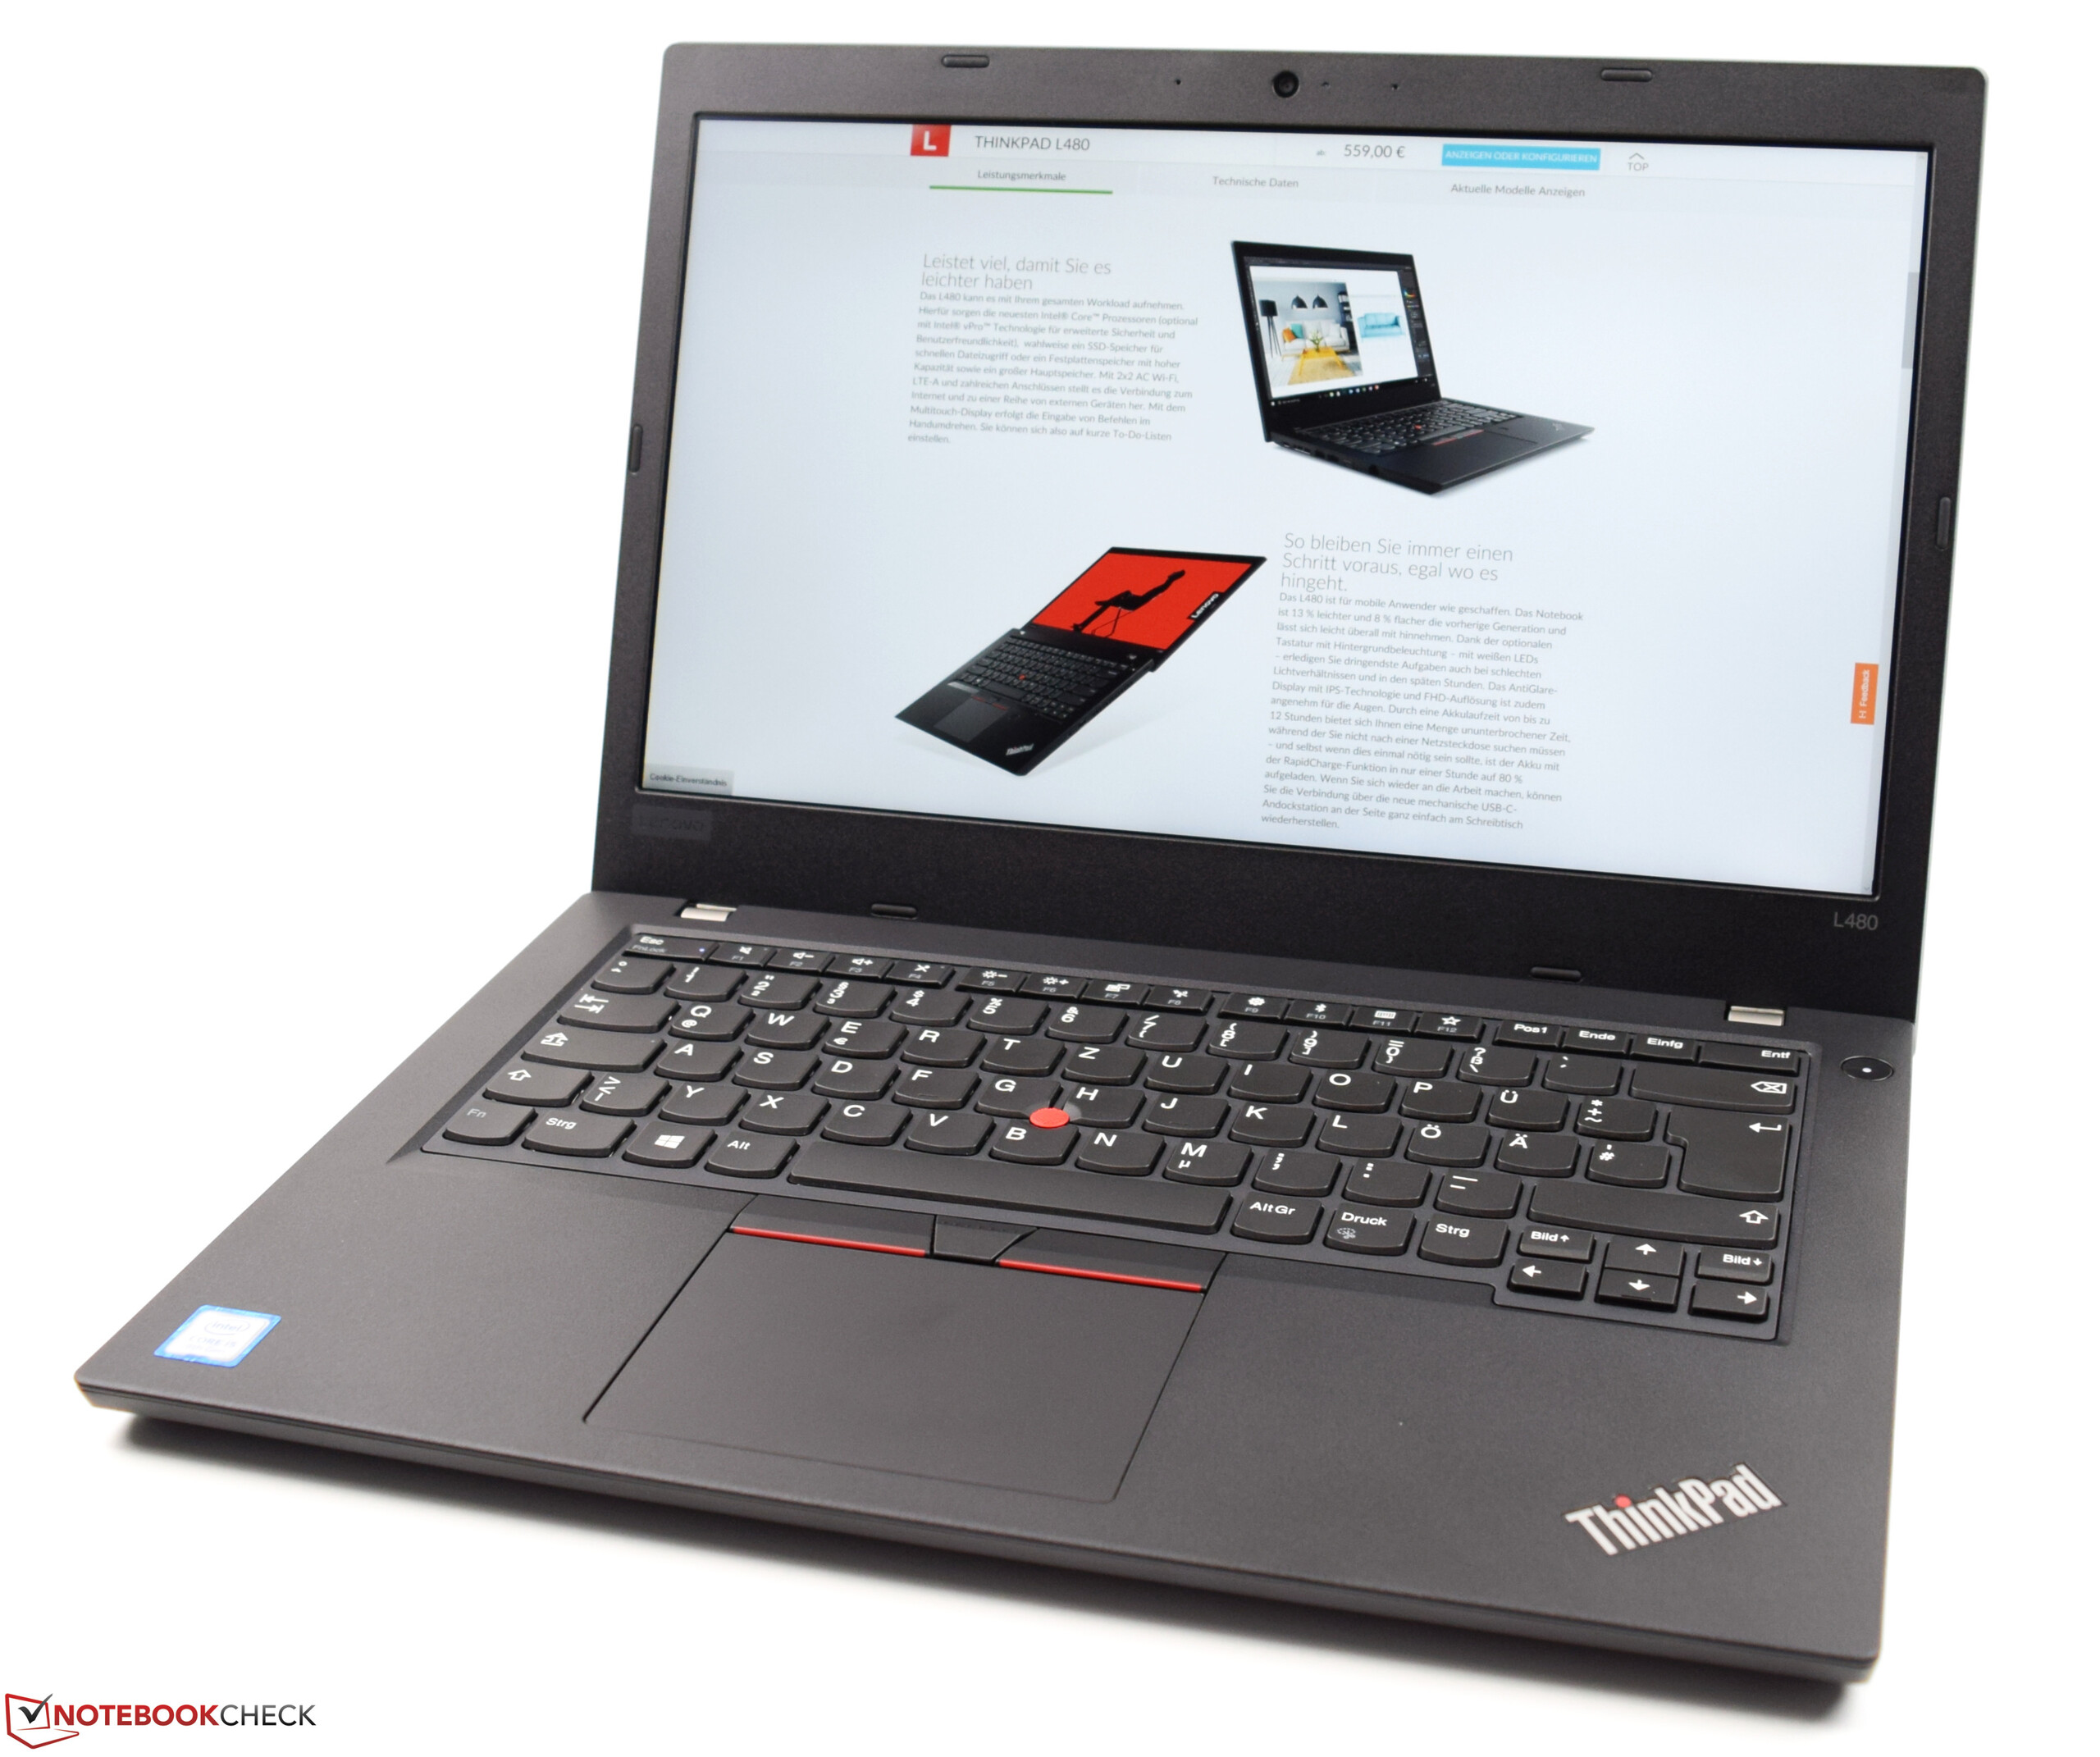
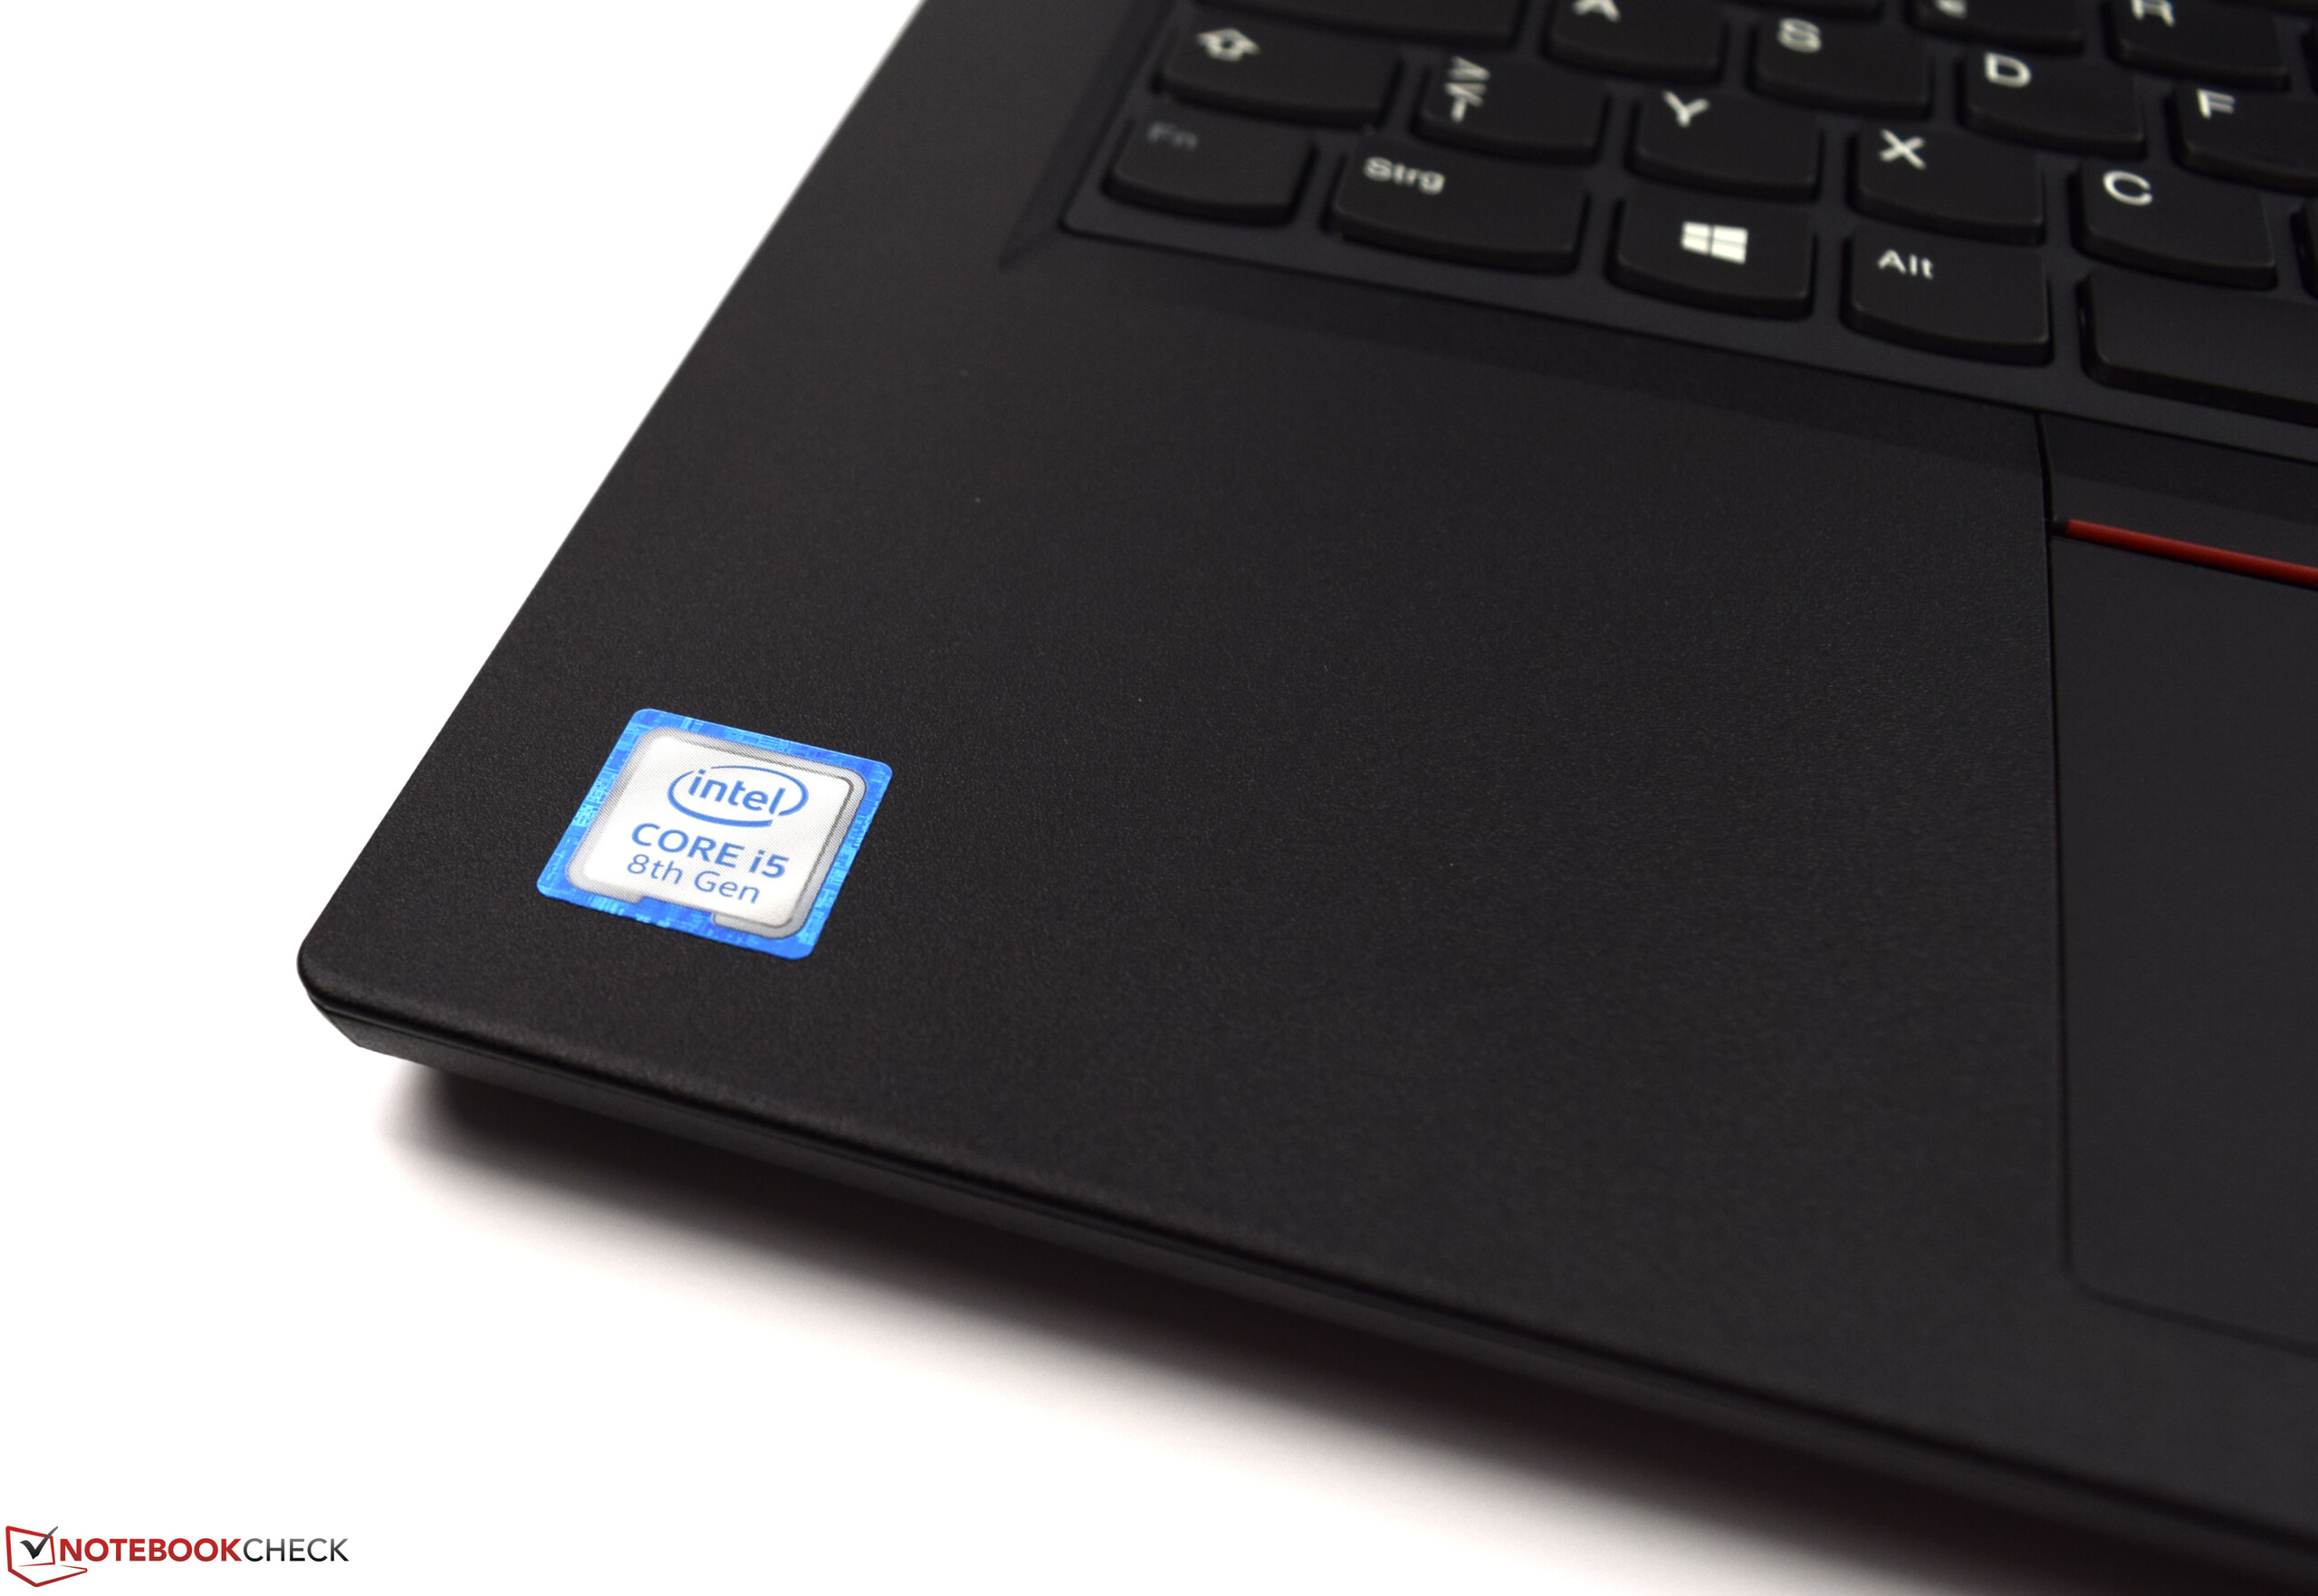
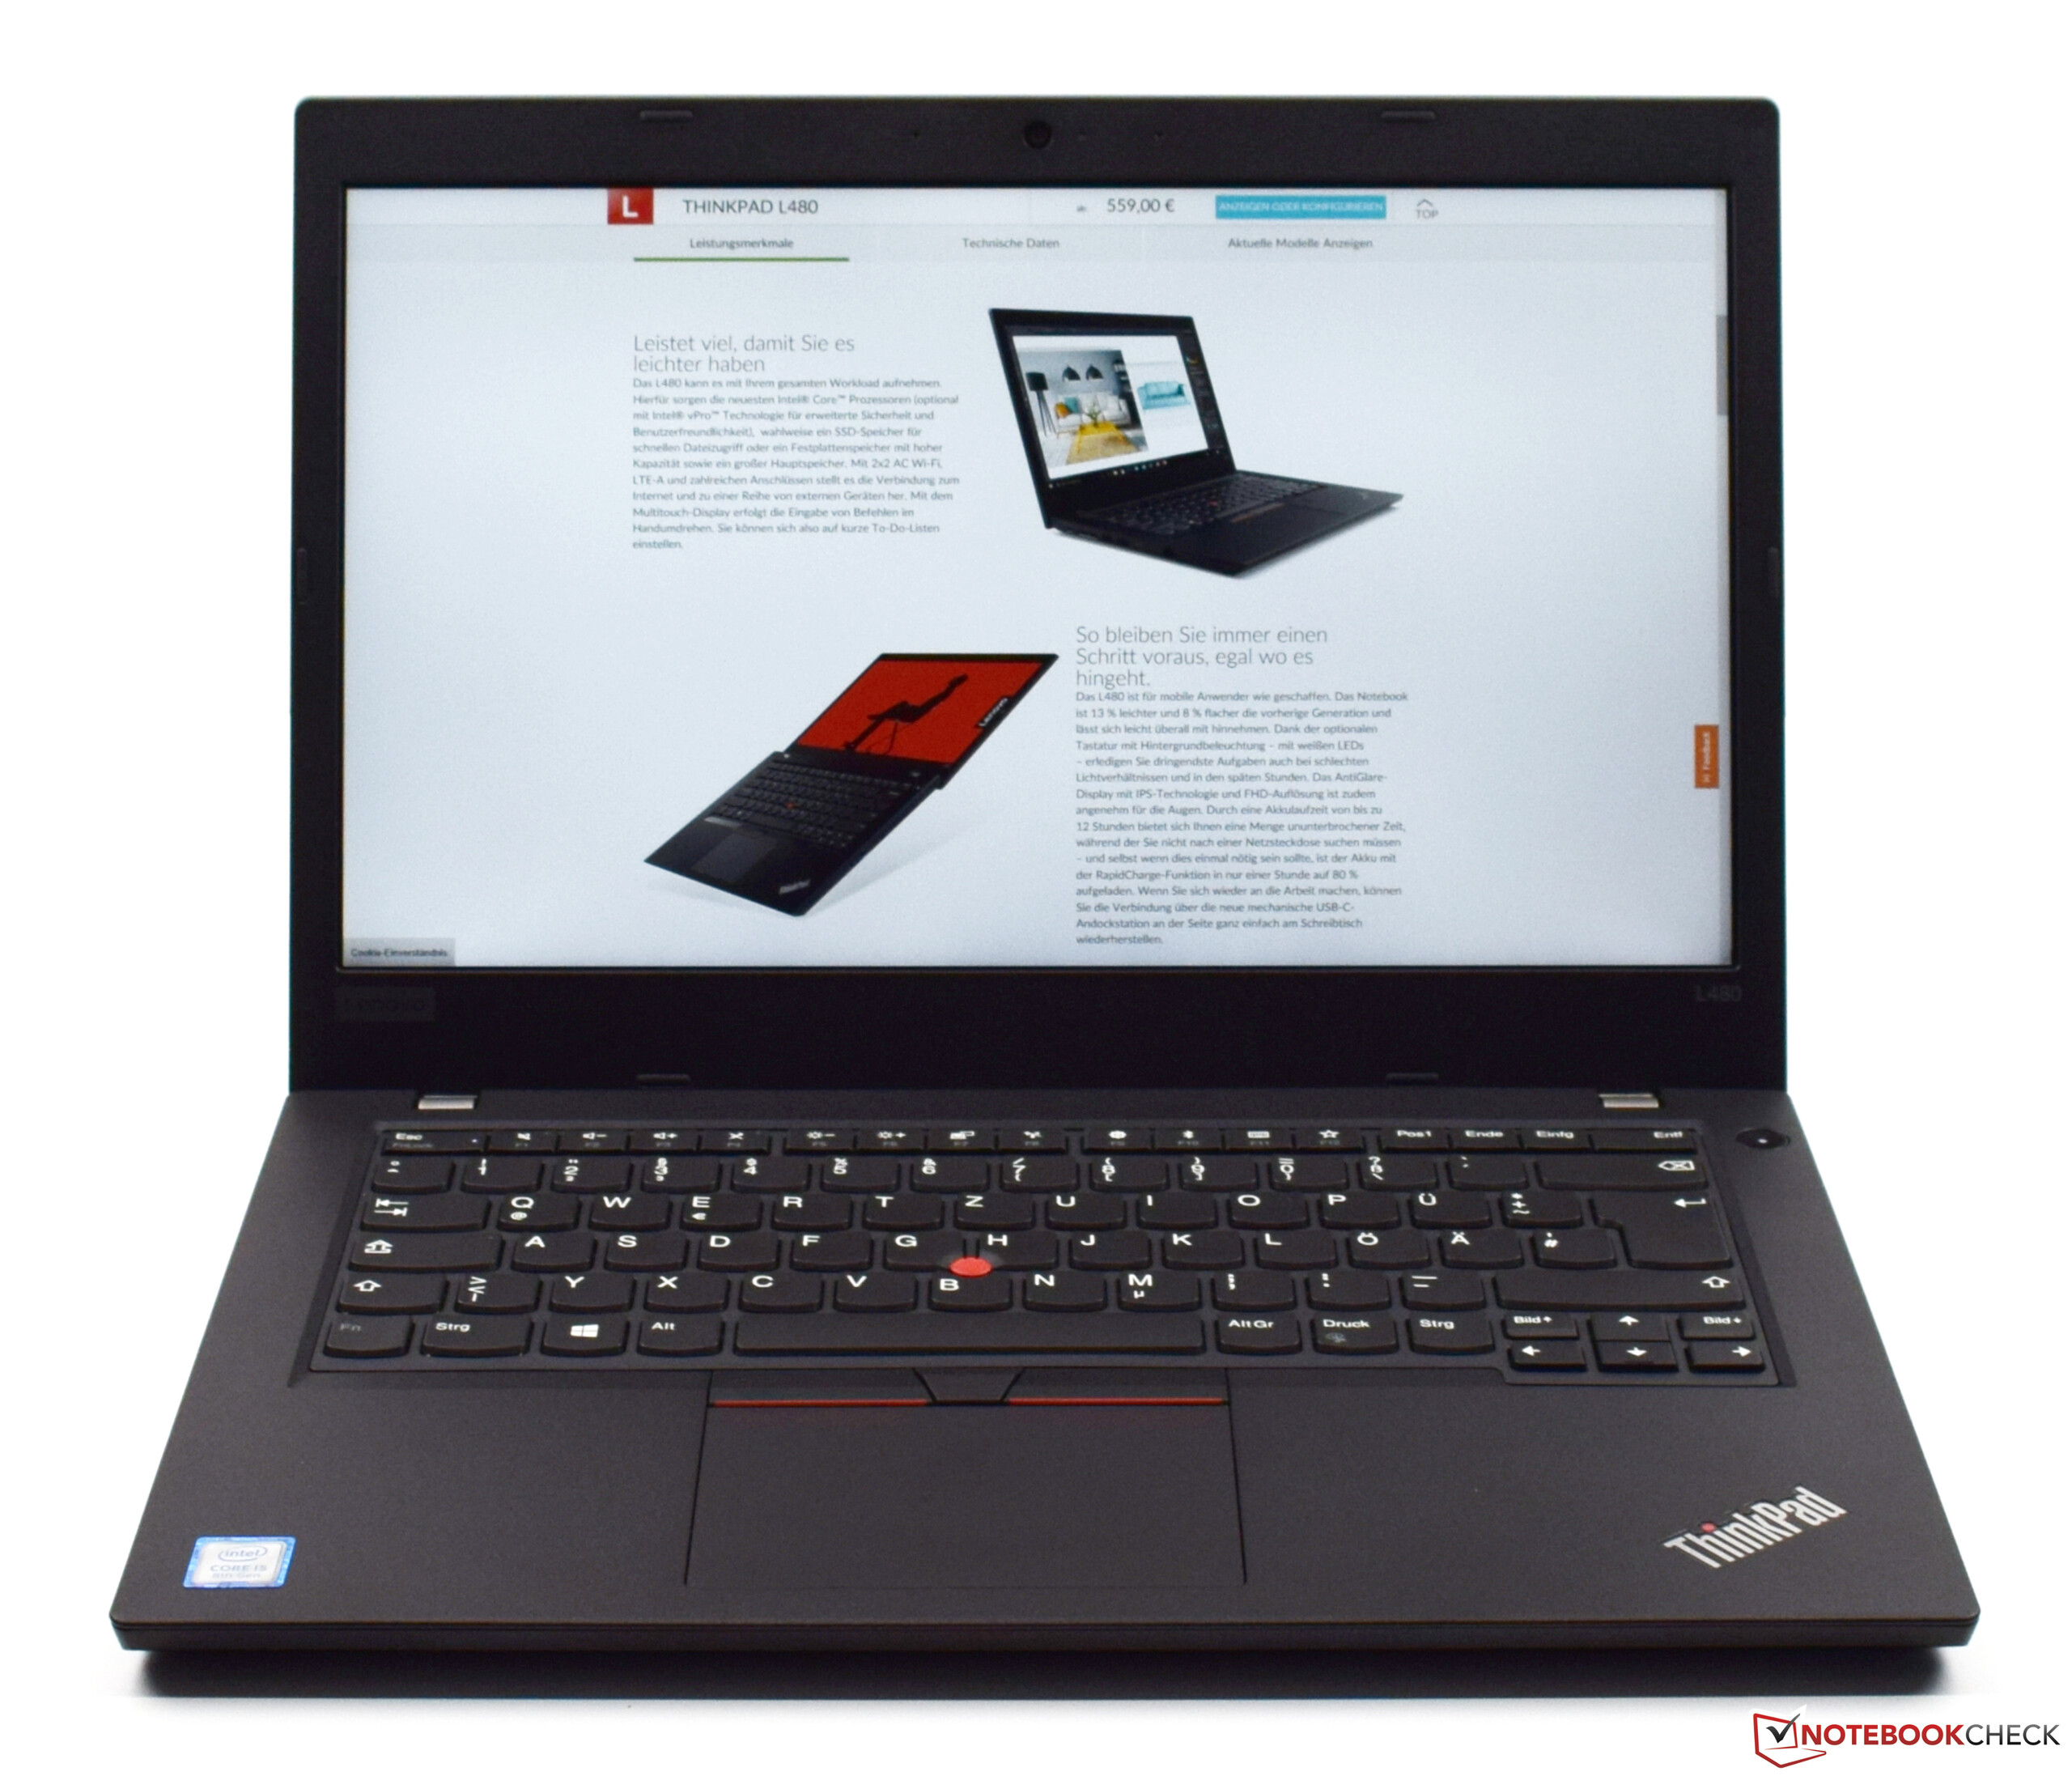
Breve Análise do Portátil Lenovo ThinkPad L480 (i5-8250U, UHD 620, IPS, SSD)
| SD Card Reader | |
| average JPG Copy Test (av. of 3 runs) | |
| Dell Latitude 5490-TD70X (Toshiba Exceria Pro SDXC 64 GB UHS-II) | |
| HP ProBook 440 G5-3KX87ES (Toshiba Exceria Pro SDXC 64 GB UHS-II) | |
| Lenovo ThinkPad E480-20KQS00000 (Toshiba Exceria Pro M501) | |
| Lenovo ThinkPad E480-20KNCTO1WW (Toshiba Exceria Pro M501) | |
| Lenovo ThinkPad L470-20J5S00C00 (Toshiba Exceria Pro SDXC 64 GB UHS-II) | |
| Lenovo ThinkPad L480-20LS001AGE (Toshiba Exceria Pro M501 microSDXC 64GB) | |
| Média da turma Office (19.8 - 198.5, n=22, últimos 2 anos) | |
| maximum AS SSD Seq Read Test (1GB) | |
| Dell Latitude 5490-TD70X (Toshiba Exceria Pro SDXC 64 GB UHS-II) | |
| HP ProBook 440 G5-3KX87ES (Toshiba Exceria Pro SDXC 64 GB UHS-II) | |
| Lenovo ThinkPad E480-20KNCTO1WW (Toshiba Exceria Pro M501) | |
| Lenovo ThinkPad L480-20LS001AGE (Toshiba Exceria Pro M501 microSDXC 64GB) | |
| Lenovo ThinkPad L470-20J5S00C00 (Toshiba Exceria Pro SDXC 64 GB UHS-II) | |
| Lenovo ThinkPad E480-20KQS00000 (Toshiba Exceria Pro M501) | |
| Média da turma Office (27.4 - 249, n=21, últimos 2 anos) | |
| Networking | |
| iperf3 transmit AX12 | |
| Lenovo ThinkPad L480-20LS001AGE | |
| HP ProBook 440 G5-3KX87ES | |
| Lenovo ThinkPad E480-20KQS00000 | |
| Dell Latitude 5490-TD70X | |
| Lenovo ThinkPad L470-20J5S00C00 | |
| Lenovo ThinkPad E480-20KNCTO1WW | |
| iperf3 receive AX12 | |
| Lenovo ThinkPad L470-20J5S00C00 | |
| Lenovo ThinkPad E480-20KQS00000 | |
| HP ProBook 440 G5-3KX87ES | |
| Dell Latitude 5490-TD70X | |
| Lenovo ThinkPad L480-20LS001AGE | |
| Lenovo ThinkPad E480-20KNCTO1WW | |
| |||||||||||||||||||||||||
iluminação: 73 %
iluminação com acumulador: 2.3 cd/m²
Contraste: 1306:1 (Preto: 0.17 cd/m²)
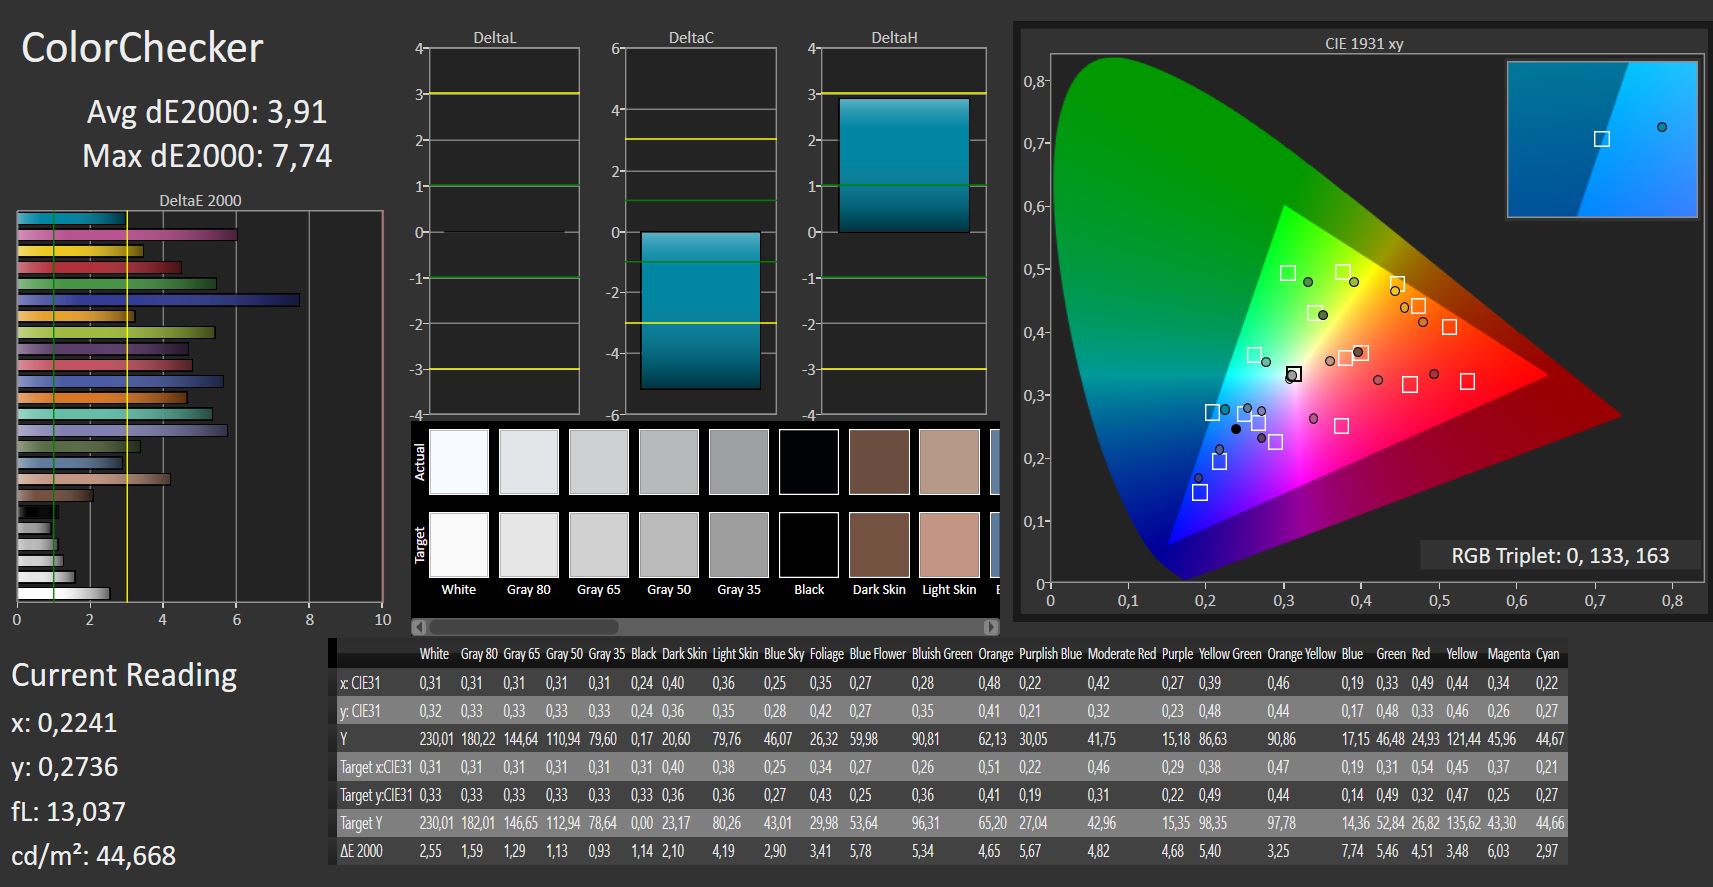
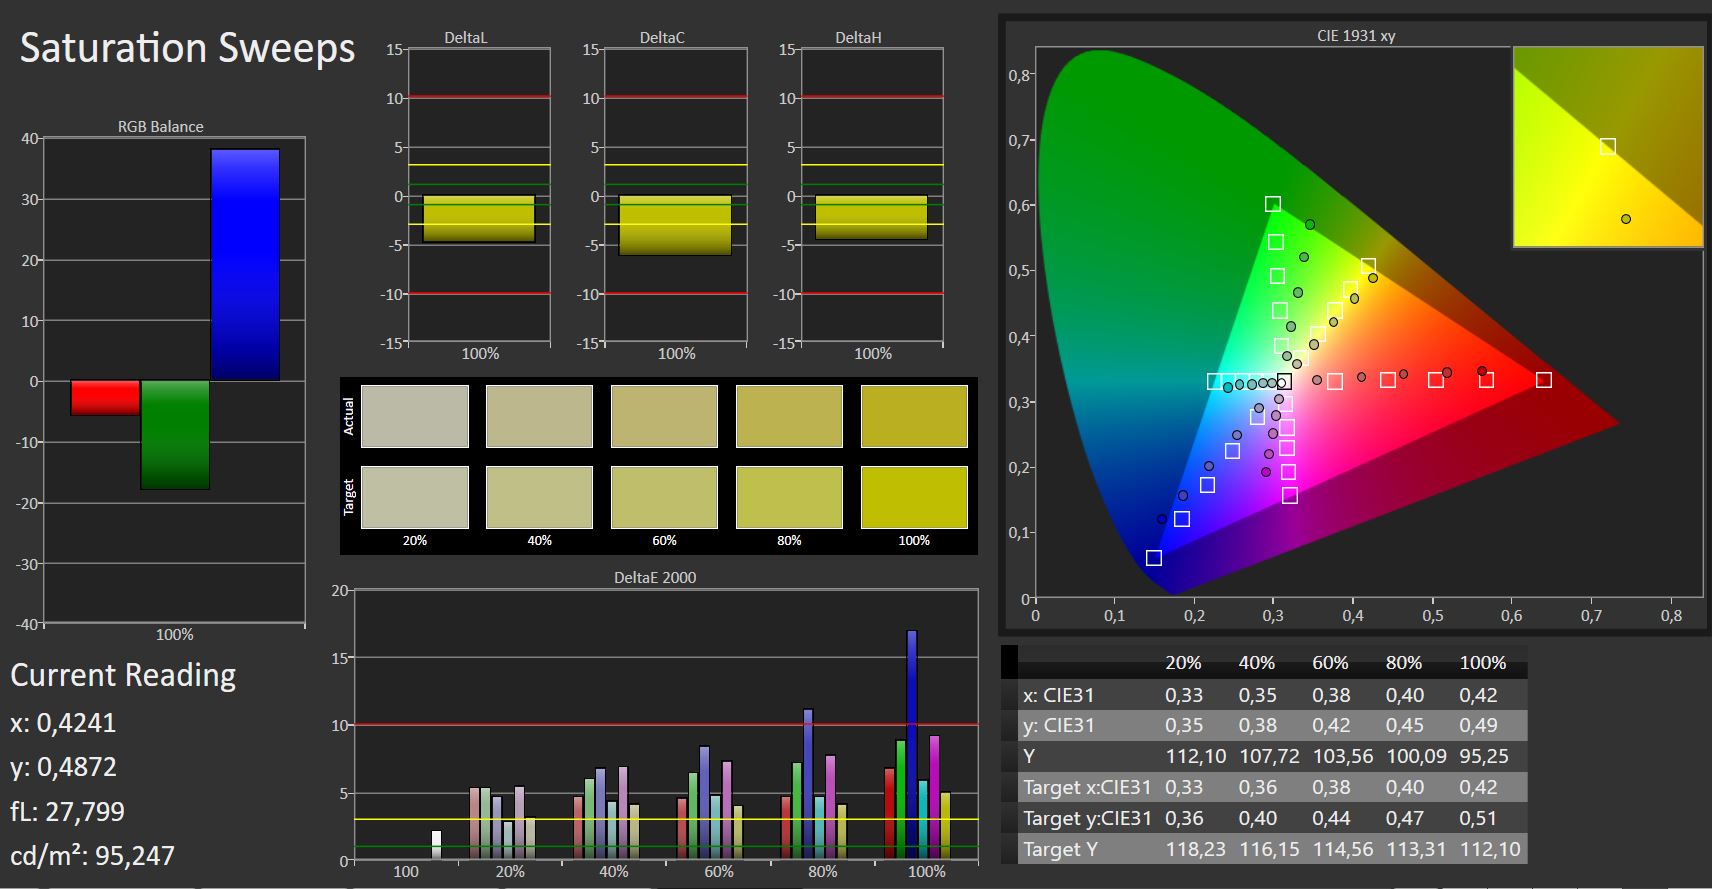
ΔE ColorChecker Calman: 3.91 | ∀{0.5-29.43 Ø4.71}
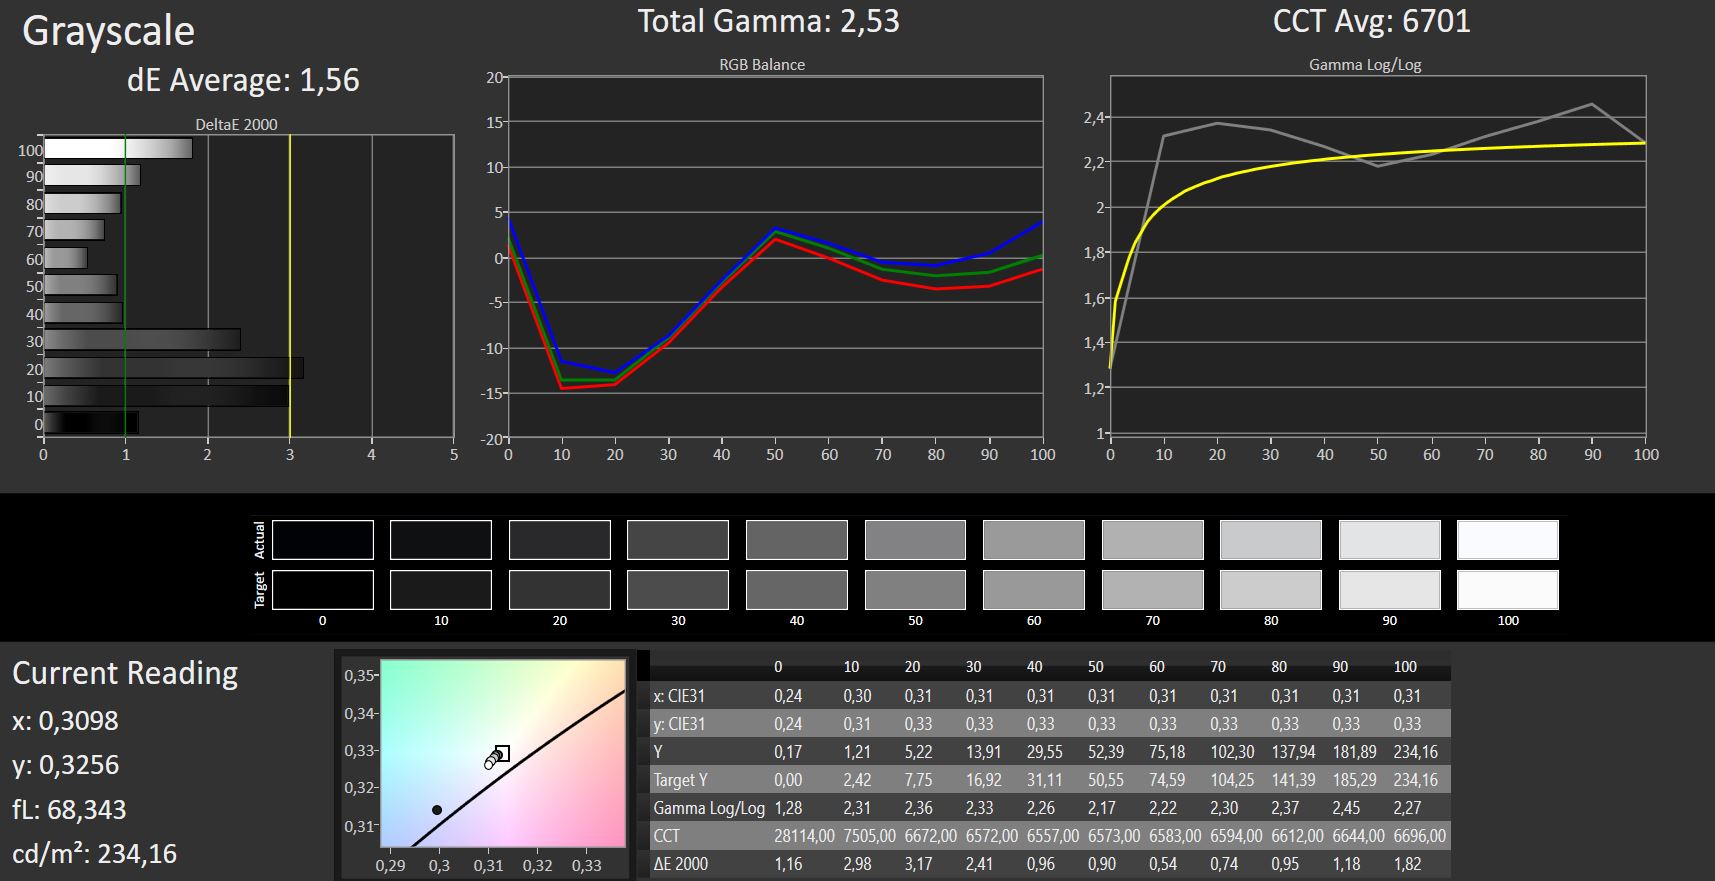
ΔE Greyscale Calman: 1.56 | ∀{0.09-98 Ø4.96}
55% sRGB (Argyll 1.6.3 3D)
35% AdobeRGB 1998 (Argyll 1.6.3 3D)
37.57% AdobeRGB 1998 (Argyll 3D)
54.7% sRGB (Argyll 3D)
36.37% Display P3 (Argyll 3D)
Gamma: 2.53
CCT: 6701 K
| Lenovo ThinkPad L480-20LS001AGE B140HAN02.4, 1920x1080, 14" | Lenovo ThinkPad L470-20J5S00C00 N140HCA-EAB, 1920x1080, 14" | Lenovo ThinkPad E480-20KNCTO1WW Innolux N140HCA-EAC, 1920x1080, 14" | Lenovo ThinkPad E480-20KQS00000 Innolux N140HCA-EAC, 1920x1080, 14" | HP ProBook 440 G5-3KX87ES LGD04B2, 1920x1080, 14" | Dell Latitude 5490-TD70X AU Optronics AUO263D, 1920x1080, 14" | |
|---|---|---|---|---|---|---|
| Display | 16% | 14% | 15% | 9% | 0% | |
| Display P3 Coverage (%) | 36.37 | 42.21 16% | 41.56 14% | 41.88 15% | 39.56 9% | 36.28 0% |
| sRGB Coverage (%) | 54.7 | 62.7 15% | 62.2 14% | 62.8 15% | 59.3 8% | 54.6 0% |
| AdobeRGB 1998 Coverage (%) | 37.57 | 43.71 16% | 42.96 14% | 43.29 15% | 40.88 9% | 37.48 0% |
| Response Times | 19% | 22% | 23% | 29% | 21% | |
| Response Time Grey 50% / Grey 80% * (ms) | 73 ? | 50.4 ? 31% | 44.8 ? 39% | 44 ? 40% | 40 ? 45% | 46.9 ? 36% |
| Response Time Black / White * (ms) | 33 ? | 30.8 ? 7% | 31.2 ? 5% | 31.2 ? 5% | 28.8 ? 13% | 31.2 ? 5% |
| PWM Frequency (Hz) | 25000 ? | 24880 ? | ||||
| Screen | -46% | -53% | -20% | -41% | -28% | |
| Brightness middle (cd/m²) | 222 | 274 23% | 262 18% | 251 13% | 236 6% | 227 2% |
| Brightness (cd/m²) | 209 | 256 22% | 245 17% | 231 11% | 221 6% | 211 1% |
| Brightness Distribution (%) | 73 | 85 16% | 83 14% | 80 10% | 88 21% | 88 21% |
| Black Level * (cd/m²) | 0.17 | 0.35 -106% | 0.19 -12% | 0.19 -12% | 0.26 -53% | 0.19 -12% |
| Contrast (:1) | 1306 | 783 -40% | 1379 6% | 1321 1% | 908 -30% | 1195 -8% |
| Colorchecker dE 2000 * | 3.91 | 6.1 -56% | 7 -79% | 5.1 -30% | 5.7 -46% | 5.6 -43% |
| Colorchecker dE 2000 max. * | 7.74 | 13.8 -78% | 23.6 -205% | 10.6 -37% | 22 -184% | 22.4 -189% |
| Greyscale dE 2000 * | 1.56 | 5.7 -265% | 6.4 -310% | 4.5 -188% | 3.8 -144% | 2.4 -54% |
| Gamma | 2.53 87% | 2.11 104% | 2.14 103% | 2.18 101% | 2.1 105% | 2.44 90% |
| CCT | 6701 97% | 6419 101% | 6065 107% | 6146 106% | 7318 89% | 6506 100% |
| Color Space (Percent of AdobeRGB 1998) (%) | 35 | 40.2 15% | 39.5 13% | 39.8 14% | 37.7 8% | 34.5 -1% |
| Color Space (Percent of sRGB) (%) | 55 | 62.4 13% | 61.9 13% | 62.5 14% | 59.2 8% | 54.4 -1% |
| Média Total (Programa/Configurações) | -4% /
-25% | -6% /
-29% | 6% /
-8% | -1% /
-22% | -2% /
-16% |
* ... menor é melhor
Exibir tempos de resposta
| ↔ Tempo de resposta preto para branco | ||
|---|---|---|
| 33 ms ... ascensão ↗ e queda ↘ combinadas | ↗ 19 ms ascensão | 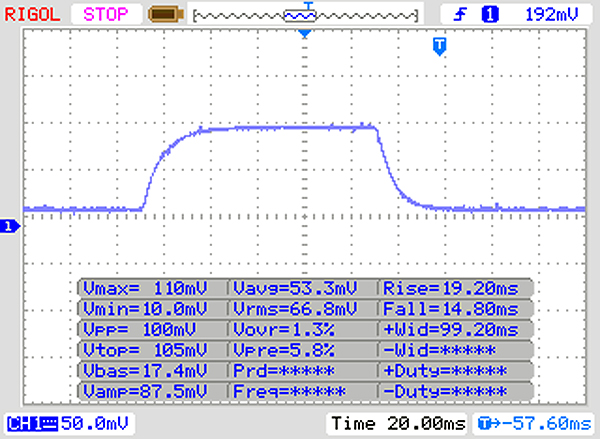 |
| ↘ 14 ms queda | ||
| A tela mostra taxas de resposta lentas em nossos testes e será insatisfatória para os jogadores. Em comparação, todos os dispositivos testados variam de 0.1 (mínimo) a 240 (máximo) ms. » 89 % de todos os dispositivos são melhores. Isso significa que o tempo de resposta medido é pior que a média de todos os dispositivos testados (19.8 ms). | ||
| ↔ Tempo de resposta 50% cinza a 80% cinza | ||
| 73 ms ... ascensão ↗ e queda ↘ combinadas | ↗ 36 ms ascensão | 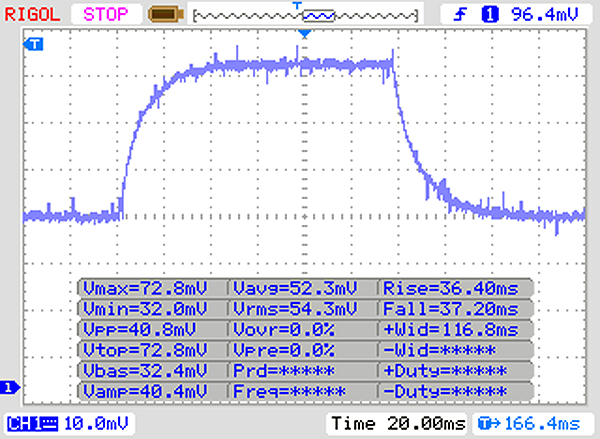 |
| ↘ 37 ms queda | ||
| A tela mostra taxas de resposta lentas em nossos testes e será insatisfatória para os jogadores. Em comparação, todos os dispositivos testados variam de 0.165 (mínimo) a 636 (máximo) ms. » 99 % de todos os dispositivos são melhores. Isso significa que o tempo de resposta medido é pior que a média de todos os dispositivos testados (30.9 ms). | ||
Cintilação da tela / PWM (modulação por largura de pulso)
| Tela tremeluzindo / PWM não detectado | 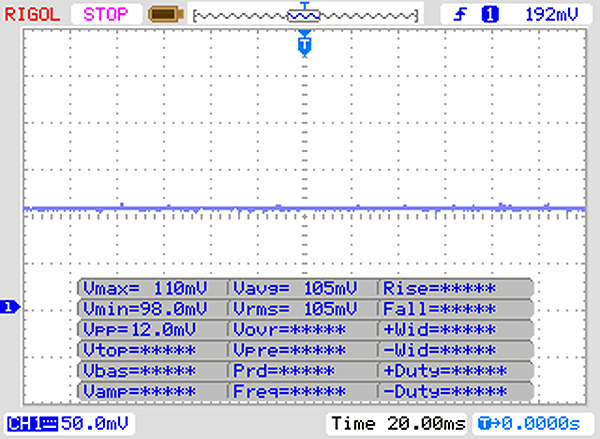 | ||
[pwm_comparison] Em comparação: 52 % de todos os dispositivos testados não usam PWM para escurecer a tela. Se PWM foi detectado, uma média de 7741 (mínimo: 5 - máximo: 343500) Hz foi medida. | |||
| Cinebench R15 | |
| CPU Single 64Bit | |
| Média da turma Office (99.5 - 316, n=77, últimos 2 anos) | |
| HP ProBook 440 G5-3KX87ES | |
| Lenovo ThinkPad E480-20KQS00000 | |
| Lenovo ThinkPad E480-20KNCTO1WW | |
| Dell Latitude 5490-TD70X | |
| Lenovo ThinkPad L480-20LS001AGE | |
| Média Intel Core i5-8250U (81 - 147, n=97) | |
| Lenovo ThinkPad L470-20J5S00C00 | |
| CPU Multi 64Bit | |
| Média da turma Office (250 - 3380, n=77, últimos 2 anos) | |
| Dell Latitude 5490-TD70X | |
| Lenovo ThinkPad L480-20LS001AGE | |
| HP ProBook 440 G5-3KX87ES | |
| Média Intel Core i5-8250U (320 - 730, n=101) | |
| Lenovo ThinkPad E480-20KQS00000 | |
| Lenovo ThinkPad E480-20KNCTO1WW | |
| Lenovo ThinkPad L470-20J5S00C00 | |
| JetStream 1.1 - 1.1 Total | |
| Lenovo ThinkPad E480-20KQS00000 | |
| HP ProBook 440 G5-3KX87ES | |
| Lenovo ThinkPad E480-20KNCTO1WW | |
| Lenovo ThinkPad L480-20LS001AGE | |
| Média Intel Core i5-8250U (151.5 - 256, n=78) | |
| Lenovo ThinkPad L470-20J5S00C00 | |
| Octane V2 - Total Score | |
| Média da turma Office (49011 - 126830, n=20, últimos 2 anos) | |
| Lenovo ThinkPad E480-20KQS00000 | |
| HP ProBook 440 G5-3KX87ES | |
| Lenovo ThinkPad L470-20J5S00C00 | |
| Lenovo ThinkPad E480-20KNCTO1WW | |
| Média Intel Core i5-8250U (22772 - 35817, n=54) | |
| Lenovo ThinkPad L480-20LS001AGE | |
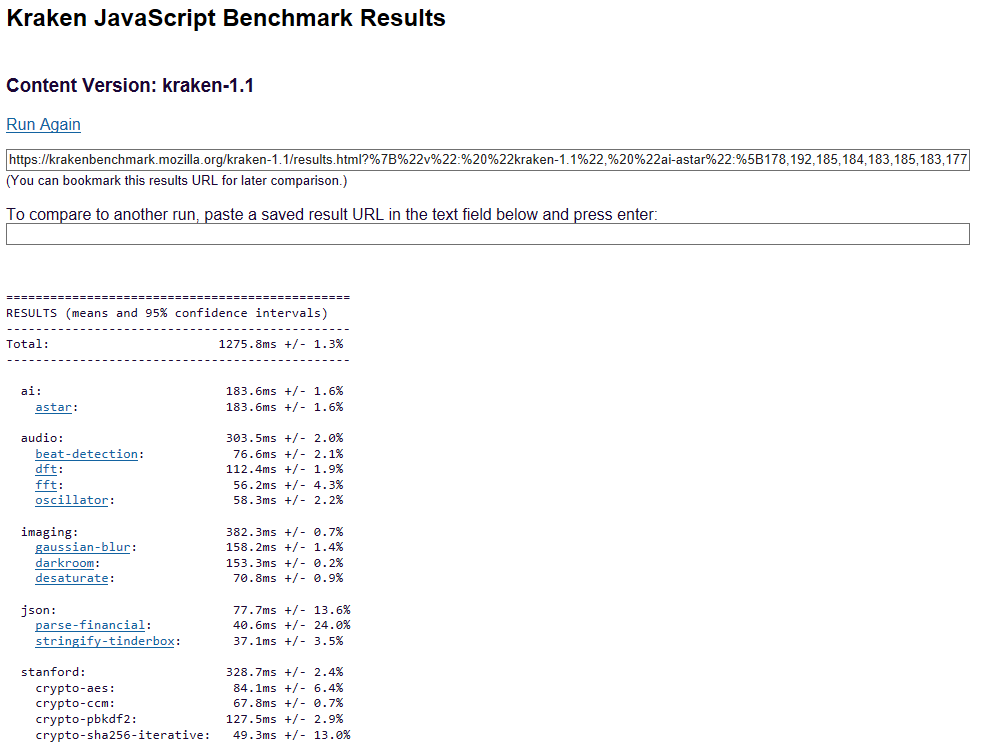
| Mozilla Kraken 1.1 - Total | |
| Lenovo ThinkPad E480-20KNCTO1WW | |
| Lenovo ThinkPad L480-20LS001AGE | |
| Média Intel Core i5-8250U (986 - 1532, n=59) | |
| Lenovo ThinkPad L470-20J5S00C00 | |
| HP ProBook 440 G5-3KX87ES | |
| Lenovo ThinkPad E480-20KQS00000 | |
| Média da turma Office (391 - 1297, n=78, últimos 2 anos) | |
* ... menor é melhor

| PCMark 8 | |
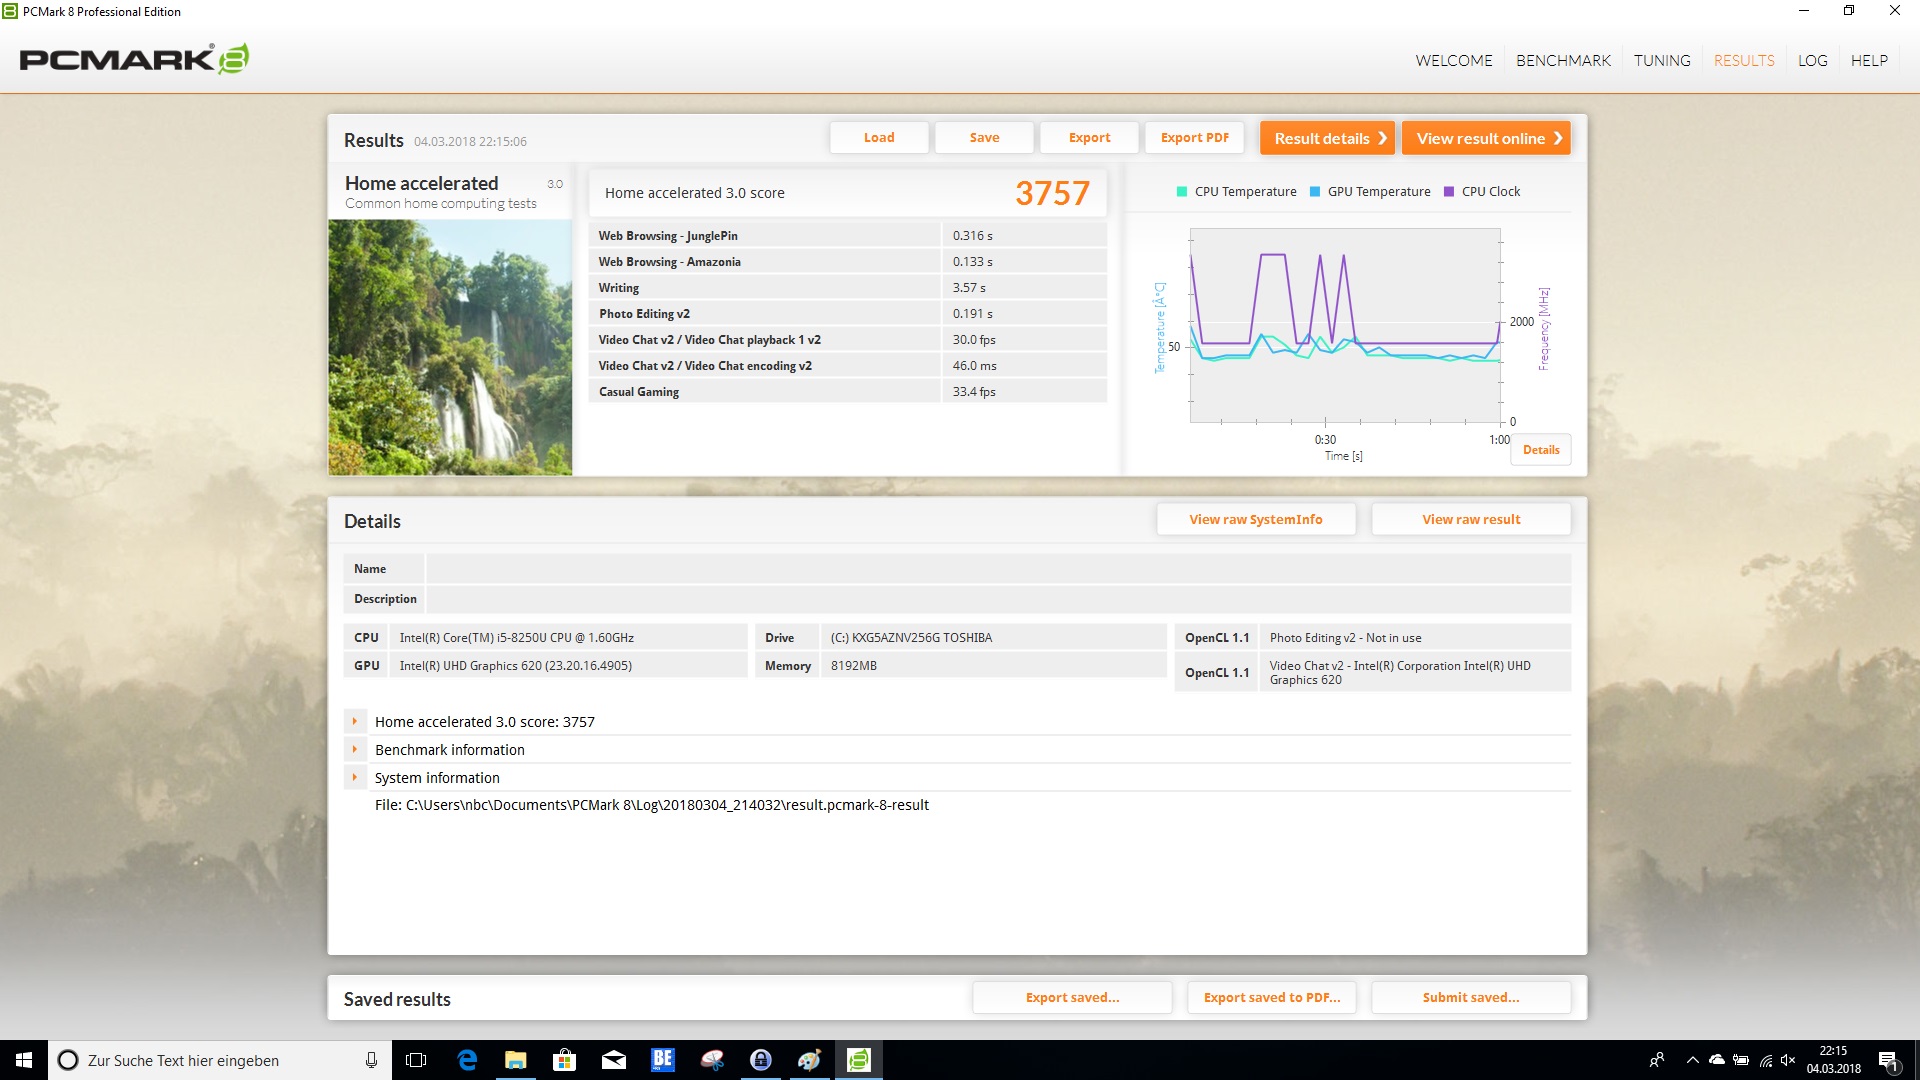
| Home Score Accelerated v2 | |
| Média da turma Office (n=1últimos 2 anos) | |
| Lenovo ThinkPad E480-20KQS00000 | |
| HP ProBook 440 G5-3KX87ES | |
| Lenovo ThinkPad L480-20LS001AGE | |
| Dell Latitude 5490-TD70X | |
| Média Intel Core i5-8250U, Intel UHD Graphics 620 (2986 - 4458, n=69) | |
| Lenovo ThinkPad E480-20KNCTO1WW | |
| Lenovo ThinkPad L470-20J5S00C00 | |
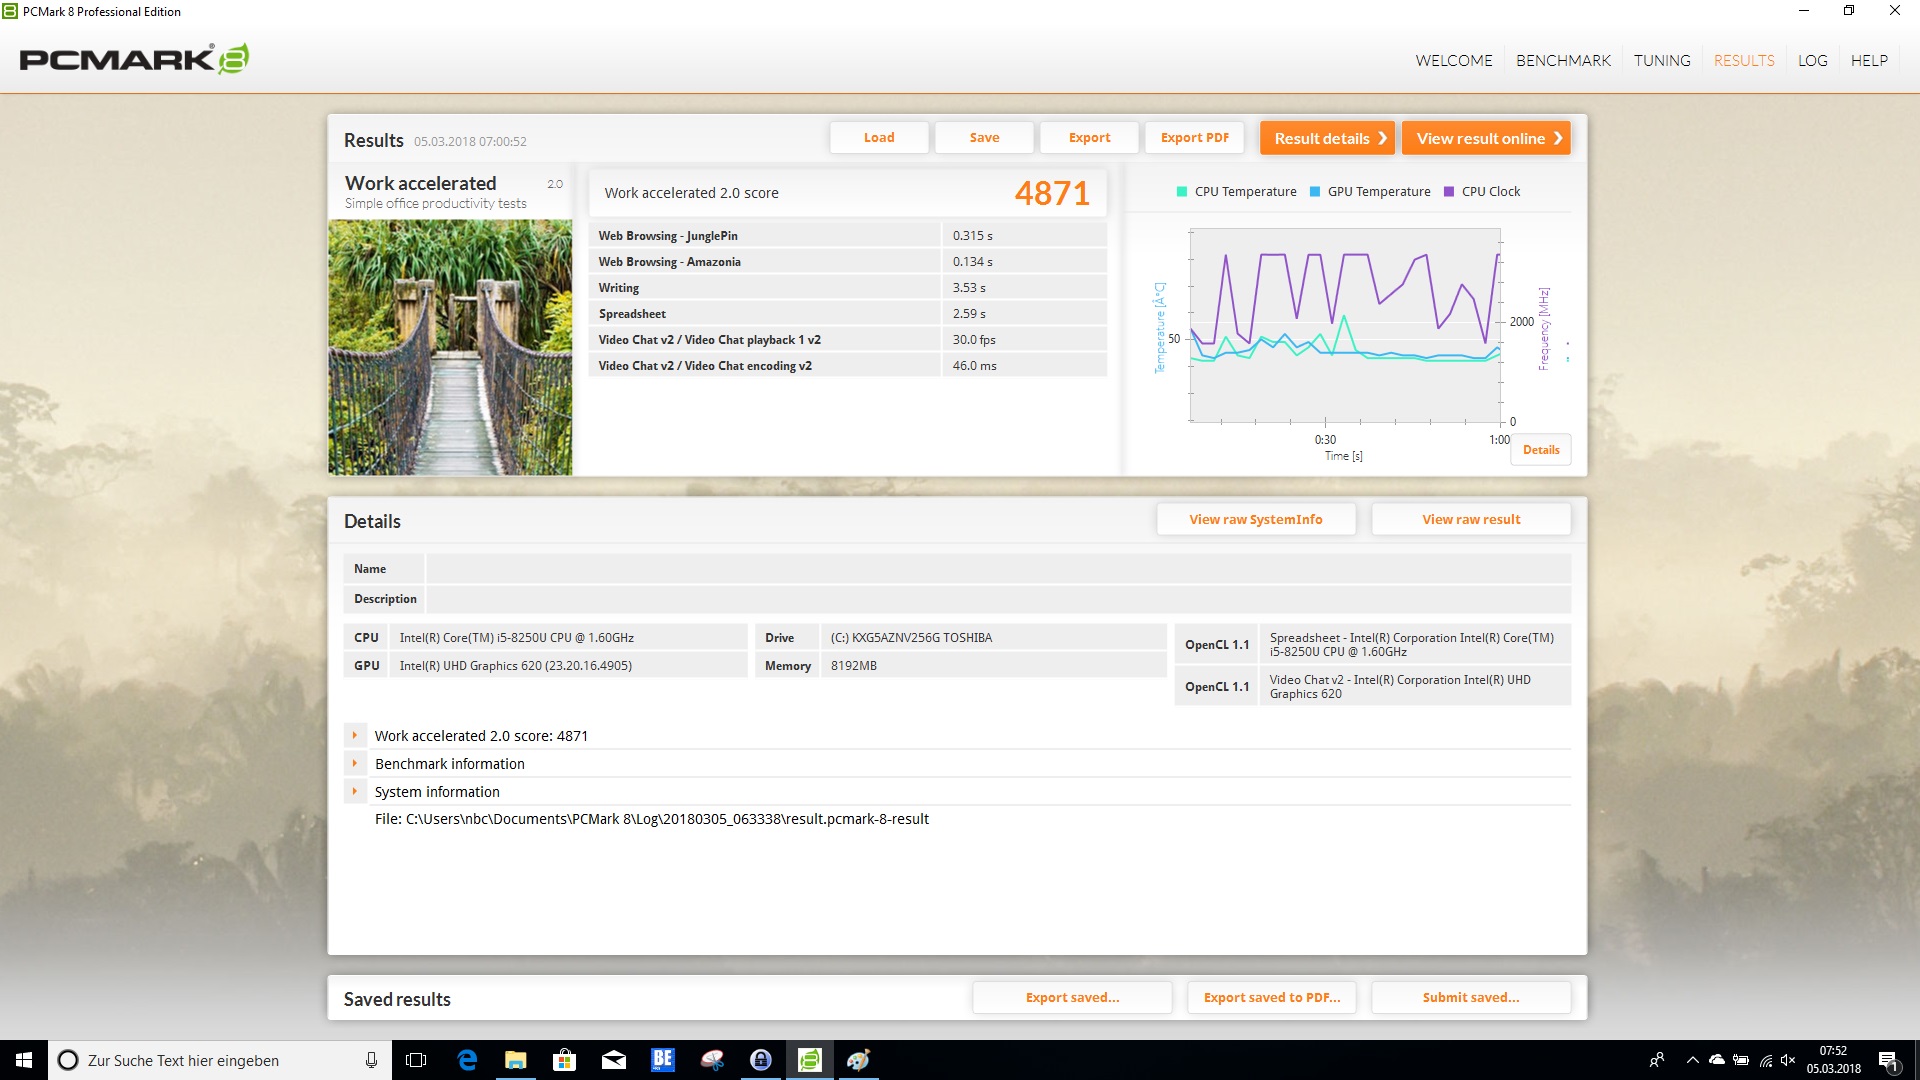
| Work Score Accelerated v2 | |
| Média da turma Office (n=1últimos 2 anos) | |
| Lenovo ThinkPad E480-20KQS00000 | |
| HP ProBook 440 G5-3KX87ES | |
| Lenovo ThinkPad L480-20LS001AGE | |
| Lenovo ThinkPad E480-20KNCTO1WW | |
| Dell Latitude 5490-TD70X | |
| Média Intel Core i5-8250U, Intel UHD Graphics 620 (2699 - 5106, n=58) | |
| Lenovo ThinkPad L470-20J5S00C00 | |
| PCMark 8 Home Score Accelerated v2 | 3757 pontos | |
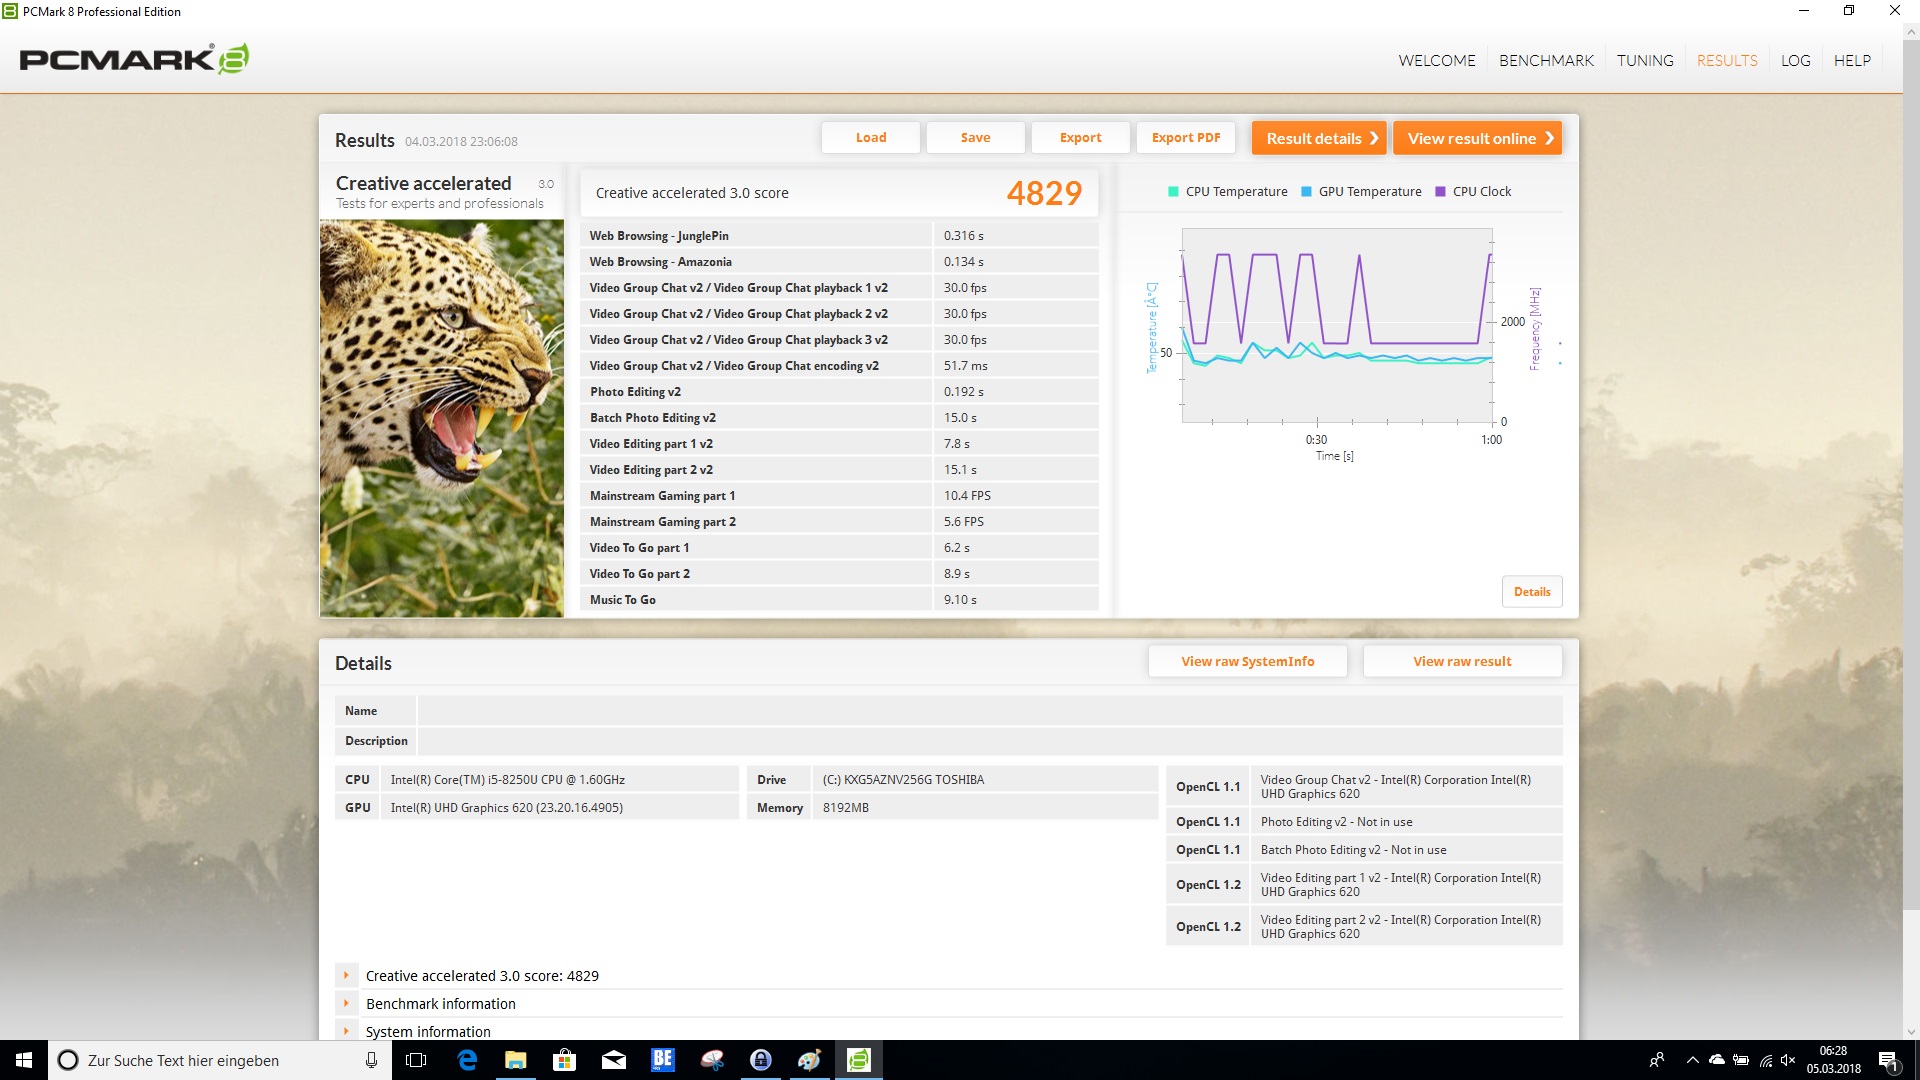
| PCMark 8 Creative Score Accelerated v2 | 4829 pontos | |
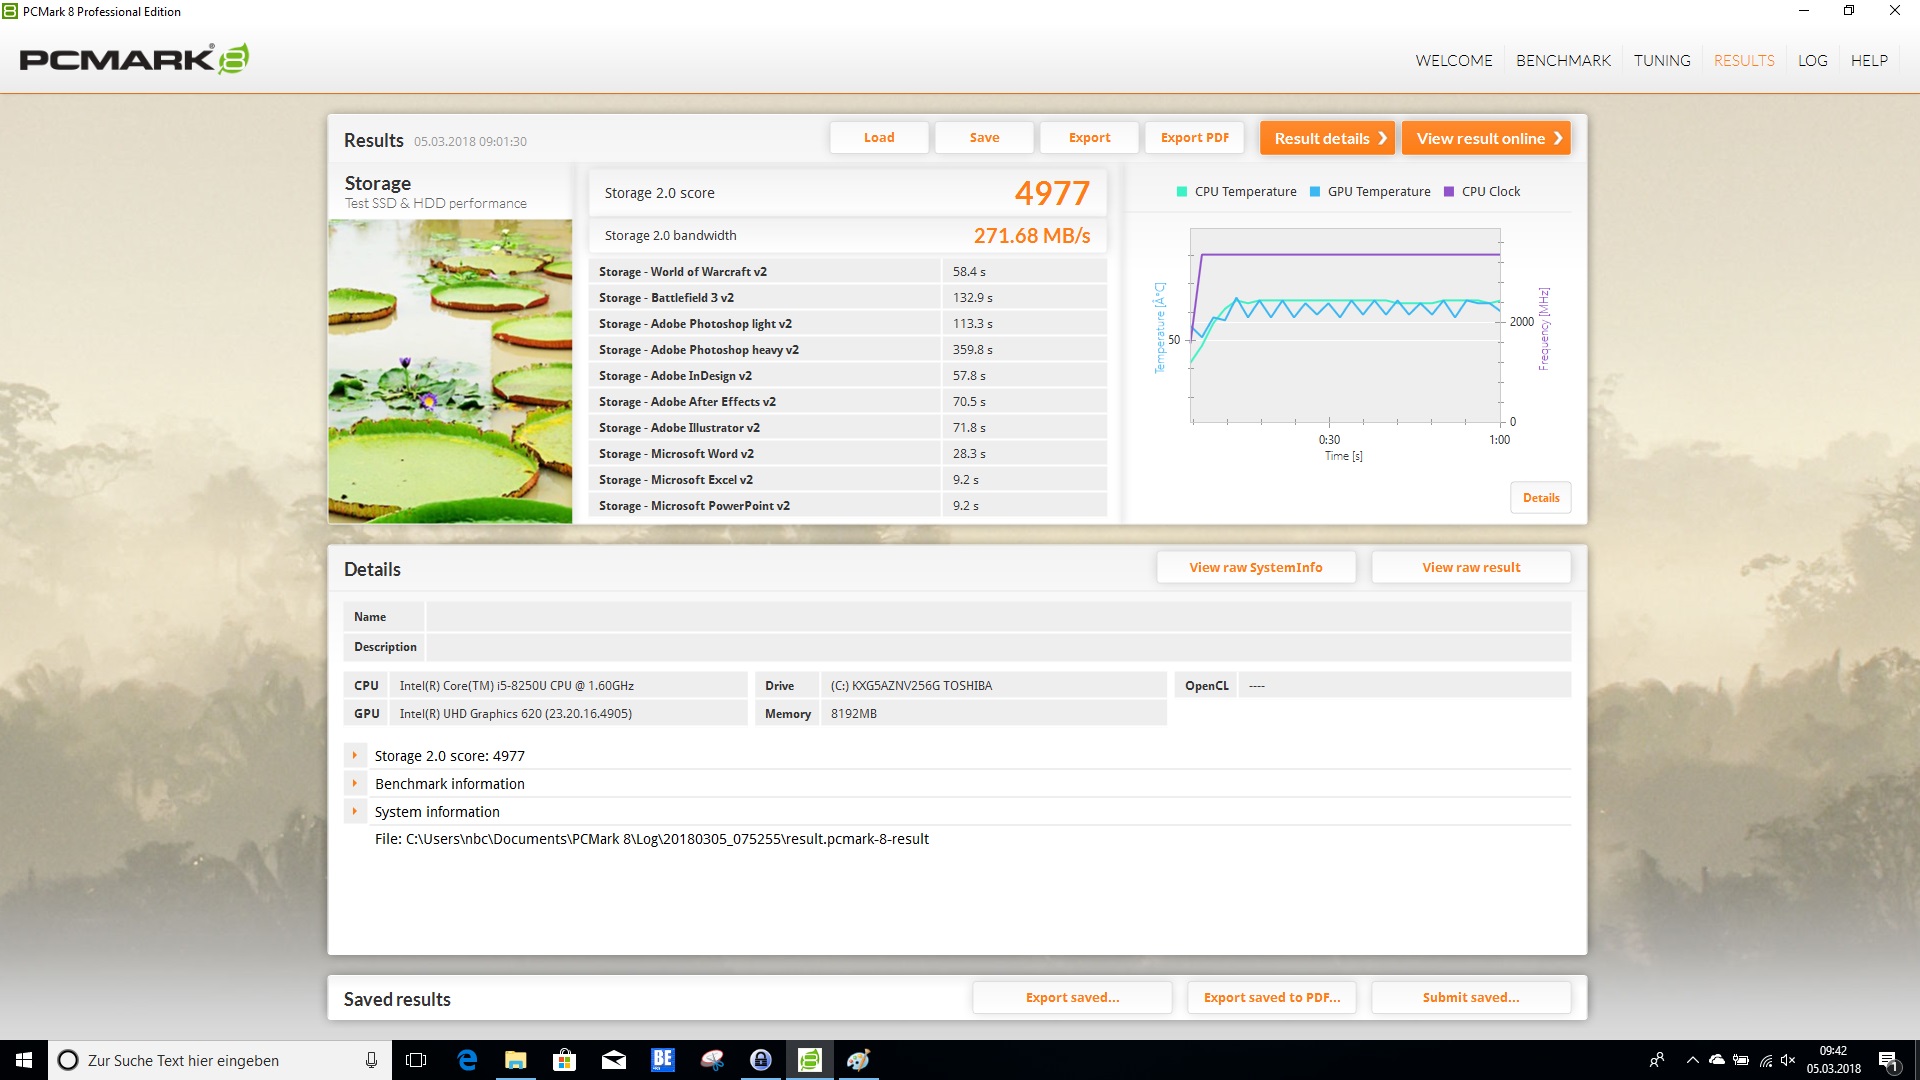
| PCMark 8 Work Score Accelerated v2 | 4871 pontos | |
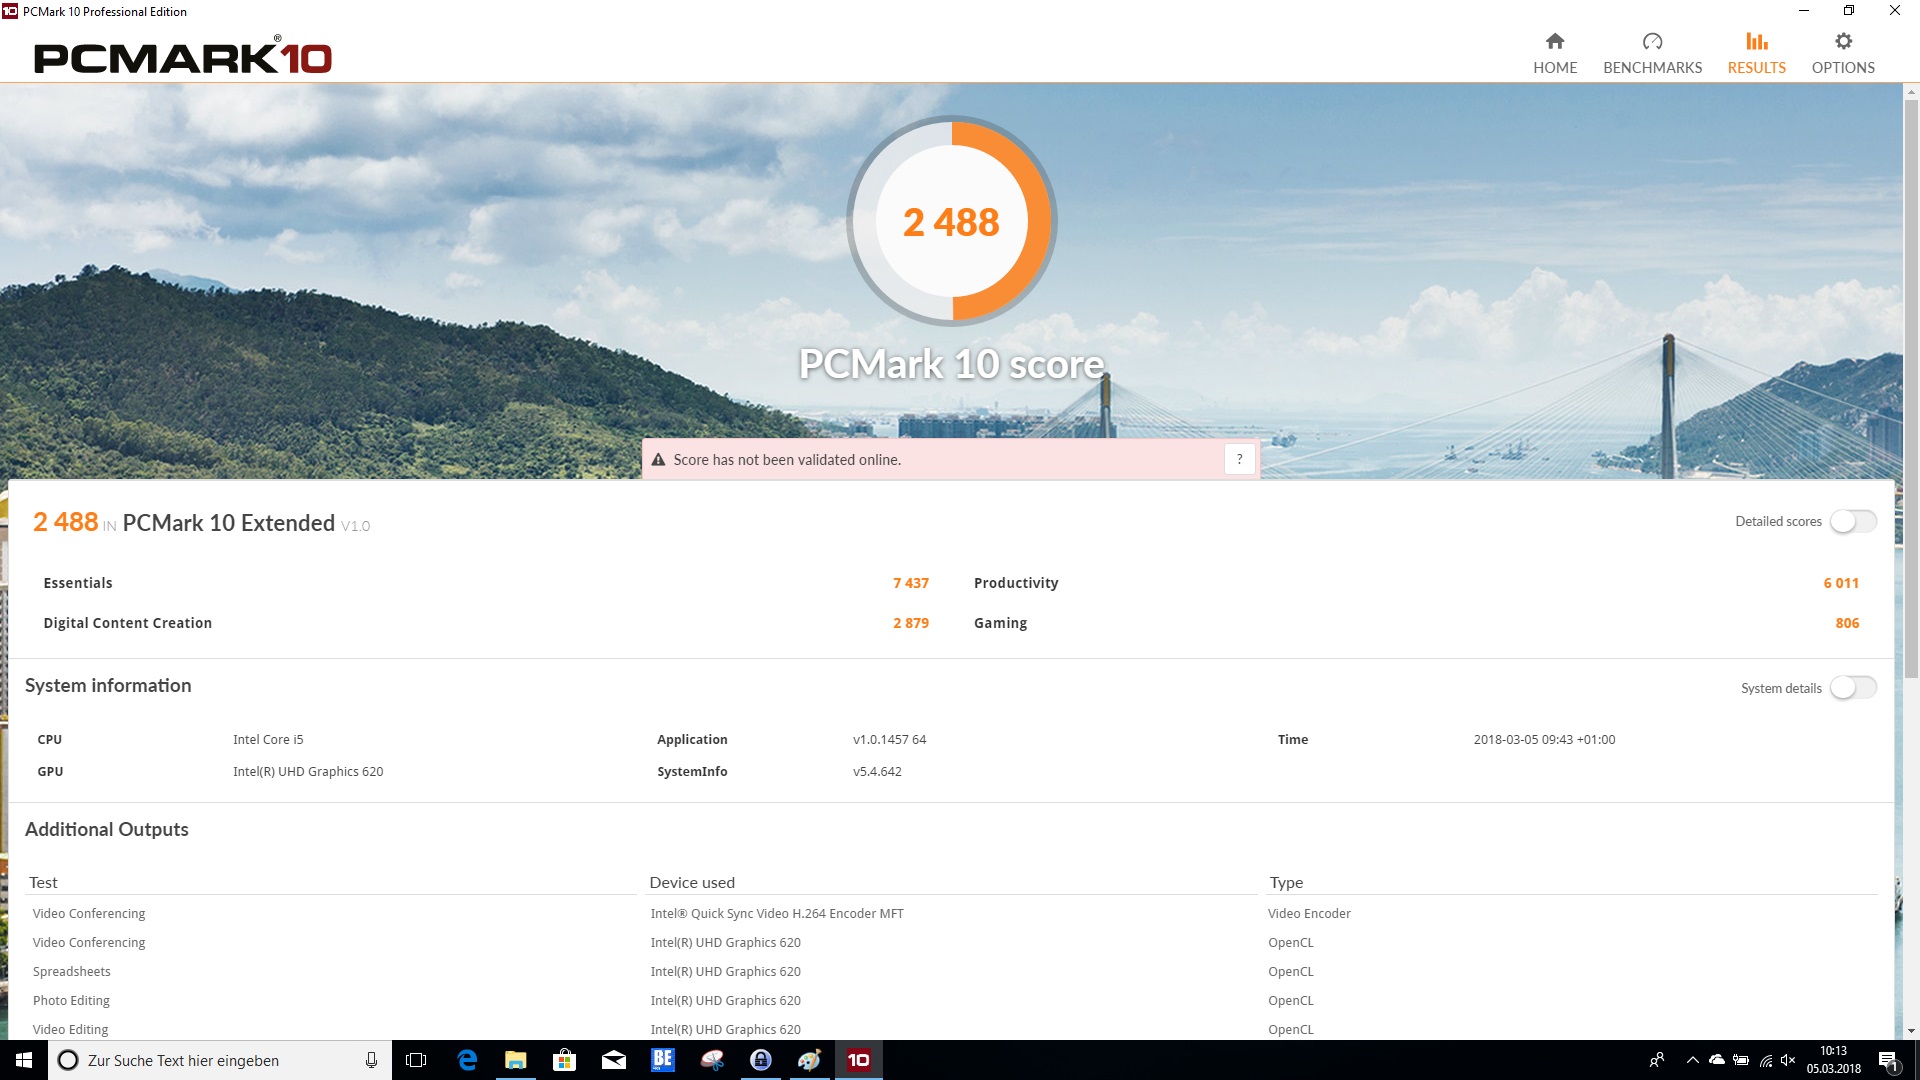
| PCMark 10 Score | 2488 pontos | |
Ajuda | ||
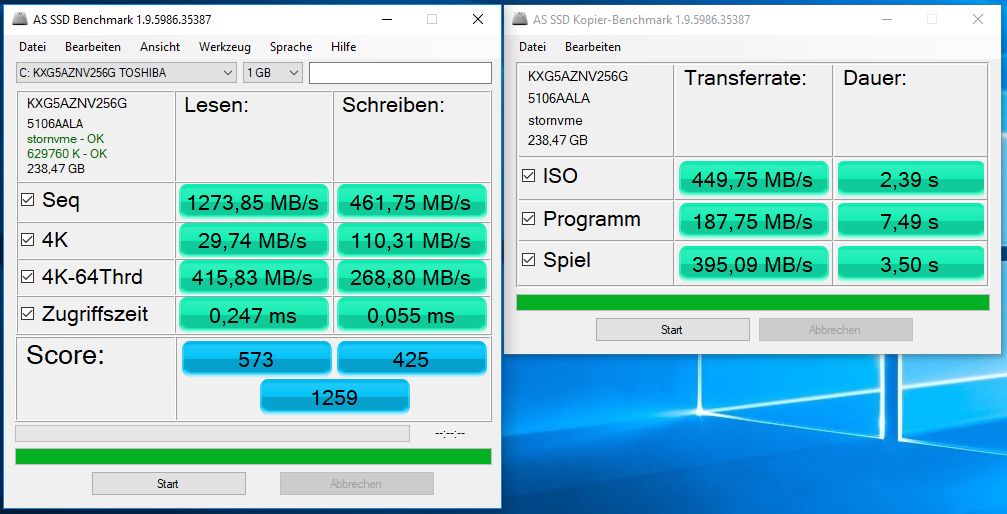
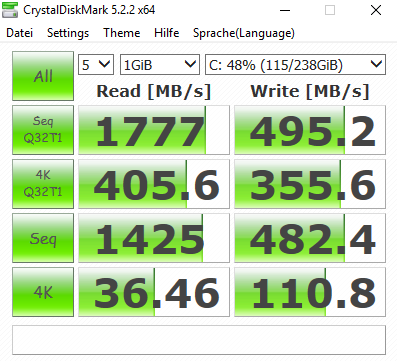
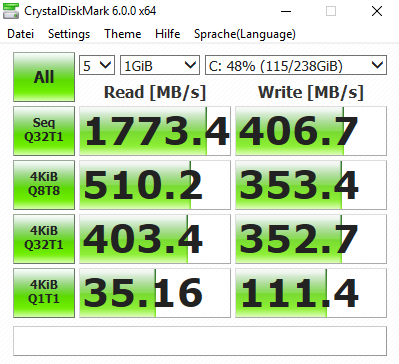

| Lenovo ThinkPad L480-20LS001AGE Toshiba KXG5AZNV256G | Lenovo ThinkPad L470-20J5S00C00 SanDisk X400 256GB, SATA (SD8SB8U-256G) | Lenovo ThinkPad E480-20KNCTO1WW Toshiba KBG30ZMT128G | Lenovo ThinkPad E480-20KQS00000 Lenovo LENSE20256GMSP34MEAT2TA | HP ProBook 440 G5-3KX87ES Intel SSD 600p SSDPEKKW256G7 | Dell Latitude 5490-TD70X Toshiba KSG60ZMV512G | |
|---|---|---|---|---|---|---|
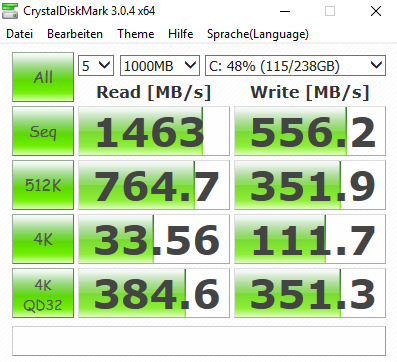
| CrystalDiskMark 3.0 | -31% | -42% | -30% | 13% | -27% | |
| Read Seq (MB/s) | 1463 | 495.2 -66% | 909 -38% | 1295 -11% | 1181 -19% | 465.1 -68% |
| Write Seq (MB/s) | 556 | 485.7 -13% | 128.4 -77% | 160.6 -71% | 602 8% | 425 -24% |
| Read 512 (MB/s) | 765 | 323.4 -58% | 715 -7% | 872 14% | 923 21% | 410.1 -46% |
| Write 512 (MB/s) | 351.9 | 291.5 -17% | 127 -64% | 122 -65% | 600 71% | 360.7 3% |
| Read 4k (MB/s) | 33.56 | 34.2 2% | 33.35 -1% | 25.72 -23% | 35.48 6% | 27.34 -19% |
| Write 4k (MB/s) | 111.7 | 74.3 -33% | 82.3 -26% | 95.2 -15% | 139.8 25% | 89 -20% |
| Read 4k QD32 (MB/s) | 384.6 | 321.3 -16% | 197.5 -49% | 389.9 1% | 287.8 -25% | 295.6 -23% |
| Write 4k QD32 (MB/s) | 351.3 | 188 -46% | 100.2 -71% | 118.3 -66% | 417.1 19% | 300.2 -15% |

| 3DMark | |
| 1280x720 Cloud Gate Standard Graphics | |
| Média da turma Office (11640 - 118515, n=39, últimos 2 anos) | |
| Lenovo ThinkPad E480-20KQS00000 | |
| Média Intel UHD Graphics 620 (6205 - 16400, n=225) | |
| Lenovo ThinkPad L480-20LS001AGE | |
| Dell Latitude 5490-TD70X | |
| HP ProBook 440 G5-3KX87ES | |
| Lenovo ThinkPad E480-20KNCTO1WW | |
| Lenovo ThinkPad L470-20J5S00C00 | |
| 1920x1080 Fire Strike Graphics | |
| Média da turma Office (736 - 21871, n=76, últimos 2 anos) | |
| Lenovo ThinkPad E480-20KQS00000 | |
| Média Intel UHD Graphics 620 (557 - 2608, n=213) | |
| Lenovo ThinkPad L480-20LS001AGE | |
| Dell Latitude 5490-TD70X | |
| HP ProBook 440 G5-3KX87ES | |
| Lenovo ThinkPad E480-20KNCTO1WW | |
| Lenovo ThinkPad L470-20J5S00C00 | |
| 3DMark 11 - 1280x720 Performance GPU | |
| Média da turma Office (2551 - 18313, n=73, últimos 2 anos) | |
| Lenovo ThinkPad E480-20KQS00000 | |
| Lenovo ThinkPad E480-20KQS00000 | |
| Média Intel UHD Graphics 620 (1144 - 3432, n=244) | |
| Lenovo ThinkPad L480-20LS001AGE | |
| Dell Latitude 5490-TD70X | |
| HP ProBook 440 G5-3KX87ES | |
| Lenovo ThinkPad E480-20KNCTO1WW | |
| Lenovo ThinkPad L470-20J5S00C00 | |
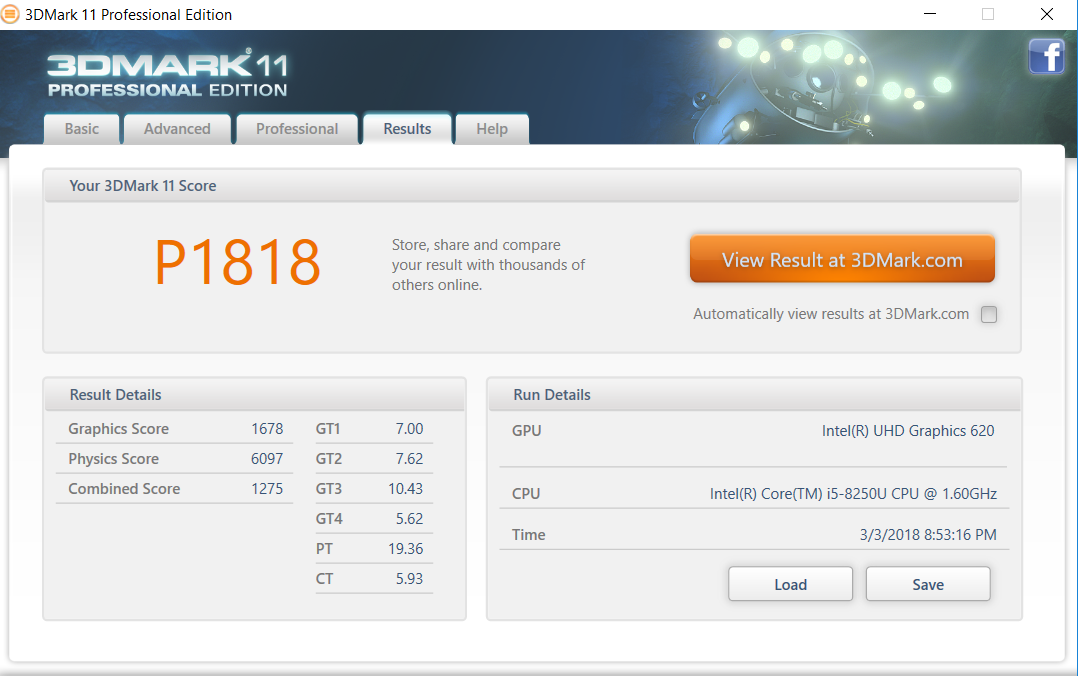
| 3DMark 11 Performance | 1818 pontos | |
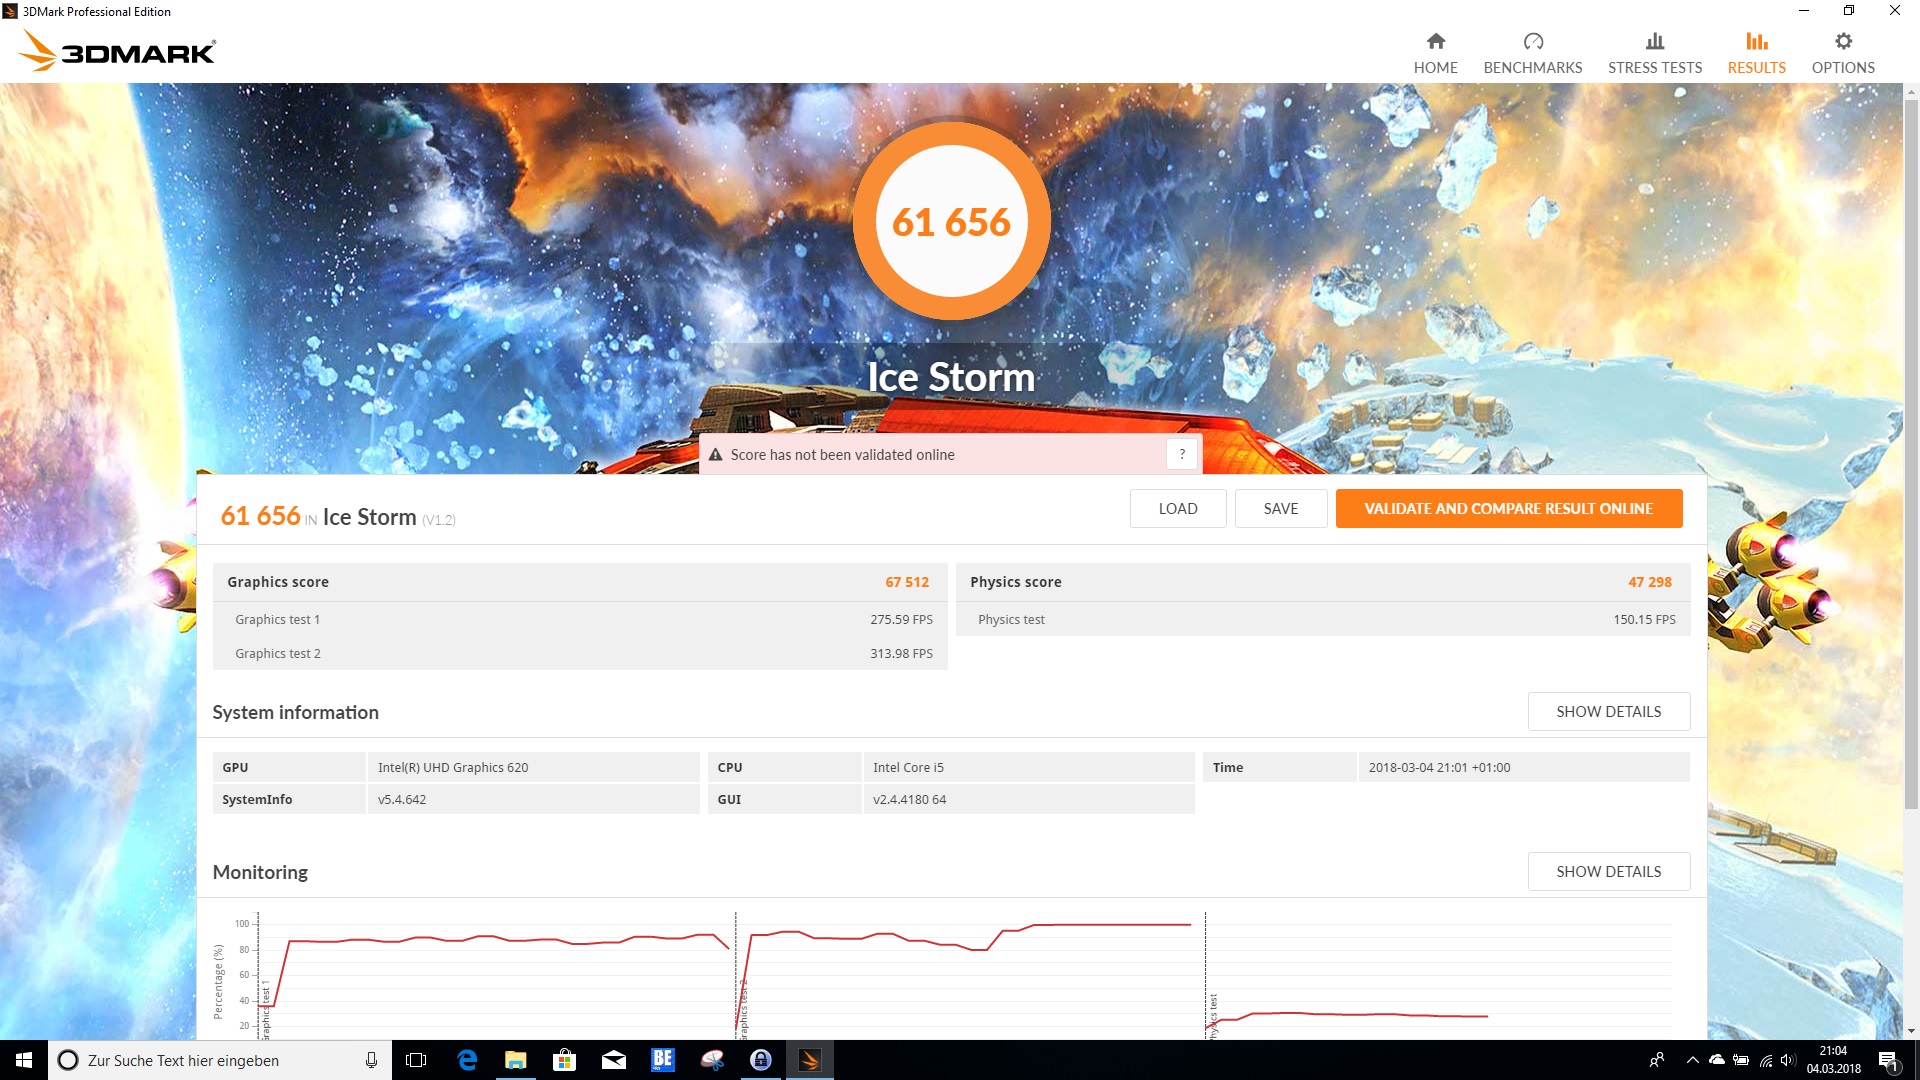
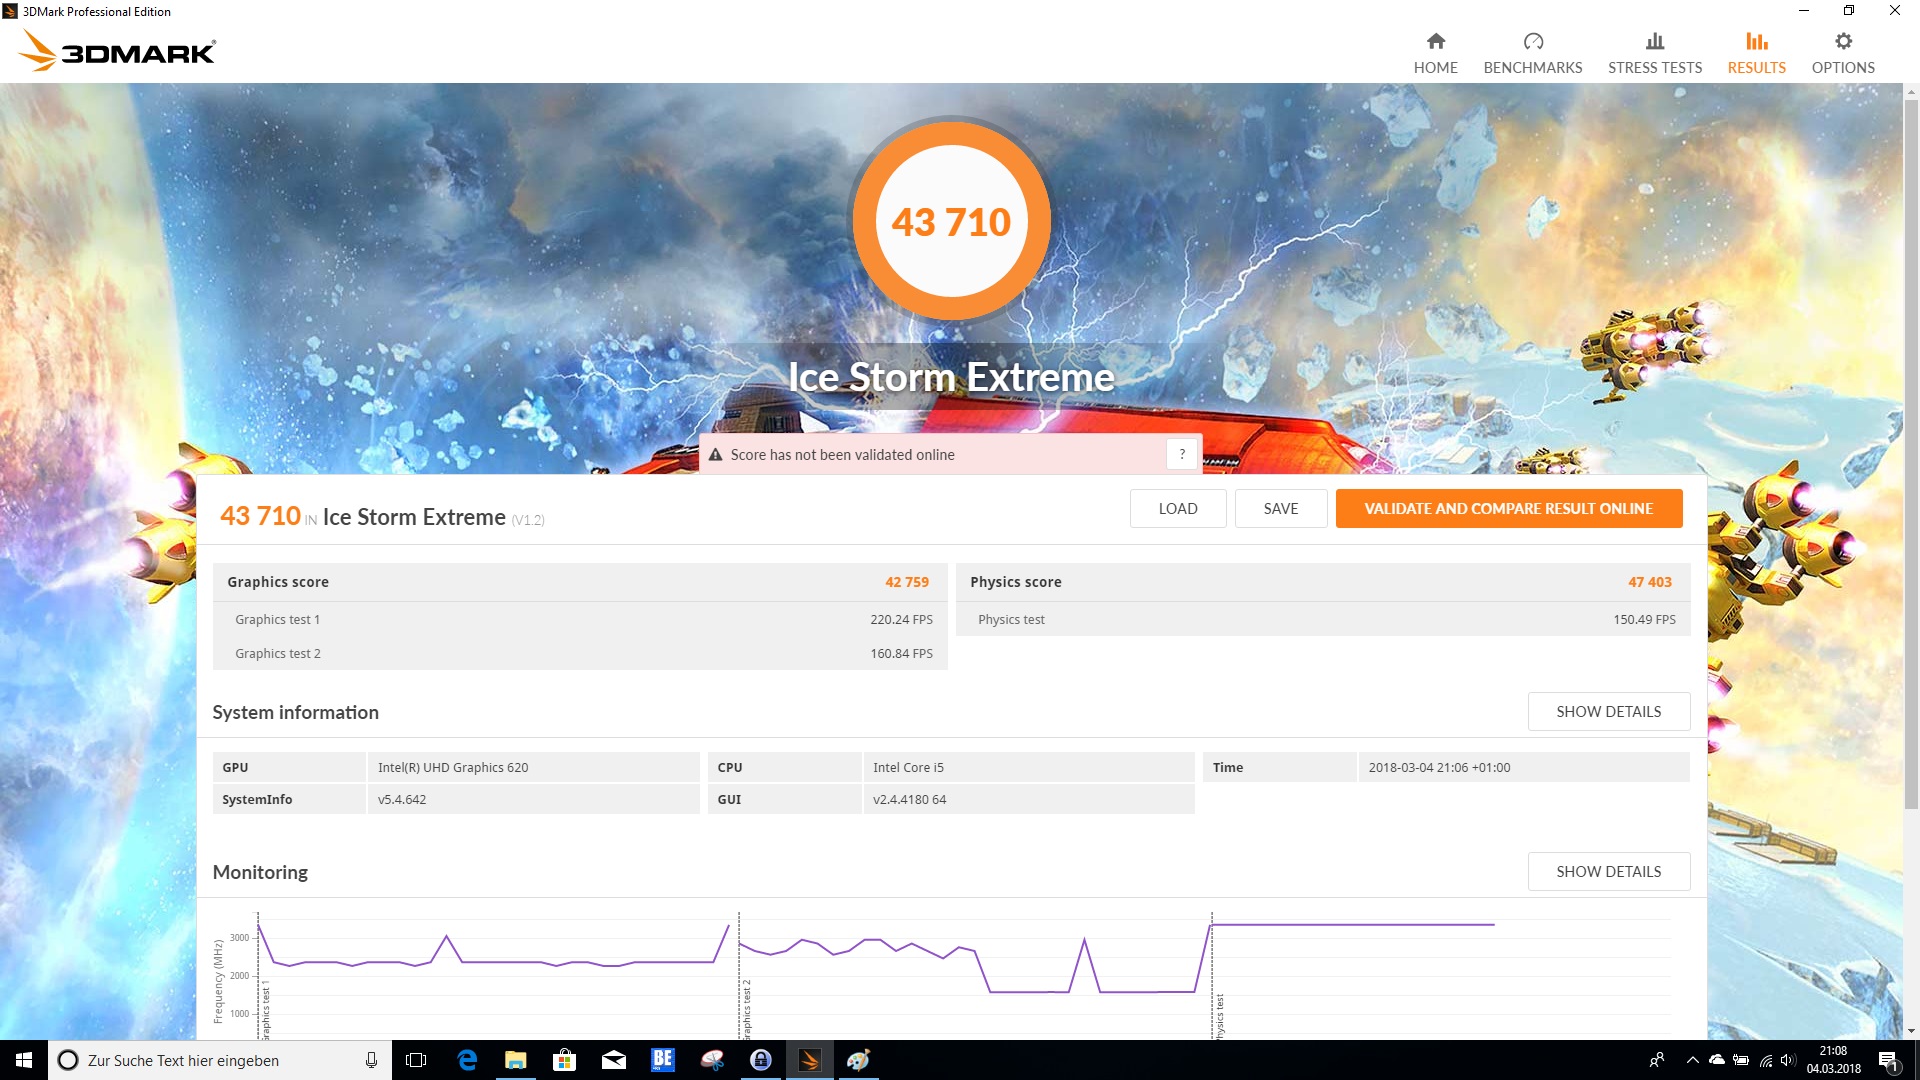
| 3DMark Ice Storm Standard Score | 61656 pontos | |
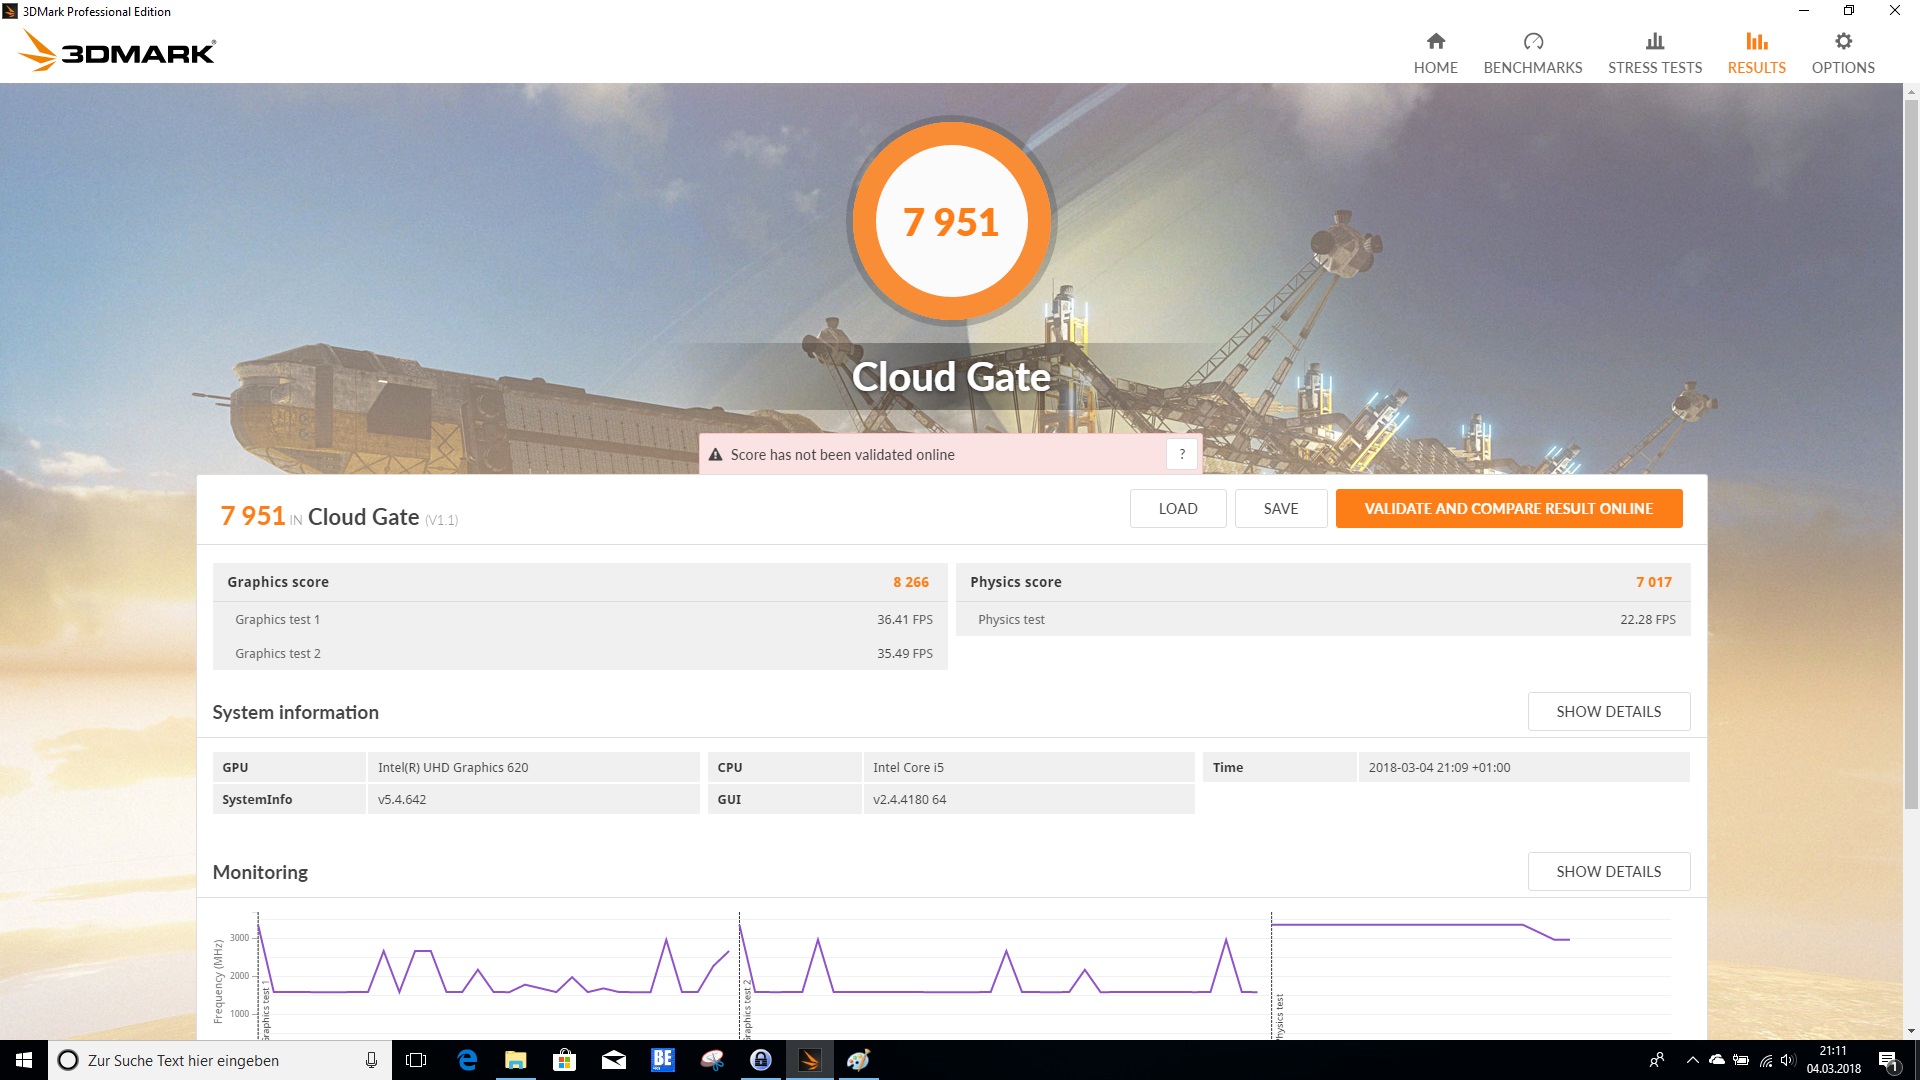
| 3DMark Cloud Gate Standard Score | 7951 pontos | |
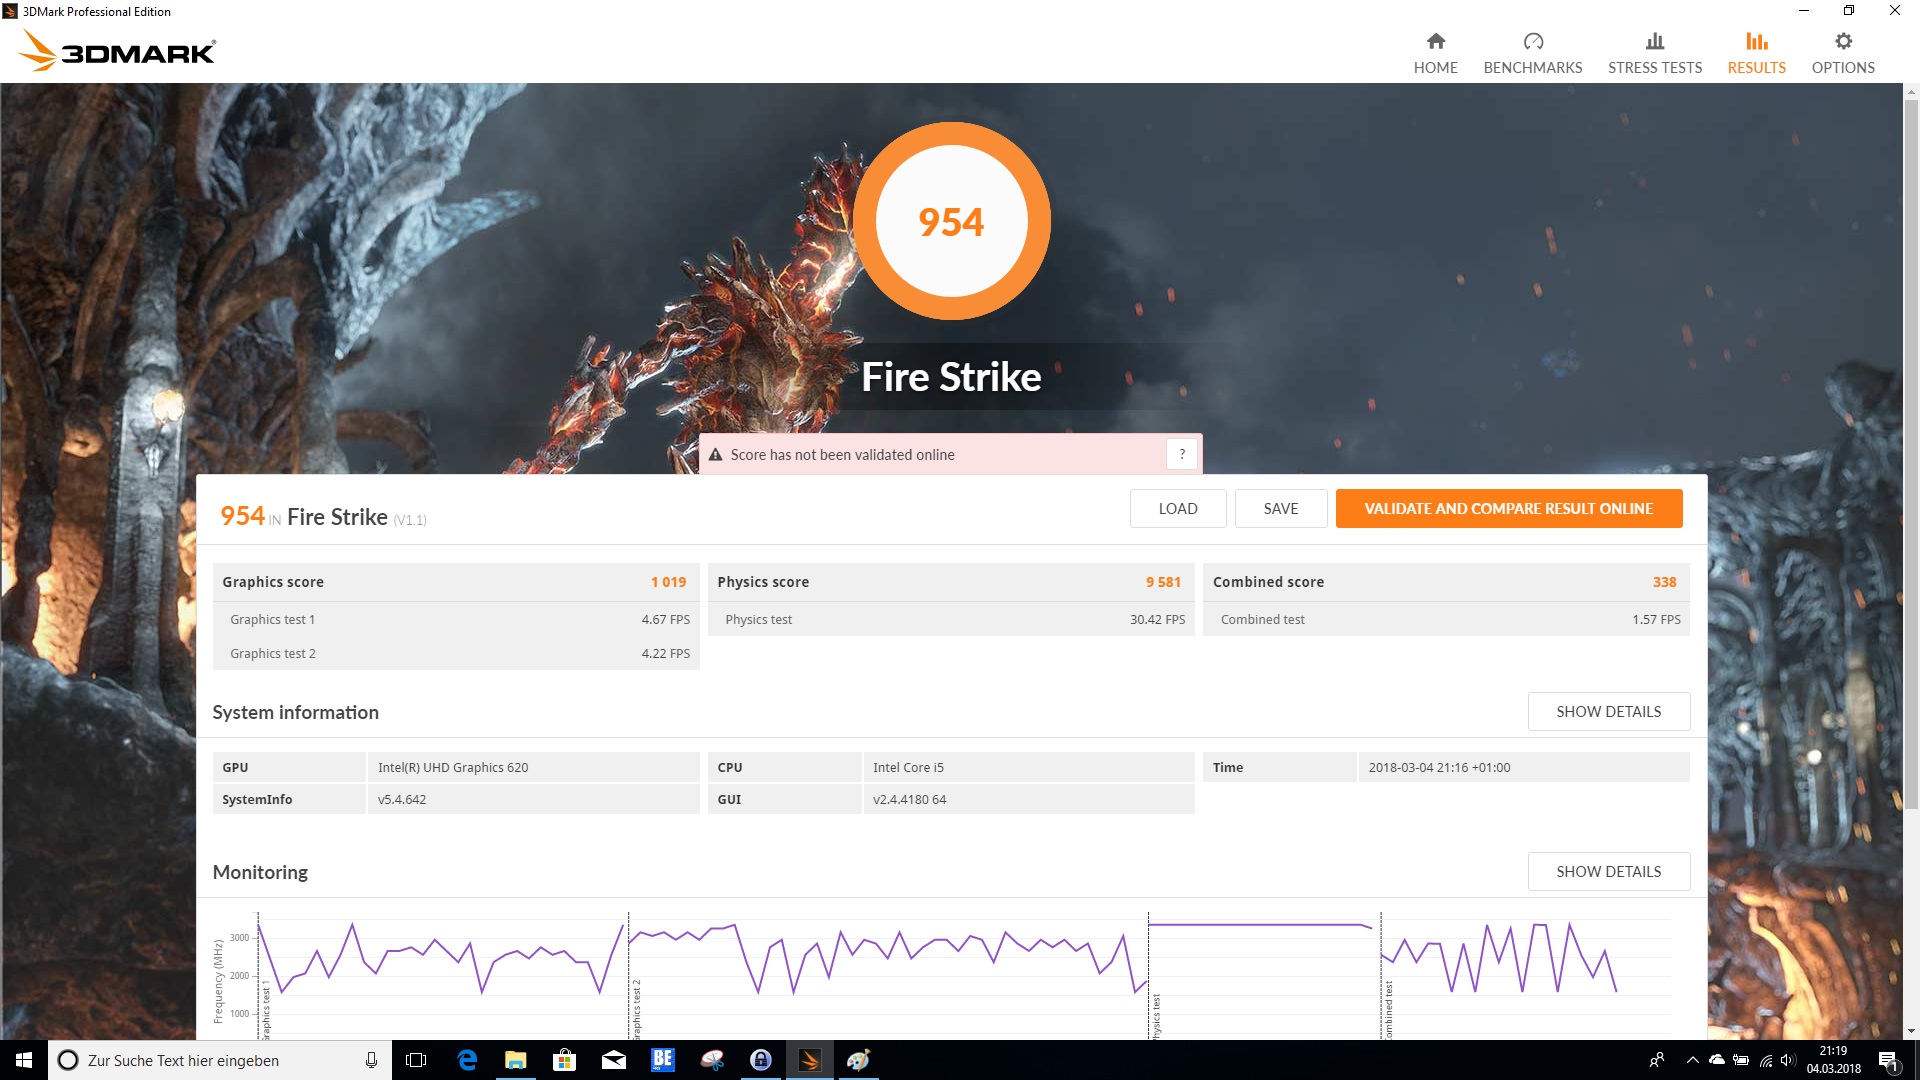
| 3DMark Fire Strike Score | 954 pontos | |
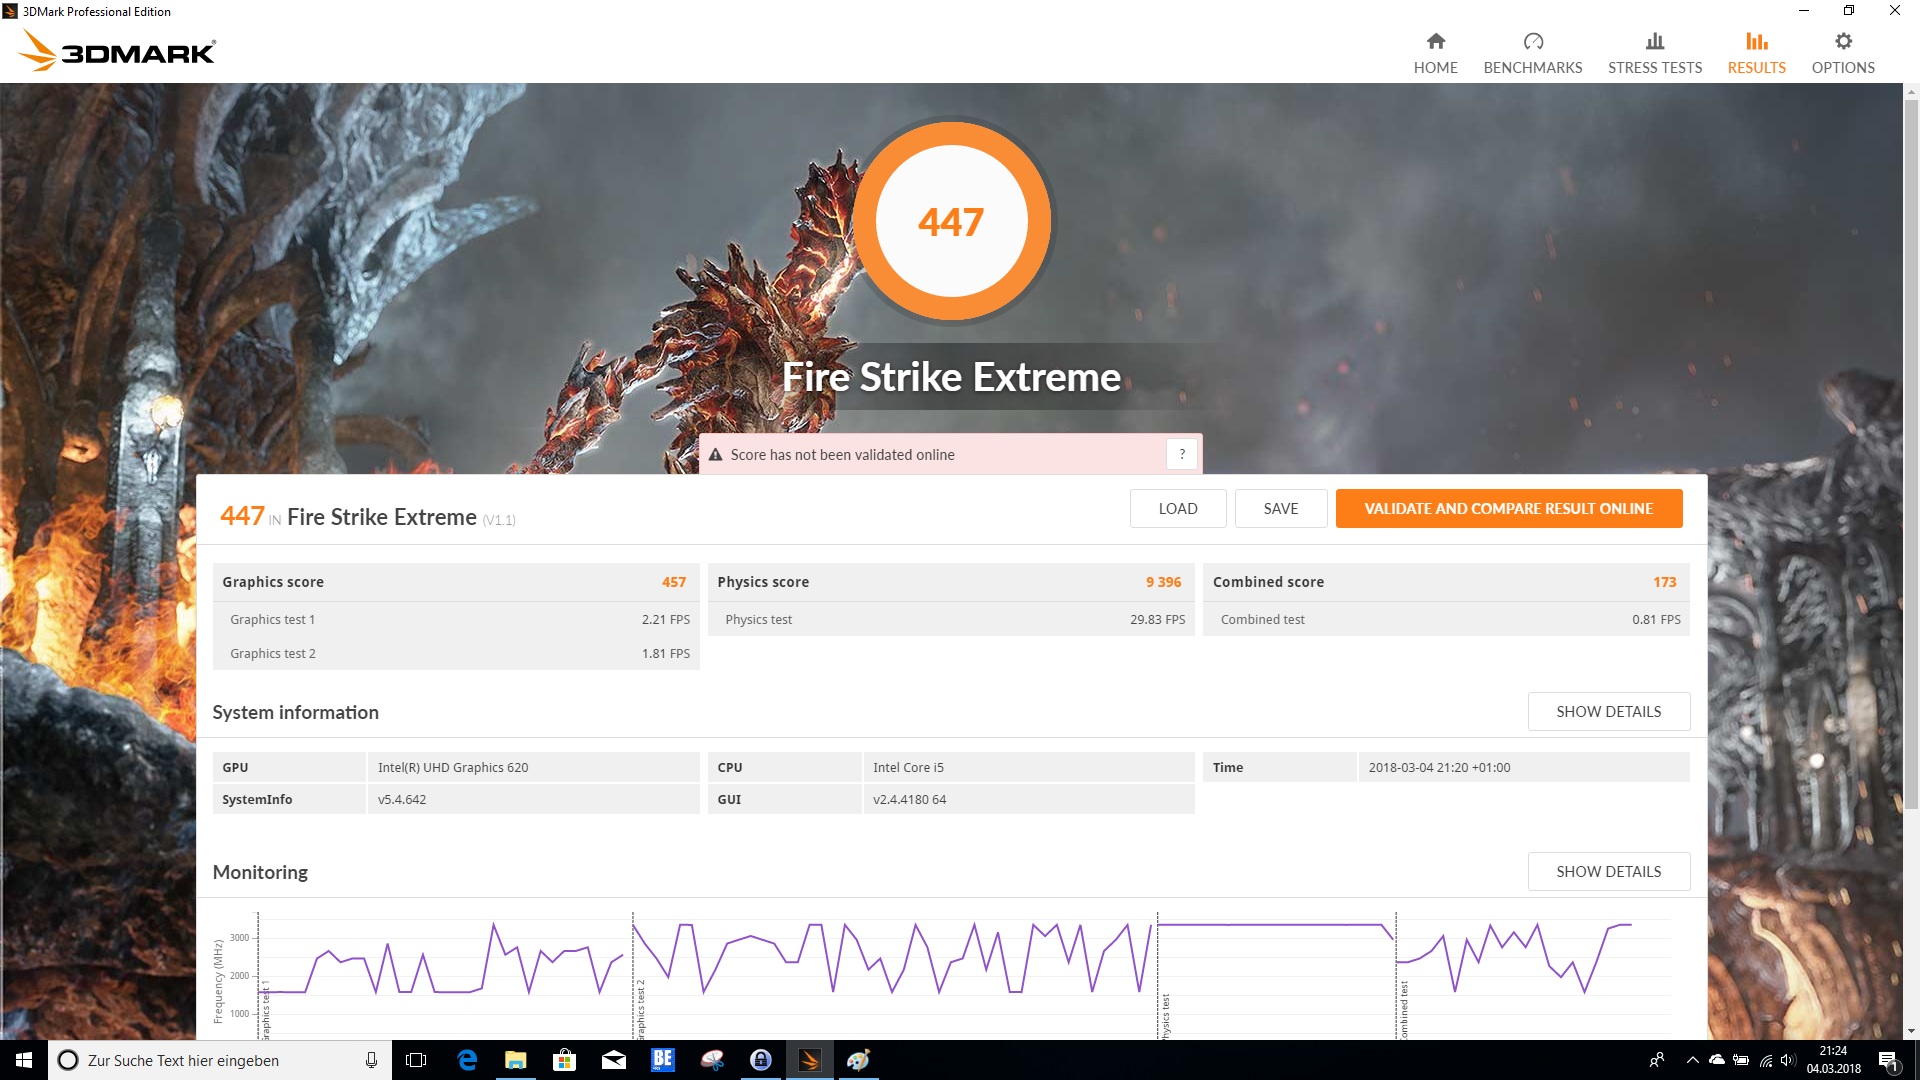
| 3DMark Fire Strike Extreme Score | 447 pontos | |
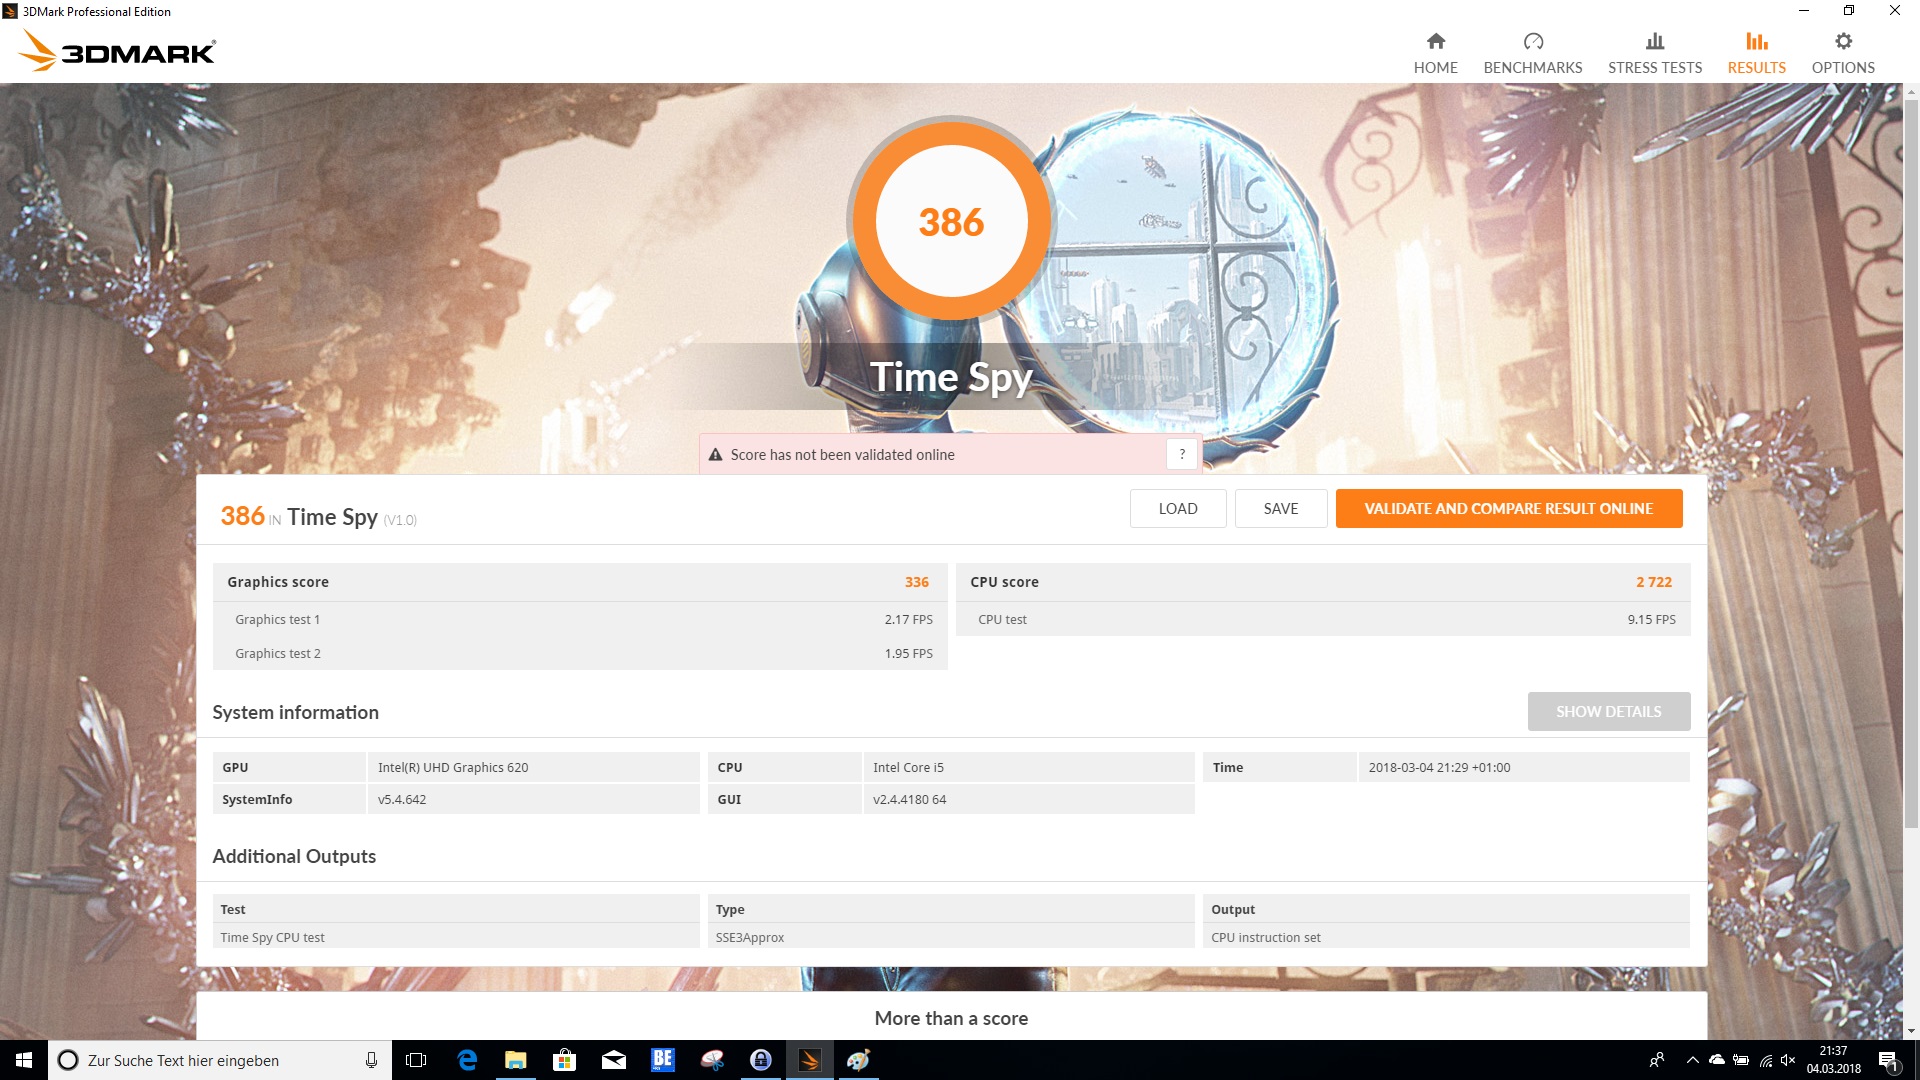
| 3DMark Time Spy Score | 386 pontos | |
Ajuda | ||
| baixo | média | alto | ultra | |
|---|---|---|---|---|
| BioShock Infinite (2013) | 47.4 | 27.8 | 23 | 7.7 |
| The Witcher 3 (2015) | 15.2 | 9.8 | 5.5 | |
| Rise of the Tomb Raider (2016) | 18.6 | 11.4 | 6.5 |
Barulho
| Ocioso |
| 30.4 / 30.4 / 30.4 dB |
| Carga |
| 32.3 / 37 dB |
 | ||
30 dB silencioso 40 dB(A) audível 50 dB(A) ruidosamente alto |
||
min: | ||
| Lenovo ThinkPad L480-20LS001AGE UHD Graphics 620, i5-8250U, Toshiba KXG5AZNV256G | Lenovo ThinkPad L470-20J5S00C00 HD Graphics 620, i5-7200U, SanDisk X400 256GB, SATA (SD8SB8U-256G) | Lenovo ThinkPad E480-20KNCTO1WW UHD Graphics 620, i5-8250U, Toshiba KBG30ZMT128G | Lenovo ThinkPad E480-20KQS00000 Radeon RX 550 (Laptop), i5-8250U, Lenovo LENSE20256GMSP34MEAT2TA | HP ProBook 440 G5-3KX87ES UHD Graphics 620, i5-8250U, Intel SSD 600p SSDPEKKW256G7 | Dell Latitude 5490-TD70X UHD Graphics 620, i5-8350U, Toshiba KSG60ZMV512G | |
|---|---|---|---|---|---|---|
| Noise | 2% | 4% | -7% | 1% | -2% | |
| desligado / ambiente * (dB) | 30.4 | 29.3 4% | 29.1 4% | 29.8 2% | 29.1 4% | 28.8 5% |
| Idle Minimum * (dB) | 30.4 | 29.3 4% | 29.1 4% | 29.8 2% | 29.1 4% | 28.8 5% |
| Idle Average * (dB) | 30.4 | 29.3 4% | 29.1 4% | 31.5 -4% | 29.1 4% | 28.8 5% |
| Idle Maximum * (dB) | 30.4 | 29.3 4% | 30.3 -0% | 33.3 -10% | 30.7 -1% | 30.9 -2% |
| Load Average * (dB) | 32.3 | 33.8 -5% | 31.8 2% | 39.1 -21% | 34.5 -7% | 35.6 -10% |
| Load Maximum * (dB) | 37 | 37.5 -1% | 33.8 9% | 40.4 -9% | 36 3% | 41.4 -12% |
| Witcher 3 ultra * (dB) | 39.1 |
* ... menor é melhor
(±) A temperatura máxima no lado superior é 43 °C / 109 F, em comparação com a média de 34.3 °C / 94 F , variando de 21.2 a 62.5 °C para a classe Office.
(±) A parte inferior aquece até um máximo de 41.7 °C / 107 F, em comparação com a média de 36.8 °C / 98 F
(+) Em uso inativo, a temperatura média para o lado superior é 24 °C / 75 F, em comparação com a média do dispositivo de 29.5 °C / ### class_avg_f### F.
(+) Os apoios para as mãos e o touchpad são mais frios que a temperatura da pele, com um máximo de 24 °C / 75.2 F e, portanto, são frios ao toque.
(+) A temperatura média da área do apoio para as mãos de dispositivos semelhantes foi 27.6 °C / 81.7 F (+3.6 °C / 6.5 F).
| Lenovo ThinkPad L480-20LS001AGE UHD Graphics 620, i5-8250U, Toshiba KXG5AZNV256G | Lenovo ThinkPad L470-20J5S00C00 HD Graphics 620, i5-7200U, SanDisk X400 256GB, SATA (SD8SB8U-256G) | Lenovo ThinkPad E480-20KNCTO1WW UHD Graphics 620, i5-8250U, Toshiba KBG30ZMT128G | Lenovo ThinkPad E480-20KQS00000 Radeon RX 550 (Laptop), i5-8250U, Lenovo LENSE20256GMSP34MEAT2TA | HP ProBook 440 G5-3KX87ES UHD Graphics 620, i5-8250U, Intel SSD 600p SSDPEKKW256G7 | Dell Latitude 5490-TD70X UHD Graphics 620, i5-8350U, Toshiba KSG60ZMV512G | |
|---|---|---|---|---|---|---|
| Heat | 4% | 9% | -25% | 3% | 5% | |
| Maximum Upper Side * (°C) | 43 | 40.1 7% | 36.7 15% | 51.9 -21% | 39 9% | 38.3 11% |
| Maximum Bottom * (°C) | 41.7 | 51 -22% | 42.8 -3% | 71.6 -72% | 45.5 -9% | 44.7 -7% |
| Idle Upper Side * (°C) | 25.7 | 22 14% | 23.4 9% | 24.8 4% | 24.8 4% | 23.7 8% |
| Idle Bottom * (°C) | 27.1 | 22.4 17% | 22.8 16% | 30 -11% | 25 8% | 25.4 6% |
* ... menor é melhor
Lenovo ThinkPad L480-20LS001AGE análise de áudio
(-) | alto-falantes não muito altos (###valor### dB)
Graves 100 - 315Hz
(-) | quase nenhum baixo - em média 21.3% menor que a mediana
(±) | a linearidade dos graves é média (10.9% delta para a frequência anterior)
Médios 400 - 2.000 Hz
(+) | médios equilibrados - apenas 4.2% longe da mediana
(±) | a linearidade dos médios é média (14% delta para frequência anterior)
Altos 2 - 16 kHz
(+) | agudos equilibrados - apenas 2.6% longe da mediana
(±) | a linearidade dos máximos é média (9.1% delta para frequência anterior)
Geral 100 - 16.000 Hz
(±) | a linearidade do som geral é média (24.3% diferença em relação à mediana)
Comparado com a mesma classe
» 71% de todos os dispositivos testados nesta classe foram melhores, 8% semelhantes, 21% piores
» O melhor teve um delta de 7%, a média foi 21%, o pior foi 53%
Comparado com todos os dispositivos testados
» 74% de todos os dispositivos testados foram melhores, 6% semelhantes, 21% piores
» O melhor teve um delta de 4%, a média foi 23%, o pior foi 134%
Lenovo ThinkPad E480-20KQS00000 análise de áudio
(±) | o volume do alto-falante é médio, mas bom (###valor### dB)
Graves 100 - 315Hz
(±) | graves reduzidos - em média 13.2% menor que a mediana
(±) | a linearidade dos graves é média (12.4% delta para a frequência anterior)
Médios 400 - 2.000 Hz
(±) | médios mais altos - em média 5.2% maior que a mediana
(±) | a linearidade dos médios é média (9.6% delta para frequência anterior)
Altos 2 - 16 kHz
(+) | agudos equilibrados - apenas 3.8% longe da mediana
(±) | a linearidade dos máximos é média (10.2% delta para frequência anterior)
Geral 100 - 16.000 Hz
(±) | a linearidade do som geral é média (19.9% diferença em relação à mediana)
Comparado com a mesma classe
» 42% de todos os dispositivos testados nesta classe foram melhores, 9% semelhantes, 49% piores
» O melhor teve um delta de 7%, a média foi 21%, o pior foi 53%
Comparado com todos os dispositivos testados
» 51% de todos os dispositivos testados foram melhores, 7% semelhantes, 42% piores
» O melhor teve um delta de 4%, a média foi 23%, o pior foi 134%
| desligado | |
| Ocioso | |
| Carga |
|
Key:
min: | |
| Lenovo ThinkPad L480-20LS001AGE i5-8250U, UHD Graphics 620, Toshiba KXG5AZNV256G, IPS, 1920x1080, 14" | Lenovo ThinkPad L470-20J5S00C00 i5-7200U, HD Graphics 620, SanDisk X400 256GB, SATA (SD8SB8U-256G), IPS, 1920x1080, 14" | Lenovo ThinkPad E480-20KNCTO1WW i5-8250U, UHD Graphics 620, Toshiba KBG30ZMT128G, IPS LED, 1920x1080, 14" | Lenovo ThinkPad E480-20KQS00000 i5-8250U, Radeon RX 550 (Laptop), Lenovo LENSE20256GMSP34MEAT2TA, IPS LED, 1920x1080, 14" | HP ProBook 440 G5-3KX87ES i5-8250U, UHD Graphics 620, Intel SSD 600p SSDPEKKW256G7, IPS LED, 1920x1080, 14" | Dell Latitude 5490-TD70X i5-8350U, UHD Graphics 620, Toshiba KSG60ZMV512G, IPS, 1920x1080, 14" | |
|---|---|---|---|---|---|---|
| Power Consumption | 9% | 9% | -26% | -20% | -12% | |
| Idle Minimum * (Watt) | 3.3 | 2.6 21% | 3.5 -6% | 4.1 -24% | 4.4 -33% | 3.3 -0% |
| Idle Average * (Watt) | 6.6 | 6.3 5% | 5.3 20% | 6.3 5% | 7.1 -8% | 5.54 16% |
| Idle Maximum * (Watt) | 7.3 | 7 4% | 6.1 16% | 7.1 3% | 10.2 -40% | 6.59 10% |
| Load Average * (Watt) | 40.4 | 29.1 28% | 30 26% | 54.8 -36% | 36.5 10% | 42.4 -5% |
| Load Maximum * (Watt) | 37.4 | 42.3 -13% | 42.3 -13% | 66.4 -78% | 48.7 -30% | 67.6 -81% |
| Witcher 3 ultra * (Watt) | 43.8 |
* ... menor é melhor


| Lenovo ThinkPad L480-20LS001AGE i5-8250U, UHD Graphics 620, 45 Wh | Lenovo ThinkPad L470-20J5S00C00 i5-7200U, HD Graphics 620, 48 Wh | Lenovo ThinkPad E480-20KNCTO1WW i5-8250U, UHD Graphics 620, 45 Wh | Lenovo ThinkPad E480-20KQS00000 i5-8250U, Radeon RX 550 (Laptop), 48 Wh | HP ProBook 440 G5-3KX87ES i5-8250U, UHD Graphics 620, 48 Wh | Dell Latitude 5490-TD70X i5-8350U, UHD Graphics 620, 68 Wh | |
|---|---|---|---|---|---|---|
| Duração da bateria | 31% | 7% | 0% | 6% | 55% | |
| Reader / Idle (h) | 16.9 | 23.3 38% | 18.4 9% | 19.4 15% | 13.7 -19% | 25.9 53% |
| H.264 (h) | 8 | 10.8 35% | 7.2 -10% | 8.9 11% | 3.7 -54% | 13.2 65% |
| WiFi v1.3 (h) | 7.7 | 8 4% | 8.3 8% | 5.7 -26% | 6.9 -10% | 15 95% |
| Load (h) | 1.5 | 2.2 47% | 1.8 20% | 1.5 0% | 3.1 107% | 1.6 7% |
Pro
Contra

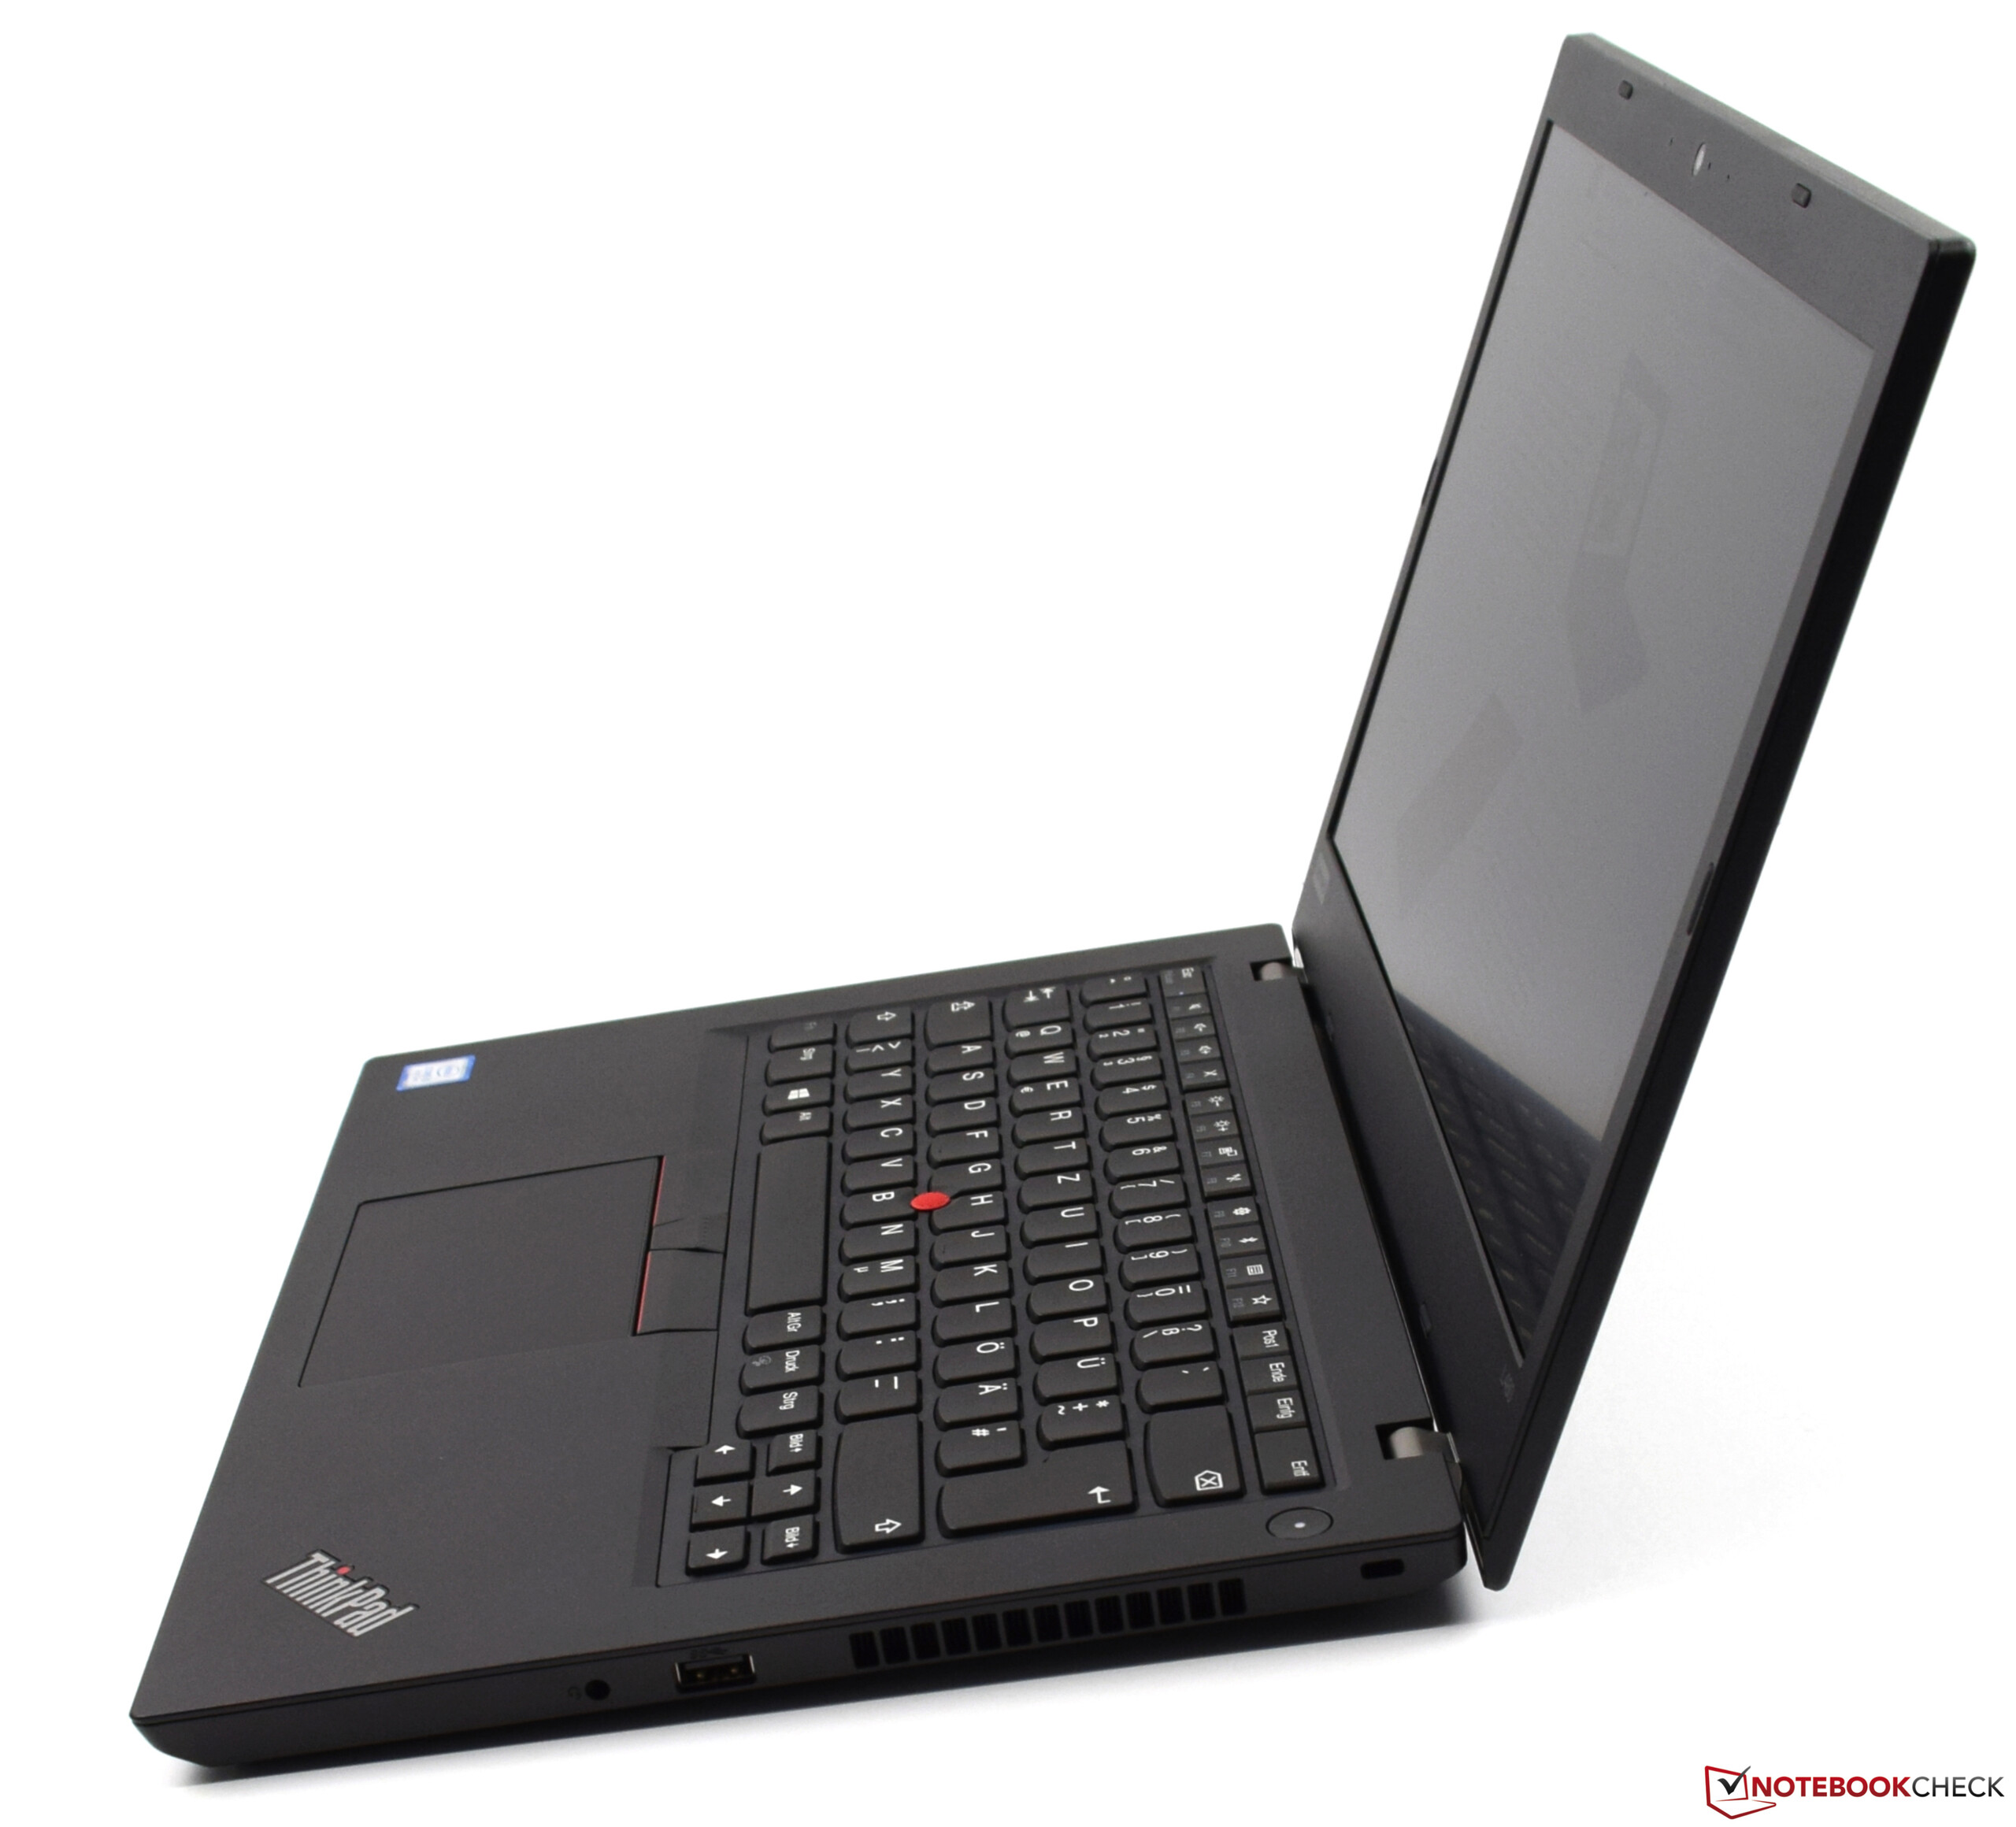
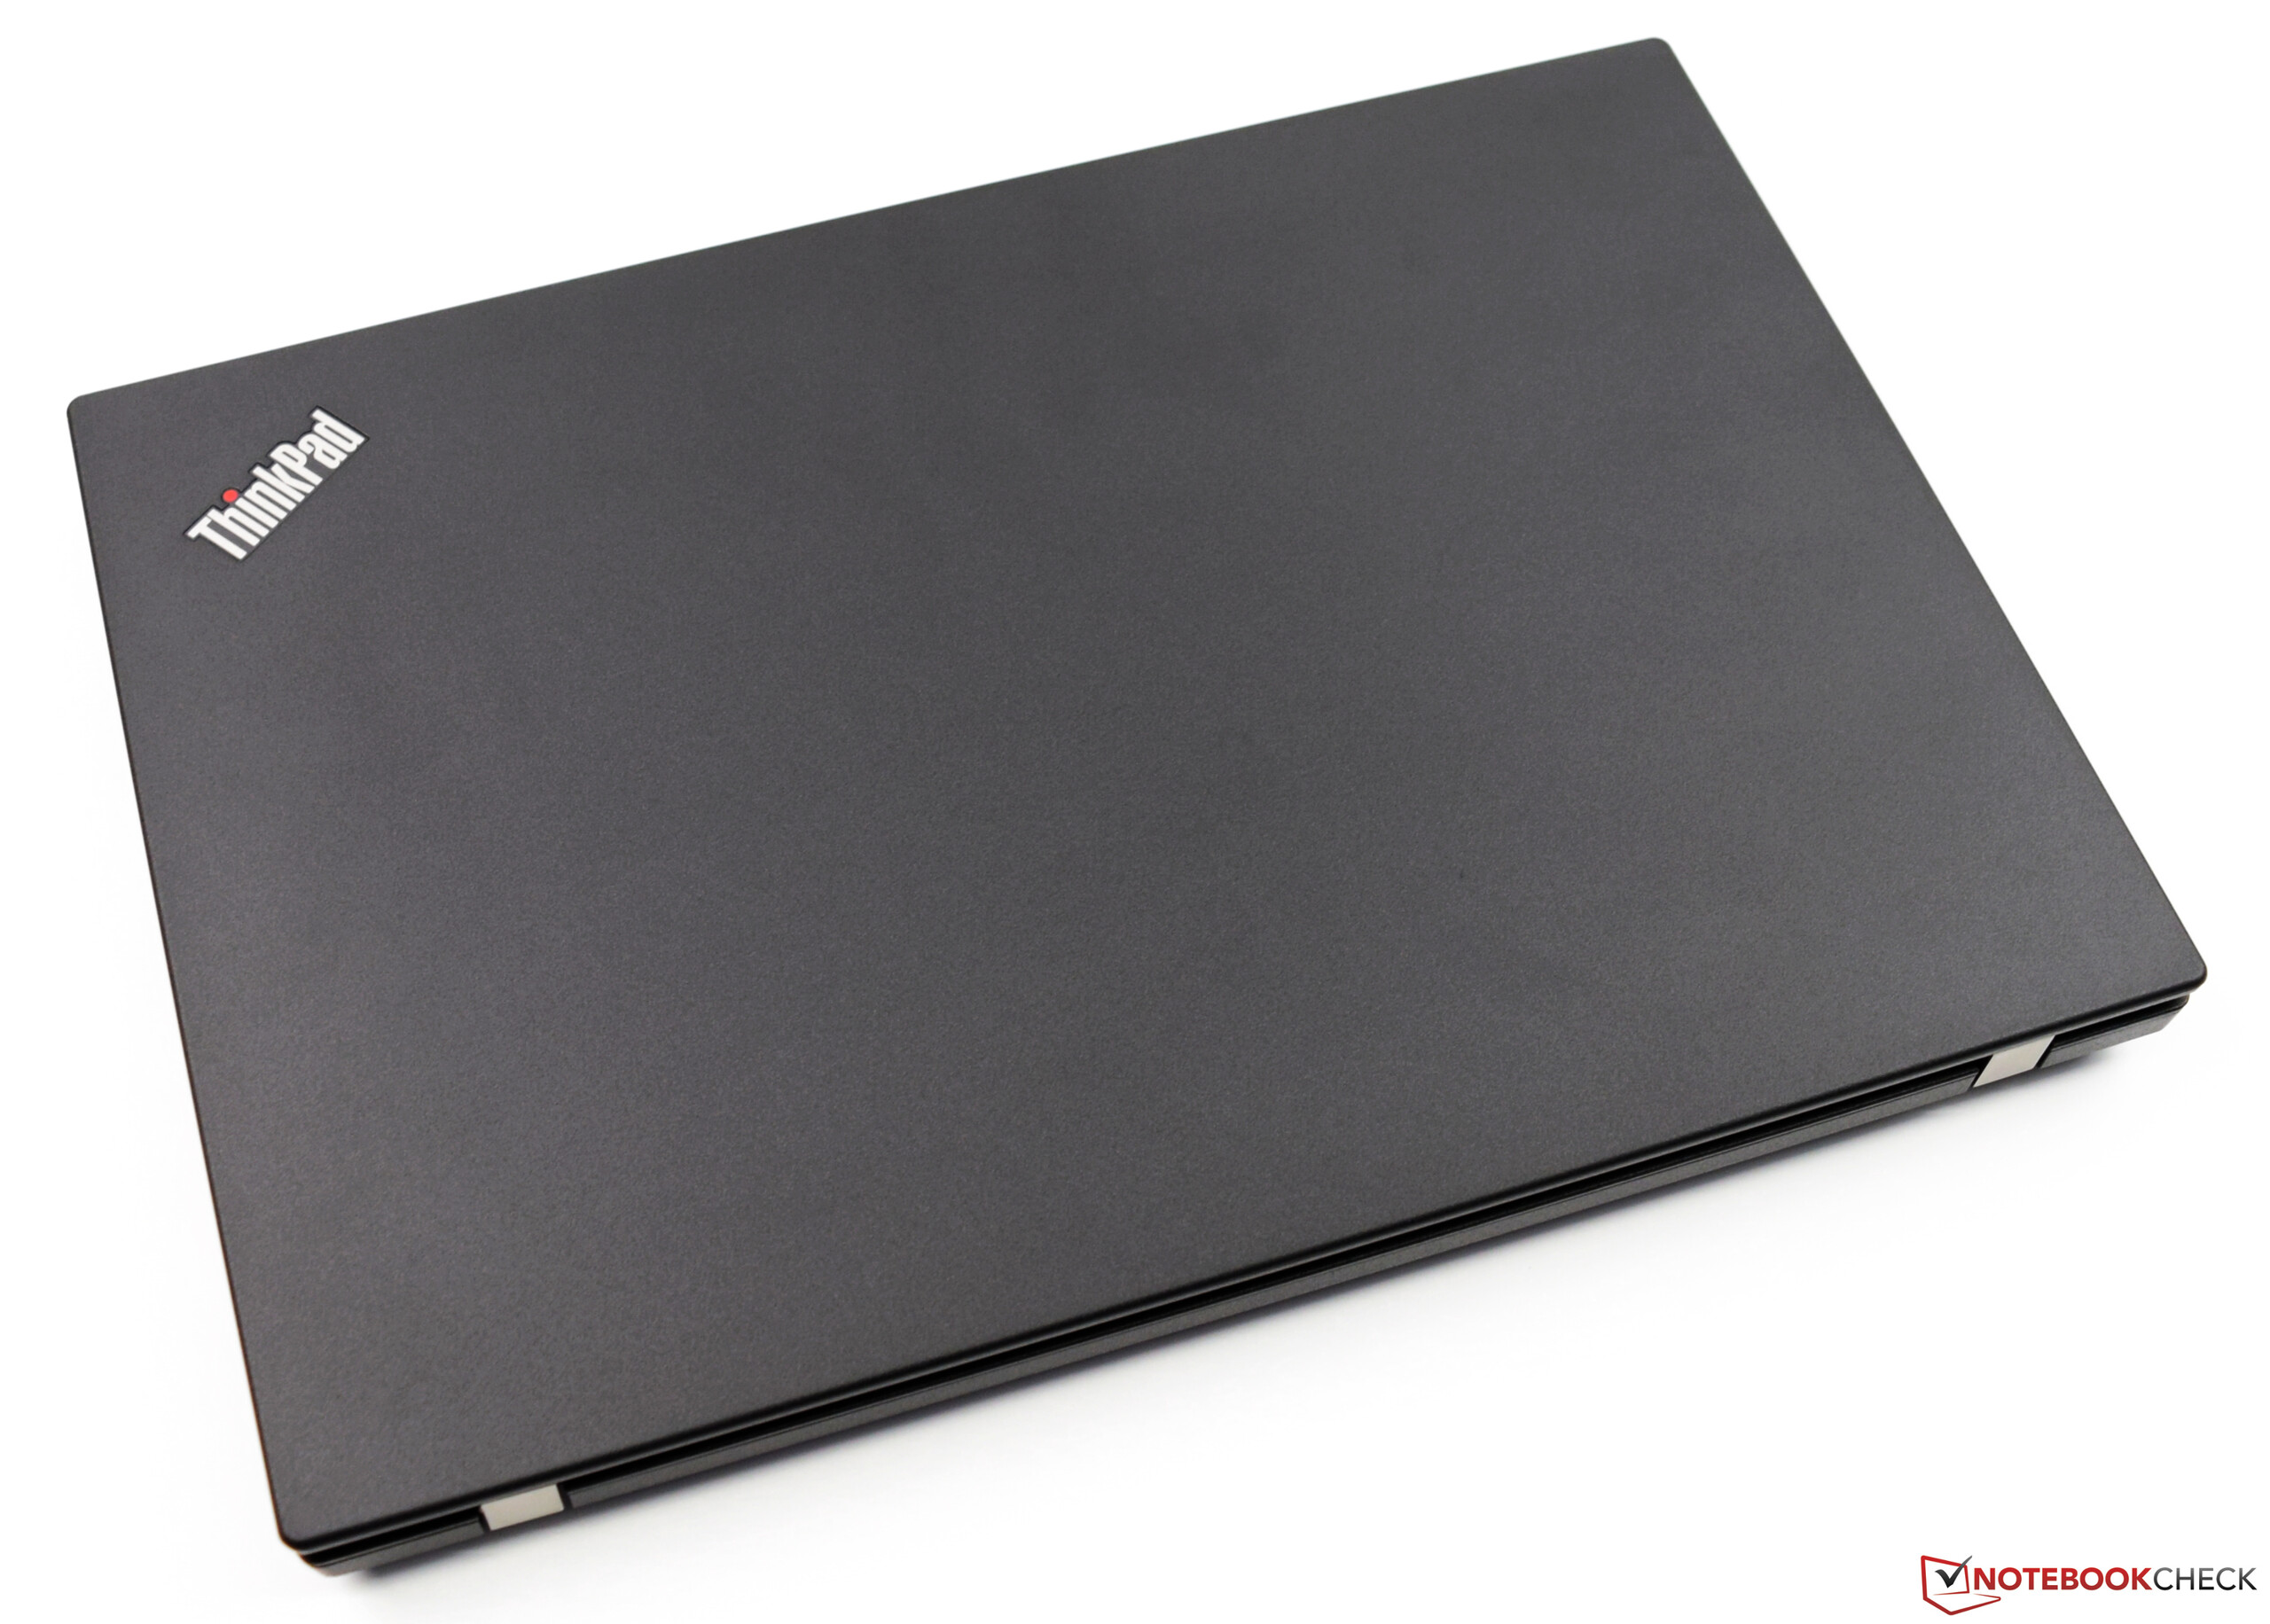
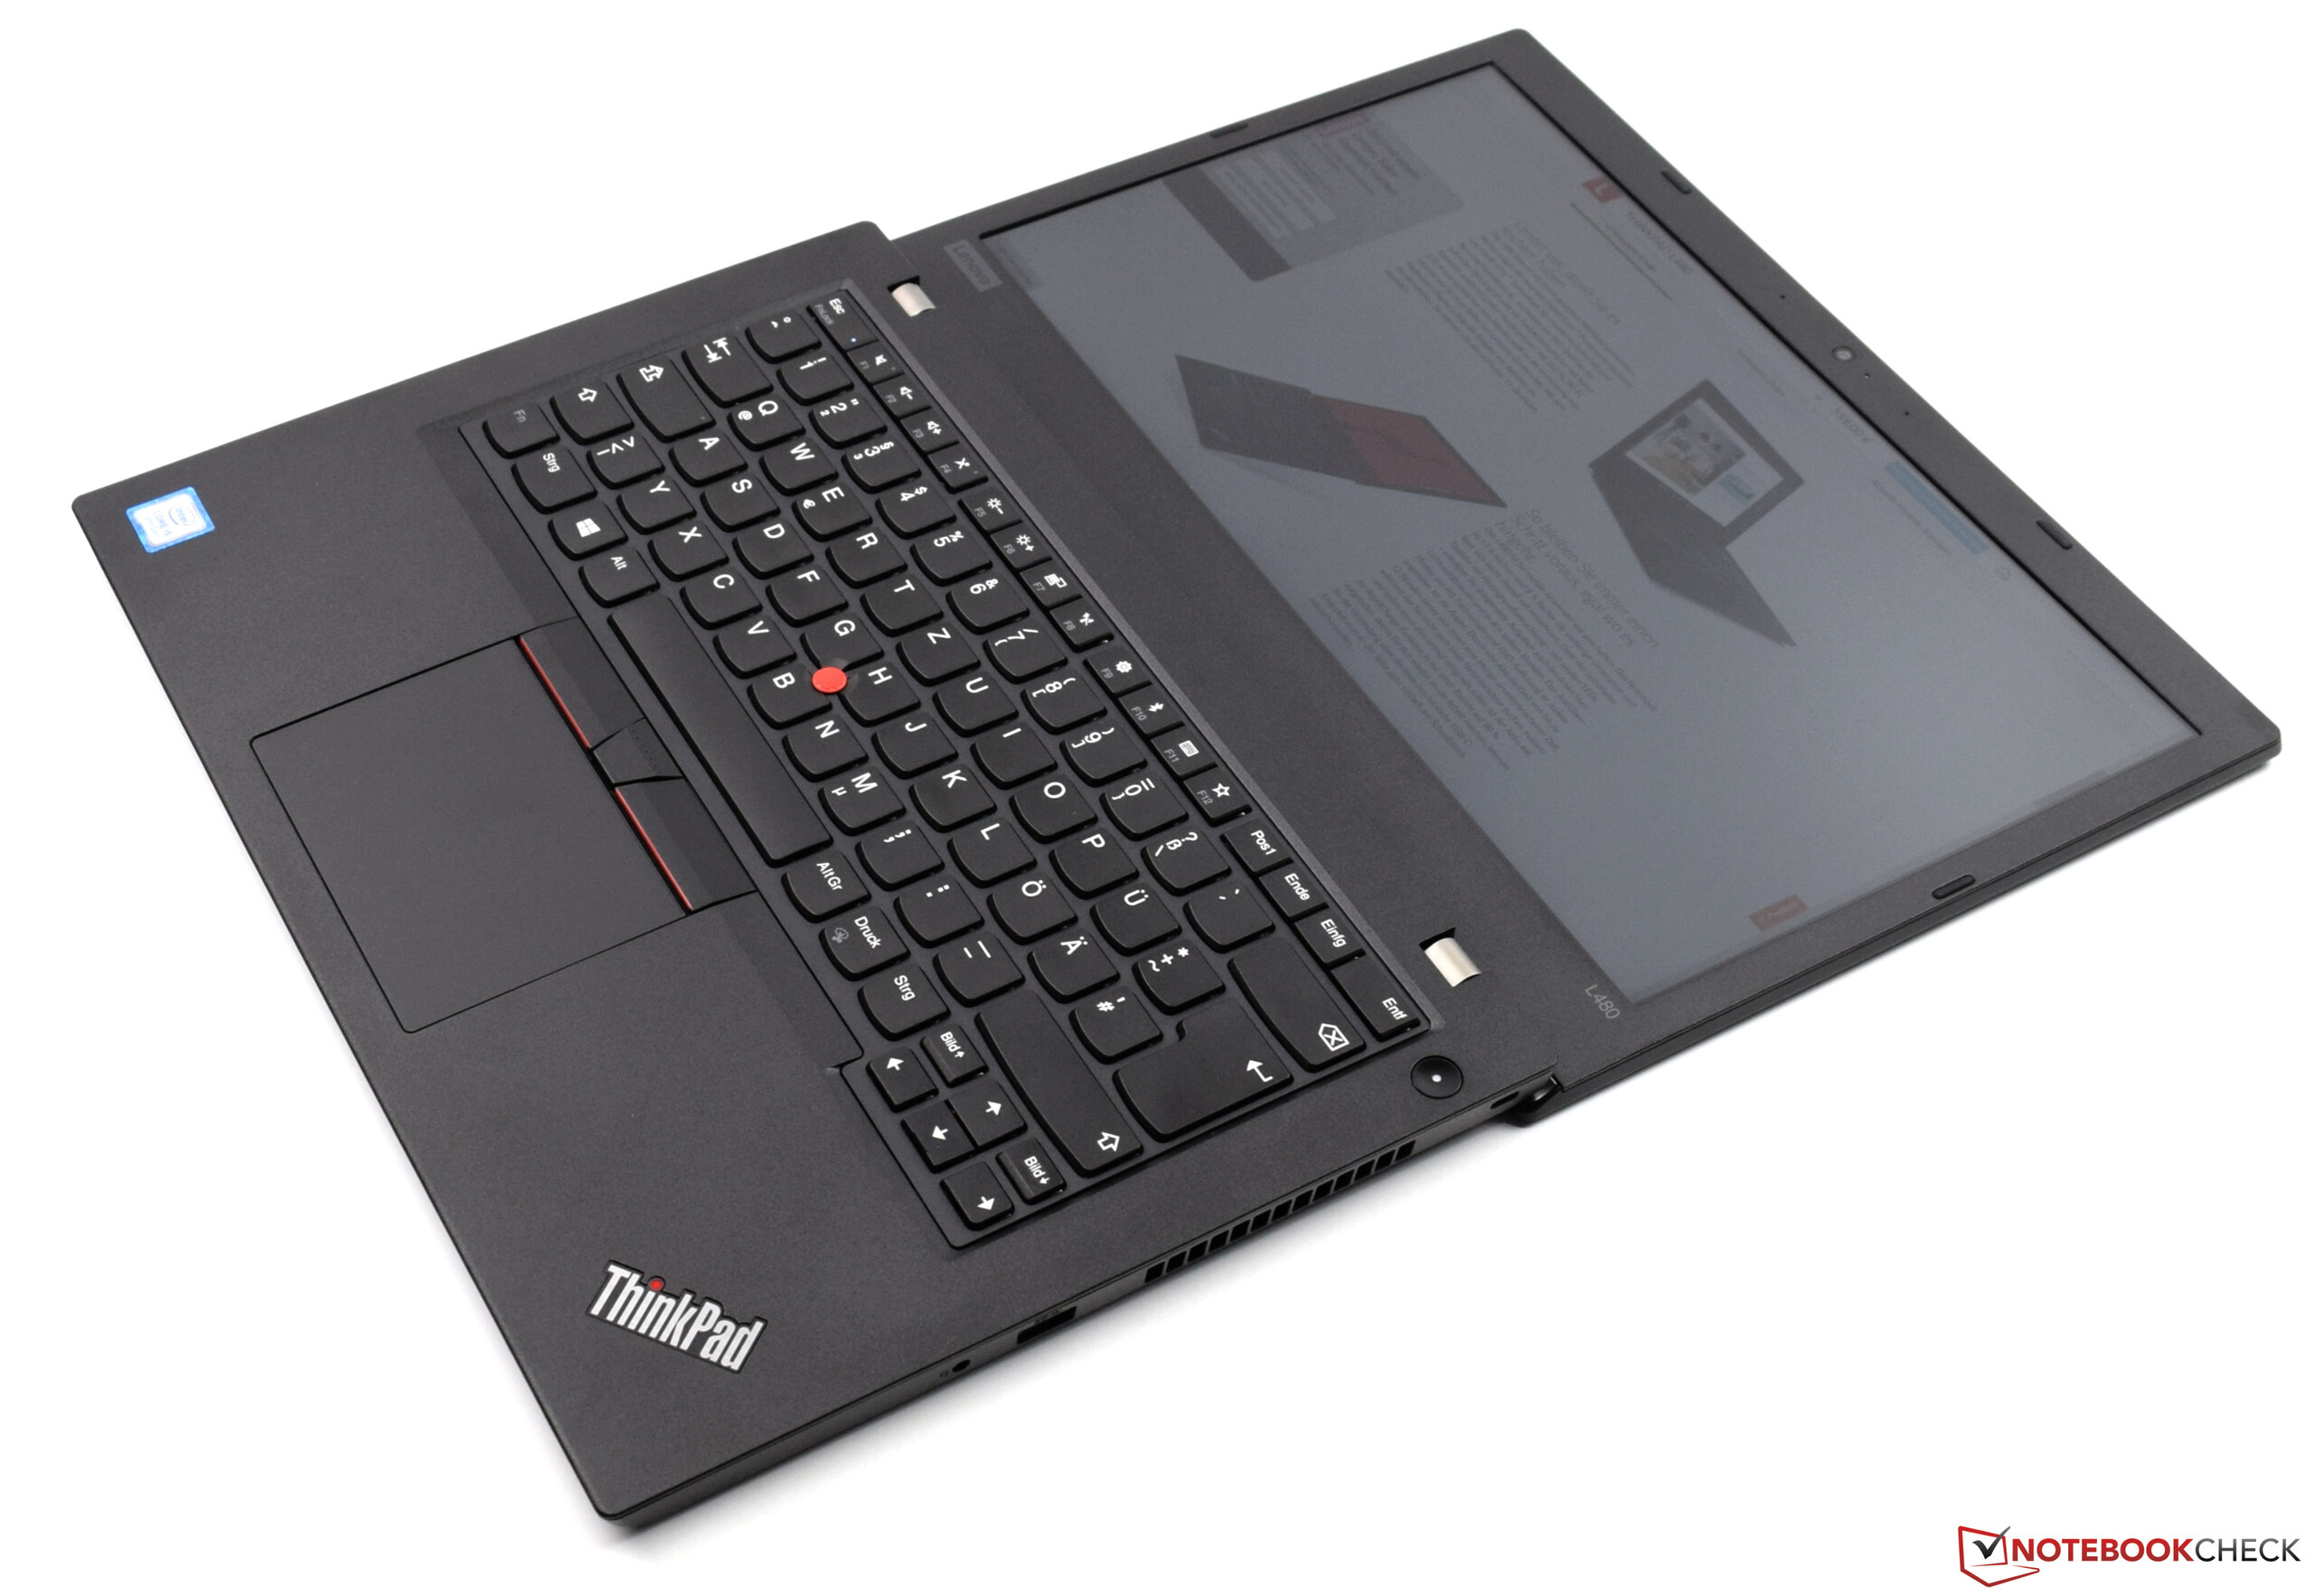
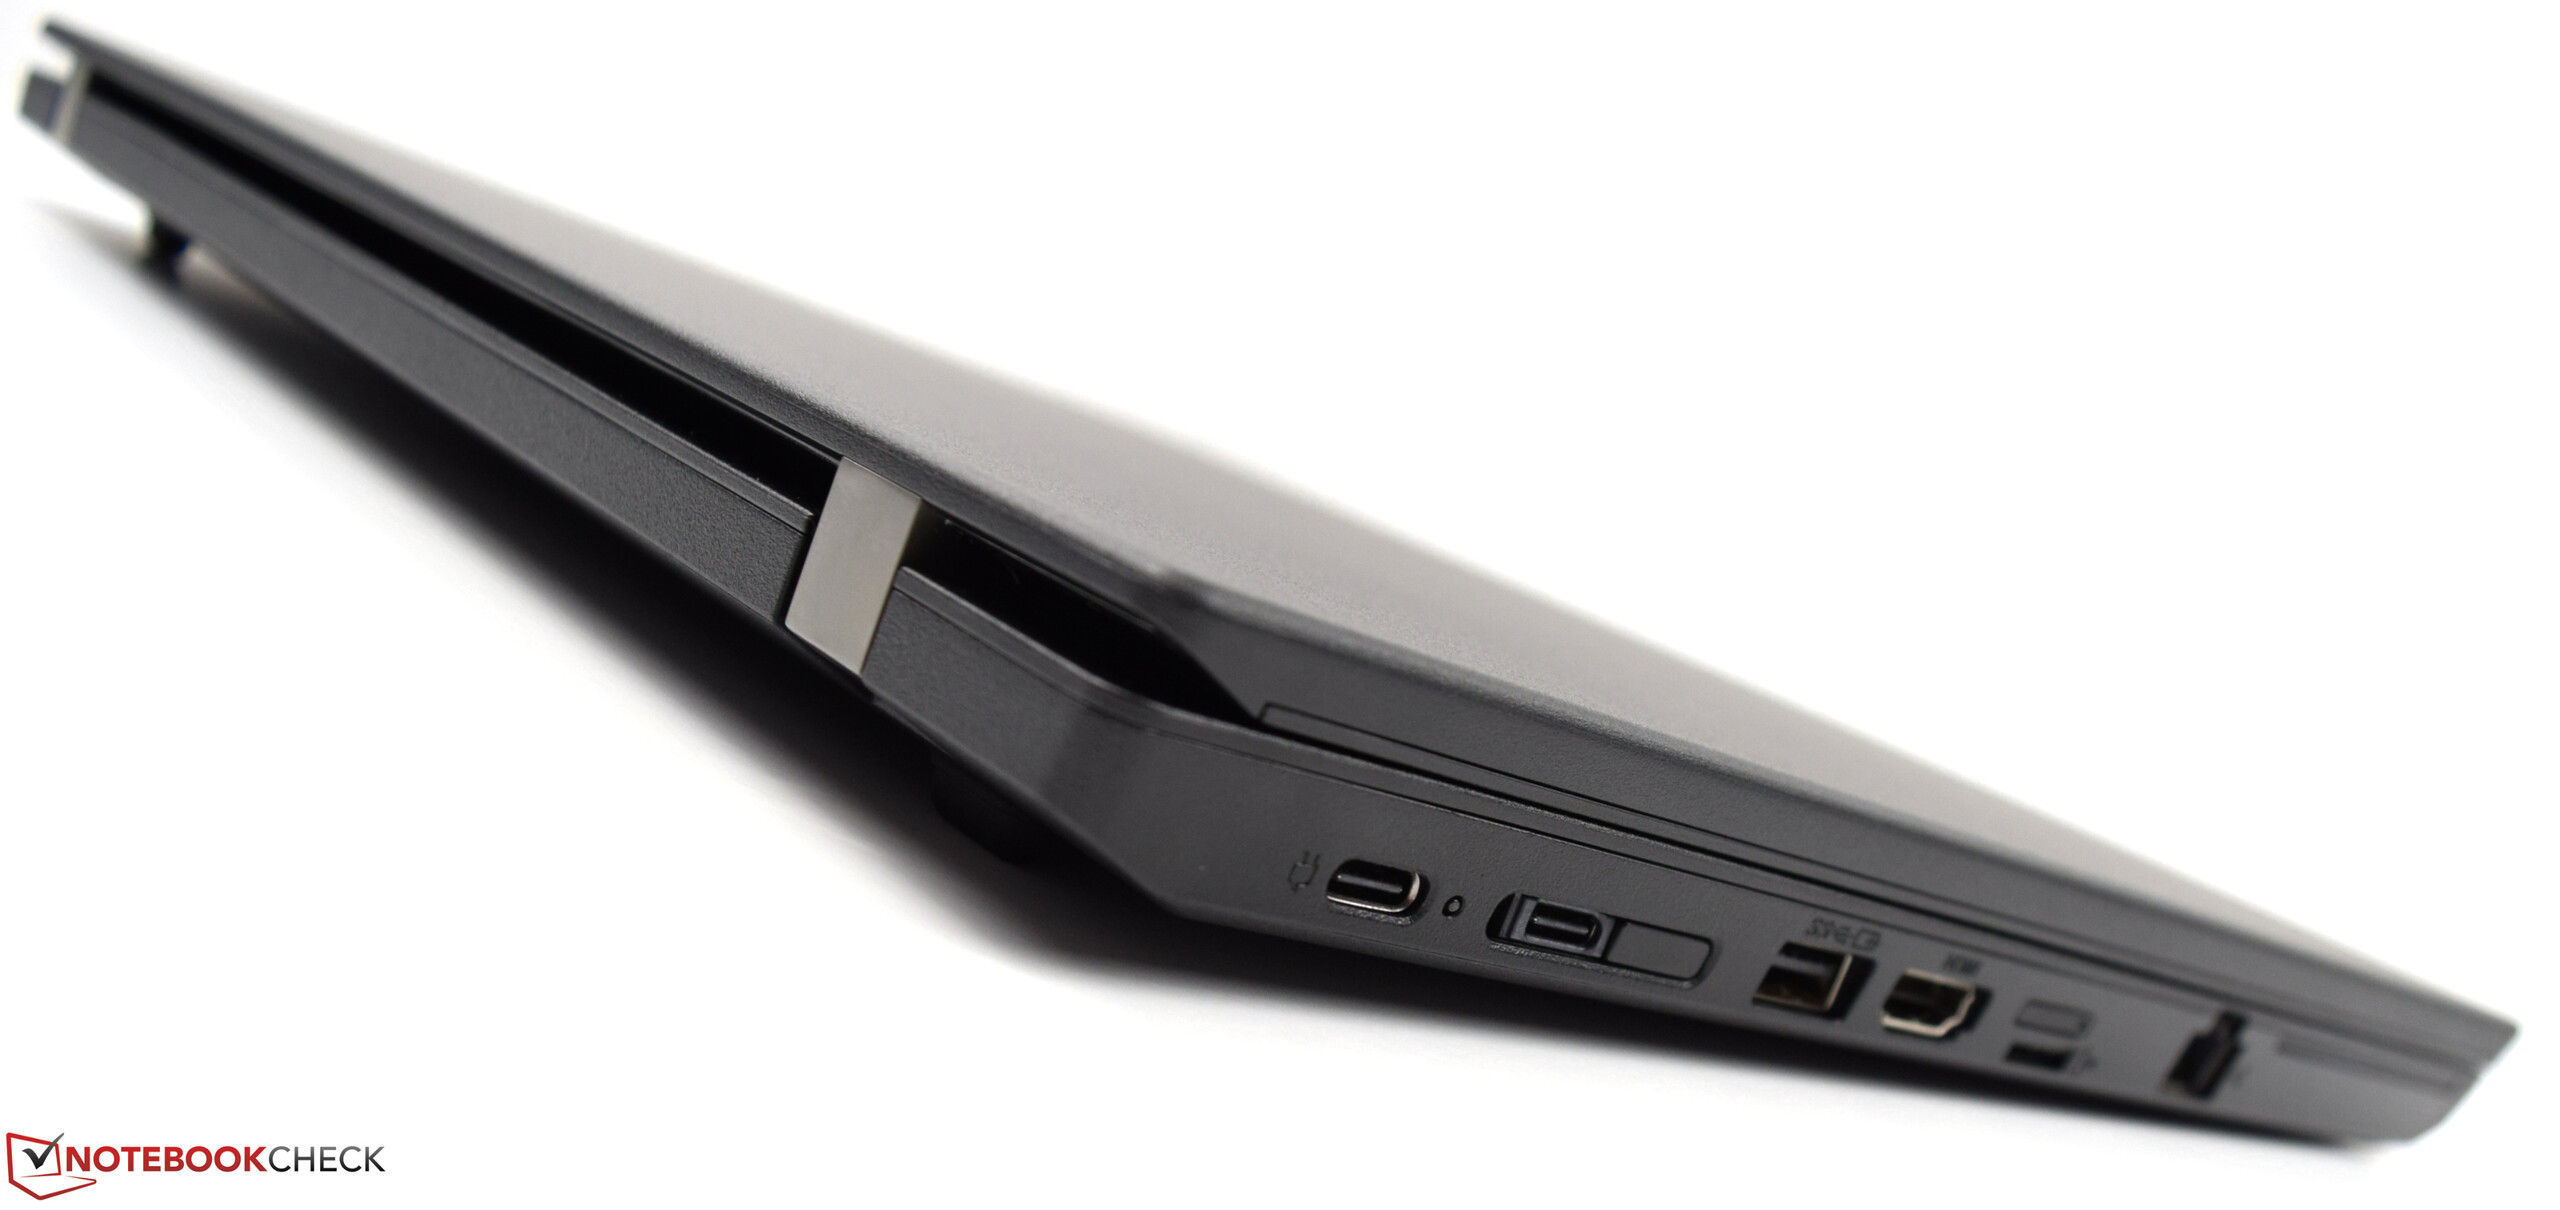
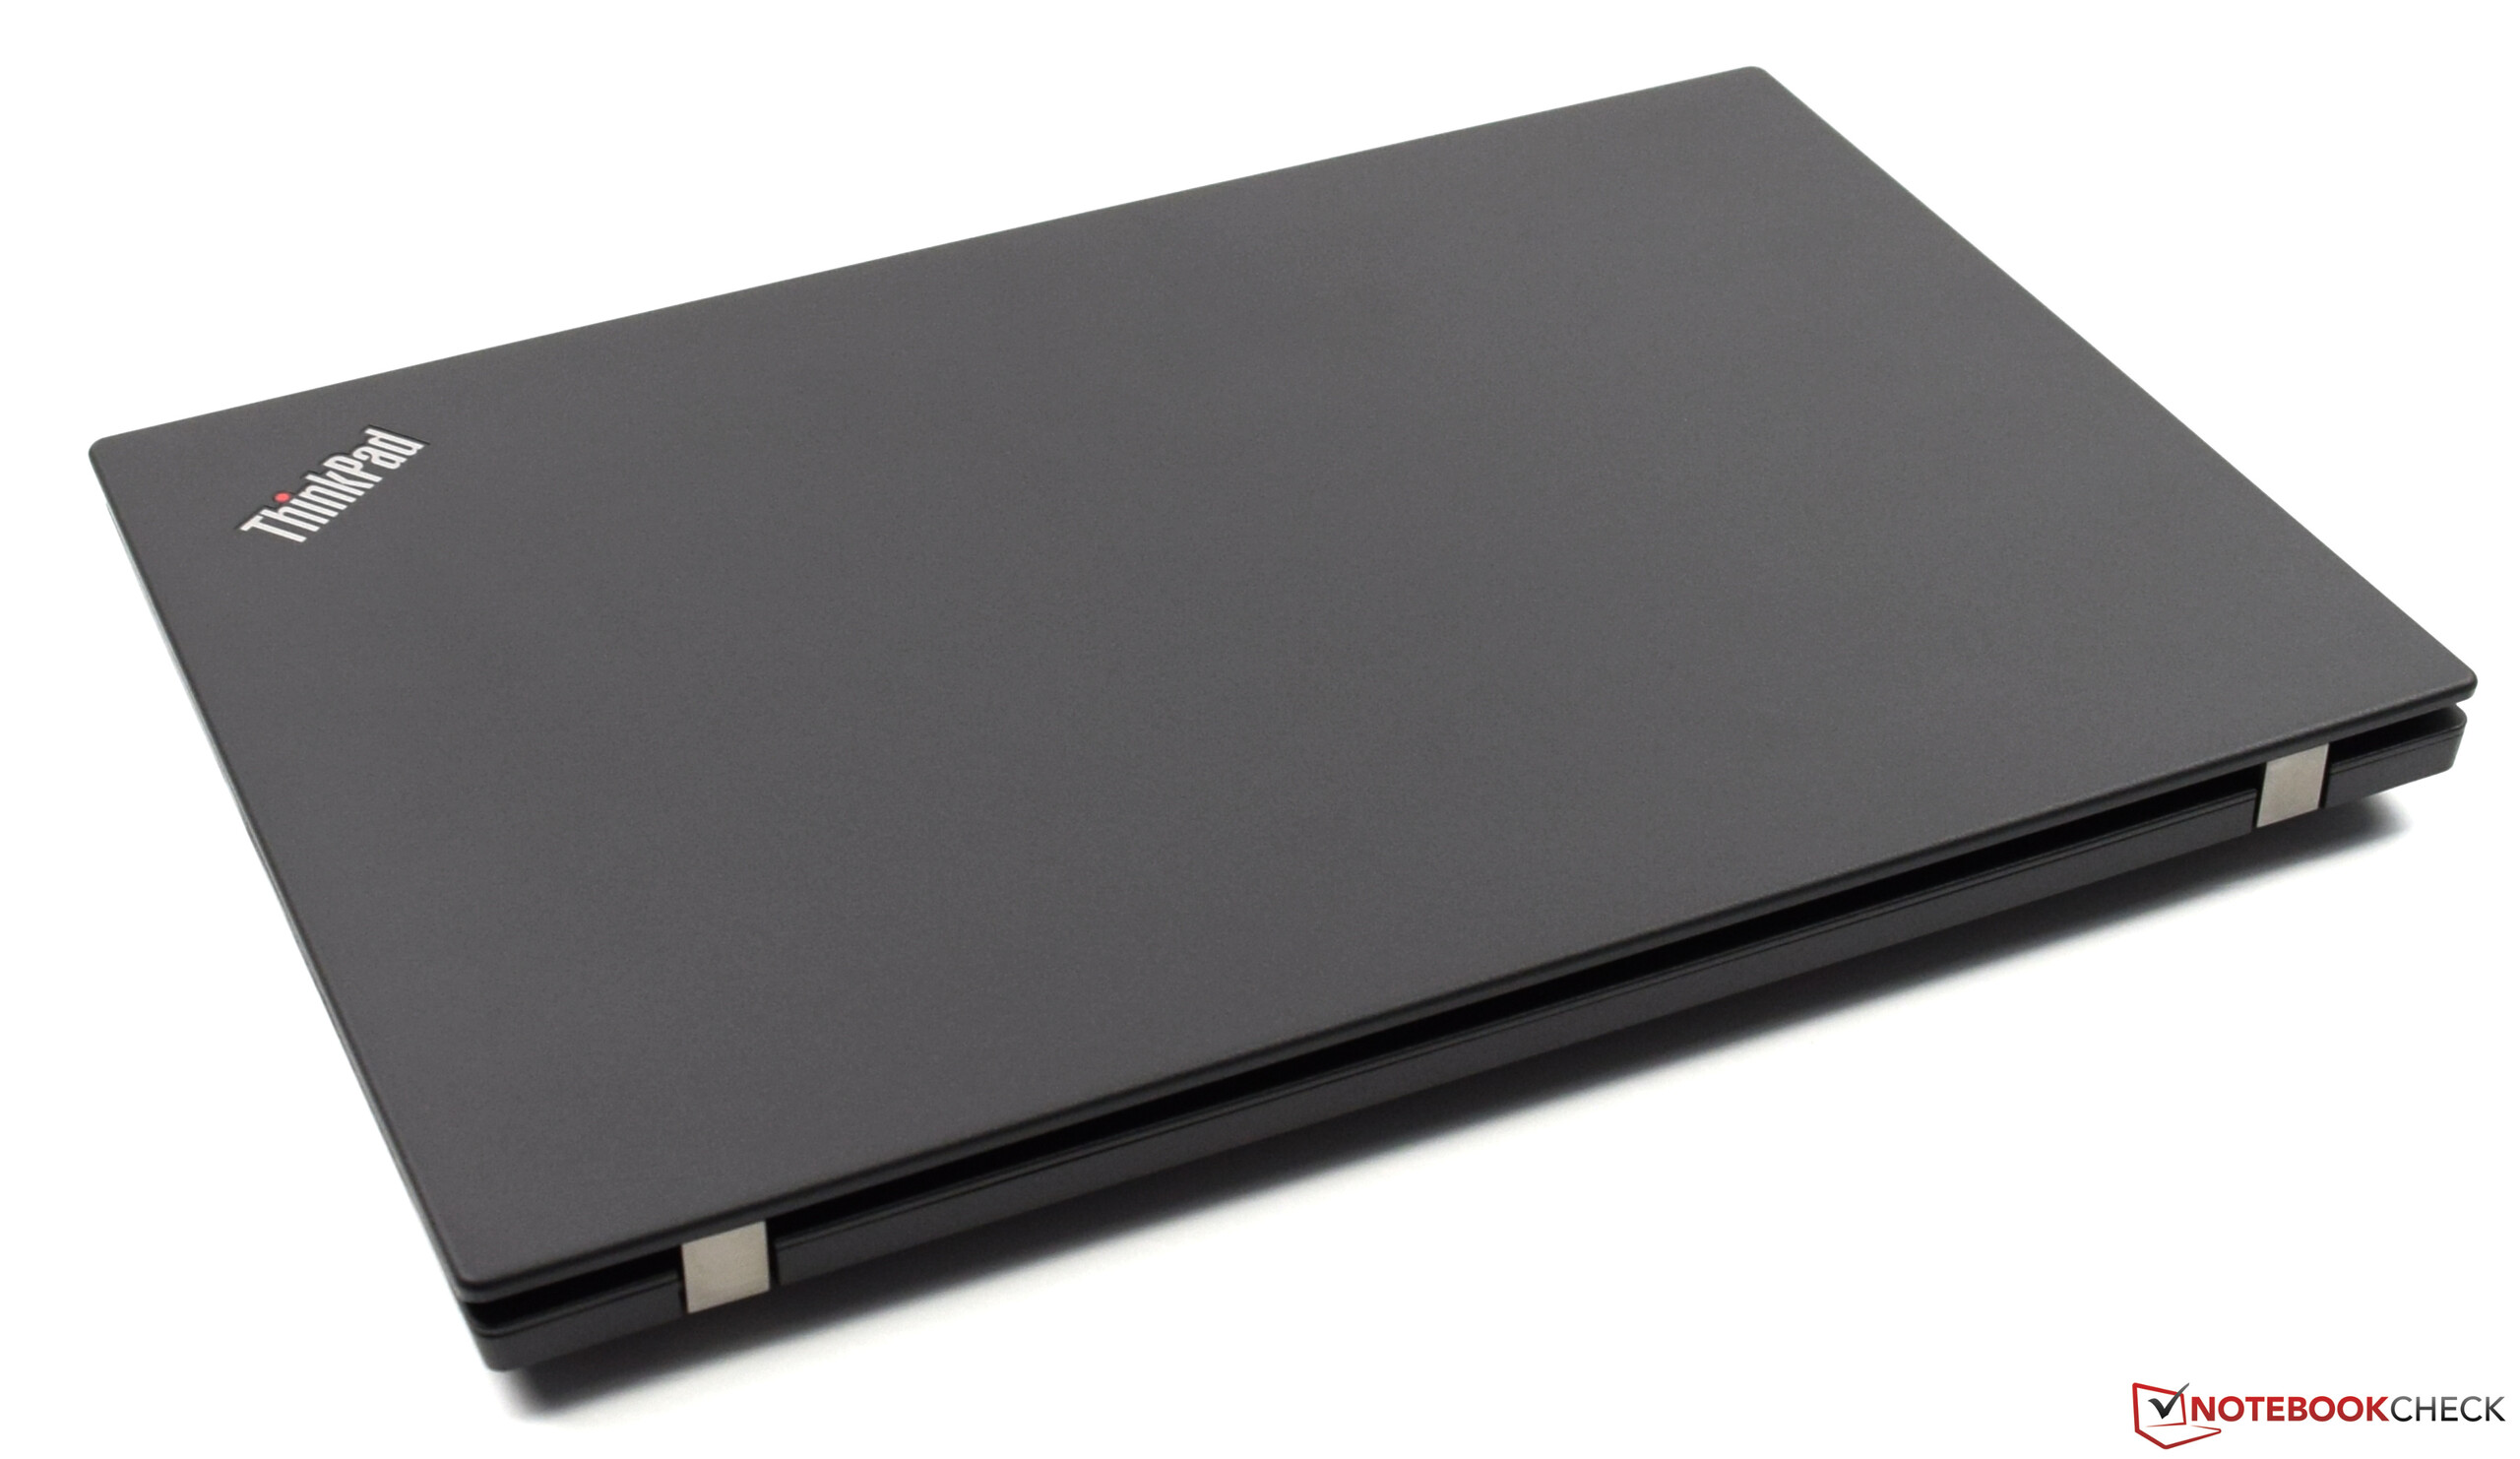
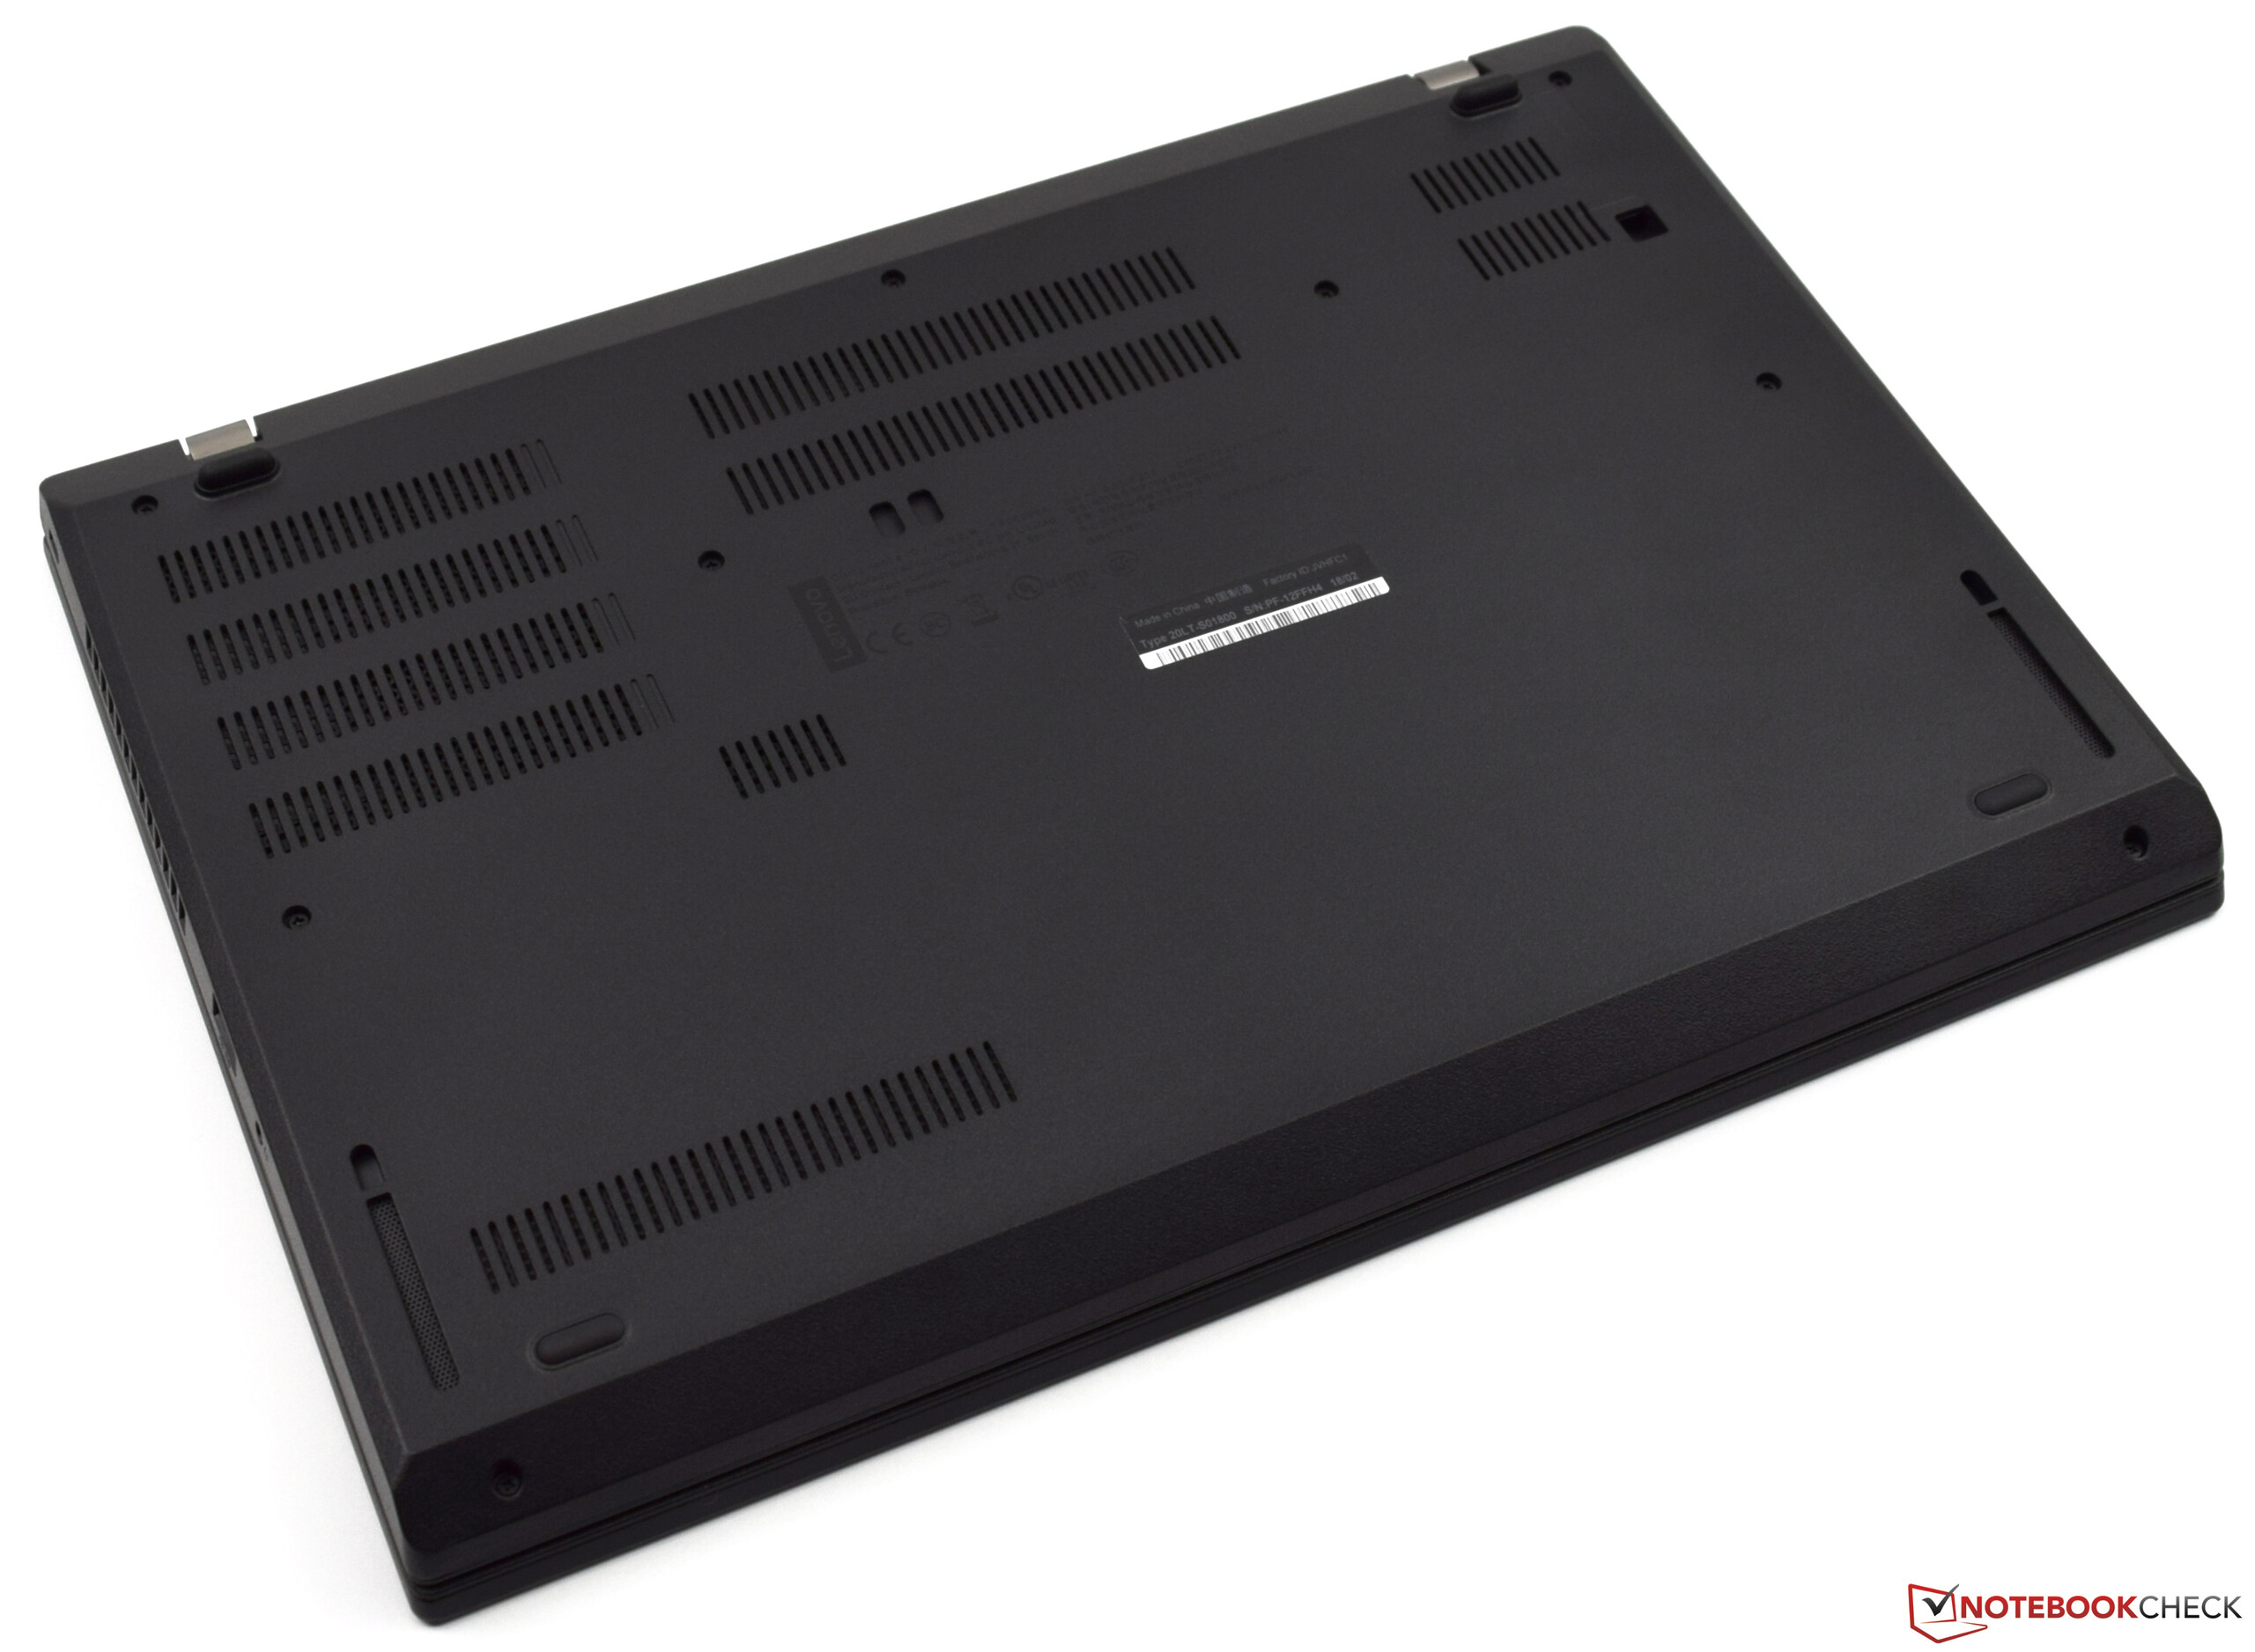
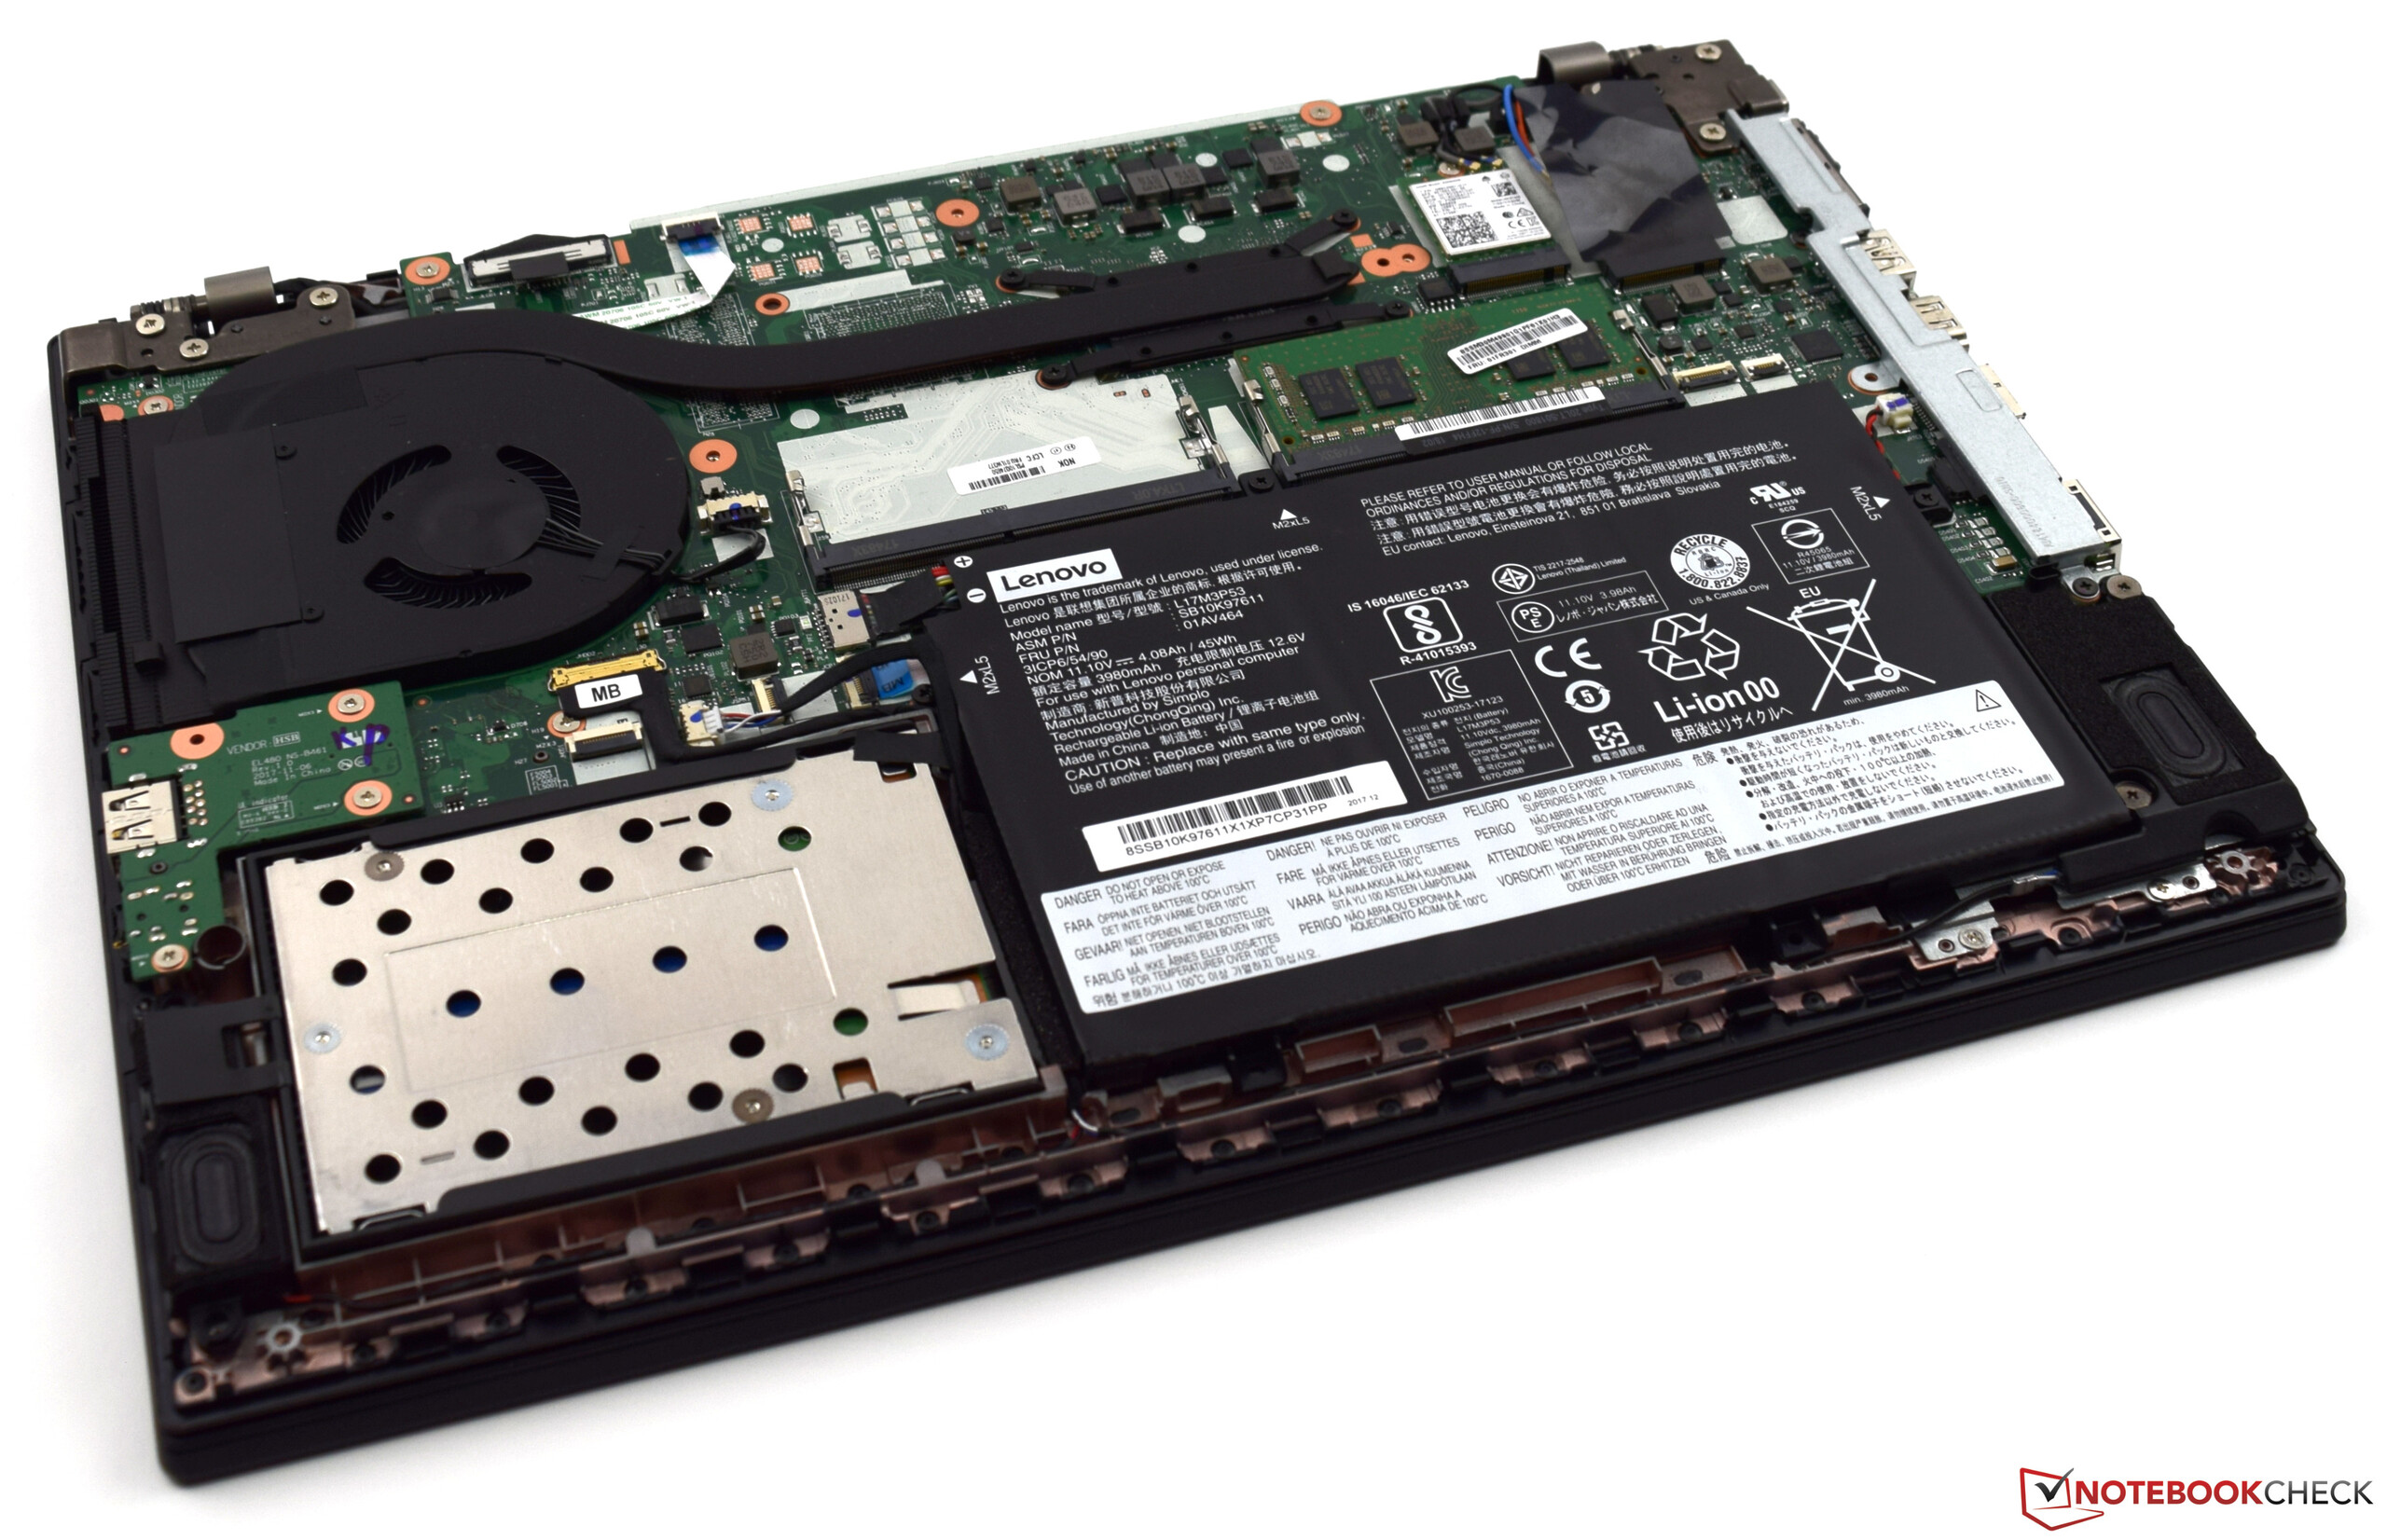
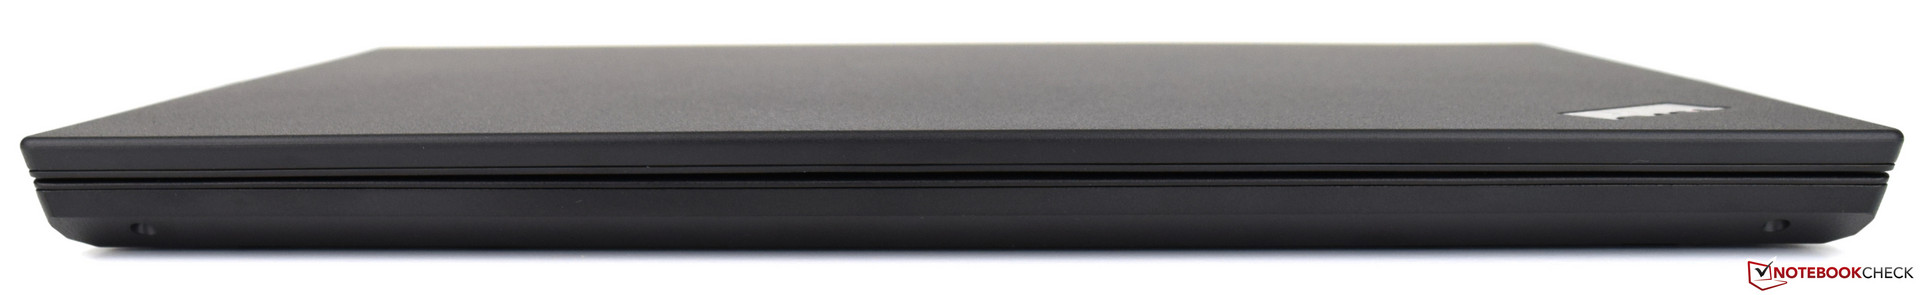
O Lenovo ThinkPad L480 é a definição de um portátil empresarial de 14 polegadas. Em nossa configuração, o dispositivo oferece um processador rápido, mas eficiente. O Intel Core i5-8250U oferece desempenho suficiente para a maioria das tarefas de escritório e deve estar preparado para o futuro devido ao seu desempenho. Os 8 GB de memória e o SSD de 256 GB também são bem dimensionados. O chassi fino e estável, e o painel IPS completam este pacote.
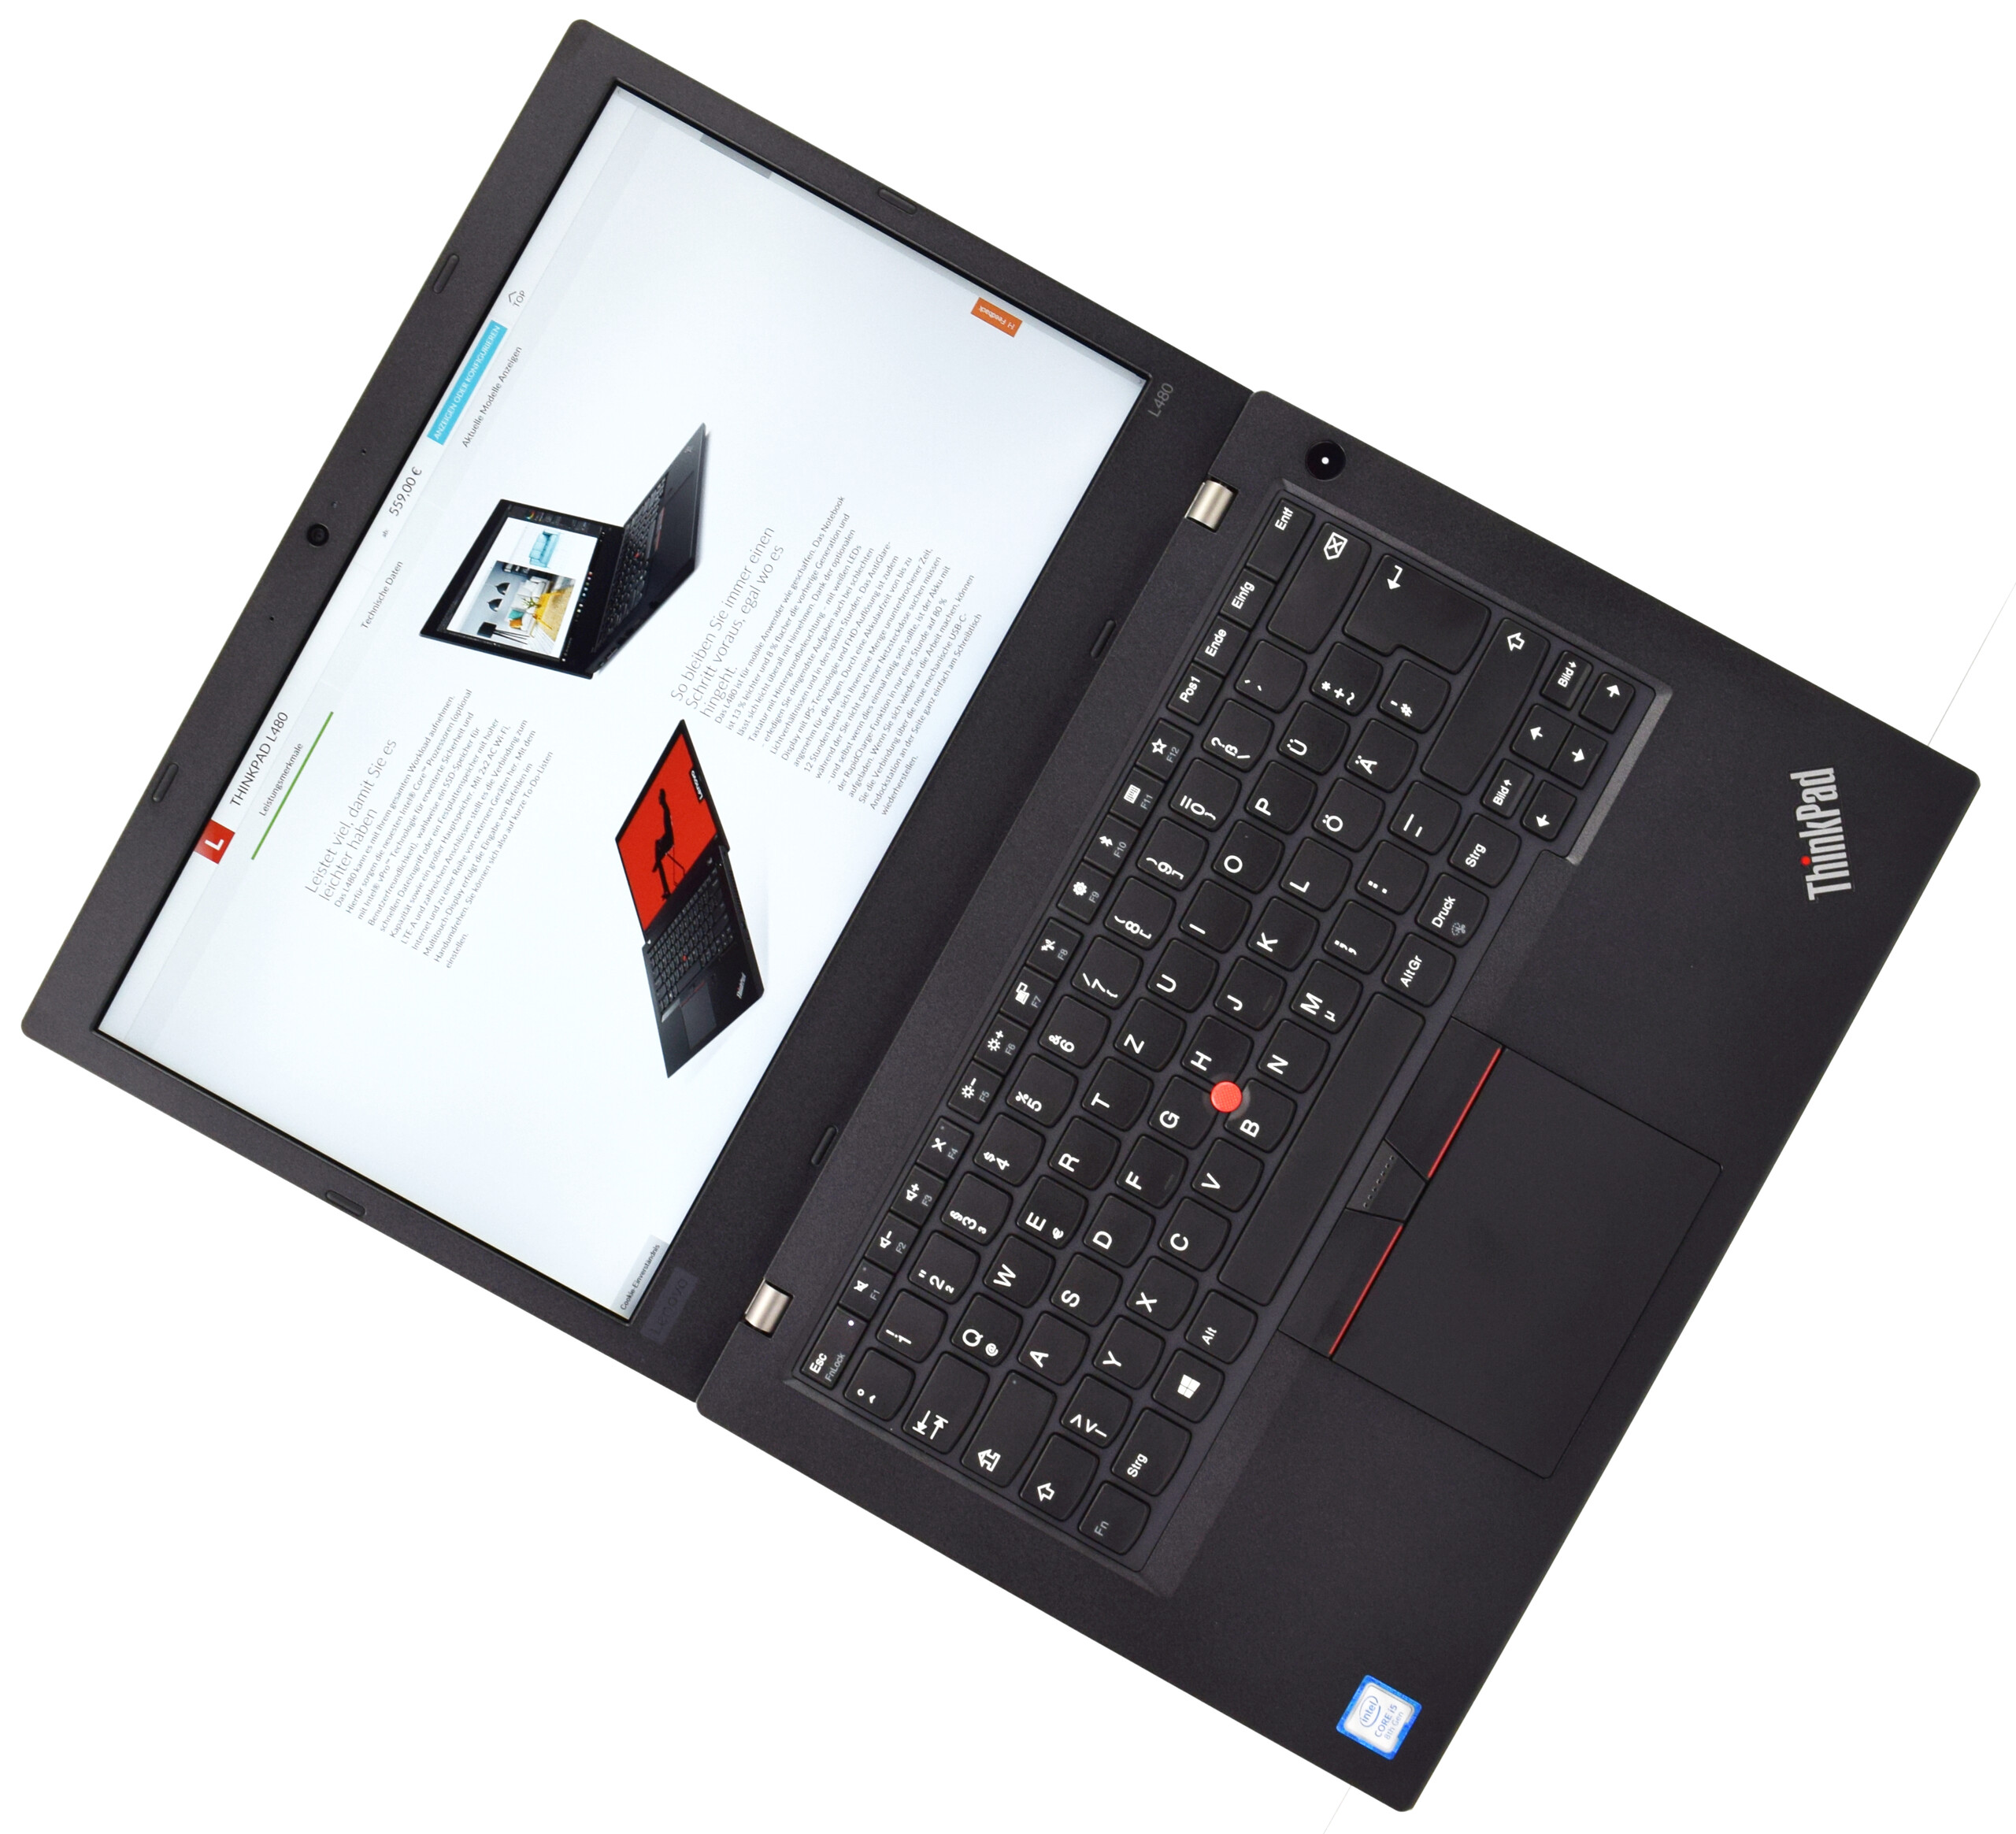
Por menos de 1.000 Euros (~$1230), os clientes recebem um portátil de escritório bem equipado com os excelentes dispositivos de entrada pelo qual o ThinkPad é conhecido. A variedade de configurações também permite ajustar perfeitamente o companheiro de negócios.
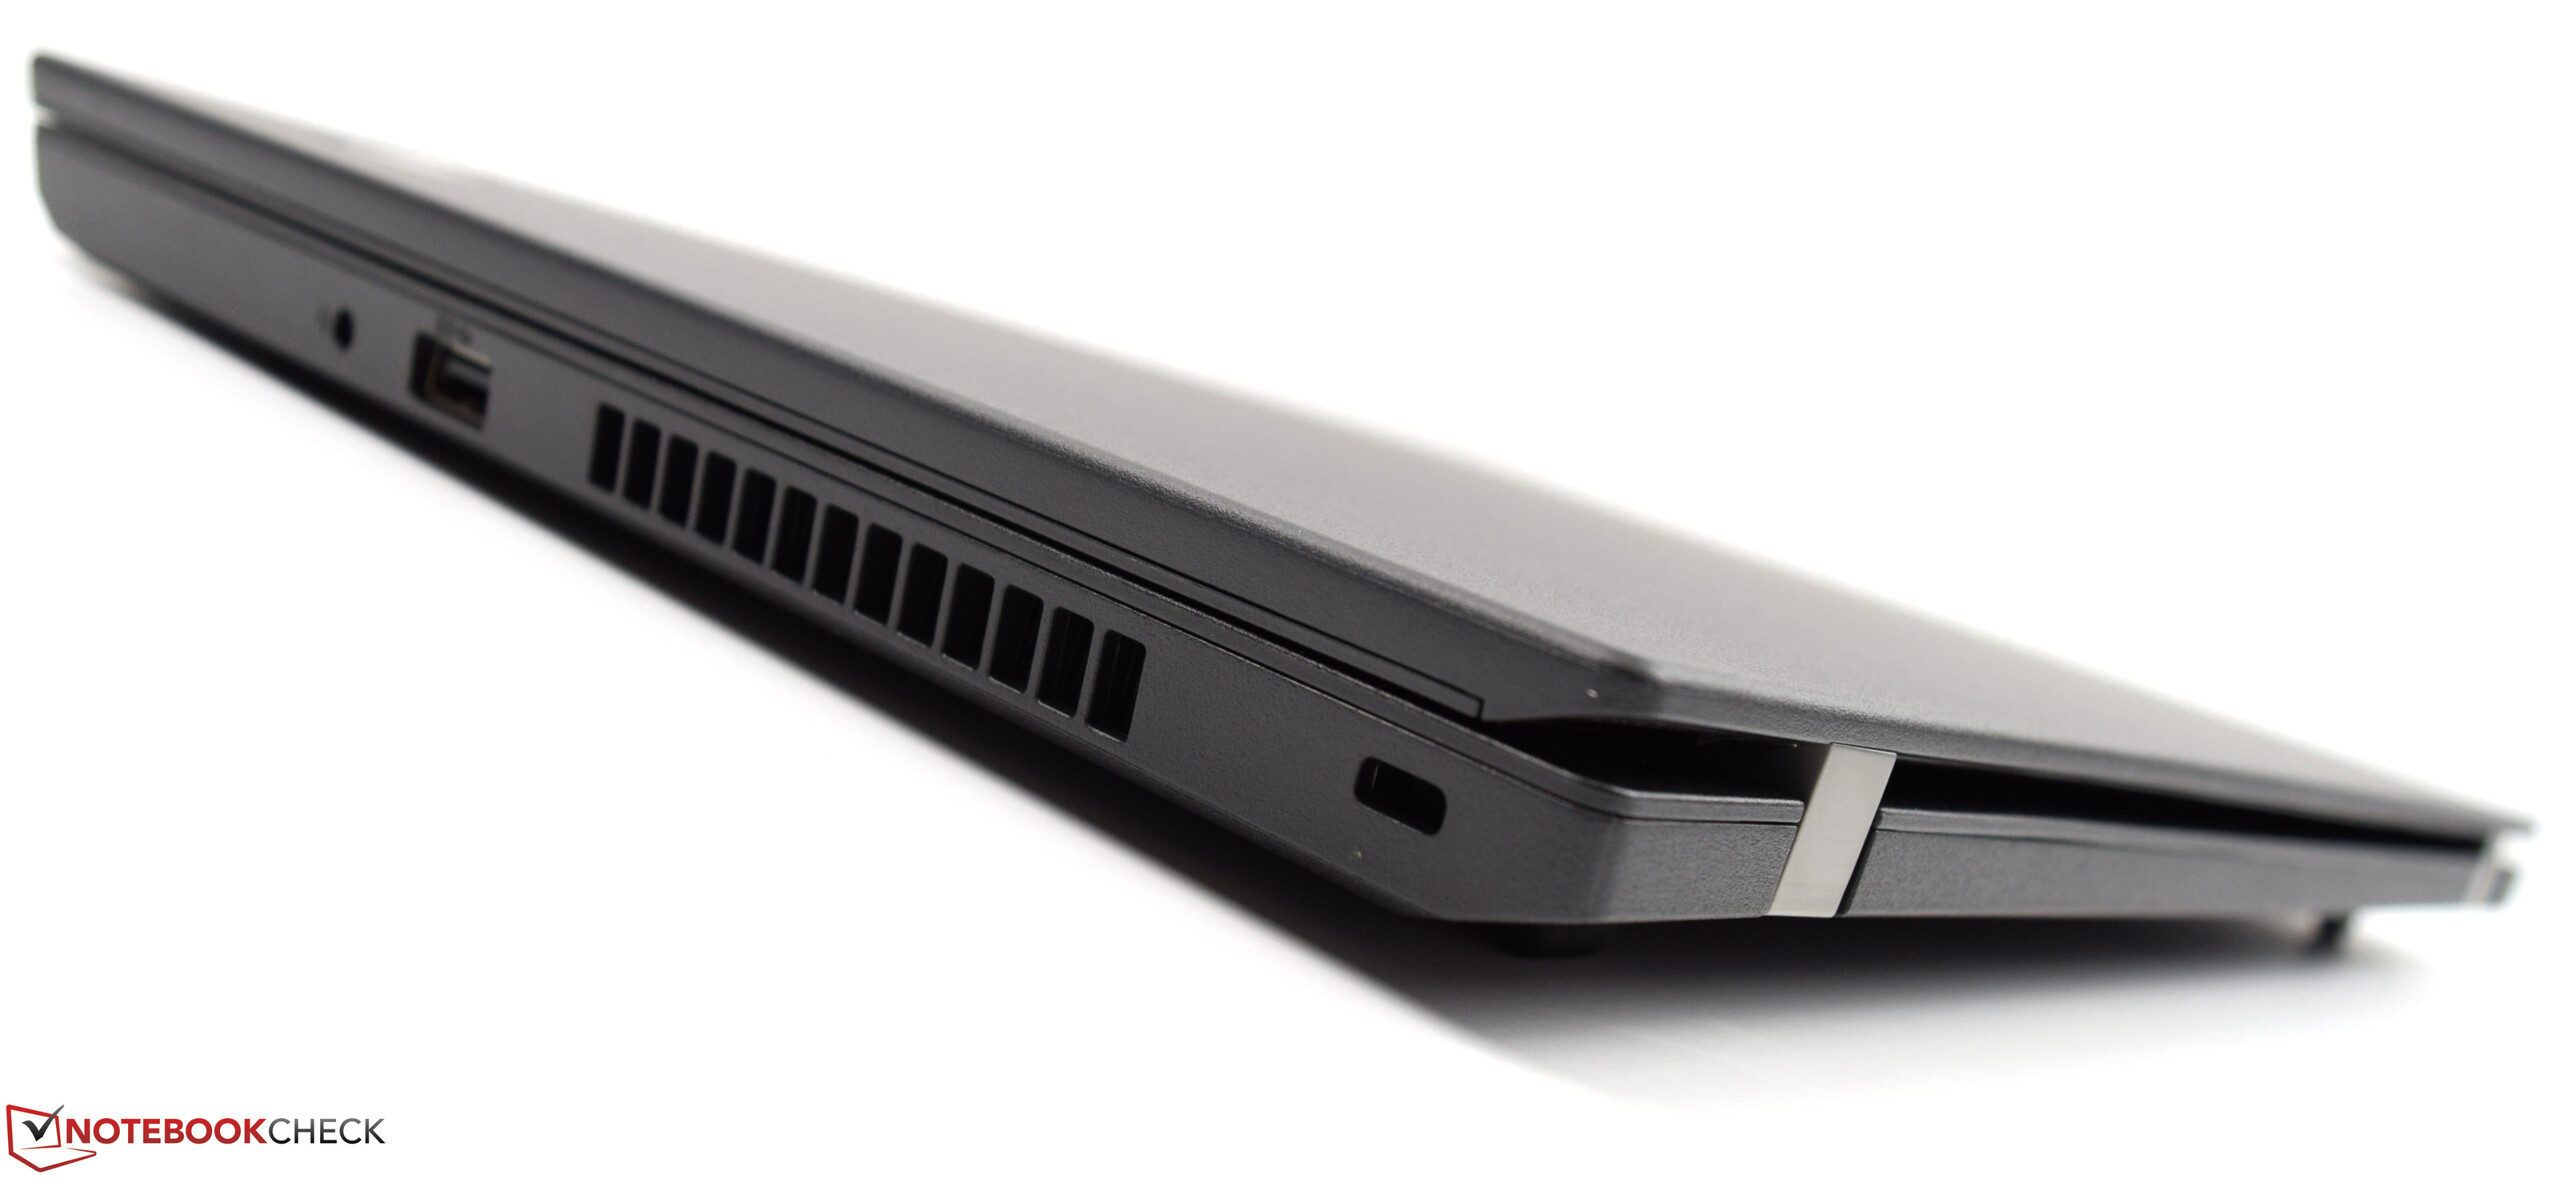
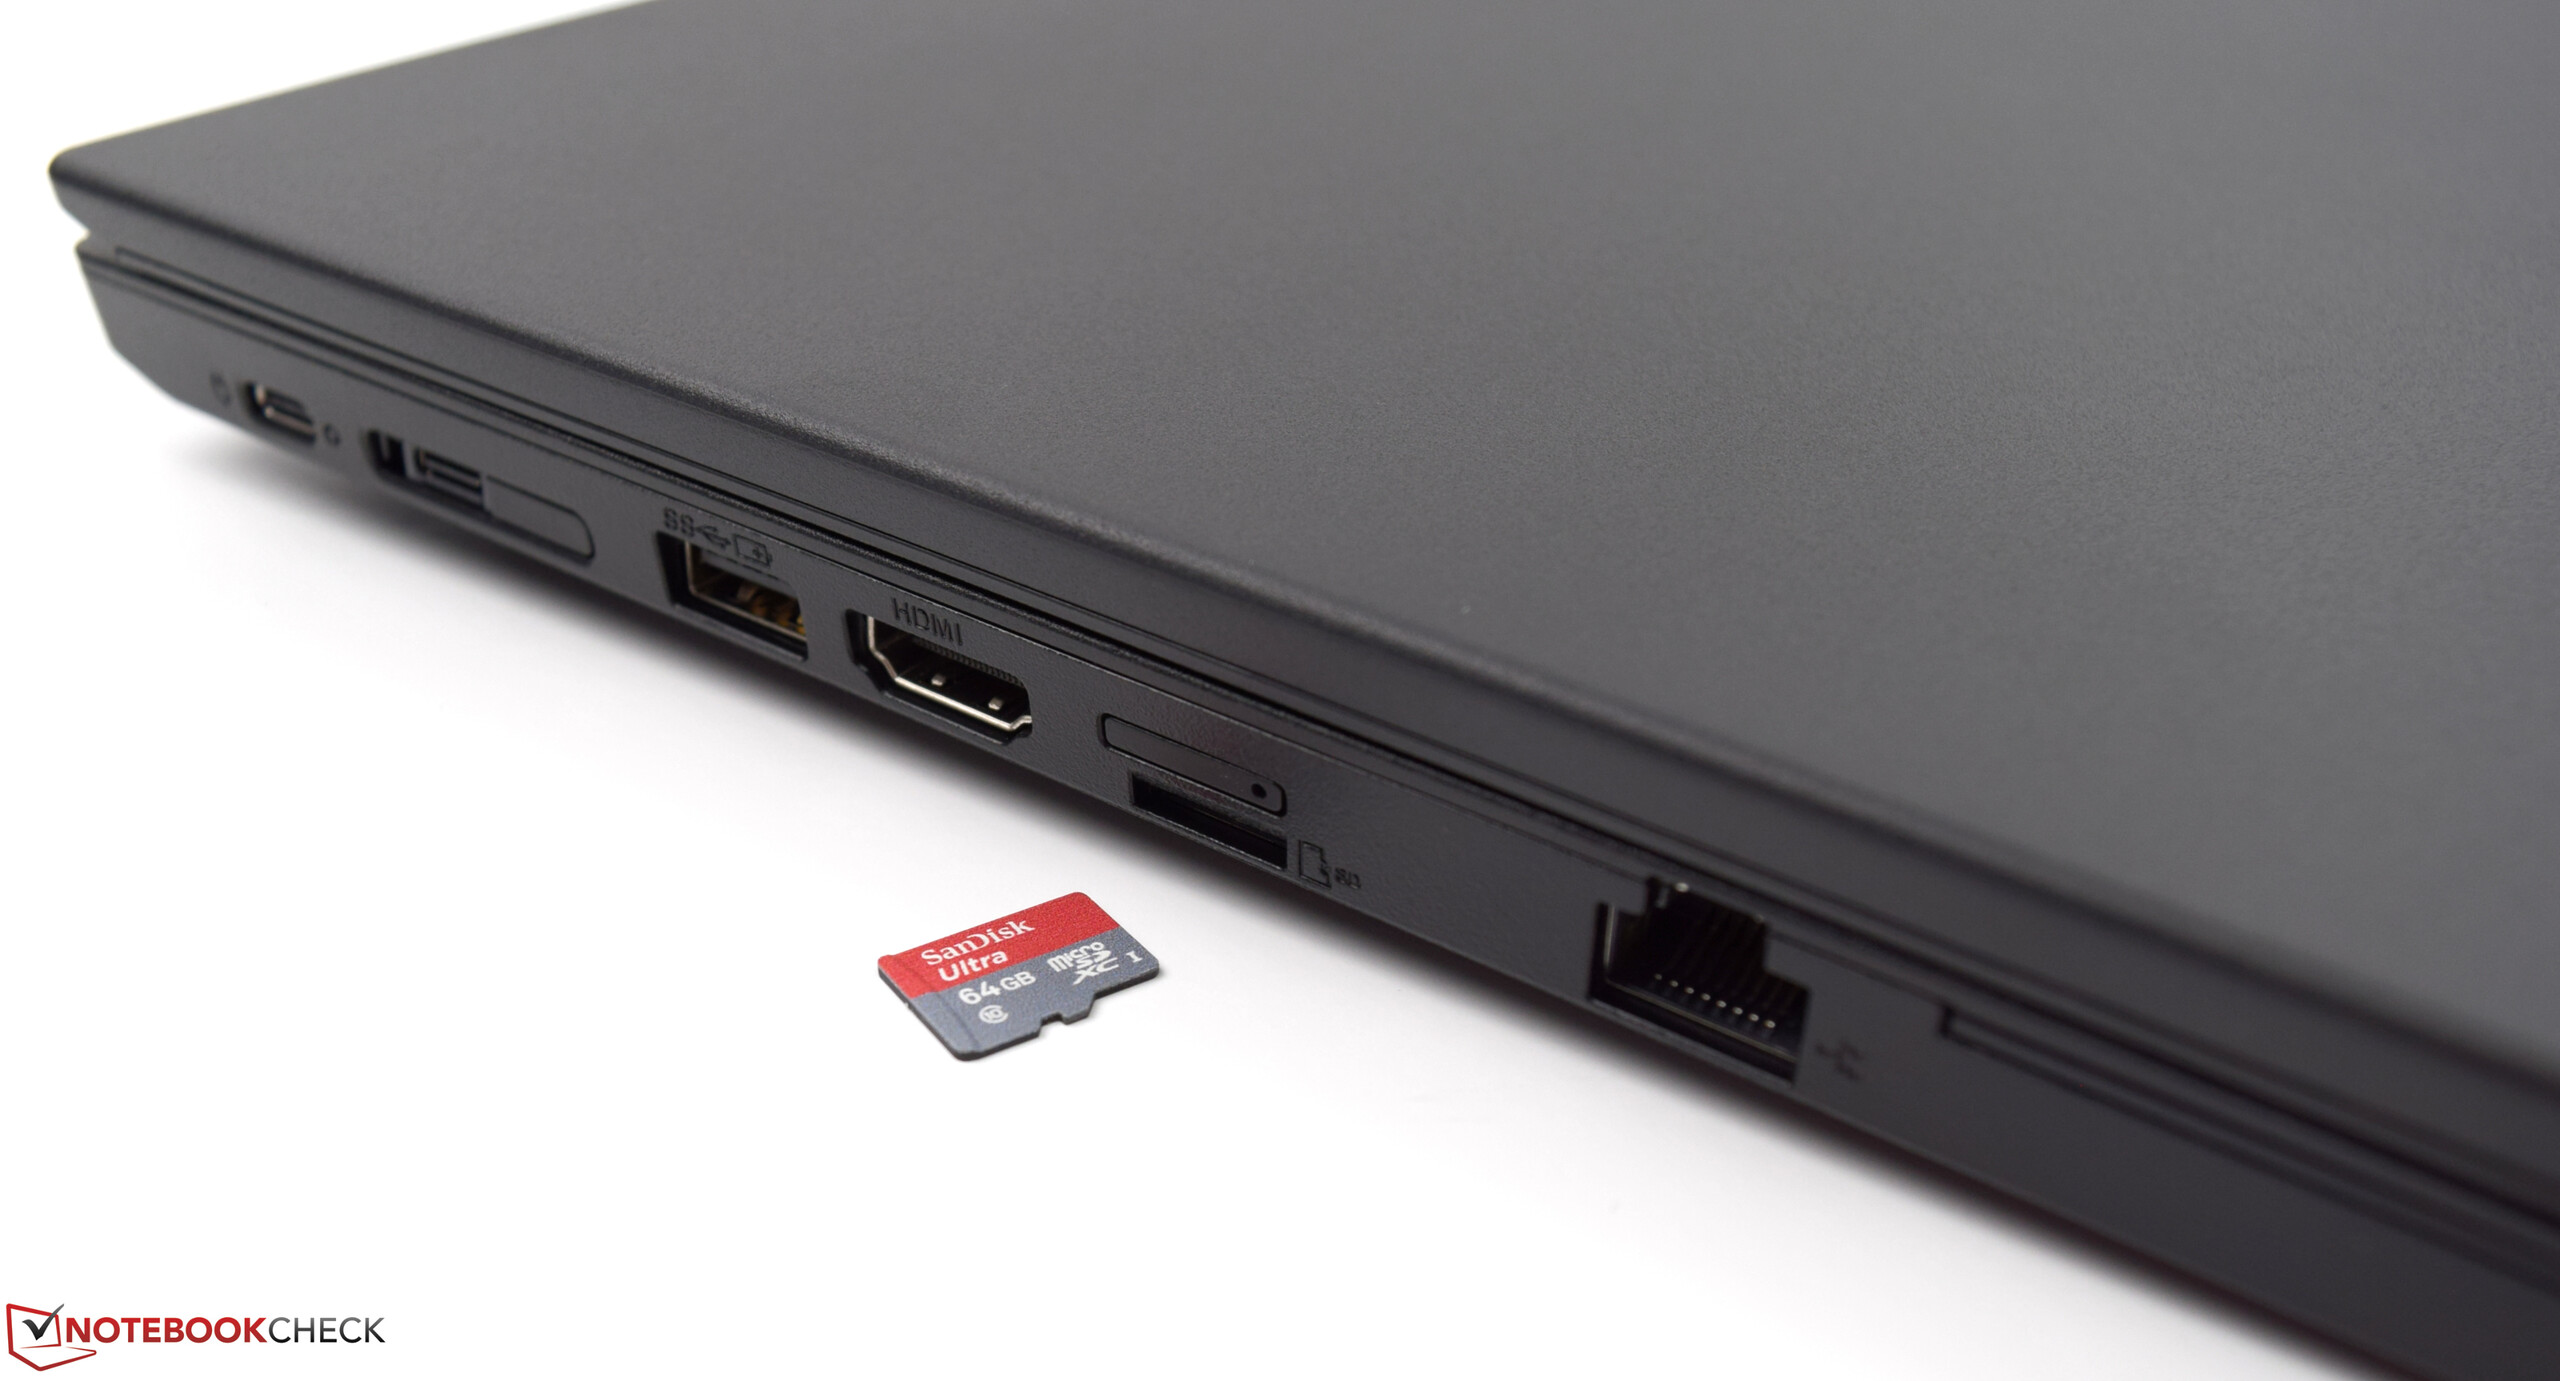
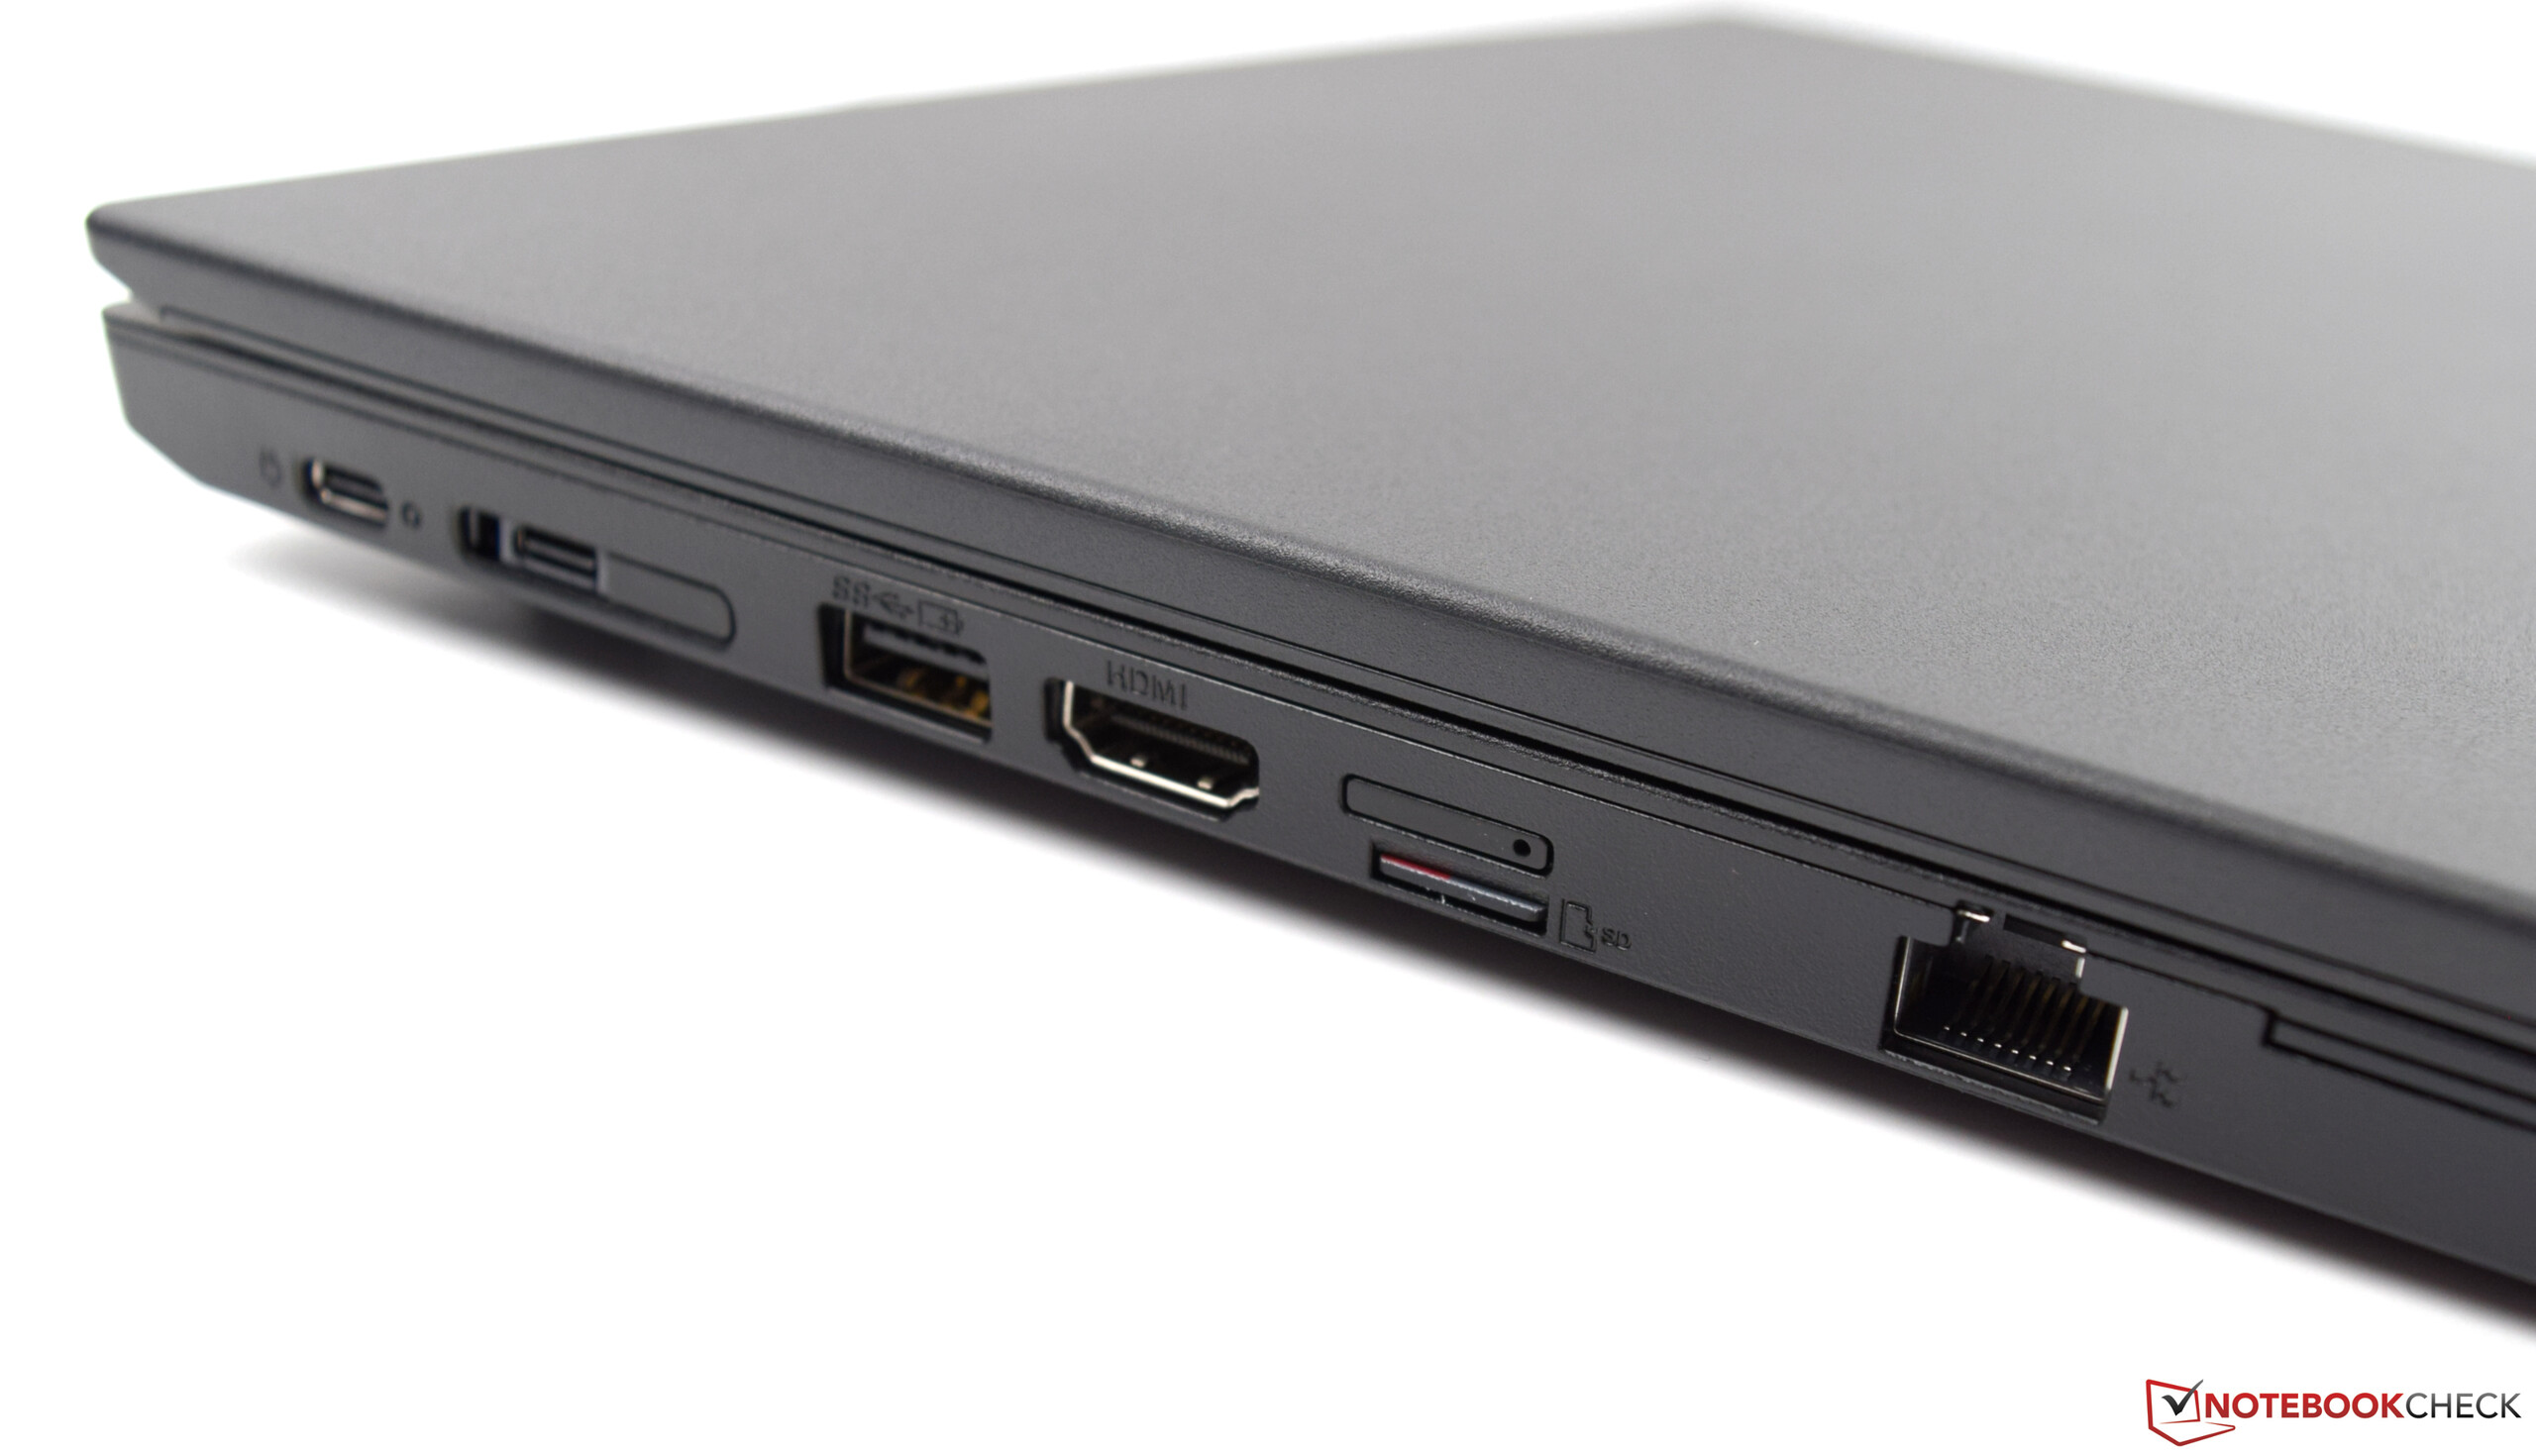
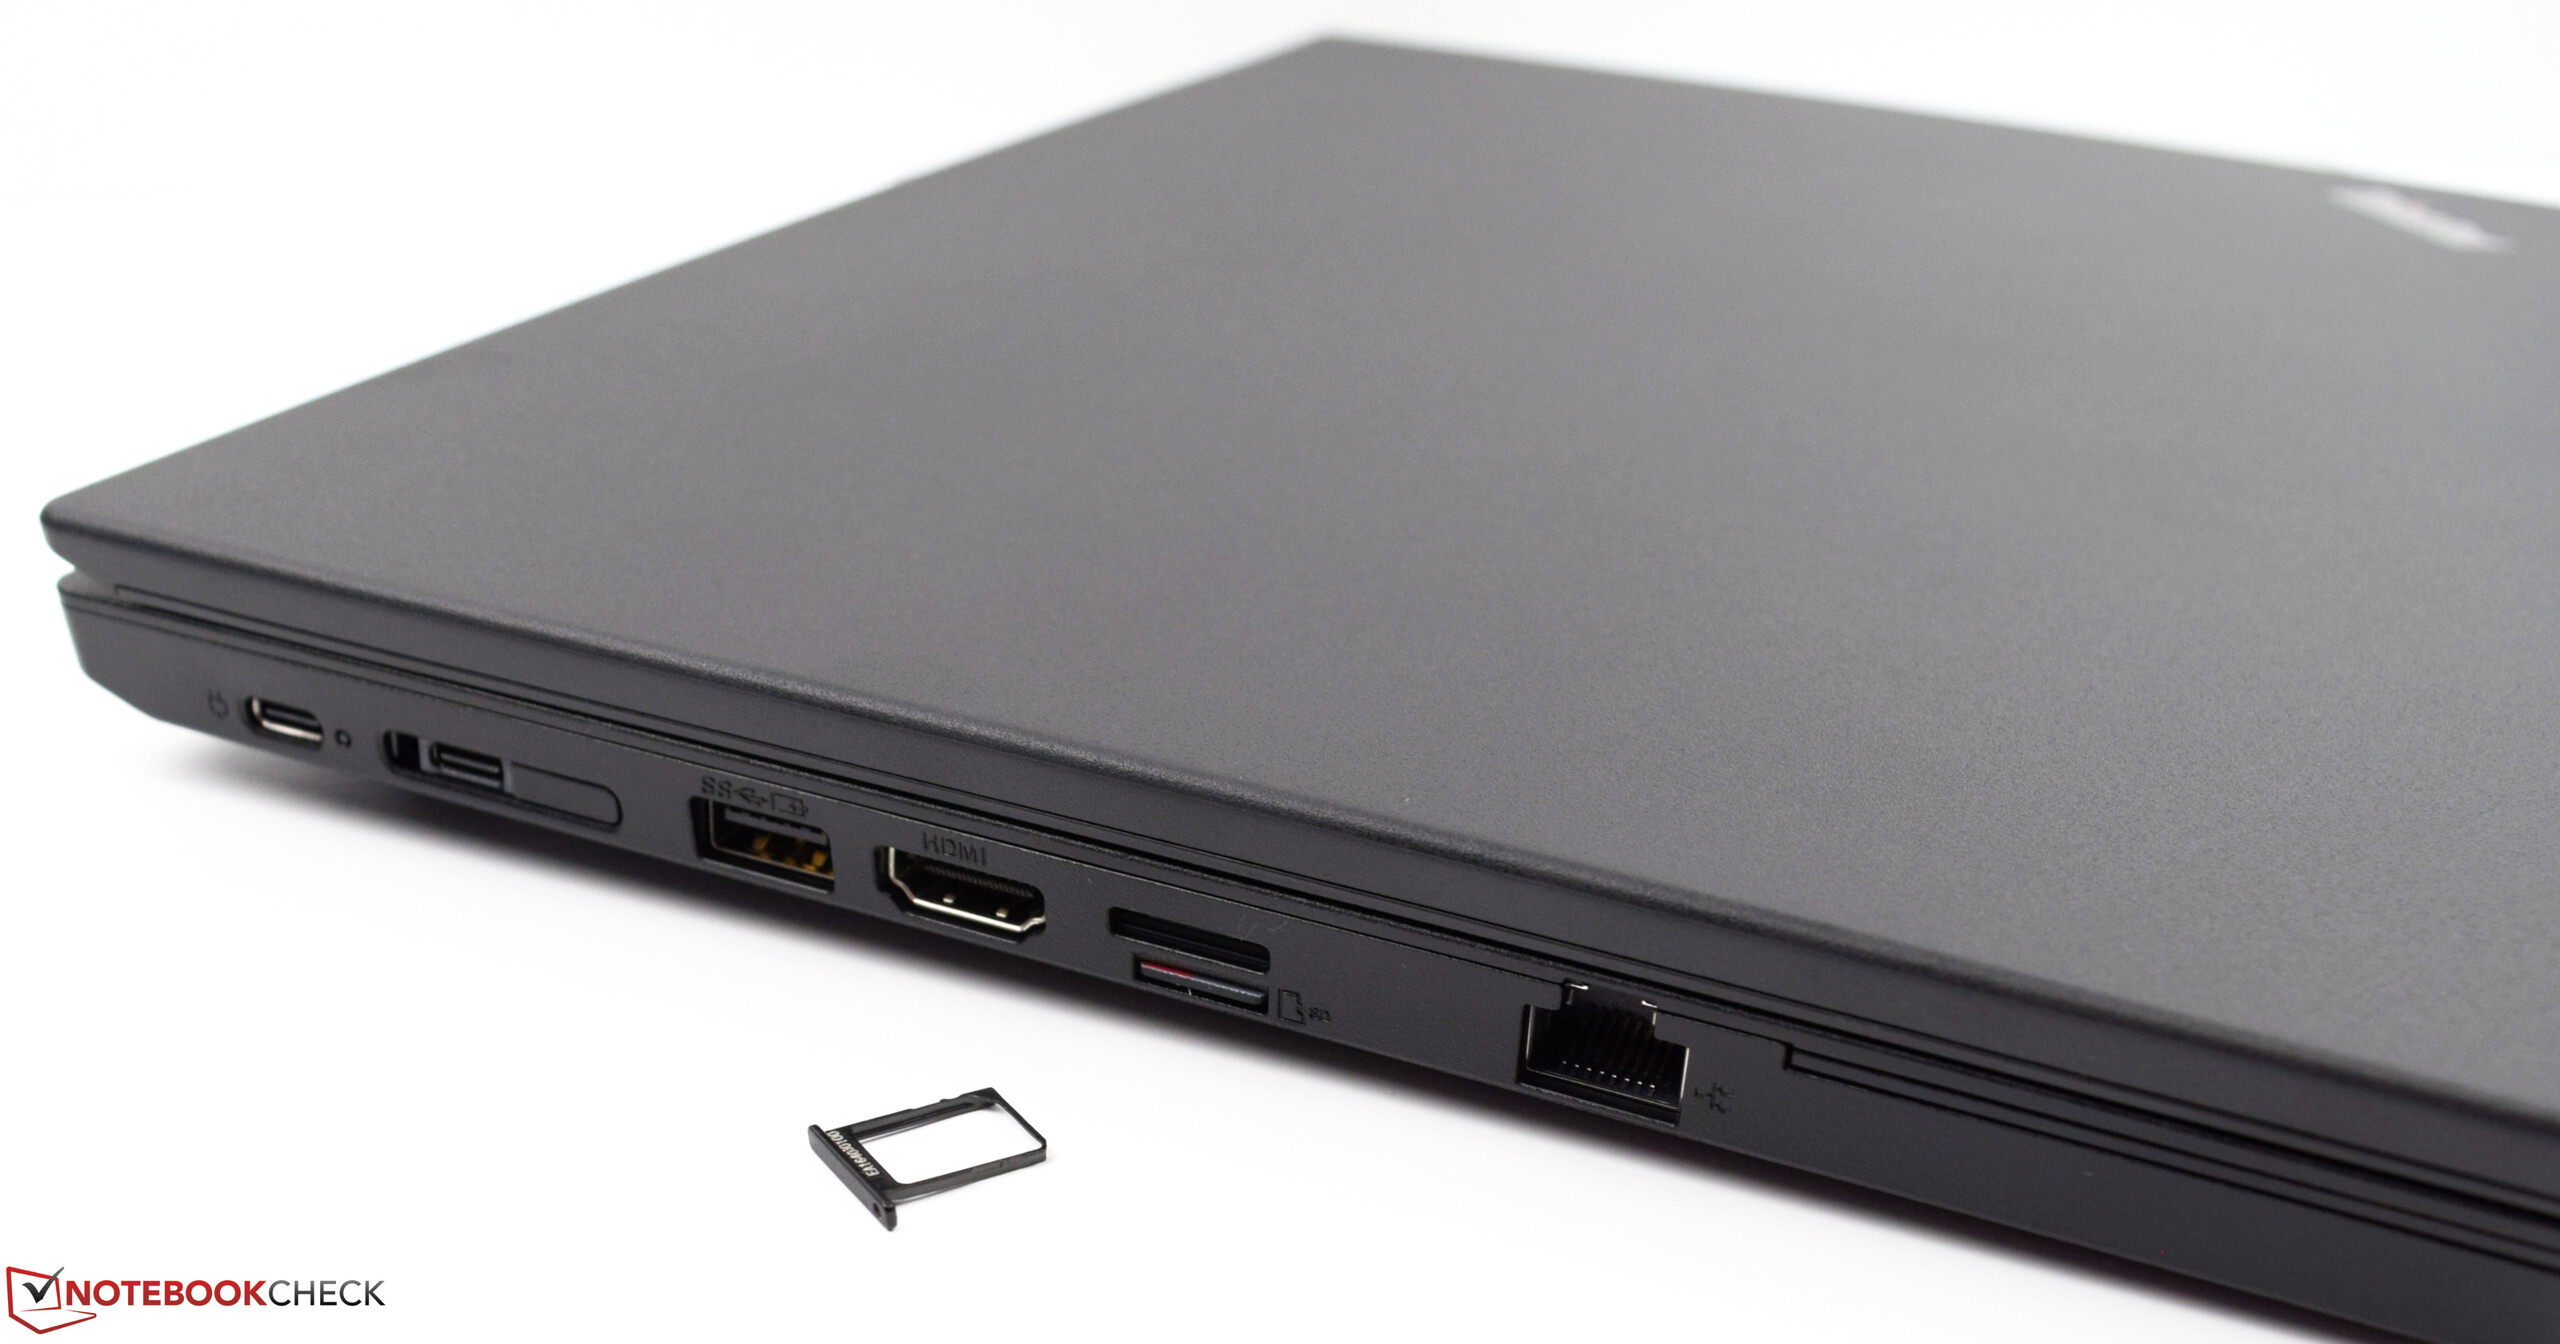
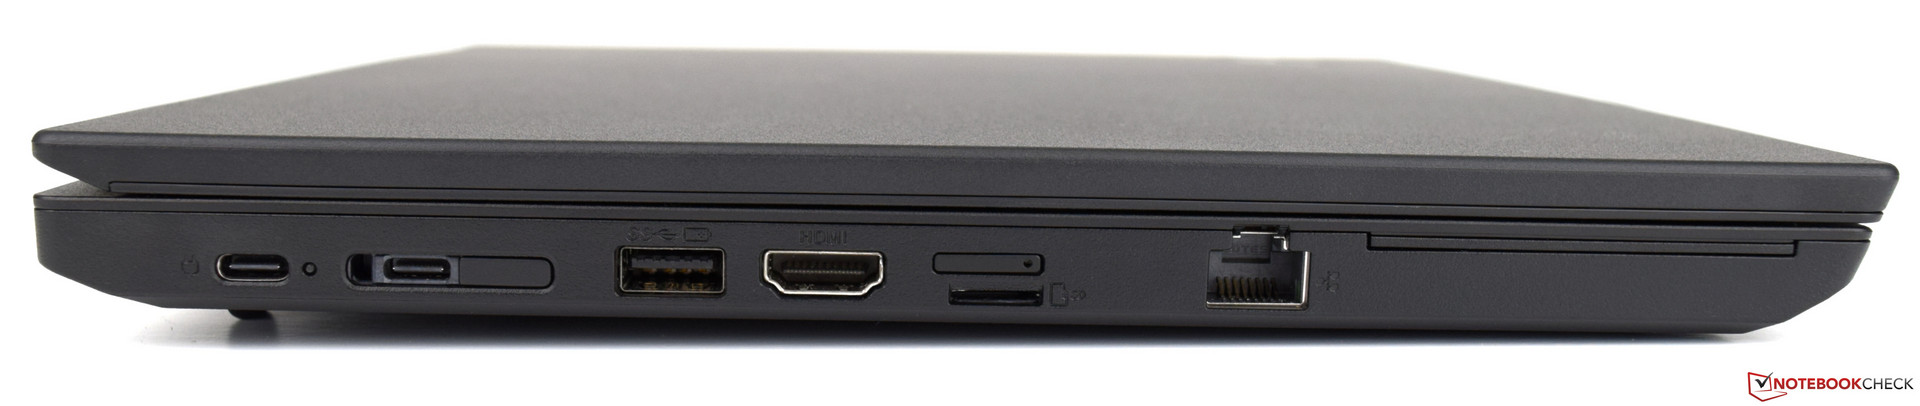
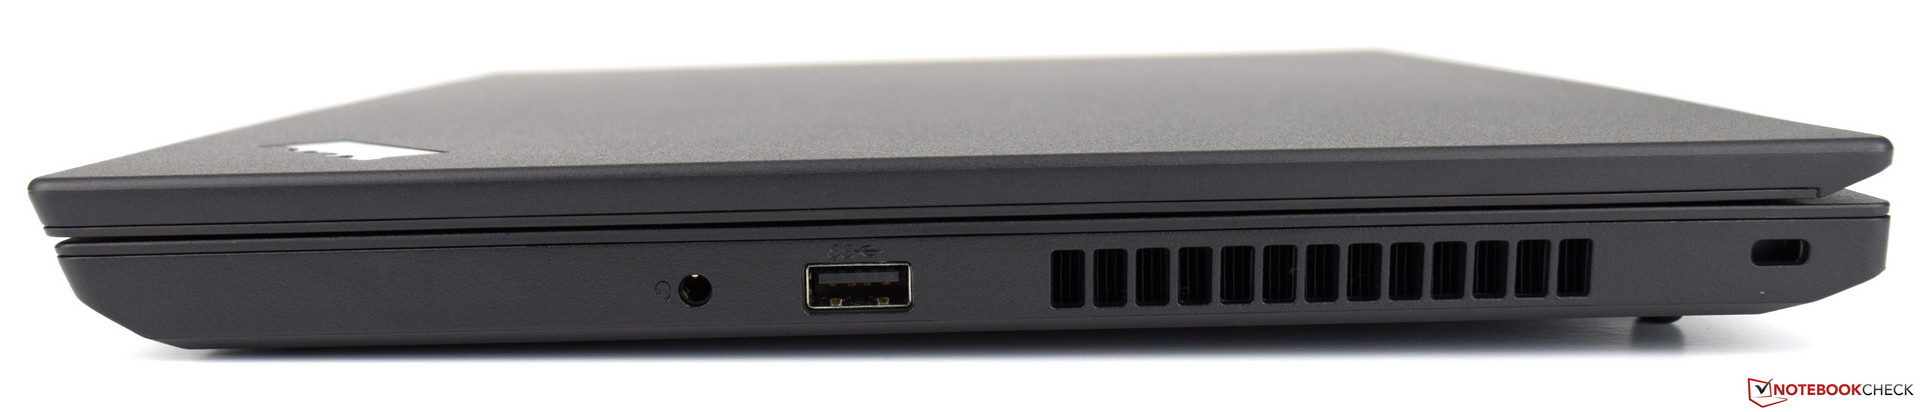
A tela, no entanto, nos deixa com sentimentos contraditórios. Ter um painel IPS é bom, mas o brilho que ele oferece, não é. Os usuários terão que fazer concessões quando trabalharem em exteriores. Além disso, a duração da bateria não é um ponto forte em comparação com a concorrência. No entanto, o desempenho e a grande quantidade de portas utilizáveis, são bons. A mudança de um leitor de cartões SD para um slot para cartões microSD também é digna de ser mencionada.
Lenovo ThinkPad L480-20LS001AGE
- 03/13/2018 v6 (old)
Sebastian Bade