Breve Análise do Portátil Acer TravelMate X3410 (i7, MX130, FHD)

| SD Card Reader | |
| average JPG Copy Test (av. of 3 runs) | |
| Dell Latitude 7490 (Toshiba Exceria Pro M501 UHS-II) | |
| Lenovo ThinkPad T480-20L6S01V00 (Toshiba Exceria Pro SDXC 64 GB UHS-II) | |
| Lenovo ThinkPad T480s-20L8S02E00 (Toshiba Exceria Pro SDXC 64 GB UHS-II) | |
| Média da turma Office (19.8 - 198.5, n=22, últimos 2 anos) | |
| Acer TravelMate X3410-M-50DD (Toshiba Exceria Pro SDXC 64 GB UHS-II) | |
| maximum AS SSD Seq Read Test (1GB) | |
| Dell Latitude 7490 (Toshiba Exceria Pro M501 UHS-II) | |
| Lenovo ThinkPad T480s-20L8S02E00 (Toshiba Exceria Pro SDXC 64 GB UHS-II) | |
| Lenovo ThinkPad T480-20L6S01V00 (Toshiba Exceria Pro SDXC 64 GB UHS-II) | |
| Média da turma Office (27.4 - 249, n=21, últimos 2 anos) | |
| Acer TravelMate X3410-M-50DD (Toshiba Exceria Pro SDXC 64 GB UHS-II) | |
| |||||||||||||||||||||||||
iluminação: 72 %
iluminação com acumulador: 255 cd/m²
Contraste: 3188:1 (Preto: 0.08 cd/m²)
ΔE ColorChecker Calman: 5.01 | ∀{0.5-29.43 Ø4.71}
calibrated: 4.06
ΔE Greyscale Calman: 3 | ∀{0.09-98 Ø4.96}
63% sRGB (Argyll 1.6.3 3D)
40% AdobeRGB 1998 (Argyll 1.6.3 3D)
43.37% AdobeRGB 1998 (Argyll 3D)
63% sRGB (Argyll 3D)
41.96% Display P3 (Argyll 3D)
Gamma: 2.26
CCT: 6185 K
| Acer TravelMate X3410-M-50DD N140HCA-EAC, , 1920x1080, 14" | Lenovo ThinkPad T480-20L6S01V00 Lenovo LP140WF6-SPB7, , 1920x1080, 14" | HP EliteBook 840 G5-3JX66EA AUO3B3D, , 1920x1080, 14" | Dell Latitude 7490 AUO503D (D04YD_B140HAN), , 1920x1080, 14" | |
|---|---|---|---|---|
| Display | -6% | 41% | 57% | |
| Display P3 Coverage (%) | 41.96 | 39.24 -6% | 60.2 43% | 66.6 59% |
| sRGB Coverage (%) | 63 | 58.8 -7% | 88.2 40% | 96.8 54% |
| AdobeRGB 1998 Coverage (%) | 43.37 | 40.56 -6% | 61.3 41% | 67.9 57% |
| Response Times | 16% | -3% | -3% | |
| Response Time Grey 50% / Grey 80% * (ms) | 42 ? | 35.6 ? 15% | 42.4 ? -1% | 41.6 ? 1% |
| Response Time Black / White * (ms) | 30 ? | 24.8 ? 17% | 31.6 ? -5% | 32 ? -7% |
| PWM Frequency (Hz) | 24500 ? | |||
| Screen | -26% | -5% | -11% | |
| Brightness middle (cd/m²) | 255 | 307 20% | 414 62% | 308.6 21% |
| Brightness (cd/m²) | 218 | 295 35% | 387 78% | 294 35% |
| Brightness Distribution (%) | 72 | 90 25% | 87 21% | 89 24% |
| Black Level * (cd/m²) | 0.08 | 0.25 -213% | 0.25 -213% | 0.23 -188% |
| Contrast (:1) | 3188 | 1228 -61% | 1656 -48% | 1342 -58% |
| Colorchecker dE 2000 * | 5.01 | 5.7 -14% | 5.5 -10% | 6.07 -21% |
| Colorchecker dE 2000 max. * | 17.44 | 21.3 -22% | 9.9 43% | 10.58 39% |
| Colorchecker dE 2000 calibrated * | 4.06 | 4.7 -16% | 2.3 43% | 1.67 59% |
| Greyscale dE 2000 * | 3 | 3.7 -23% | 6.4 -113% | 7.3 -143% |
| Gamma | 2.26 97% | 2.11 104% | 2.31 95% | 2.061 107% |
| CCT | 6185 105% | 7353 88% | 7811 83% | 7269 89% |
| Color Space (Percent of AdobeRGB 1998) (%) | 40 | 37.4 -6% | 56.9 42% | 62 55% |
| Color Space (Percent of sRGB) (%) | 63 | 58.7 -7% | 88.1 40% | 97 54% |
| Média Total (Programa/Configurações) | -5% /
-17% | 11% /
4% | 14% /
3% |
* ... menor é melhor
Exibir tempos de resposta
| ↔ Tempo de resposta preto para branco | ||
|---|---|---|
| 30 ms ... ascensão ↗ e queda ↘ combinadas | ↗ 17 ms ascensão | 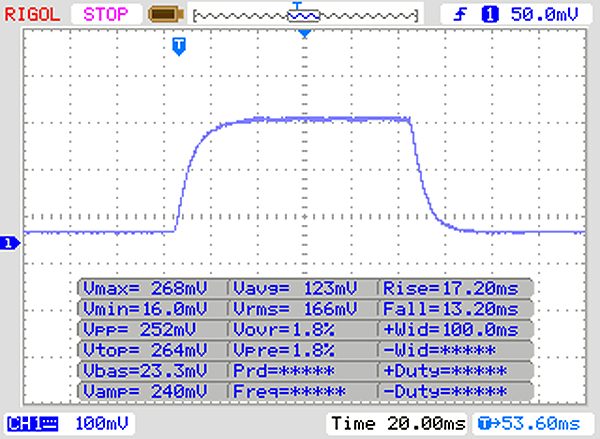 |
| ↘ 13 ms queda | ||
| A tela mostra taxas de resposta lentas em nossos testes e será insatisfatória para os jogadores. Em comparação, todos os dispositivos testados variam de 0.1 (mínimo) a 240 (máximo) ms. » 80 % de todos os dispositivos são melhores. Isso significa que o tempo de resposta medido é pior que a média de todos os dispositivos testados (19.8 ms). | ||
| ↔ Tempo de resposta 50% cinza a 80% cinza | ||
| 42 ms ... ascensão ↗ e queda ↘ combinadas | ↗ 22 ms ascensão | 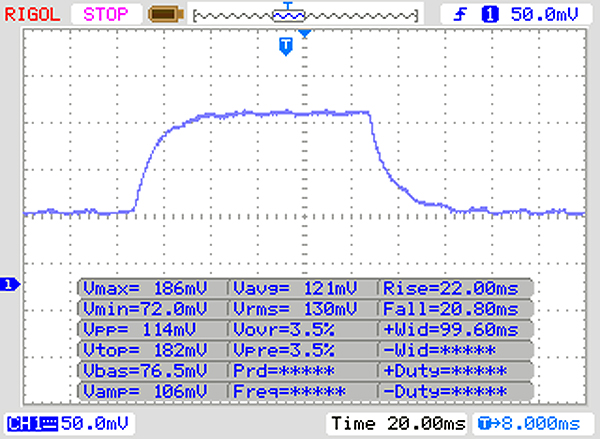 |
| ↘ 20 ms queda | ||
| A tela mostra taxas de resposta lentas em nossos testes e será insatisfatória para os jogadores. Em comparação, todos os dispositivos testados variam de 0.165 (mínimo) a 636 (máximo) ms. » 67 % de todos os dispositivos são melhores. Isso significa que o tempo de resposta medido é pior que a média de todos os dispositivos testados (30.9 ms). | ||
Cintilação da tela / PWM (modulação por largura de pulso)
| Tela tremeluzindo/PWM detectado | 24500 Hz | ≤ 20 % configuração de brilho | 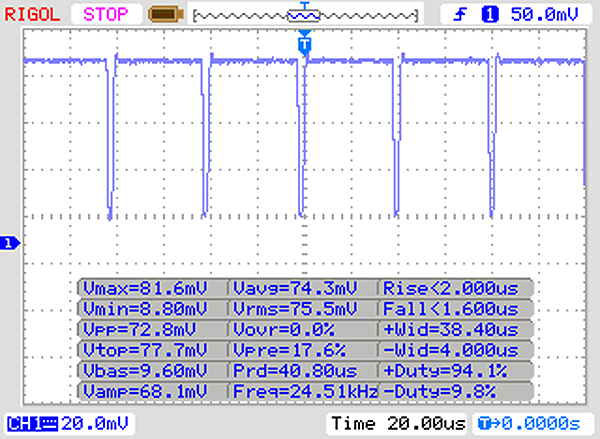 |
A luz de fundo da tela pisca em 24500 Hz (pior caso, por exemplo, utilizando PWM) Cintilação detectada em uma configuração de brilho de 20 % e abaixo. Não deve haver cintilação ou PWM acima desta configuração de brilho. A frequência de 24500 Hz é bastante alta, então a maioria dos usuários sensíveis ao PWM não deve notar nenhuma oscilação. [pwm_comparison] Em comparação: 52 % de todos os dispositivos testados não usam PWM para escurecer a tela. Se PWM foi detectado, uma média de 7741 (mínimo: 5 - máximo: 343500) Hz foi medida. | |||
| PCMark 8 Home Score Accelerated v2 | 3578 pontos | |
| PCMark 8 Work Score Accelerated v2 | 5030 pontos | |
| PCMark 10 Score | 3565 pontos | |
Ajuda | ||
| Acer TravelMate X3410-M-50DD Micron 1100 MTFDDAV256TBN | Lenovo ThinkPad T480-20L6S01V00 Samsung SSD PM981 MZVLB512HAJQ | Dell Latitude 7490 Toshiba KSG60ZMV256G | HP EliteBook 840 G5-3JX61EA Toshiba KXG50ZNV1T02 | Média Micron 1100 MTFDDAV256TBN | |
|---|---|---|---|---|---|
| CrystalDiskMark 5.2 / 6 | 140% | -5% | 161% | 1% | |
| Write 4K (MB/s) | 85.4 | 153.1 79% | 79.4 -7% | 96.1 13% | 82.2 ? -4% |
| Read 4K (MB/s) | 26.4 | 48.3 83% | 27.37 4% | 31.12 18% | 24.7 ? -6% |
| Write Seq (MB/s) | 402.5 | 866 115% | 343.9 -15% | 919 128% | 376 ? -7% |
| Read Seq (MB/s) | 461.2 | 904 96% | 472.7 2% | 2089 353% | 465 ? 1% |
| Write 4K Q32T1 (MB/s) | 175.8 | 424.6 142% | 206 17% | 425.6 142% | 215 ? 22% |
| Read 4K Q32T1 (MB/s) | 228.8 | 403.2 76% | 188.3 -18% | 275.3 20% | 228 ? 0% |
| Write Seq Q32T1 (MB/s) | 442.9 | 1725 289% | 343.3 -22% | 958 116% | 458 ? 3% |
| Read Seq Q32T1 (MB/s) | 522 | 1780 241% | 533 2% | 3118 497% | 525 ? 1% |
| Write 4K Q8T8 (MB/s) | 309 | 307 ? -1% | |||
| Read 4K Q8T8 (MB/s) | 247.1 | 247 ? 0% |

| 3DMark 11 Performance | 3377 pontos | |
| 3DMark Cloud Gate Standard Score | 8821 pontos | |
| 3DMark Fire Strike Score | 2231 pontos | |
Ajuda | ||
| BioShock Infinite - 1366x768 Medium Preset | |
| Acer TravelMate X3410-M-50DD | |
| Média NVIDIA GeForce MX130 (57.3 - 84.5, n=10) | |
| Dell Latitude 7490 | |
| HP EliteBook 840 G5-3JX66EA | |
| baixo | média | alto | ultra | |
|---|---|---|---|---|
| BioShock Infinite (2013) | 138.1 | 80.2 | 68.8 | 24.86 |
| The Witcher 3 (2015) | 47.3 | 28.2 | 15.3 | |
| Civilization 6 (2016) | 69.7 | 36.7 | 15.8 |
Barulho
| Ocioso |
| 30.2 / 30.2 / 30.2 dB |
| Carga |
| 36.8 / 36.8 dB |
 | ||
30 dB silencioso 40 dB(A) audível 50 dB(A) ruidosamente alto |
||
min: | ||
(-) A temperatura máxima no lado superior é 48.4 °C / 119 F, em comparação com a média de 34.3 °C / 94 F , variando de 21.2 a 62.5 °C para a classe Office.
(±) A parte inferior aquece até um máximo de 45 °C / 113 F, em comparação com a média de 36.8 °C / 98 F
(+) Em uso inativo, a temperatura média para o lado superior é 25.8 °C / 78 F, em comparação com a média do dispositivo de 29.5 °C / ### class_avg_f### F.
(+) Os apoios para as mãos e o touchpad são mais frios que a temperatura da pele, com um máximo de 27.7 °C / 81.9 F e, portanto, são frios ao toque.
(±) A temperatura média da área do apoio para as mãos de dispositivos semelhantes foi 27.6 °C / 81.7 F (-0.1 °C / -0.2 F).
Acer TravelMate X3410-M-50DD análise de áudio
(-) | alto-falantes não muito altos (###valor### dB)
Graves 100 - 315Hz
(±) | graves reduzidos - em média 10% menor que a mediana
(±) | a linearidade dos graves é média (8% delta para a frequência anterior)
Médios 400 - 2.000 Hz
(±) | médios mais altos - em média 5.3% maior que a mediana
(±) | a linearidade dos médios é média (9.3% delta para frequência anterior)
Altos 2 - 16 kHz
(+) | agudos equilibrados - apenas 1.2% longe da mediana
(+) | os máximos são lineares (6.5% delta da frequência anterior)
Geral 100 - 16.000 Hz
(±) | a linearidade do som geral é média (19.5% diferença em relação à mediana)
Comparado com a mesma classe
» 40% de todos os dispositivos testados nesta classe foram melhores, 7% semelhantes, 52% piores
» O melhor teve um delta de 7%, a média foi 21%, o pior foi 53%
Comparado com todos os dispositivos testados
» 49% de todos os dispositivos testados foram melhores, 7% semelhantes, 44% piores
» O melhor teve um delta de 4%, a média foi 23%, o pior foi 134%
HP EliteBook 840 G5-3JX66EA análise de áudio
(+) | os alto-falantes podem tocar relativamente alto (###valor### dB)
Graves 100 - 315Hz
(-) | quase nenhum baixo - em média 24.7% menor que a mediana
(±) | a linearidade dos graves é média (10.1% delta para a frequência anterior)
Médios 400 - 2.000 Hz
(+) | médios equilibrados - apenas 3.3% longe da mediana
(+) | médios são lineares (4.9% delta para frequência anterior)
Altos 2 - 16 kHz
(±) | máximos mais altos - em média 7.1% maior que a mediana
(+) | os máximos são lineares (4.3% delta da frequência anterior)
Geral 100 - 16.000 Hz
(±) | a linearidade do som geral é média (20.6% diferença em relação à mediana)
Comparado com a mesma classe
» 48% de todos os dispositivos testados nesta classe foram melhores, 9% semelhantes, 43% piores
» O melhor teve um delta de 7%, a média foi 21%, o pior foi 53%
Comparado com todos os dispositivos testados
» 55% de todos os dispositivos testados foram melhores, 8% semelhantes, 37% piores
» O melhor teve um delta de 4%, a média foi 23%, o pior foi 134%
| desligado | |
| Ocioso | |
| Carga |
|
Key:
min: | |
| Acer TravelMate X3410-M-50DD i5-8550U, GeForce MX130, Micron 1100 MTFDDAV256TBN, IPS LED, 1920x1080, 14" | Lenovo ThinkPad T480-20L6S01V00 i5-8550U, GeForce MX150, Samsung SSD PM981 MZVLB512HAJQ, IPS, 1920x1080, 14" | Dell Latitude 7490 i5-8350U, UHD Graphics 620, Toshiba KSG60ZMV256G, IPS, 1920x1080, 14" | HP EliteBook 840 G5-3JX61EA i5-8550U, UHD Graphics 620, Toshiba KXG50ZNV1T02, IPS, 1920x1080, 14" | Média NVIDIA GeForce MX130 | Média da turma Office | |
|---|---|---|---|---|---|---|
| Power Consumption | -3% | 38% | 9% | -2% | 4% | |
| Idle Minimum * (Watt) | 4.6 | 3.6 22% | 2 57% | 3.8 17% | 4.54 ? 1% | 4.25 ? 8% |
| Idle Average * (Watt) | 6.5 | 7.1 -9% | 4.7 28% | 8.3 -28% | 6.98 ? -7% | 7.3 ? -12% |
| Idle Maximum * (Watt) | 8.5 | 9.5 -12% | 5.7 33% | 10.7 -26% | 9.08 ? -7% | 8.57 ? -1% |
| Load Average * (Watt) | 56 | 63.9 -14% | 38.4 31% | 35.5 37% | 54.1 ? 3% | 43.8 ? 22% |
| Load Maximum * (Watt) | 67 | 67.3 -0% | 38.9 42% | 37 45% | 66.4 ? 1% | 64.3 ? 4% |
| Witcher 3 ultra * (Watt) | 53.9 |
* ... menor é melhor
| Acer TravelMate X3410-M-50DD i5-8550U, GeForce MX130, 57 Wh | Lenovo ThinkPad T480-20L6S01V00 i5-8550U, GeForce MX150, 72 Wh | Dell Latitude 7490 i5-8350U, UHD Graphics 620, 60 Wh | HP EliteBook 840 G5-3JX61EA i5-8550U, UHD Graphics 620, 50 Wh | Média da turma Office | |
|---|---|---|---|---|---|
| Duração da bateria | 24% | -17% | -32% | 16% | |
| Reader / Idle (h) | 17.4 | 27.9 60% | 22.2 ? 28% | ||
| H.264 (h) | 11.6 | 10.6 -9% | 15.4 ? 33% | ||
| WiFi v1.3 (h) | 10.9 | 13.2 21% | 9.1 -17% | 7.4 -32% | 13.2 ? 21% |
| Load (h) | 2.2 | 2.7 23% | 1.808 ? -18% |
Pro
Contra
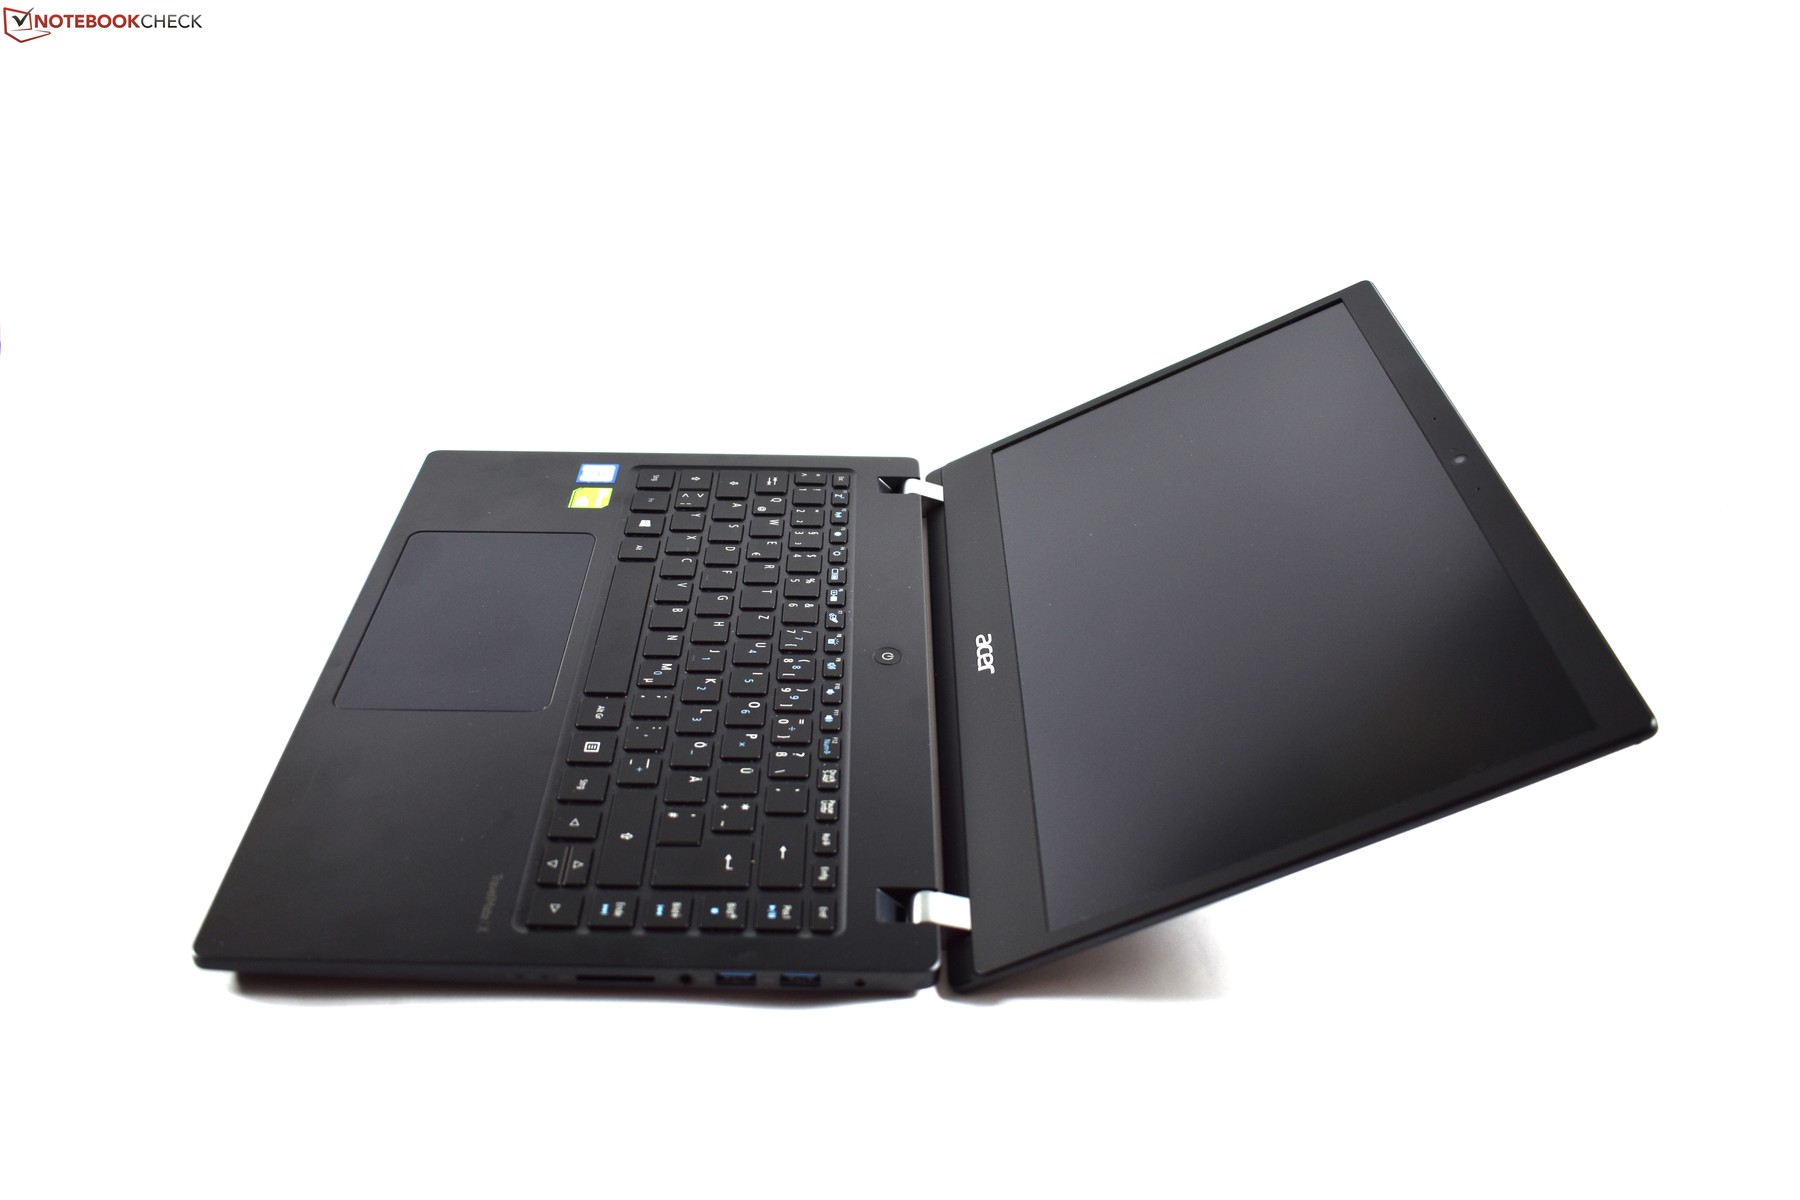
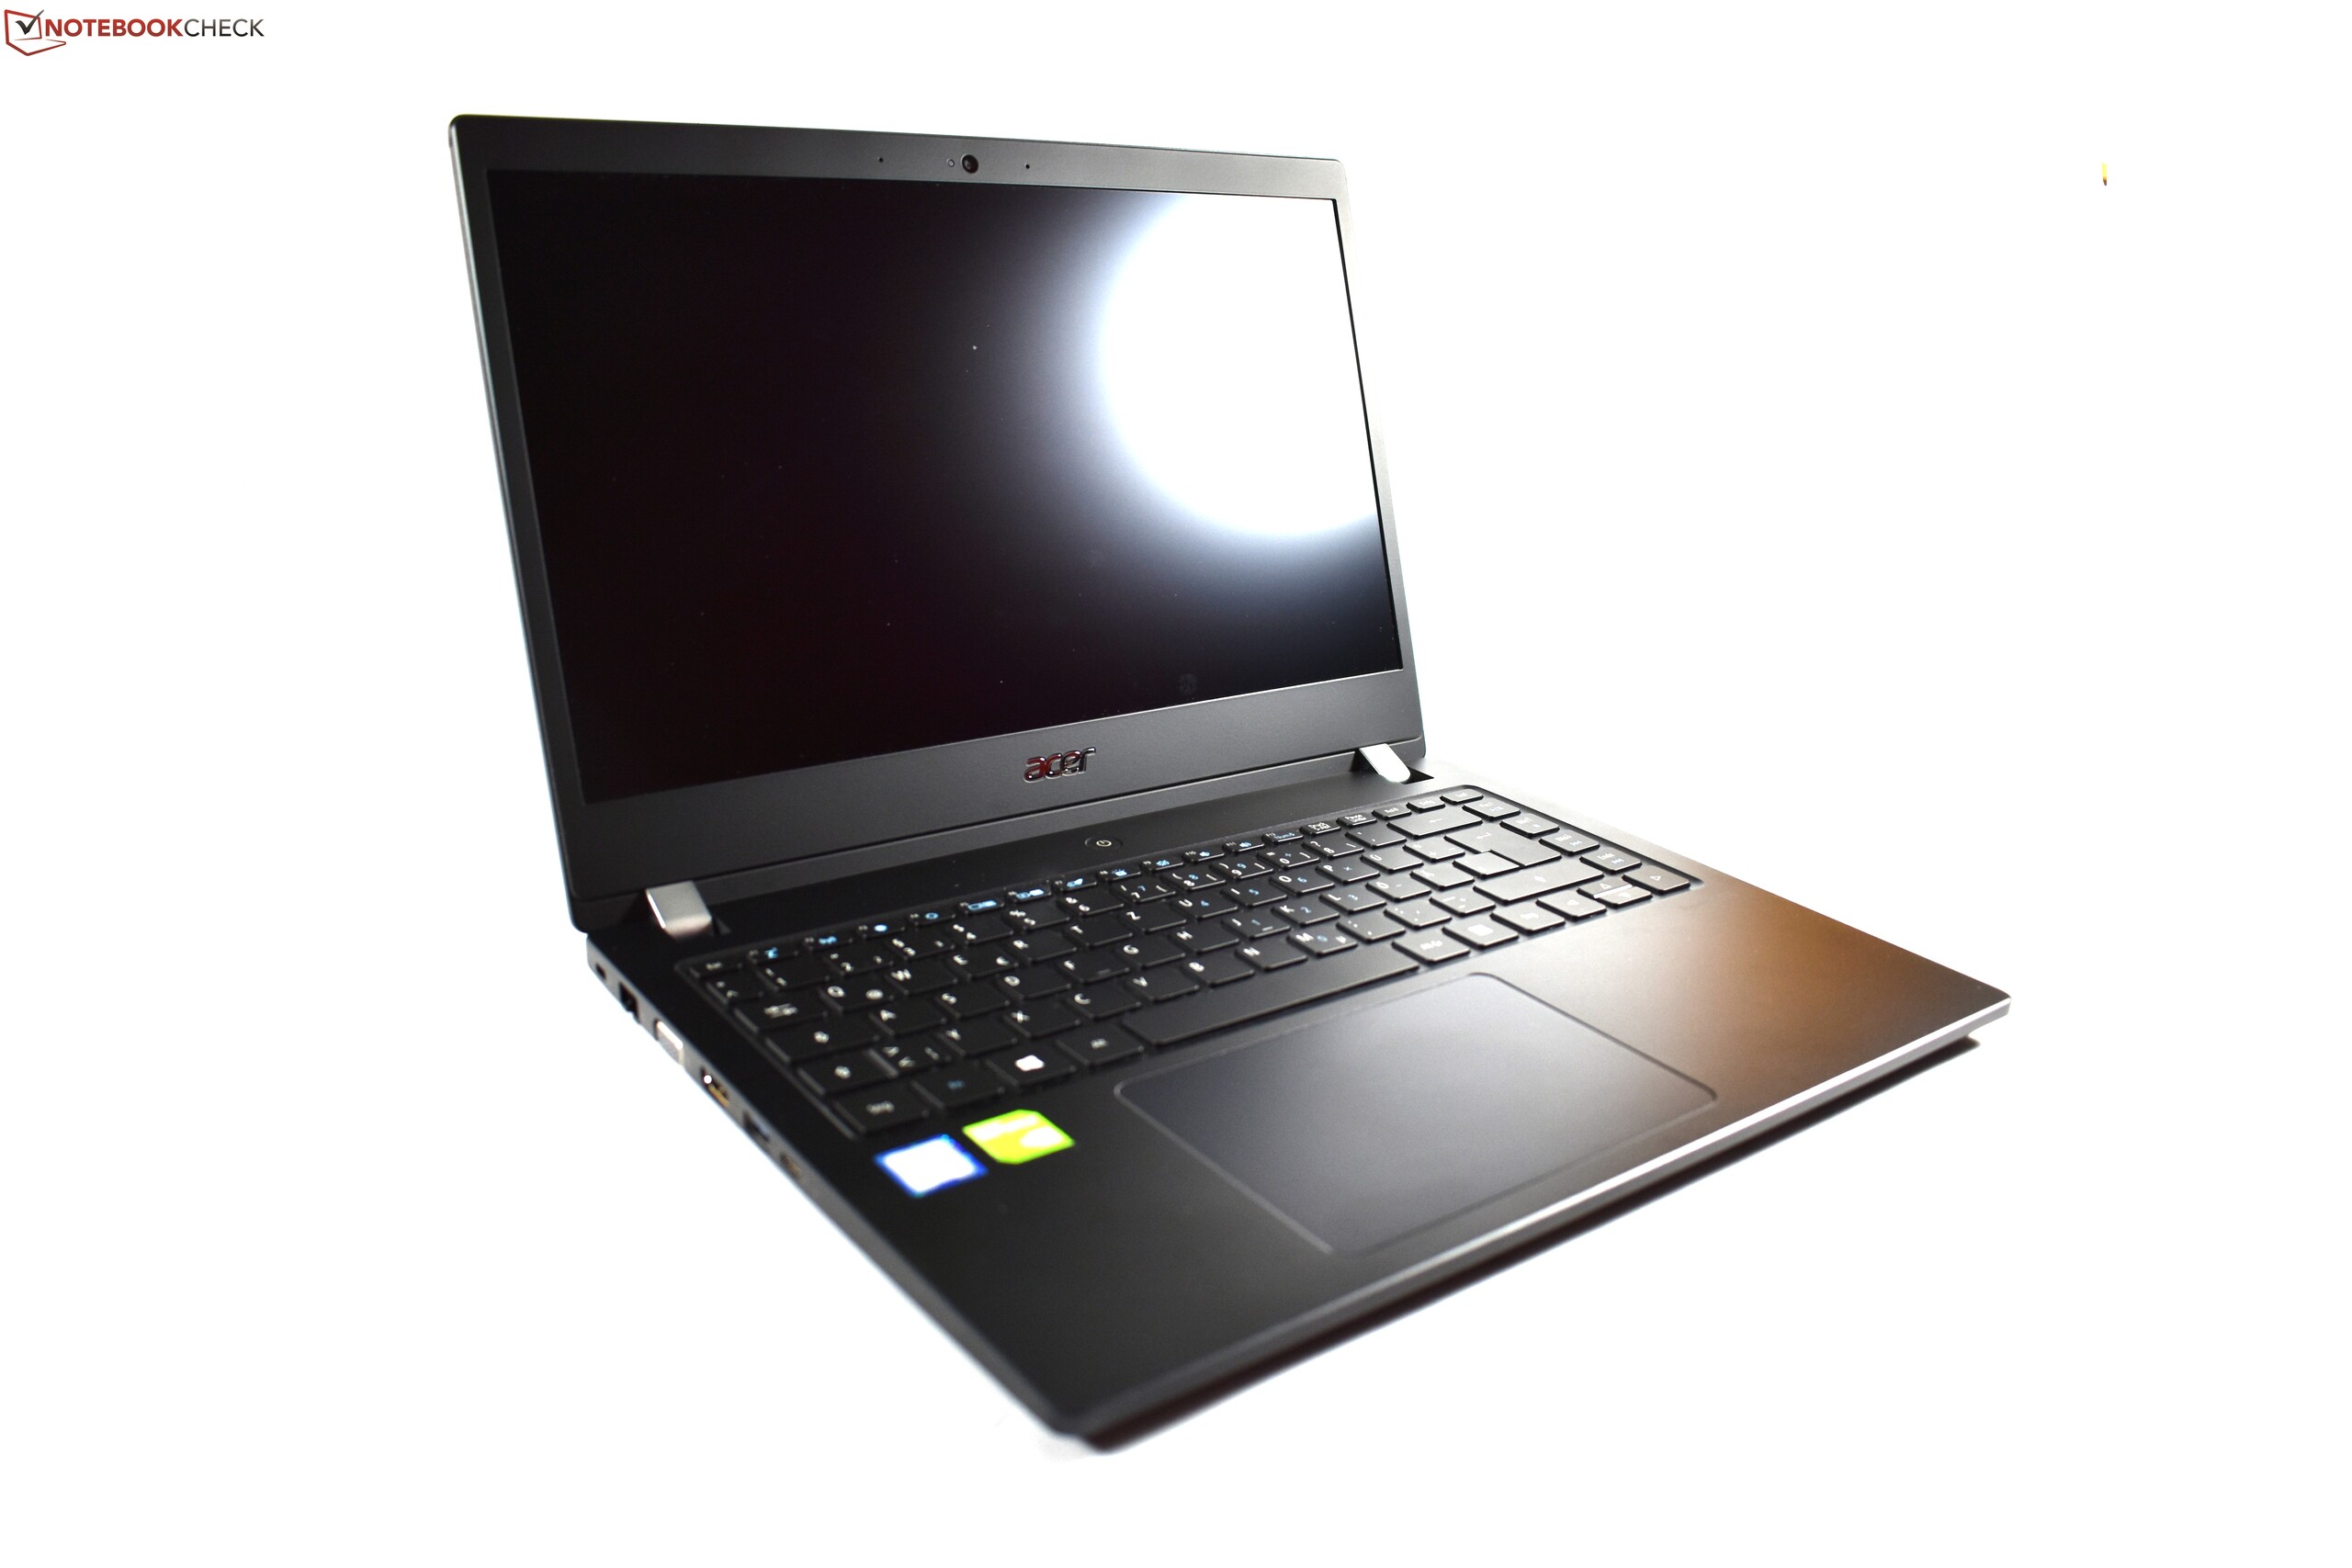
A Acer coloca o TravelMate X3410 como um azarão na corrida por participação de mercado contra os "Três Grandes": Lenovo, Dell e HP. Esta é uma batalha difícil para o TravelMate, em que ele desempenha admiravelmente, no entanto.
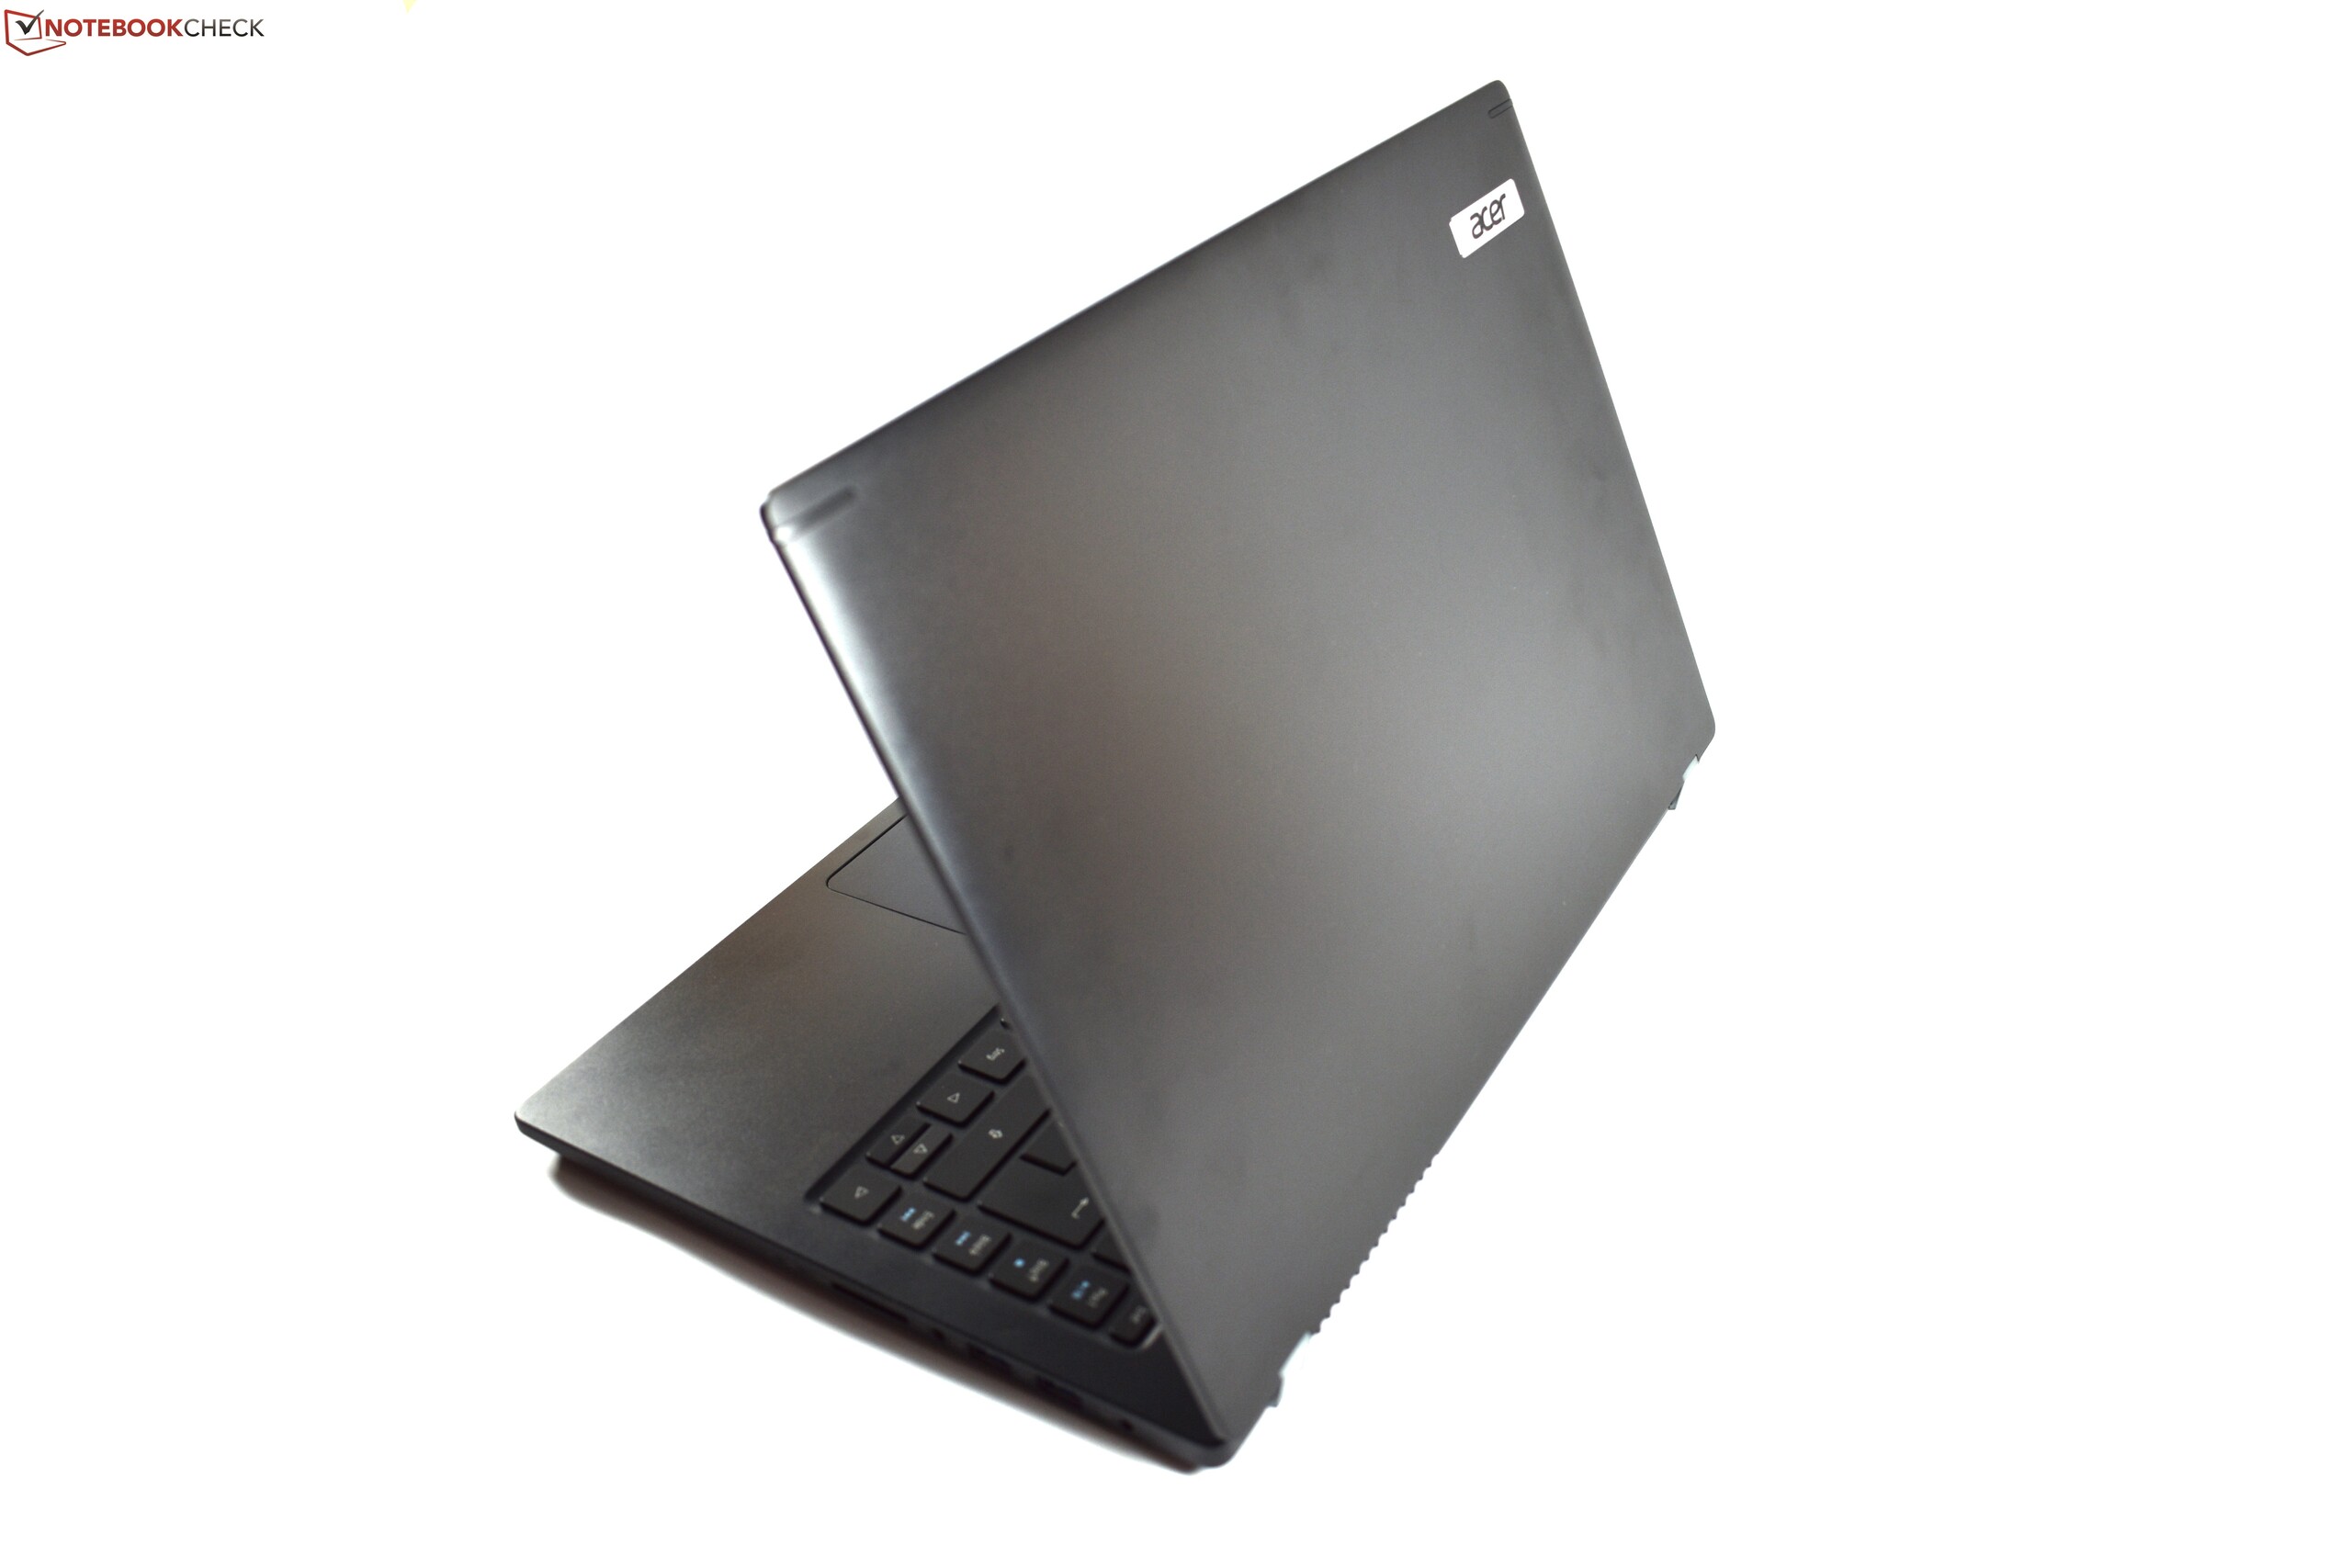
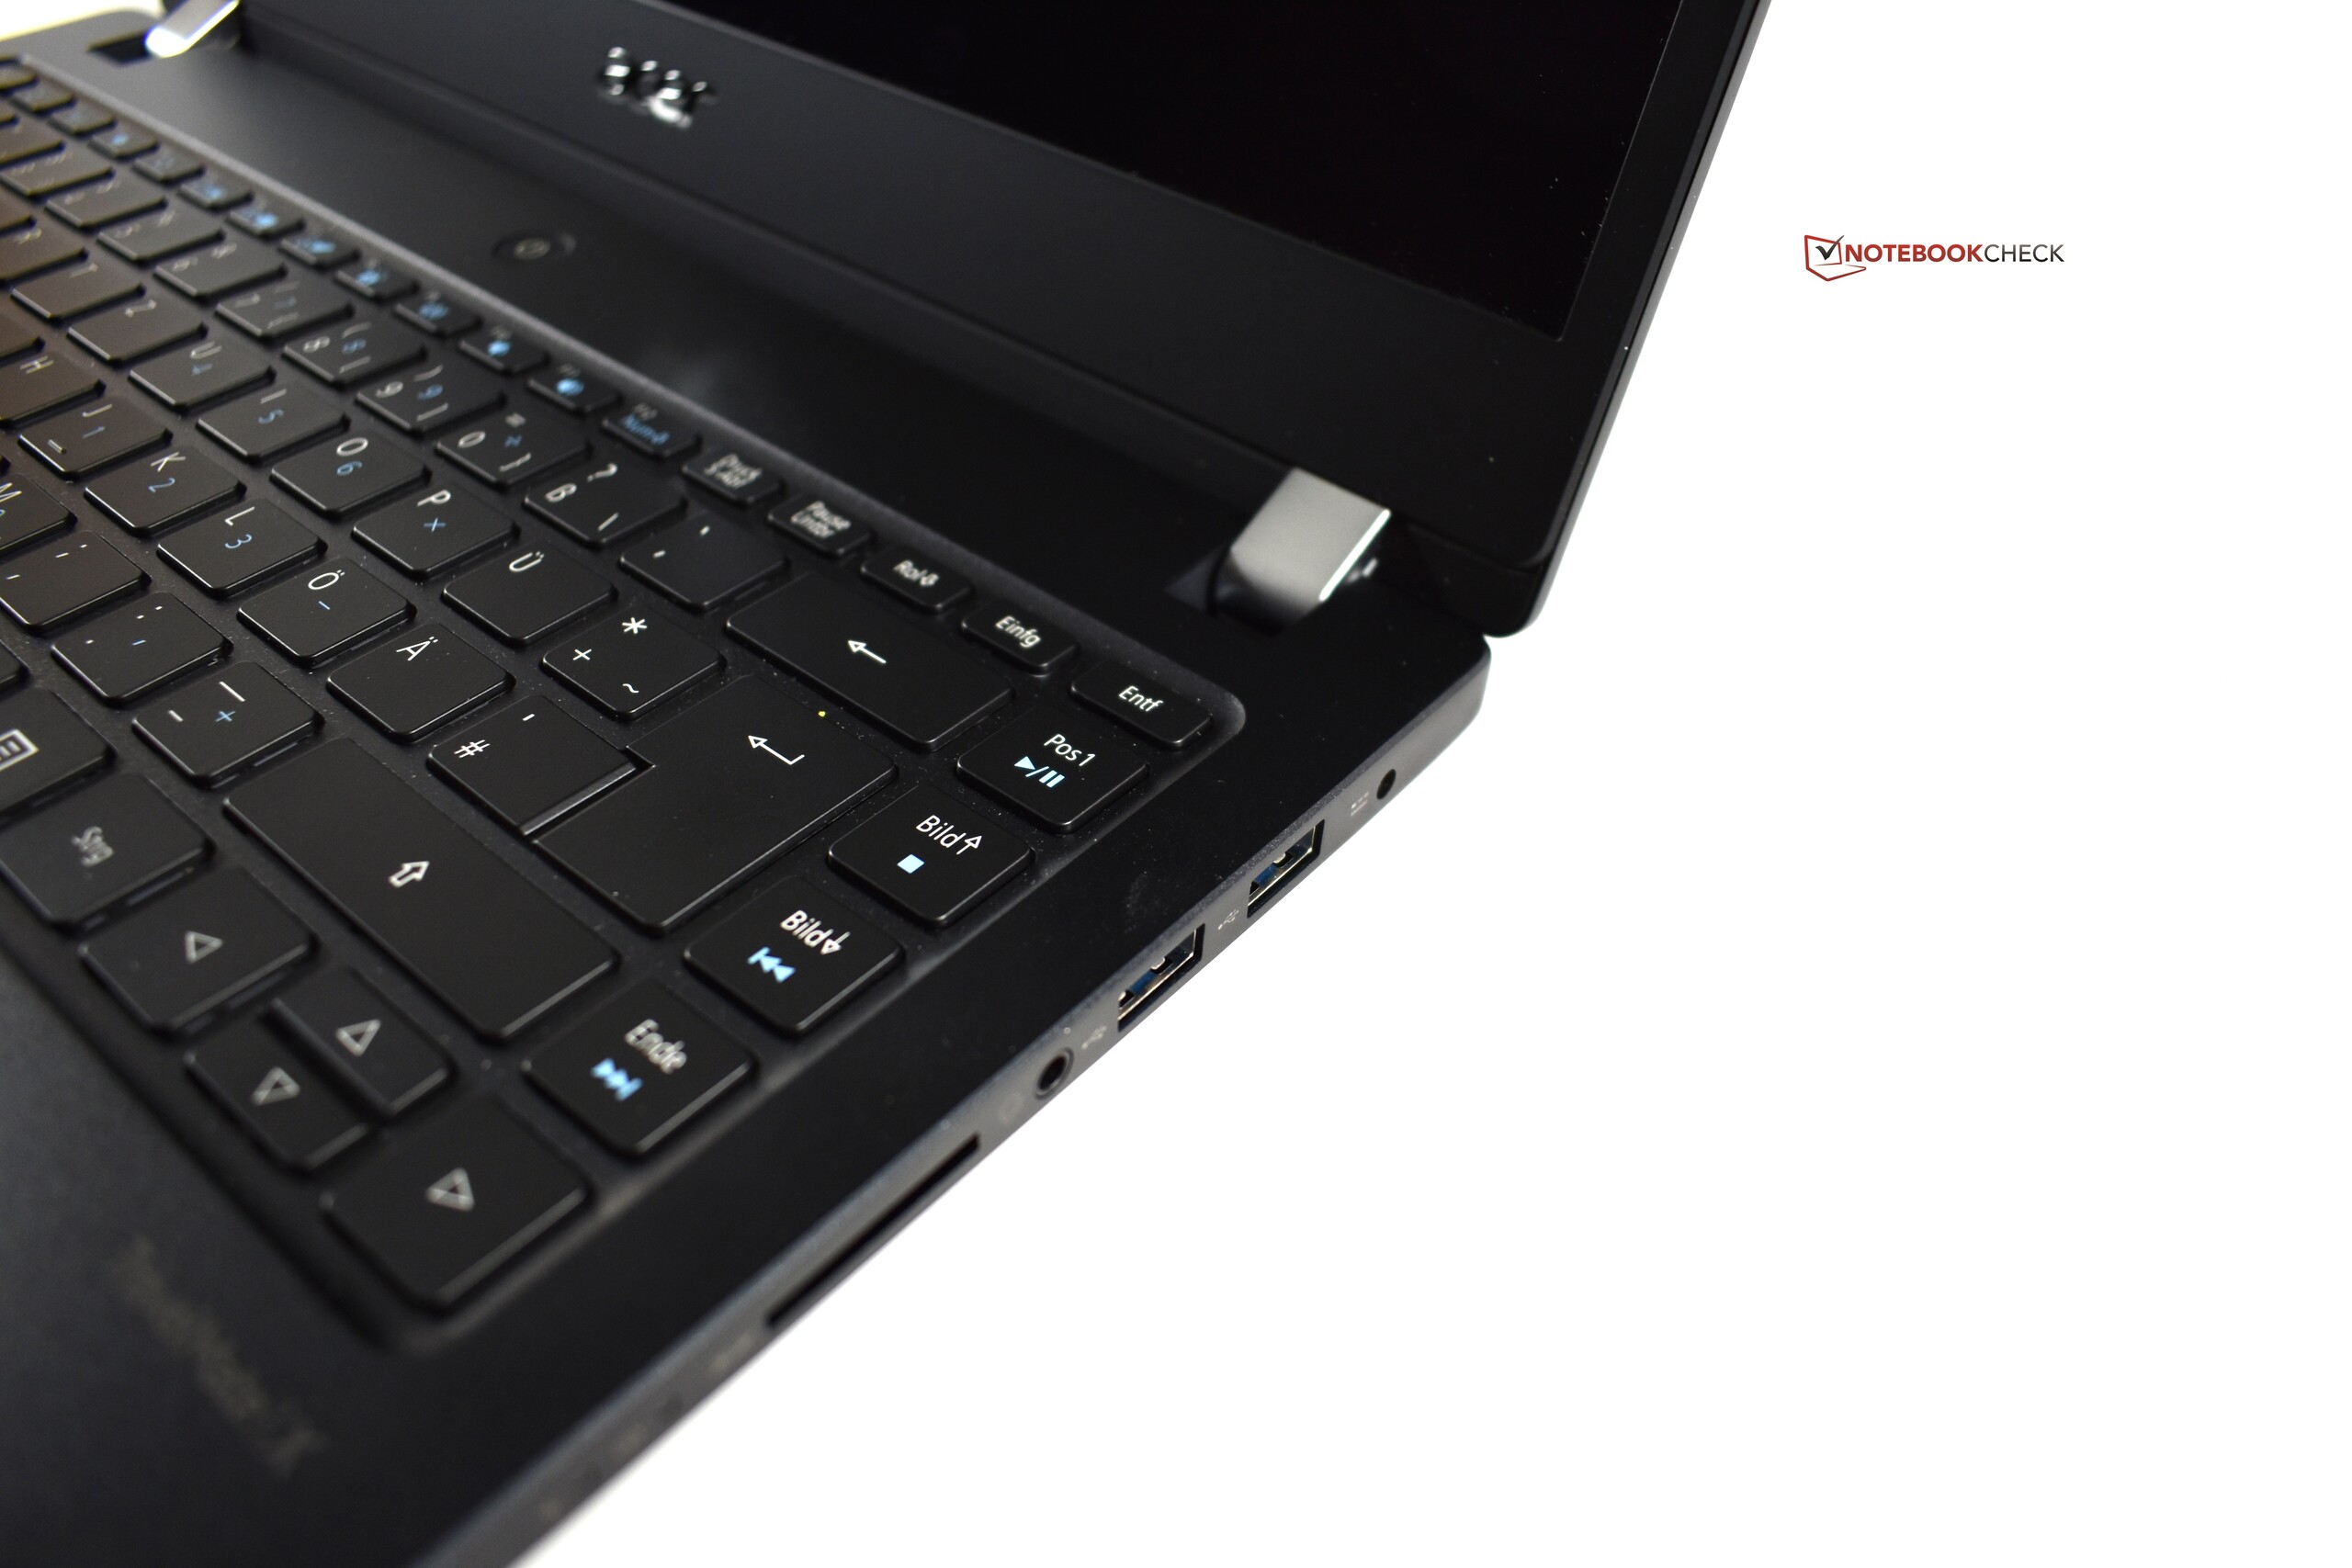
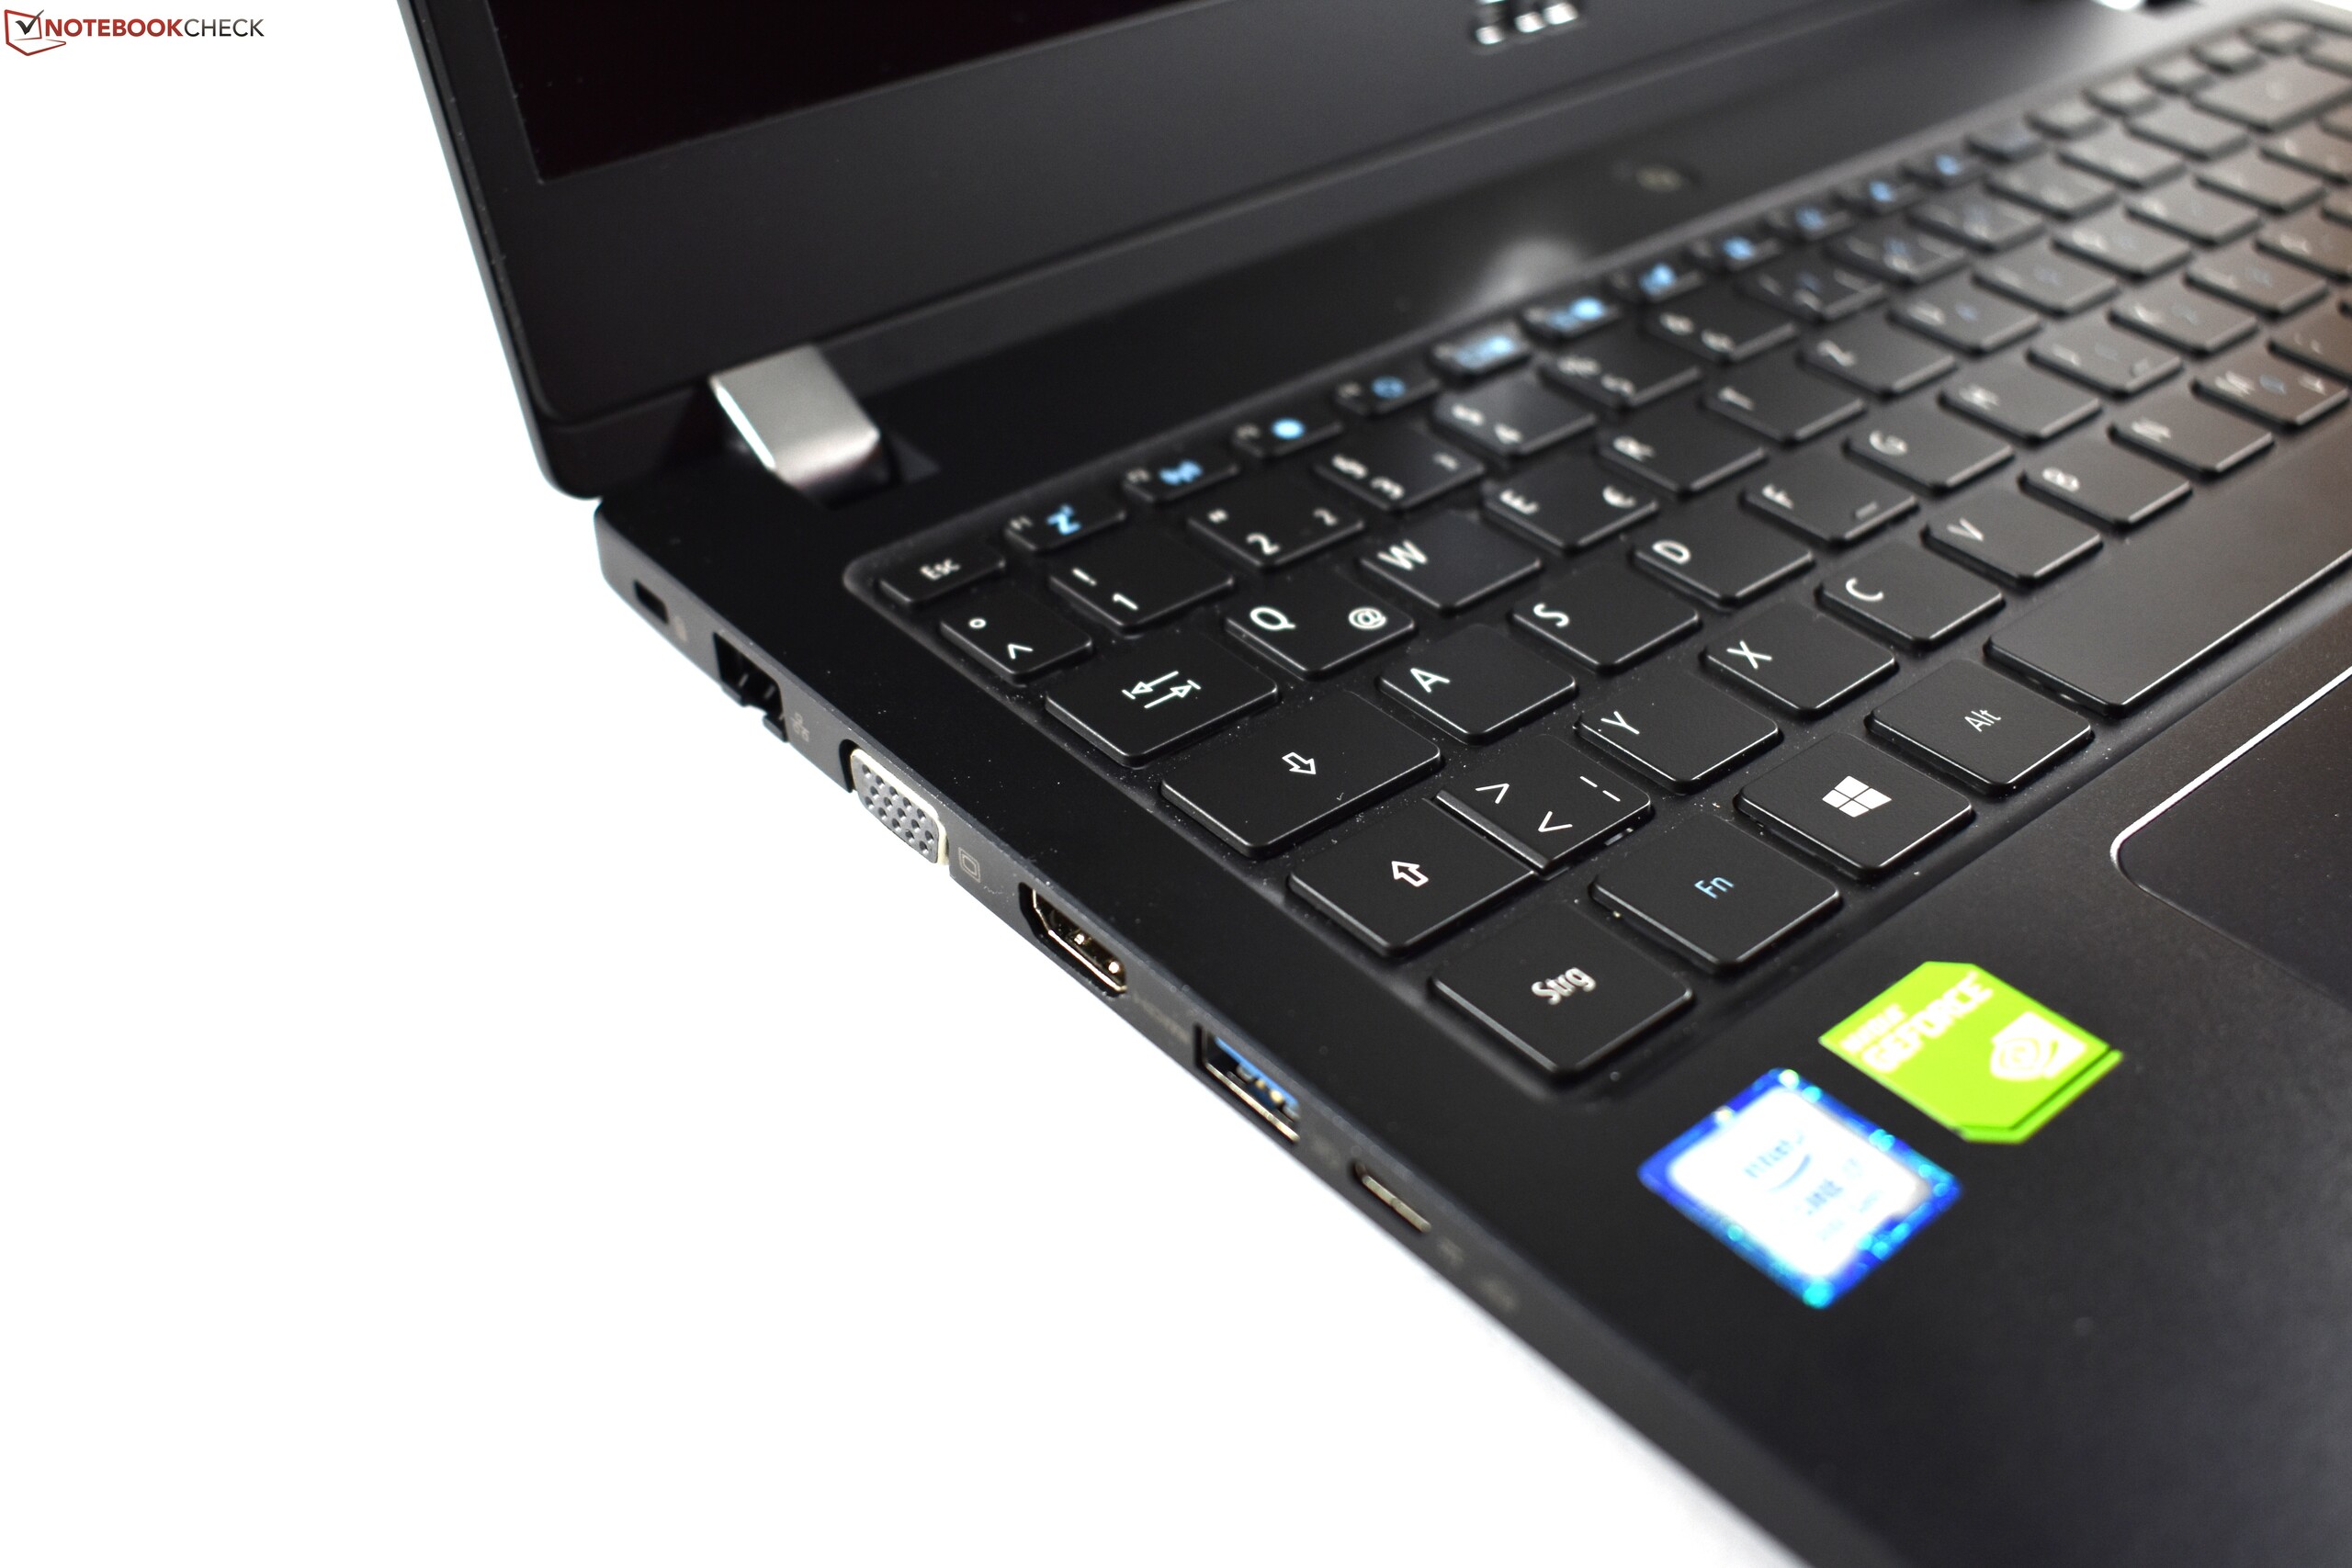
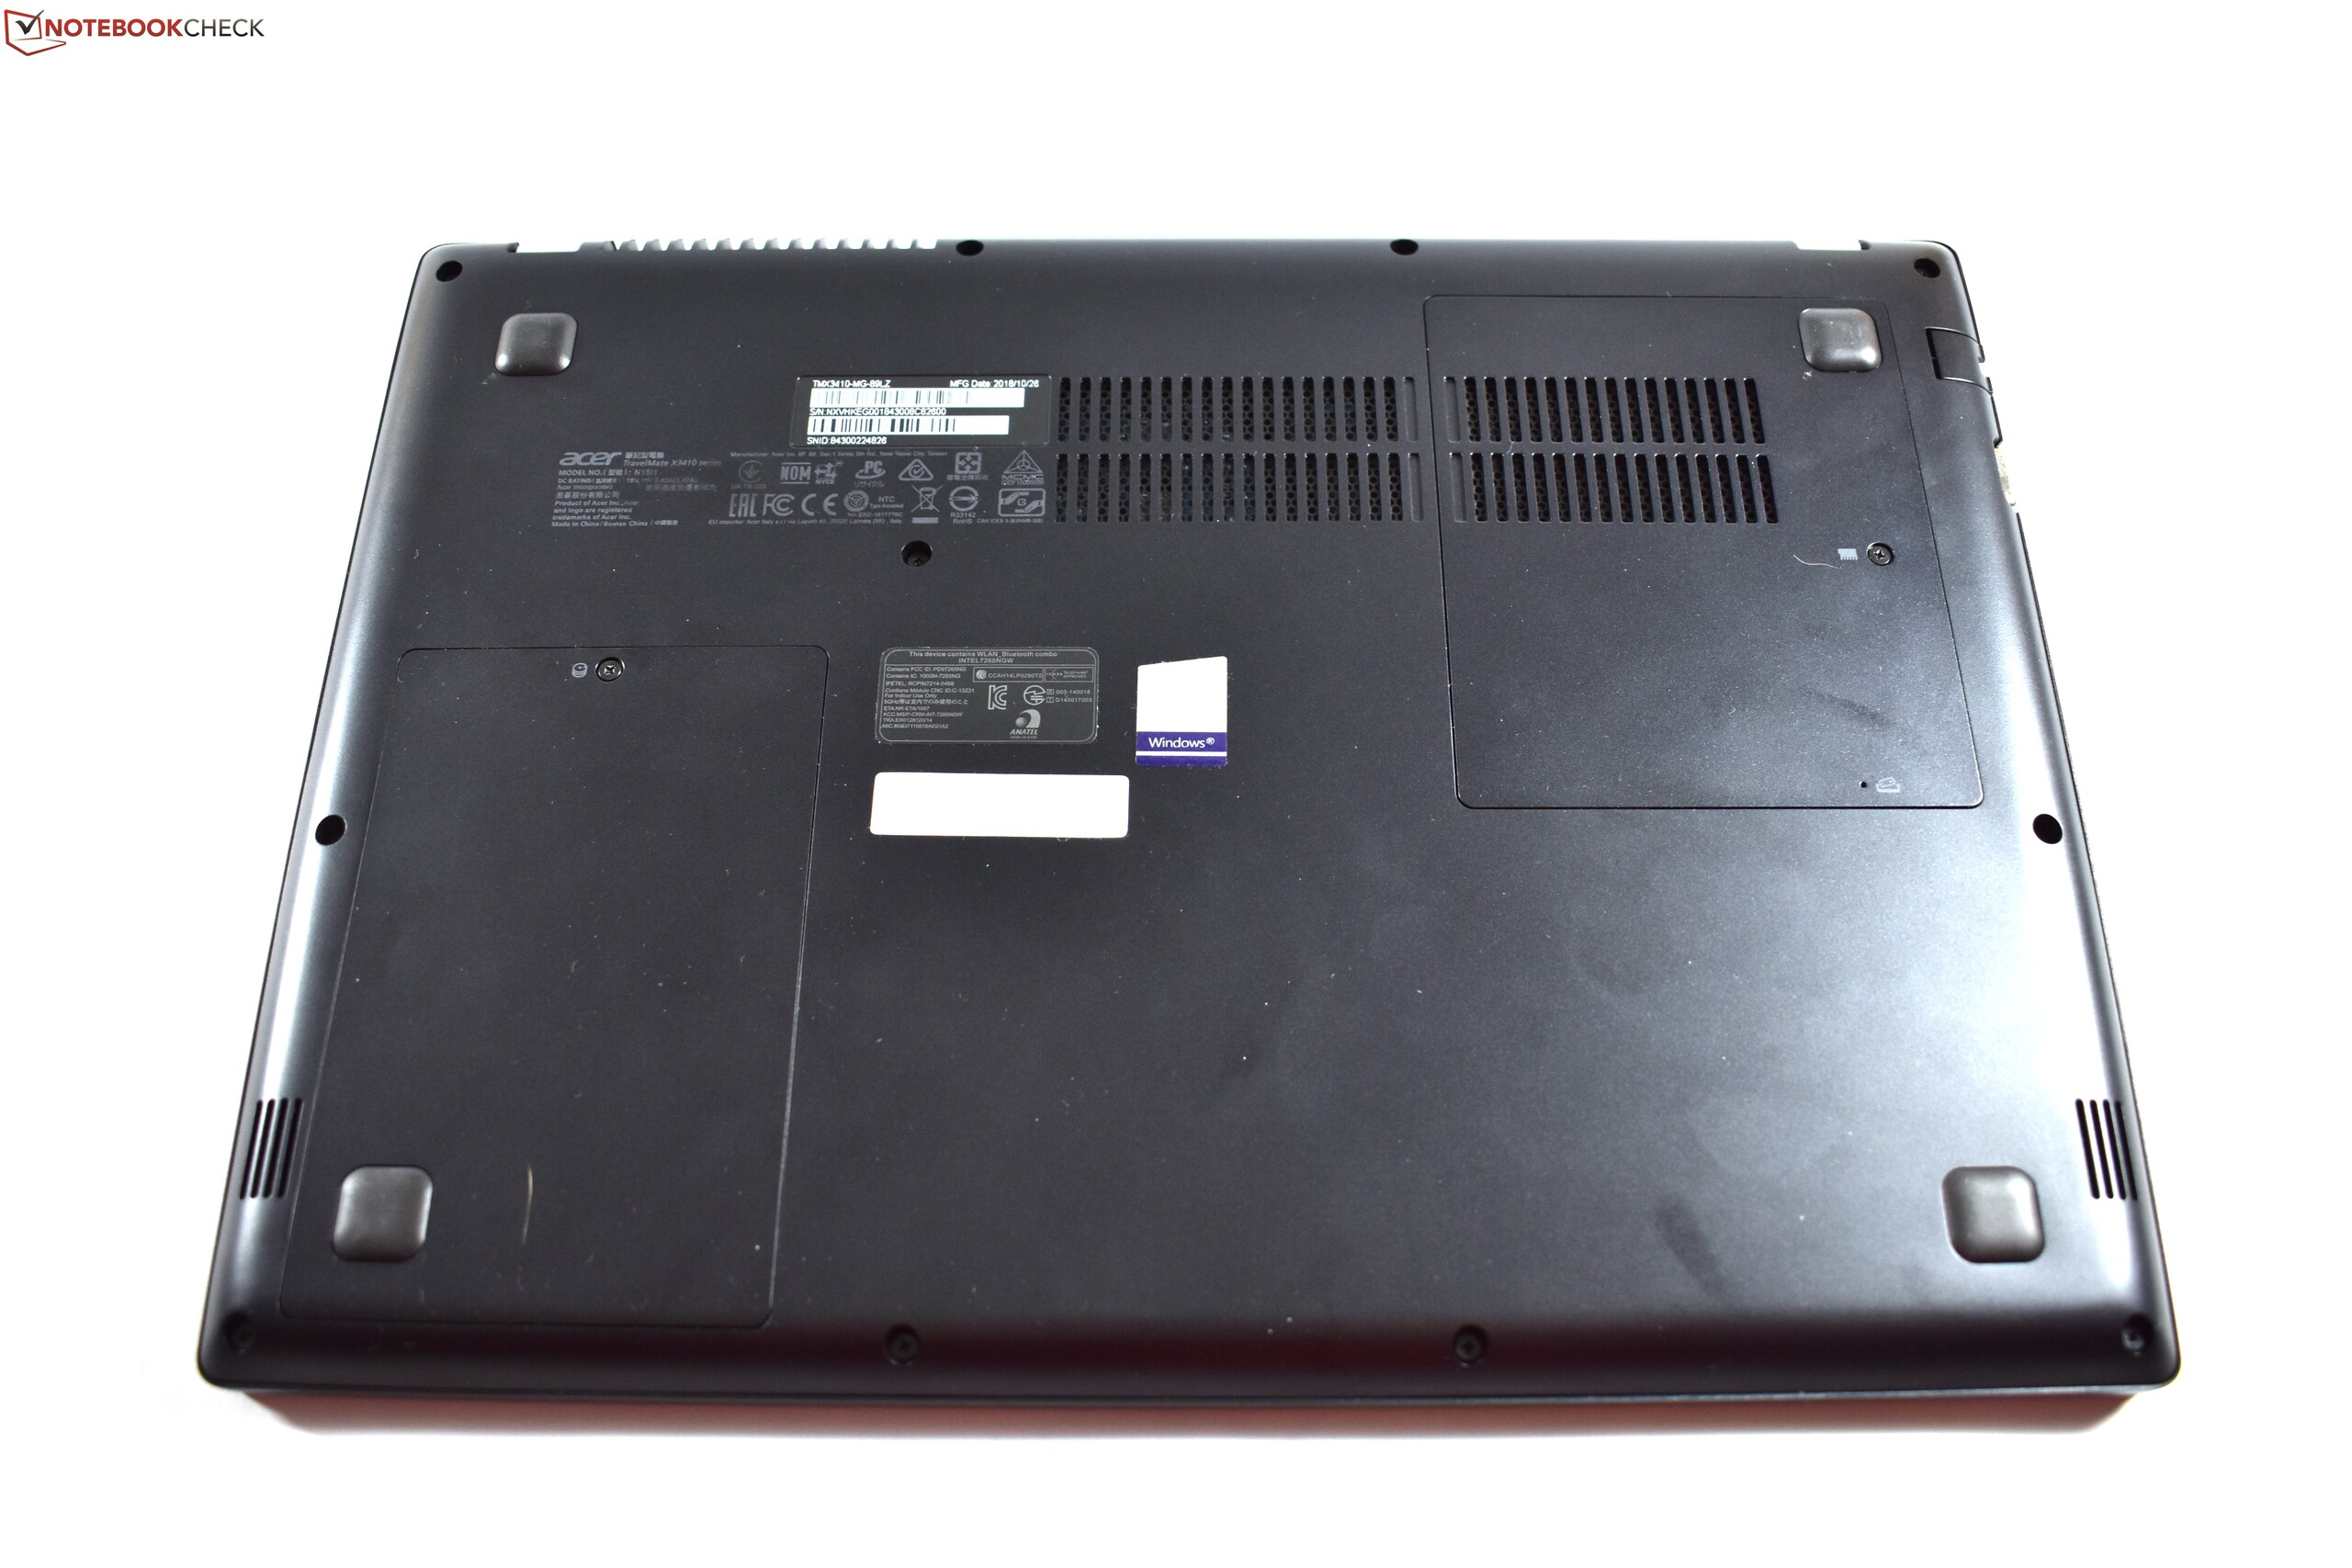
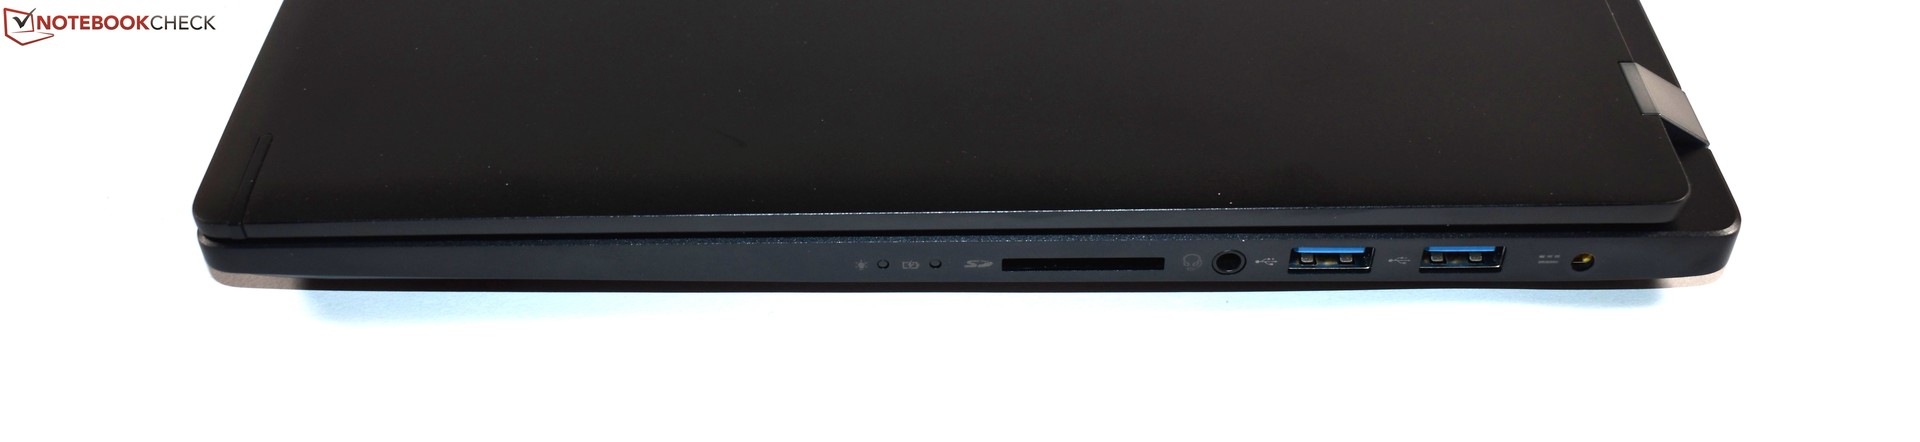
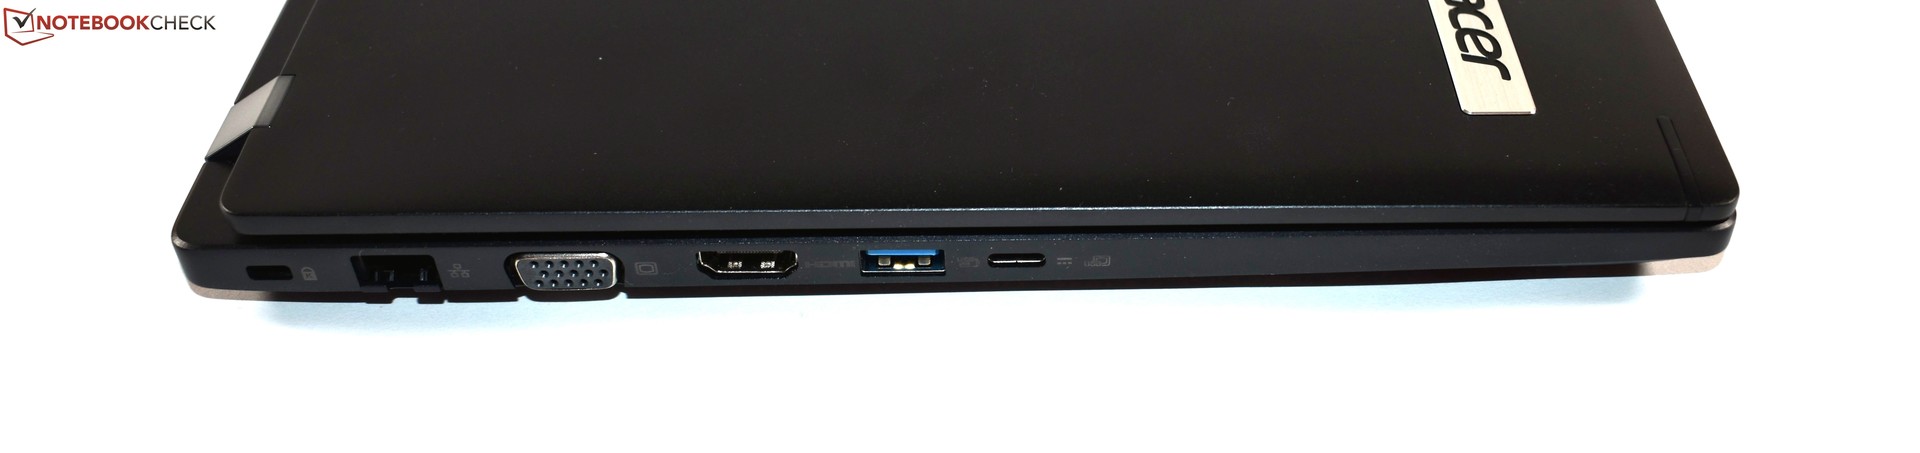
Nós gostamos da carcaça, por exemplo, que é feita de uma combinação estável de alumínio e plástico. Ao mesmo tempo, o teclado e o touchpad também são do nosso agrado, embora os teclados dos concorrentes sejam melhores. Quando se trata das portas, o TravelMate satisfaz os usuários com periféricos legados com uma porta VGA, algo que nenhum concorrente oferece mais. A duração da bateria do TravelMate é tão convincente quanto o modo de operação silenciosa e a alta flexibilidade oferecida pelo HD adicional de 1 TB. Outra vantagem do TravelMate é o preço base mais baixo comparado com os concorrentes.
Este preço mais baixo, no entanto, tem suas repercussões. Uma dessas consequências negativas é a tela, que oferece uma taxa de contraste muito alta, sendo muito escura e oferecendo uma gama de cores muito limitada ao mesmo tempo. Infelizmente, a Acer não oferece telas melhores como opção. É bom que a Acer coloque em um leitor de cartão SD de tamanho completo, mas, infelizmente, é um leitor de cartões muito lento. O SSD também é lento, porque a Acer usa um SSD SATA III obsoleto. Igualmente desatualizada é a tecnologia usada na GPU: A Uma GeForce MX130? supera as GPUs da Intel, mas a Nvidia GeForce MX150 ainda é muito mais rápida. Um leitor de cartão inteligente, LTE ou um pointing-stick não são oferecidos - o que é ruim, já que esses recursos são comuns no mercado corporativo. Além disso, a porta USB C não possui o padrão Thunderbolt e é colocada muito à frente para o recurso de carregamento.
O TravelMate X3410 da Acer pode competir principalmente por causa de seu preço mais baixo e pode ser uma boa opção como um cavalo de batalha.
Em comparação com a concorrência, o portátil Acer ainda não é, em geral, um pacote tão completo. È verdade que o Dell Latitude 7490 e o HP EliteBook 840 G1 não são tão flexíveis em termos de armazenamento, mas ambos possuem tela muito melhores e mais recursos corporativos. Eles também são mais leves. Enquanto isso, a tela padrão do Lenovo ThinkPad T480 não é muito melhor que o LCD TravelMate, mas pelo menos a Lenovo oferece uma tela melhor como opção. Além disso, o T480 é mais rápido com a Nvidia GeForce MX150 e com seu melhor desempenho da CPU.
Para o TravelMate, o preço mais baixo continua a ser sua vantagem mais importante. É por isso que o TravelMate recebe uma recomendação. Se os recursos empresariais não forem necessários, e a qualidade da tela não for muito importante, e o leitor de cartões SD não for realmente necessário, o Acer TravelMate X3410 pode ser uma ferramenta de trabalho muito boa. Quando se trata da pontuação final, ela acaba perdendo um "muito bom".
Acer TravelMate X3410-M-50DD
- 10/29/2019 v7 (old)
Benjamin Herzig
Price comparison
