Breve Análise do Portátil Lenovo ThinkPad E590 (i7-8565U, UHD 620, FHD)
| SD Card Reader | |
| average JPG Copy Test (av. of 3 runs) | |
| Lenovo ThinkPad E590-20NC0003GE (Toshiba Exceria Pro M501 64 GB UHS-II) | |
| HP ProBook 450 G6-5TJ93EA (Toshiba Exceria Pro SDXC 64 GB UHS-II) | |
| Média da turma Office (19.8 - 198.5, n=22, últimos 2 anos) | |
| Acer TravelMate P2510-G2-MG-50WE (Toshiba Exceria Pro SDXC 64 GB UHS-II) | |
| Toshiba Tecra A50-E-110 (Toshiba Exceria Pro SDXC 64 GB UHS-II) | |
| maximum AS SSD Seq Read Test (1GB) | |
| Lenovo ThinkPad E590-20NC0003GE (Toshiba Exceria Pro M501 64 GB UHS-II) | |
| HP ProBook 450 G6-5TJ93EA (Toshiba Exceria Pro SDXC 64 GB UHS-II) | |
| Média da turma Office (27.4 - 249, n=21, últimos 2 anos) | |
| Toshiba Tecra A50-E-110 (Toshiba Exceria Pro SDXC 64 GB UHS-II) | |
| Acer TravelMate P2510-G2-MG-50WE (Toshiba Exceria Pro SDXC 64 GB UHS-II) | |
| Networking | |
| iperf3 transmit AX12 | |
| Lenovo ThinkPad E590-20NC0003GE | |
| HP ProBook 450 G6-5TJ93EA | |
| Acer TravelMate P2510-G2-MG-50WE | |
| Toshiba Tecra A50-E-110 | |
| iperf3 receive AX12 | |
| HP ProBook 450 G6-5TJ93EA | |
| Lenovo ThinkPad E590-20NC0003GE | |
| Acer TravelMate P2510-G2-MG-50WE | |
| Toshiba Tecra A50-E-110 | |
| |||||||||||||||||||||||||
iluminação: 90 %
iluminação com acumulador: 251 cd/m²
Contraste: 1270:1 (Preto: 0.2 cd/m²)
ΔE ColorChecker Calman: 5.6 | ∀{0.5-29.43 Ø4.71}
calibrated: 4.9
ΔE Greyscale Calman: 3.1 | ∀{0.09-98 Ø4.96}
57.1% sRGB (Argyll 1.6.3 3D)
36.3% AdobeRGB 1998 (Argyll 1.6.3 3D)
39.47% AdobeRGB 1998 (Argyll 3D)
57.5% sRGB (Argyll 3D)
38.21% Display P3 (Argyll 3D)
Gamma: 2.22
CCT: 6450 K
| Lenovo ThinkPad E590-20NC0003GE LP156WFC-SPDB, , 1920x1080, 15.6" | HP ProBook 450 G6-5TJ93EA Chi Mei CMN15FE, , 1920x1080, 15.6" | Acer TravelMate P2510-G2-MG-50WE Chi Mei CMN15D3, , 1920x1080, 15.6" | Toshiba Tecra A50-E-110 TOS508F, , 1920x1080, 15.6" | Lenovo ThinkPad E580-20KSCTO1WW BOE NV156FHM-N49, , 1920x1080, 15.6" | |
|---|---|---|---|---|---|
| Display | 12% | 11% | 59% | 3% | |
| Display P3 Coverage (%) | 38.21 | 42.83 12% | 42.27 11% | 65 70% | 39.83 4% |
| sRGB Coverage (%) | 57.5 | 64.2 12% | 63.5 10% | 85.9 49% | 58.5 2% |
| AdobeRGB 1998 Coverage (%) | 39.47 | 44.29 12% | 43.69 11% | 62.8 59% | 41.15 4% |
| Response Times | 13% | -8% | -10% | -29% | |
| Response Time Grey 50% / Grey 80% * (ms) | 40 ? | 34.4 ? 14% | 40 ? -0% | 44 ? -10% | 48.4 ? -21% |
| Response Time Black / White * (ms) | 27.6 ? | 24.4 ? 12% | 32 ? -16% | 30 ? -9% | 37.6 ? -36% |
| PWM Frequency (Hz) | 26040 ? | 25000 ? | 20000 ? | 22030 ? | |
| Screen | 2% | 18% | 3% | -7% | |
| Brightness middle (cd/m²) | 254 | 242 -5% | 259 2% | 290 14% | 292 15% |
| Brightness (cd/m²) | 251 | 226 -10% | 230 -8% | 249 -1% | 272 8% |
| Brightness Distribution (%) | 90 | 88 -2% | 82 -9% | 78 -13% | 84 -7% |
| Black Level * (cd/m²) | 0.2 | 0.21 -5% | 0.19 5% | 0.38 -90% | 0.3 -50% |
| Contrast (:1) | 1270 | 1152 -9% | 1363 7% | 763 -40% | 973 -23% |
| Colorchecker dE 2000 * | 5.6 | 4.7 16% | 3.13 44% | 4.35 22% | 5.8 -4% |
| Colorchecker dE 2000 max. * | 15.4 | 18.5 -20% | 7.81 49% | 11.06 28% | 22.4 -45% |
| Colorchecker dE 2000 calibrated * | 4.9 | 4 18% | 3.09 37% | ||
| Greyscale dE 2000 * | 3.1 | 2.7 13% | 1.42 54% | 3.01 3% | 2.3 26% |
| Gamma | 2.22 99% | 2.26 97% | 2.36 93% | 2.44 90% | 2.12 104% |
| CCT | 6450 101% | 6442 101% | 6391 102% | 7198 90% | 6223 104% |
| Color Space (Percent of AdobeRGB 1998) (%) | 36.3 | 40.8 12% | 40 10% | 56 54% | 37.6 4% |
| Color Space (Percent of sRGB) (%) | 57.1 | 64 12% | 63 10% | 86 51% | 58 2% |
| Média Total (Programa/Configurações) | 9% /
5% | 7% /
14% | 17% /
12% | -11% /
-8% |
* ... menor é melhor
Exibir tempos de resposta
| ↔ Tempo de resposta preto para branco | ||
|---|---|---|
| 27.6 ms ... ascensão ↗ e queda ↘ combinadas | ↗ 16.8 ms ascensão | 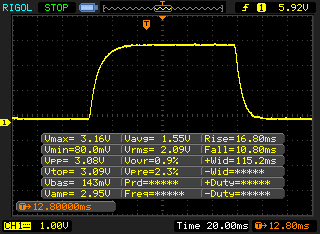 |
| ↘ 10.8 ms queda | ||
| A tela mostra taxas de resposta relativamente lentas em nossos testes e pode ser muito lenta para os jogadores. Em comparação, todos os dispositivos testados variam de 0.1 (mínimo) a 240 (máximo) ms. » 70 % de todos os dispositivos são melhores. Isso significa que o tempo de resposta medido é pior que a média de todos os dispositivos testados (19.8 ms). | ||
| ↔ Tempo de resposta 50% cinza a 80% cinza | ||
| 40 ms ... ascensão ↗ e queda ↘ combinadas | ↗ 21.2 ms ascensão | 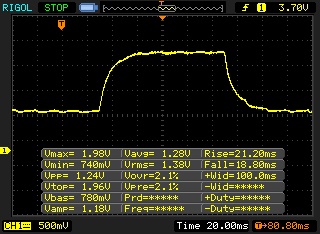 |
| ↘ 18.8 ms queda | ||
| A tela mostra taxas de resposta lentas em nossos testes e será insatisfatória para os jogadores. Em comparação, todos os dispositivos testados variam de 0.165 (mínimo) a 636 (máximo) ms. » 61 % de todos os dispositivos são melhores. Isso significa que o tempo de resposta medido é pior que a média de todos os dispositivos testados (31 ms). | ||
Cintilação da tela / PWM (modulação por largura de pulso)
| Tela tremeluzindo / PWM não detectado | 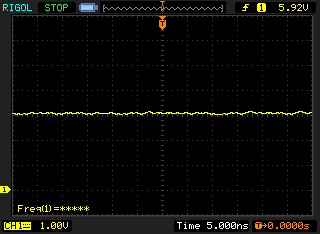 | ||
[pwm_comparison] Em comparação: 52 % de todos os dispositivos testados não usam PWM para escurecer a tela. Se PWM foi detectado, uma média de 7754 (mínimo: 5 - máximo: 343500) Hz foi medida. | |||
| PCMark 8 Home Score Accelerated v2 | 2577 pontos | |
| PCMark 8 Work Score Accelerated v2 | 3596 pontos | |
| PCMark 10 Score | 2486 pontos | |
Ajuda | ||
| Lenovo ThinkPad E590-20NC0003GE Toshiba KBG30ZMT512G | HP ProBook 450 G6-5TJ93EA Samsung SSD PM981 MZVLB512HAJQ | Acer TravelMate P2510-G2-MG-50WE SK Hynix HFS256G39TND-N210A | Toshiba Tecra A50-E-110 Samsung SSD PM871b MZNLN256HAJQ | Lenovo ThinkPad E580-20KSCTO1WW Toshiba KBG30ZMT128G | Média Toshiba KBG30ZMT512G | |
|---|---|---|---|---|---|---|
| CrystalDiskMark 5.2 / 6 | 160% | 1% | 12% | -7% | 42% | |
| Write Seq (MB/s) | 624 | 1669 167% | 257.1 -59% | 505 -19% | 131.1 -79% | 624 ? 0% |
| Read Seq (MB/s) | 835 | 2224 166% | 476.3 -43% | 528 -37% | 910 9% | 838 ? 0% |
| Write 4K Q32T1 (MB/s) | 87.4 | 410.4 370% | 202.6 132% | 204.9 134% | 122.1 40% | 163.4 ? 87% |
| Read 4K Q32T1 (MB/s) | 135.9 | 338.1 149% | 282 108% | 226.6 67% | 199.3 47% | 366 ? 169% |
| Write Seq Q32T1 (MB/s) | 784 | 1979 152% | 265.6 -66% | 533 -32% | 133 -83% | 763 ? -3% |
| Read Seq Q32T1 (MB/s) | 1623 | 3368 108% | 559 -66% | 551 -66% | 935 -42% | 1606 ? -1% |
| Write 4K (MB/s) | 53.4 | 126.1 136% | 71.8 34% | 80.1 50% | 81.8 53% | 81.5 ? 53% |
| Read 4K (MB/s) | 33.03 | 43.92 33% | 21.23 -36% | 32.05 -3% | 33.33 1% | 42.6 ? 29% |

| 3DMark 11 - 1280x720 Performance GPU | |
| Média da turma Office (2551 - 18313, n=72, últimos 2 anos) | |
| Lenovo ThinkPad E580-20KS001RGE | |
| HP ProBook 450 G6-5TJ93EA | |
| Acer TravelMate P2510-G2-MG-50WE | |
| Lenovo ThinkPad E590-20NC0003GE | |
| Média Intel UHD Graphics 620 (1144 - 3432, n=244) | |
| Toshiba Tecra A50-E-110 | |
| Lenovo ThinkPad E580-20KSCTO1WW | |
| 3DMark 11 Performance | 1989 pontos | |
| 3DMark Cloud Gate Standard Score | 6847 pontos | |
| 3DMark Fire Strike Score | 1068 pontos | |
Ajuda | ||
| baixo | média | alto | ultra | |
|---|---|---|---|---|
| BioShock Infinite (2013) | 62.5 | 32.4 | 26.3 | 8.4 |
| The Witcher 3 (2015) | 16.6 | |||
| Rise of the Tomb Raider (2016) | 21.5 |
Barulho
| Ocioso |
| 29.3 / 29.3 / 29.3 dB |
| Carga |
| 30.6 / 30.6 dB |
 | ||
30 dB silencioso 40 dB(A) audível 50 dB(A) ruidosamente alto |
||
min: | ||
(±) A temperatura máxima no lado superior é 43.8 °C / 111 F, em comparação com a média de 34.3 °C / 94 F , variando de 21.2 a 62.5 °C para a classe Office.
(±) A parte inferior aquece até um máximo de 43.9 °C / 111 F, em comparação com a média de 36.8 °C / 98 F
(+) Em uso inativo, a temperatura média para o lado superior é 24.1 °C / 75 F, em comparação com a média do dispositivo de 29.5 °C / ### class_avg_f### F.
(+) Os apoios para as mãos e o touchpad são mais frios que a temperatura da pele, com um máximo de 23.5 °C / 74.3 F e, portanto, são frios ao toque.
(+) A temperatura média da área do apoio para as mãos de dispositivos semelhantes foi 27.5 °C / 81.5 F (+4 °C / 7.2 F).
Lenovo ThinkPad E590-20NC0003GE análise de áudio
(-) | alto-falantes não muito altos (###valor### dB)
Graves 100 - 315Hz
(-) | quase nenhum baixo - em média 19.7% menor que a mediana
(±) | a linearidade dos graves é média (13.6% delta para a frequência anterior)
Médios 400 - 2.000 Hz
(+) | médios equilibrados - apenas 4.1% longe da mediana
(+) | médios são lineares (6.3% delta para frequência anterior)
Altos 2 - 16 kHz
(+) | agudos equilibrados - apenas 3.5% longe da mediana
(±) | a linearidade dos máximos é média (14.5% delta para frequência anterior)
Geral 100 - 16.000 Hz
(±) | a linearidade do som geral é média (24.7% diferença em relação à mediana)
Comparado com a mesma classe
» 73% de todos os dispositivos testados nesta classe foram melhores, 7% semelhantes, 20% piores
» O melhor teve um delta de 7%, a média foi 21%, o pior foi 53%
Comparado com todos os dispositivos testados
» 75% de todos os dispositivos testados foram melhores, 5% semelhantes, 19% piores
» O melhor teve um delta de 4%, a média foi 23%, o pior foi 134%
HP ProBook 450 G6-5TJ93EA análise de áudio
(±) | o volume do alto-falante é médio, mas bom (###valor### dB)
Graves 100 - 315Hz
(-) | quase nenhum baixo - em média 21.8% menor que a mediana
(±) | a linearidade dos graves é média (10.6% delta para a frequência anterior)
Médios 400 - 2.000 Hz
(±) | médios mais altos - em média 5.6% maior que a mediana
(±) | a linearidade dos médios é média (7.7% delta para frequência anterior)
Altos 2 - 16 kHz
(±) | máximos mais altos - em média 5.1% maior que a mediana
(+) | os máximos são lineares (4.6% delta da frequência anterior)
Geral 100 - 16.000 Hz
(±) | a linearidade do som geral é média (27.1% diferença em relação à mediana)
Comparado com a mesma classe
» 84% de todos os dispositivos testados nesta classe foram melhores, 5% semelhantes, 11% piores
» O melhor teve um delta de 7%, a média foi 21%, o pior foi 53%
Comparado com todos os dispositivos testados
» 83% de todos os dispositivos testados foram melhores, 4% semelhantes, 14% piores
» O melhor teve um delta de 4%, a média foi 23%, o pior foi 134%
| desligado | |
| Ocioso | |
| Carga |
|
Key:
min: | |
| Lenovo ThinkPad E590-20NC0003GE i7-8565U, UHD Graphics 620, Toshiba KBG30ZMT512G, IPS LED, 1920x1080, 15.6" | Lenovo ThinkPad E580-20KSCTO1WW i5-8250U, UHD Graphics 620, Toshiba KBG30ZMT128G, IPS LED, 1920x1080, 15.6" | HP ProBook 450 G6-5TJ93EA i7-8565U, GeForce MX130, Samsung SSD PM981 MZVLB512HAJQ, IPS, 1920x1080, 15.6" | Acer TravelMate P2510-G2-MG-50WE i5-8250U, GeForce MX130, SK Hynix HFS256G39TND-N210A, IPS, 1920x1080, 15.6" | Toshiba Tecra A50-E-110 i5-8250U, UHD Graphics 620, Samsung SSD PM871b MZNLN256HAJQ, IPS, 1920x1080, 15.6" | Média Intel UHD Graphics 620 | Média da turma Office | |
|---|---|---|---|---|---|---|---|
| Power Consumption | 9% | -21% | -12% | 5% | 0% | -17% | |
| Idle Minimum * (Watt) | 3.72 | 3.4 9% | 3.12 16% | 3.3 11% | 3.8 -2% | 3.81 ? -2% | 4.26 ? -15% |
| Idle Average * (Watt) | 7.8 | 6.7 14% | 6.3 19% | 5.6 28% | 7.7 1% | 6.94 ? 11% | 7.31 ? 6% |
| Idle Maximum * (Watt) | 10.32 | 7.7 25% | 9.78 5% | 7.8 24% | 9.3 10% | 8.75 ? 15% | 8.55 ? 17% |
| Load Average * (Watt) | 30.24 | 31.1 -3% | 57.6 -90% | 54 -79% | 31 -3% | 35 ? -16% | 43.8 ? -45% |
| Load Maximum * (Watt) | 44 | 42.9 2% | 67.3 -53% | 63 -43% | 34.6 21% | 47.5 ? -8% | 64.5 ? -47% |
| Witcher 3 ultra * (Watt) | 42 |
* ... menor é melhor
| Lenovo ThinkPad E590-20NC0003GE i7-8565U, UHD Graphics 620, 45 Wh | Lenovo ThinkPad E580-20KSCTO1WW i5-8250U, UHD Graphics 620, 45 Wh | HP ProBook 450 G6-5TJ93EA i7-8565U, GeForce MX130, 45 Wh | Acer TravelMate P2510-G2-MG-50WE i5-8250U, GeForce MX130, 48 Wh | Toshiba Tecra A50-E-110 i5-8250U, UHD Graphics 620, 45 Wh | Média da turma Office | |
|---|---|---|---|---|---|---|
| Duração da bateria | -9% | 12% | 15% | -23% | 56% | |
| Reader / Idle (h) | 18.3 | 14.4 -21% | 14.6 -20% | 24.5 ? 34% | ||
| H.264 (h) | 8.4 | 7.3 -13% | 7.7 -8% | 8.6 2% | 15.5 ? 85% | |
| WiFi v1.3 (h) | 6.4 | 7 9% | 9.7 52% | 8.4 31% | 4.9 -23% | 13.2 ? 106% |
| Load (h) | 1.8 | 1.6 -11% | 2.2 22% | 2 11% | 1.808 ? 0% |
Pro
Contra
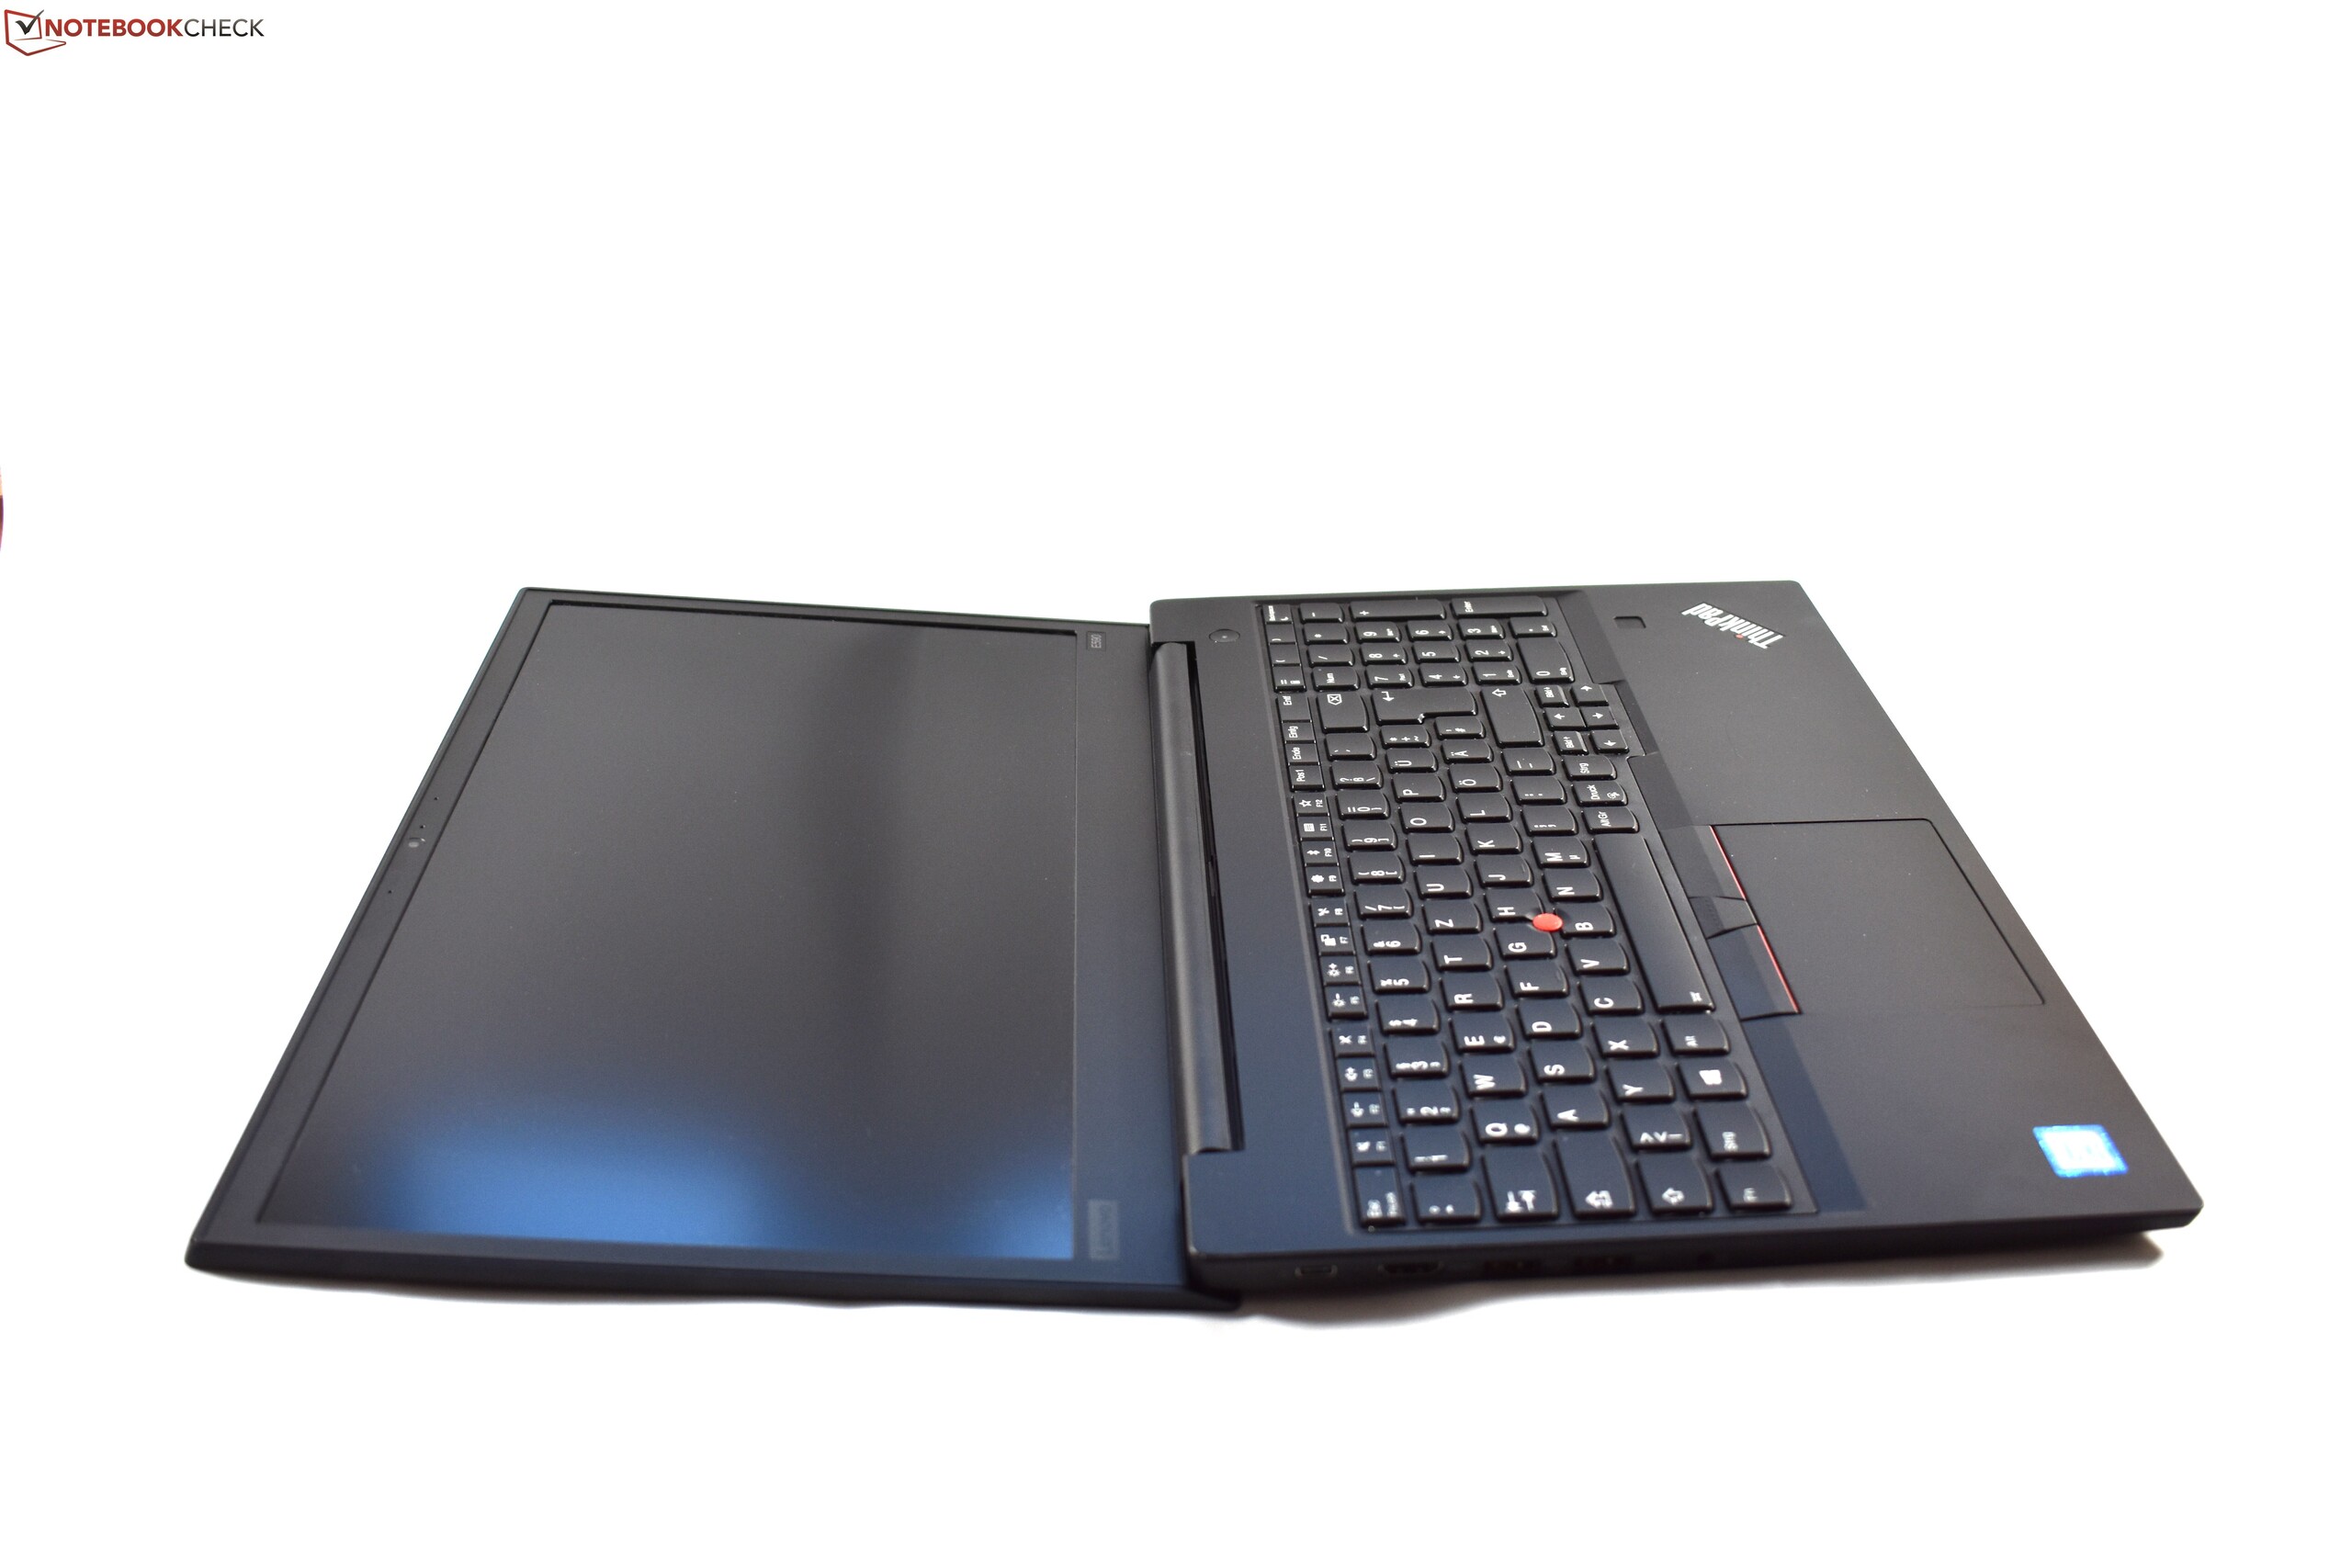
O Lenovo ThinkPad E590 é um dos portáteis empresariais mais acessíveis da Lenovo. Comparado com o ThinkPad E580, a Lenovo não mudou muitas coisas e como o seu predecessor, o ThinkPad E590 é um sólido portátil de escritório. Os pontos fortes deste portátil incluem o excelente teclado, bem como o típico TrackPoint ThinkPad, a excelente capacidade de expansão e o sistema de resfriamento extremamente silencioso, mesmo sob carga. O E590 também permanece frio sob uso intenso e o desempenho da CPU melhorou em comparação com o predecessor. O chassi ainda é bem feito e de alta qualidade para um portátil mais econômico.
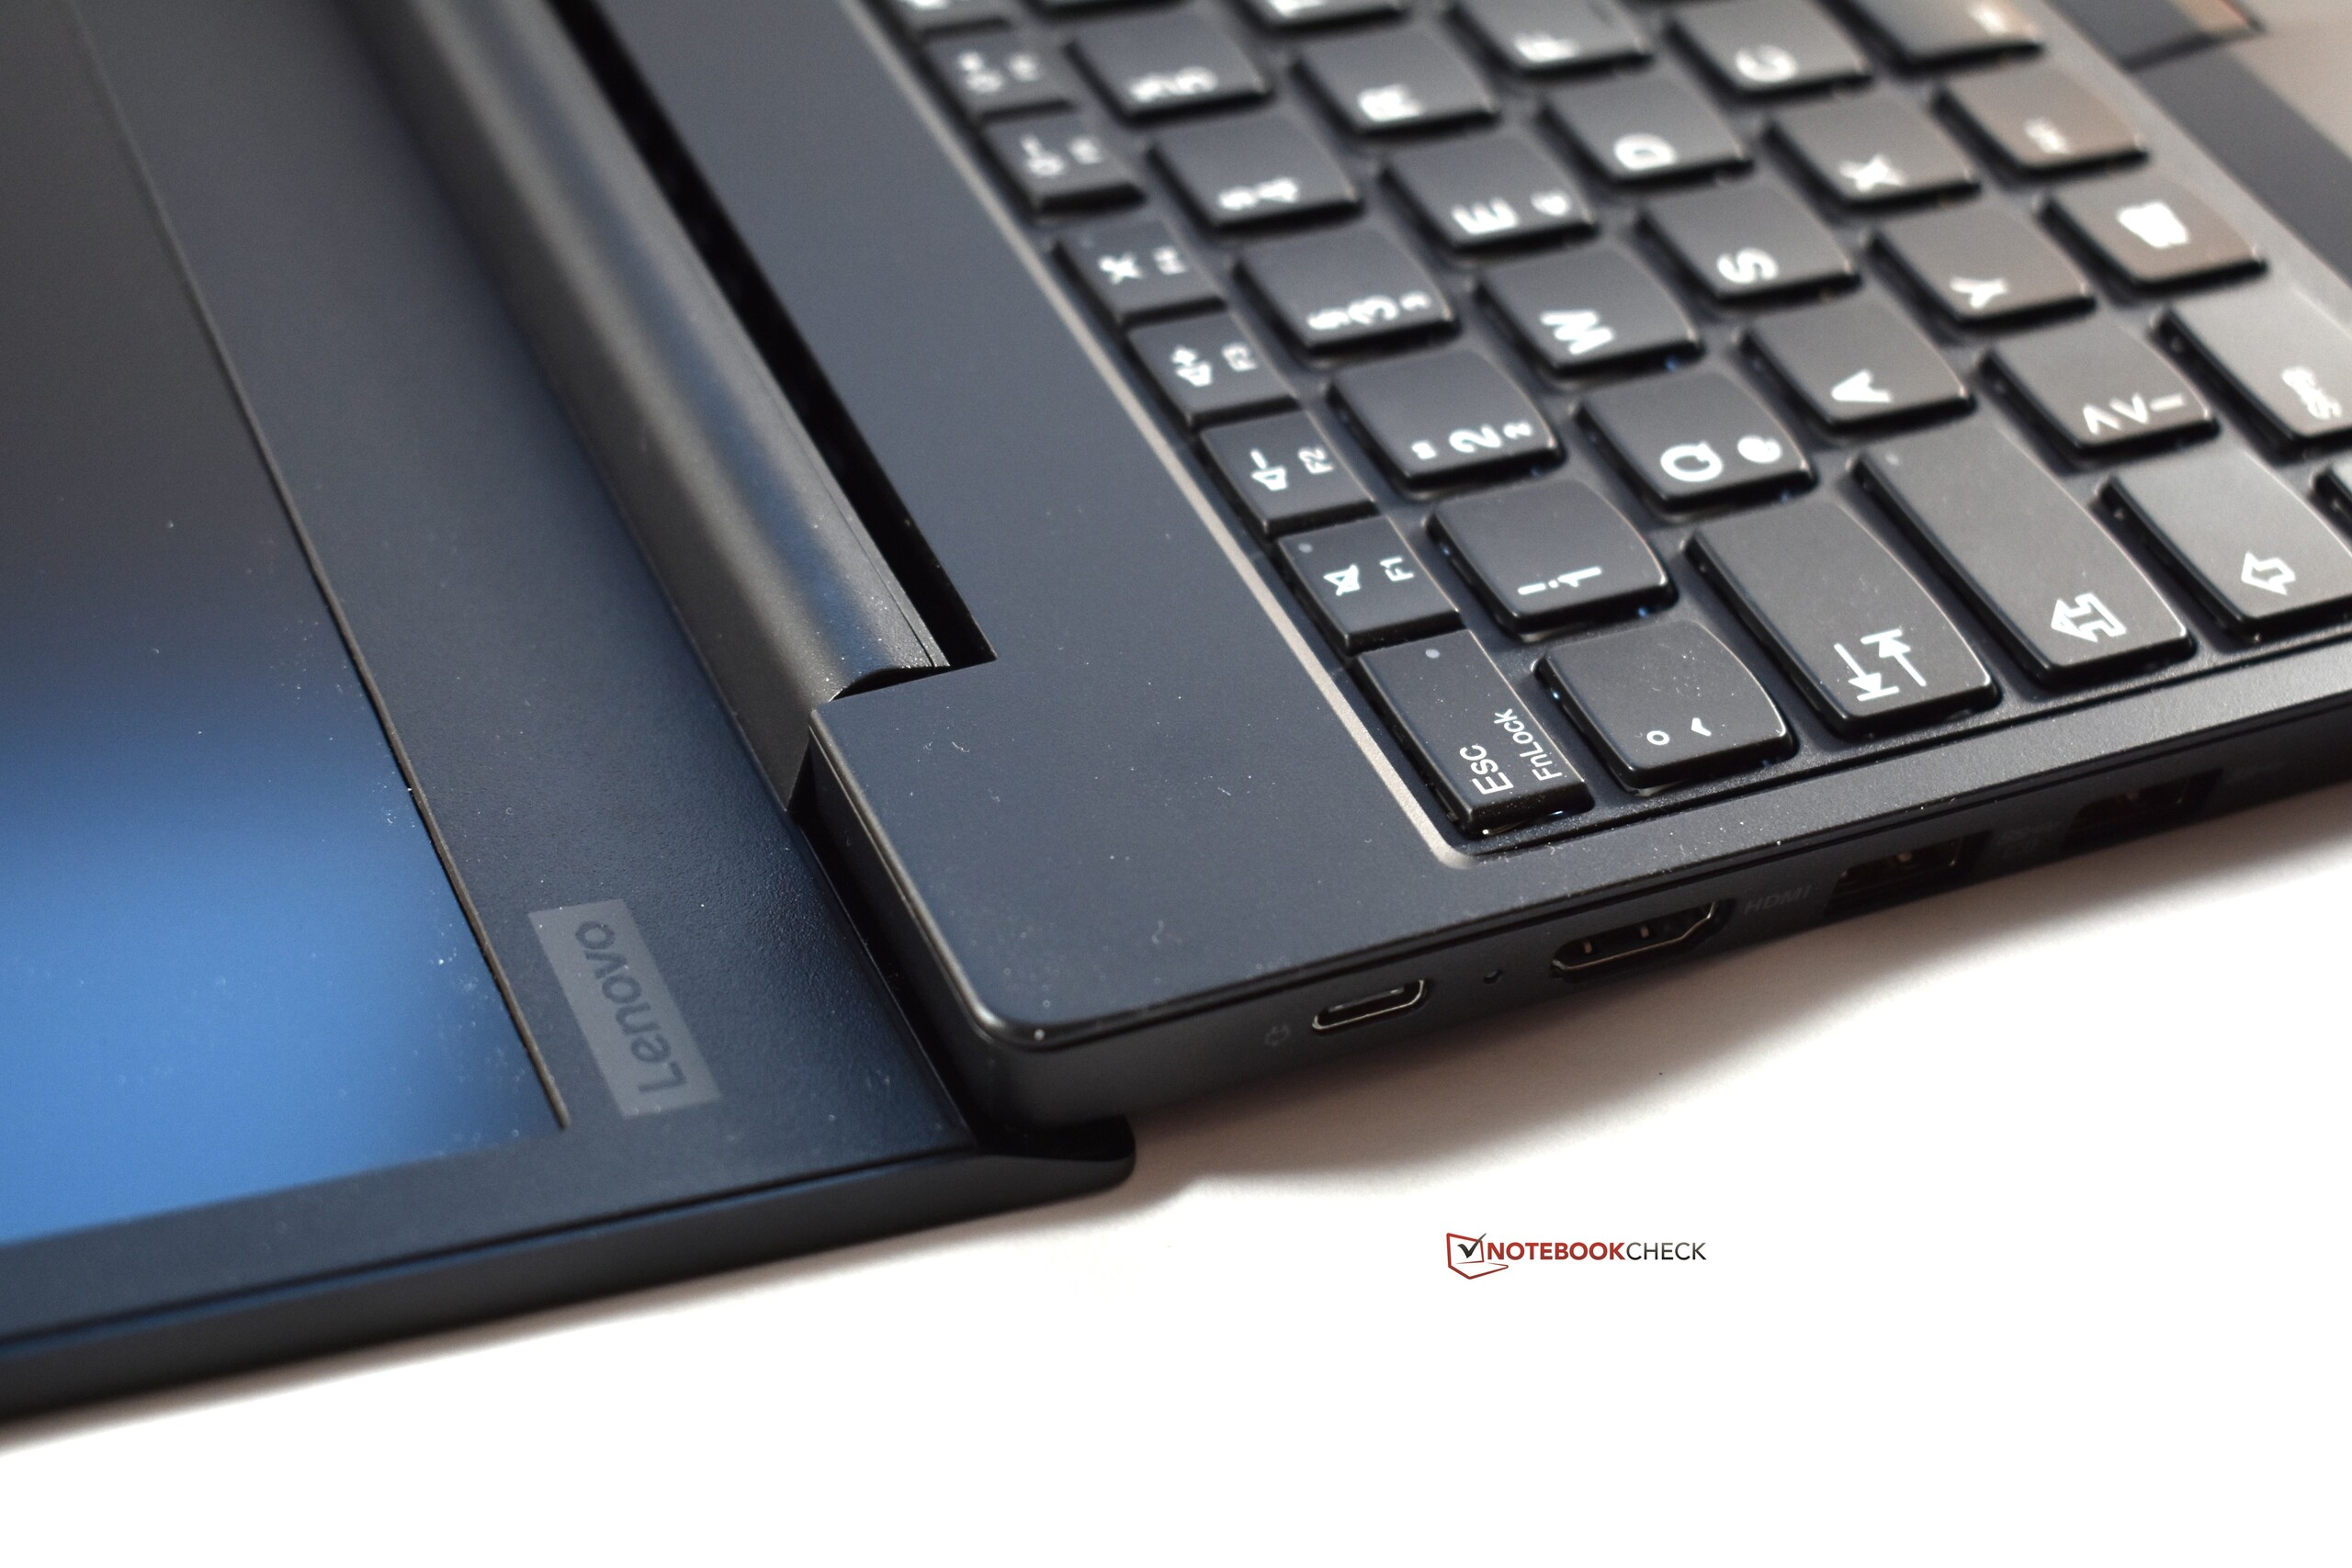
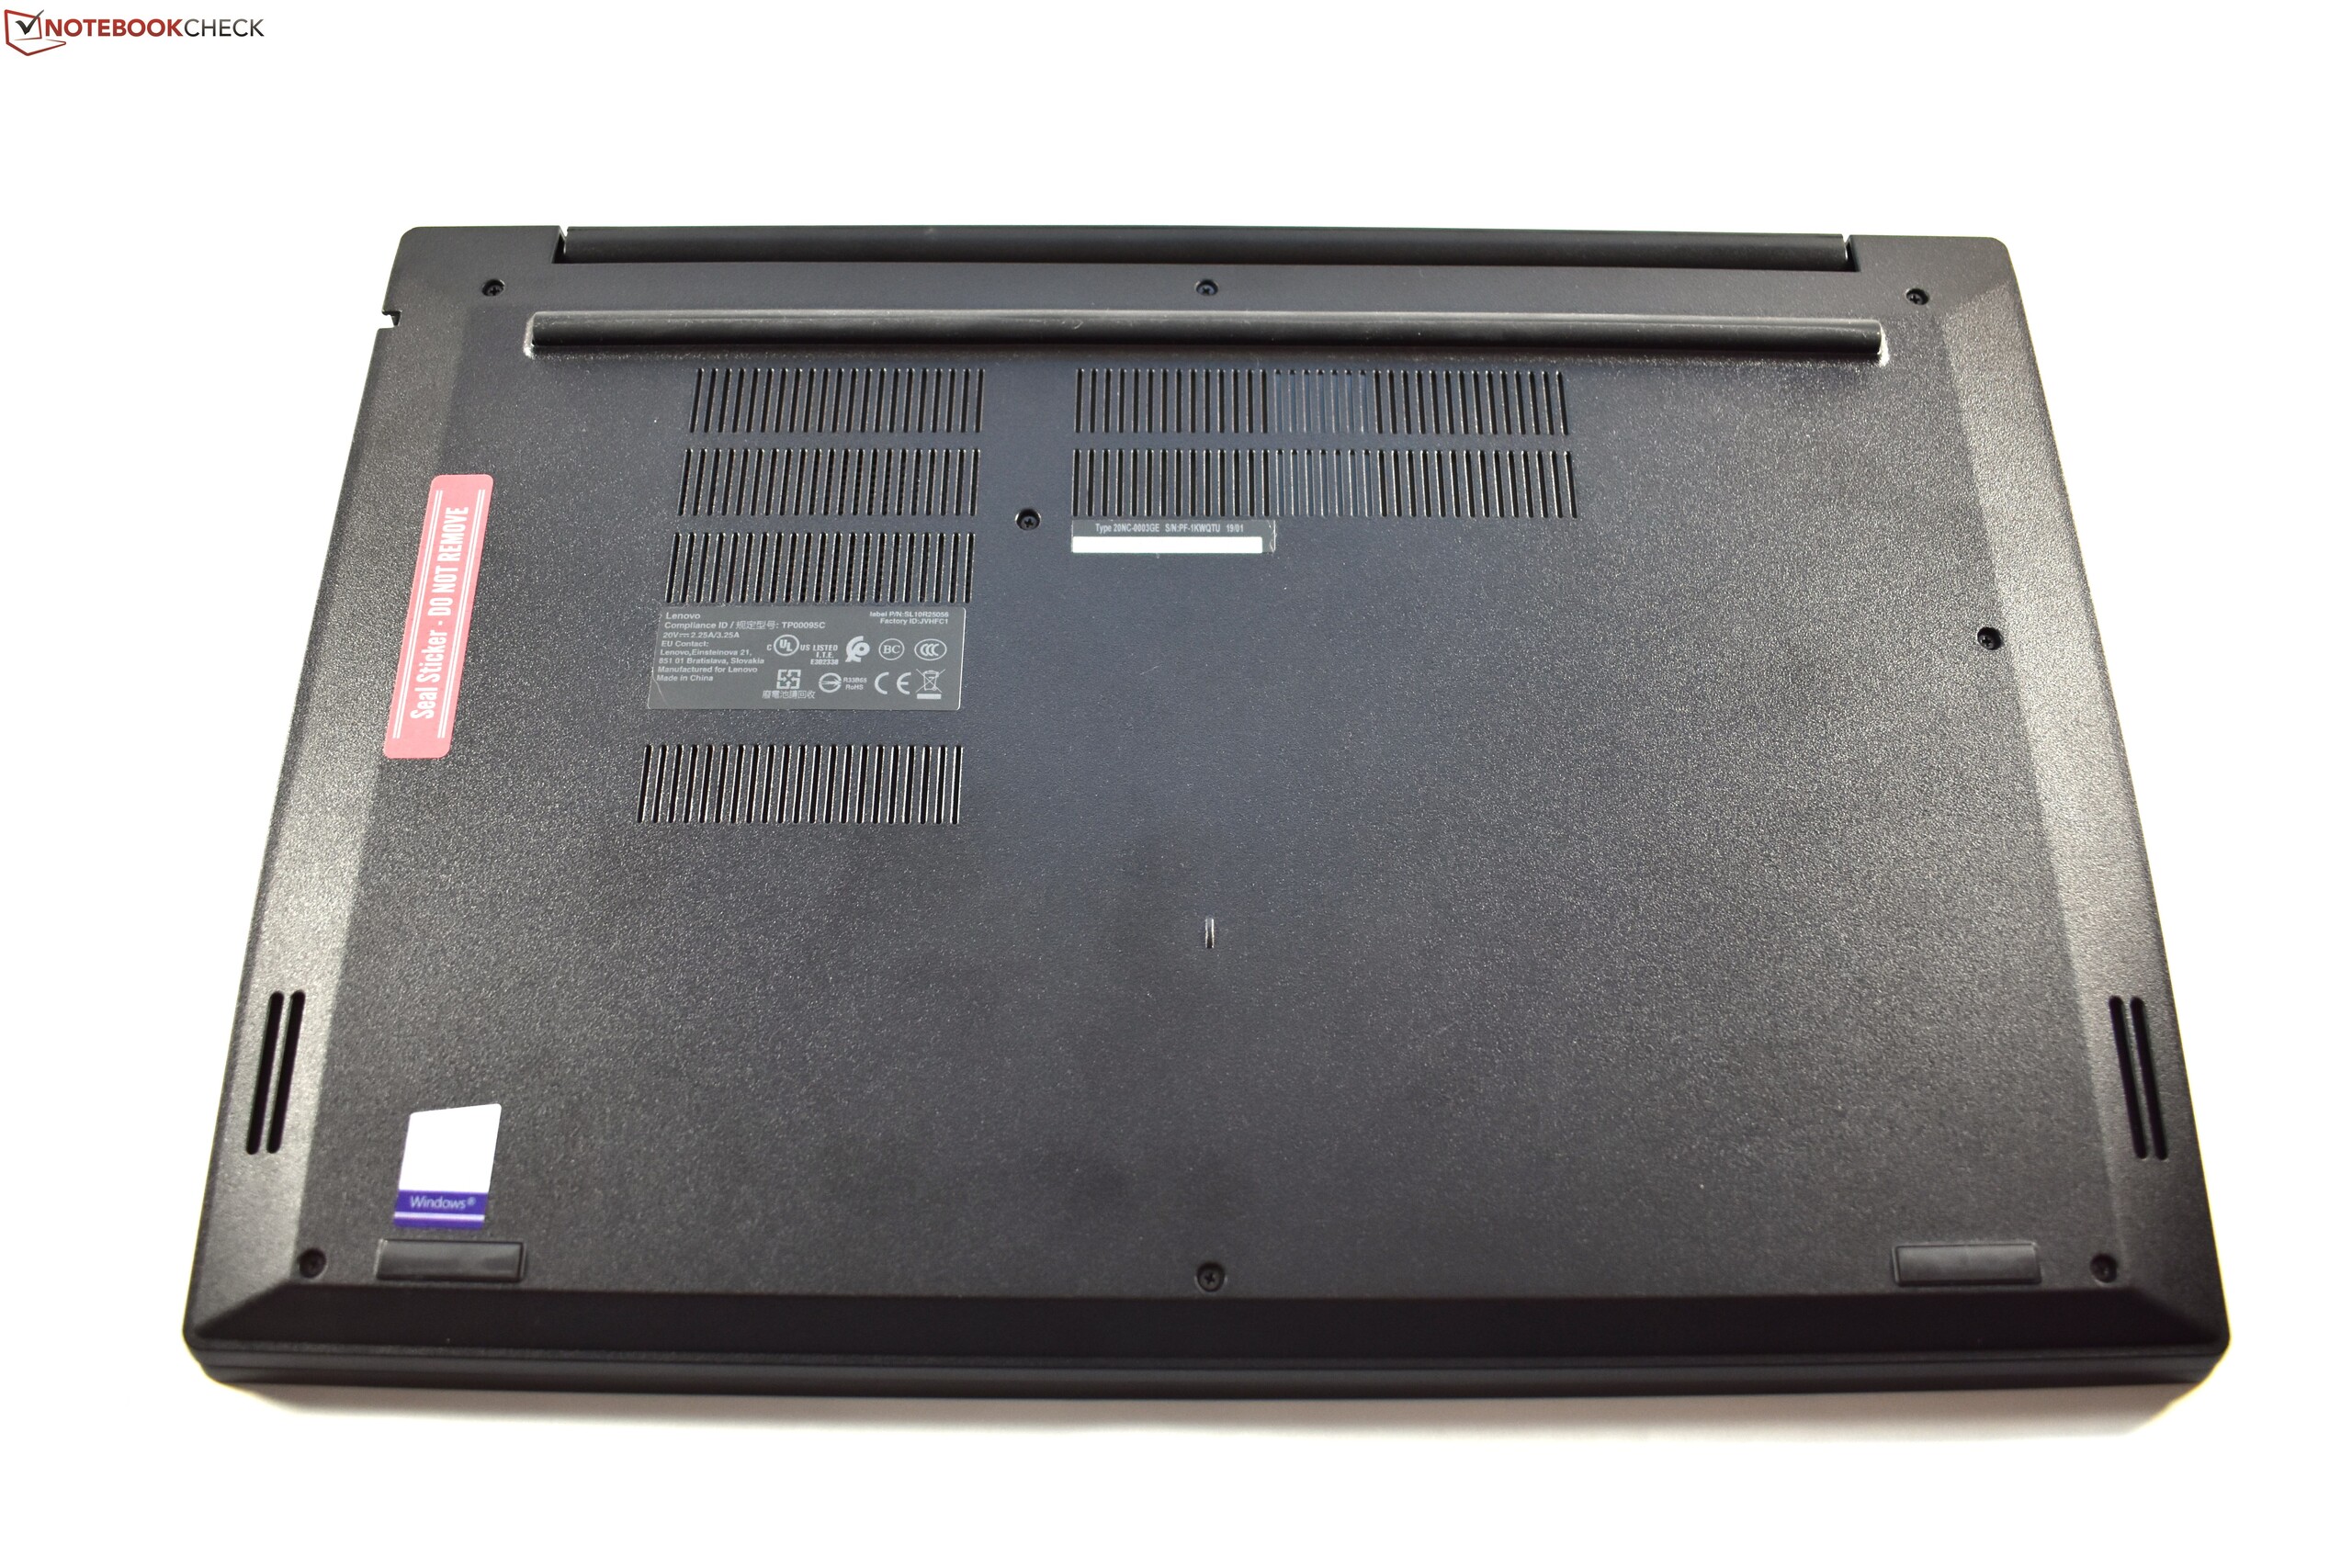
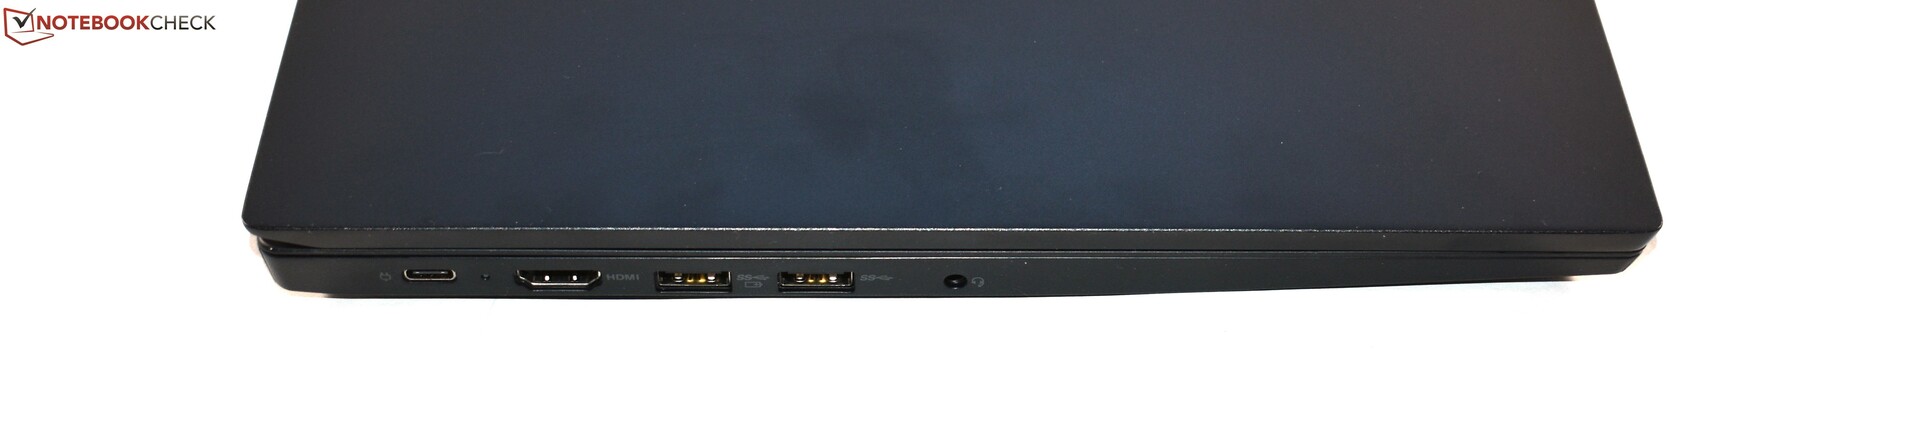
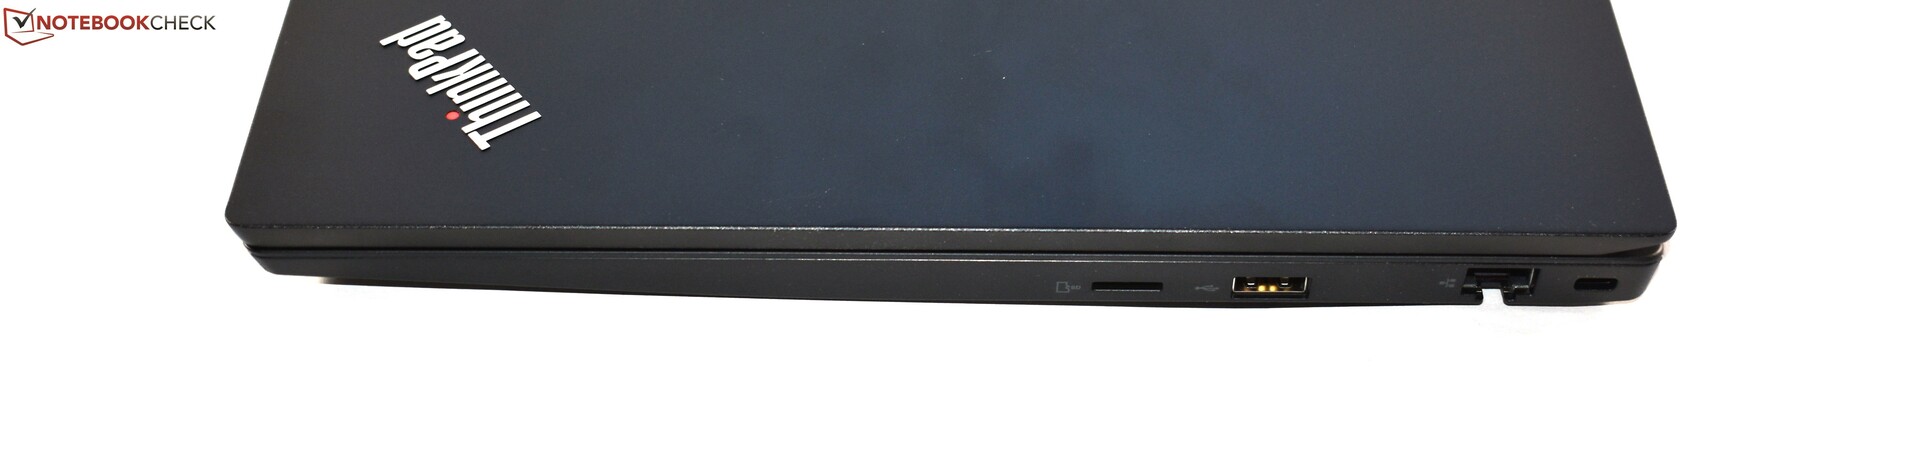
Não é de estranhar que o E590 não apenas compartilhe muitos de seus aspectos positivos com o E580, como também compartilha os aspectos negativos com seu predecessor. Por exemplo, o E590 ainda possui apenas um slot para cartão microSD, apesar de ter um chassi espaçoso. A duração da bateria é abaixo do esperado e a tela tem uma cobertura de gama de cores ruim, assim como bleeding da luz de fundo. Outro problema da nossa unidade de análise foi o SSD extremamente lento, que impactou até mesmo o uso diário. Além disso, achamos que a garantia de 12 meses é bastante curta e a porta USB no lado direito não deve ser limitada a USB 2.0 - o padrão USB 3.0 deveria ser padrão em 2019.
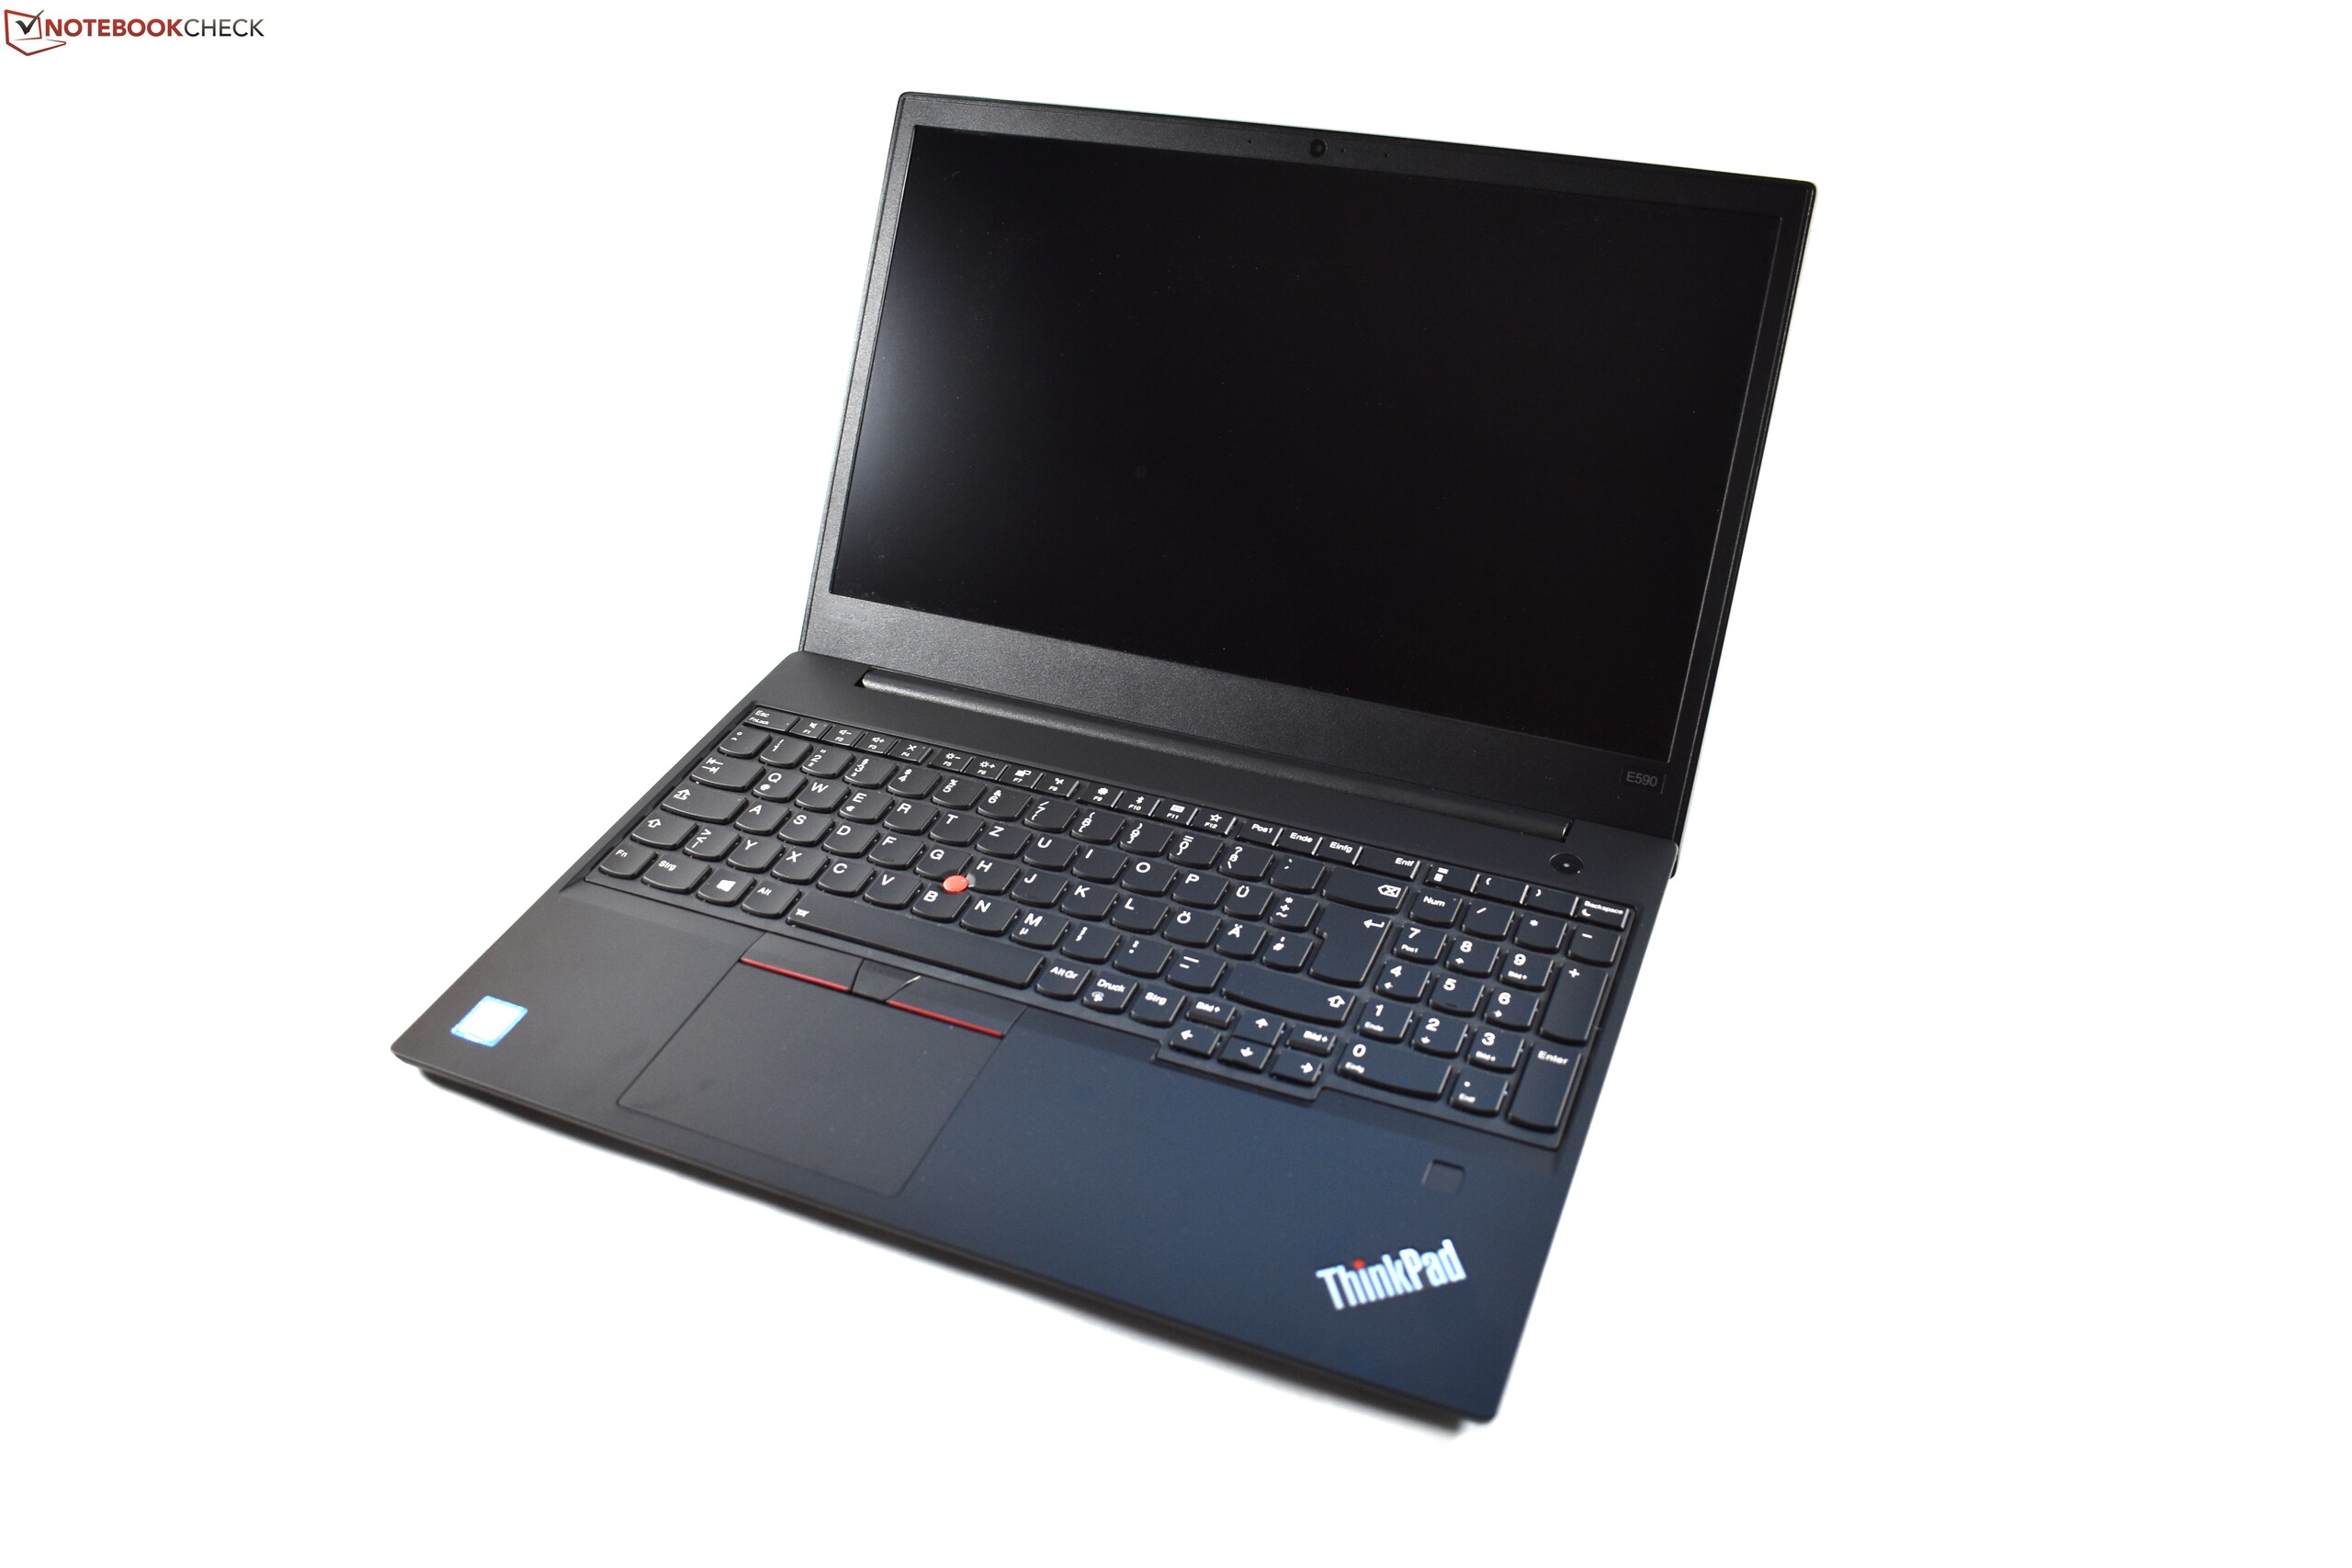
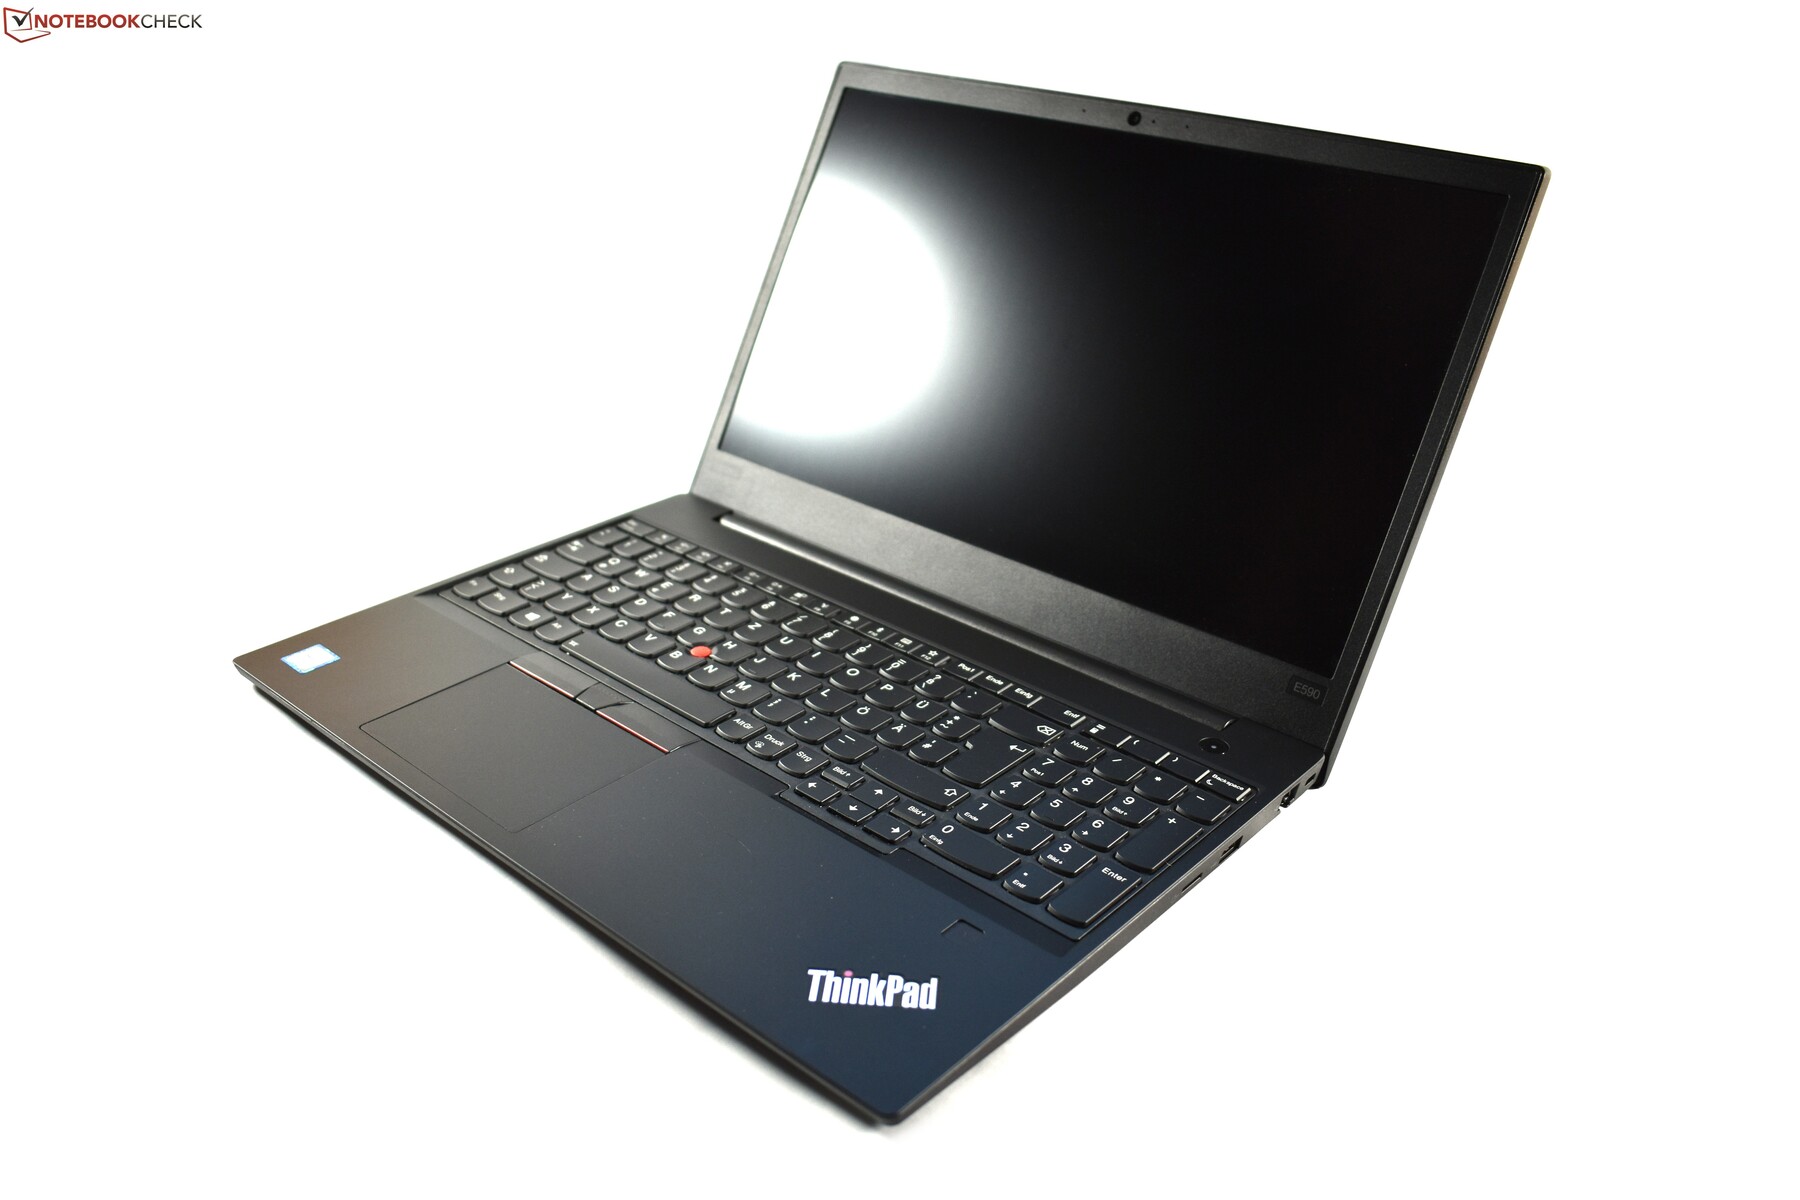
Sólido portátil ThinkPad de home-office por menos de 1.000 Euros (~$1.137): O Lenovo ThinkPad E590.
No geral, o modelo ThinkPad E590 iGPU é recomendado como um portátil de escritório de preço comparável - embora seu tamanho e peso, bem como a duração ruim da bateria, qualificam o E590 mais para o home-office do que um uso mais móvel. Além disso, os compradores devem estar atentos quando se trata do SSD, pois não recomendamos o SSD Toshiba que a Lenovo utilizou em nosso dispositivo de análise. Infelizmente, neste caso, o usuário tem que jogar na loteria em relação às peças que estão instaladas.
Lenovo ThinkPad E590-20NC0003GE
- 09/26/2019 v7 (old)
Benjamin Herzig
Price comparison
