Breve Análise do Portátil Lenovo ThinkPad T480 (Core i7-8650U, FHD)
| SD Card Reader | |
| average JPG Copy Test (av. of 3 runs) | |
| Lenovo ThinkPad X1 Carbon 2018-20KGS03900 (Toshiba Exceria Pro M501) | |
| Dell Latitude 7490 (Toshiba Exceria Pro M501 UHS-II) | |
| Lenovo ThinkPad T480s-20L7002AUS (Toshiba Exceria Pro SDXC 64 GB UHS-II) | |
| Lenovo ThinkPad T480-20L50010US (Toshiba Exceria Pro SDXC 64 GB UHS-II) | |
| Média da turma Office (19.8 - 198.5, n=22, últimos 2 anos) | |
| maximum AS SSD Seq Read Test (1GB) | |
| Lenovo ThinkPad X1 Carbon 2018-20KGS03900 (Toshiba Exceria Pro M501) | |
| Dell Latitude 7490 (Toshiba Exceria Pro M501 UHS-II) | |
| Lenovo ThinkPad T480s-20L7002AUS (Toshiba Exceria Pro SDXC 64 GB UHS-II) | |
| Lenovo ThinkPad T480-20L50010US (Toshiba Exceria Pro SDXC 64 GB UHS-II) | |
| Média da turma Office (27.4 - 249, n=21, últimos 2 anos) | |
| |||||||||||||||||||||||||
iluminação: 90 %
iluminação com acumulador: 276.7 cd/m²
Contraste: 1318:1 (Preto: 0.21 cd/m²)
ΔE ColorChecker Calman: 7.22 | ∀{0.5-29.43 Ø4.71}
calibrated: 5.01
ΔE Greyscale Calman: 6.7 | ∀{0.09-98 Ø4.96}
54% sRGB (Argyll 1.6.3 3D)
34% AdobeRGB 1998 (Argyll 1.6.3 3D)
37.51% AdobeRGB 1998 (Argyll 3D)
54.5% sRGB (Argyll 3D)
36.31% Display P3 (Argyll 3D)
Gamma: 2.321
CCT: 6656 K
| Lenovo ThinkPad T480-20L50010US B140HAK01.0, TFT-LCD, 14", 1920x1080 | Lenovo ThinkPad T480s-20L7002AUS NV140FHM-N46, TFT-LCD, 14", 1920x1080 | Dell Latitude 7490 AU Optronics AU0223D, IPS, 14", 1920x1080 | HP EliteBook 840 G5-3JX61EA IVO M140NVF7 R0, IPS, 14", 1920x1080 | Lenovo ThinkPad X1 Carbon 2018-20KGS03900 B140QAN02.0, IPS, 14", 2560x1440 | |
|---|---|---|---|---|---|
| Display | 9% | 70% | 65% | 130% | |
| Display P3 Coverage (%) | 36.31 | 39.69 9% | 63.6 75% | 61 68% | 87.7 142% |
| sRGB Coverage (%) | 54.5 | 59.2 9% | 88.8 63% | 87.7 61% | 100 83% |
| AdobeRGB 1998 Coverage (%) | 37.51 | 41 9% | 64.8 73% | 62.1 66% | 99.9 166% |
| Response Times | -11% | -14% | 16% | -32% | |
| Response Time Grey 50% / Grey 80% * (ms) | 39.2 ? | 44 ? -12% | 48.4 ? -23% | 33 ? 16% | 59.2 ? -51% |
| Response Time Black / White * (ms) | 30.8 ? | 34 ? -10% | 32.4 ? -5% | 26 ? 16% | 34.4 ? -12% |
| PWM Frequency (Hz) | 990 | 3125 ? | |||
| Screen | 8% | 24% | 41% | 61% | |
| Brightness middle (cd/m²) | 276.7 | 288.3 4% | 328.2 19% | 655 137% | 578 109% |
| Brightness (cd/m²) | 272 | 281 3% | 305 12% | 630 132% | 533 96% |
| Brightness Distribution (%) | 90 | 86 -4% | 87 -3% | 93 3% | 84 -7% |
| Black Level * (cd/m²) | 0.21 | 0.21 -0% | 0.37 -76% | 0.56 -167% | 0.38 -81% |
| Contrast (:1) | 1318 | 1373 4% | 887 -33% | 1170 -11% | 1521 15% |
| Colorchecker dE 2000 * | 7.22 | 6.16 15% | 3.82 47% | 3.27 55% | 1.9 74% |
| Colorchecker dE 2000 max. * | 25.87 | 18.99 27% | 5.58 78% | 5.92 77% | 3.8 85% |
| Colorchecker dE 2000 calibrated * | 5.01 | 4.51 10% | 3.5 30% | 3.22 36% | 0.8 84% |
| Greyscale dE 2000 * | 6.7 | 6.3 6% | 3 55% | 2.85 57% | 3 55% |
| Gamma | 2.321 95% | 2.517 87% | 2.36 93% | 2.45 90% | 2.14 103% |
| CCT | 6656 98% | 6886 94% | 6962 93% | 6065 107% | 6377 102% |
| Color Space (Percent of AdobeRGB 1998) (%) | 34 | 37.67 11% | 58 71% | 57 68% | 88.8 161% |
| Color Space (Percent of sRGB) (%) | 54 | 58.9 9% | 88 63% | 88 63% | 100 85% |
| Média Total (Programa/Configurações) | 2% /
6% | 27% /
28% | 41% /
42% | 53% /
63% |
* ... menor é melhor
Exibir tempos de resposta
| ↔ Tempo de resposta preto para branco | ||
|---|---|---|
| 30.8 ms ... ascensão ↗ e queda ↘ combinadas | ↗ 18 ms ascensão | 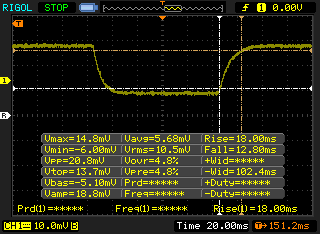 |
| ↘ 12.8 ms queda | ||
| A tela mostra taxas de resposta lentas em nossos testes e será insatisfatória para os jogadores. Em comparação, todos os dispositivos testados variam de 0.1 (mínimo) a 240 (máximo) ms. » 83 % de todos os dispositivos são melhores. Isso significa que o tempo de resposta medido é pior que a média de todos os dispositivos testados (19.8 ms). | ||
| ↔ Tempo de resposta 50% cinza a 80% cinza | ||
| 39.2 ms ... ascensão ↗ e queda ↘ combinadas | ↗ 22 ms ascensão | 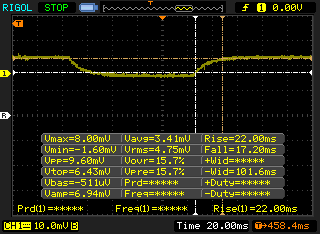 |
| ↘ 17.2 ms queda | ||
| A tela mostra taxas de resposta lentas em nossos testes e será insatisfatória para os jogadores. Em comparação, todos os dispositivos testados variam de 0.165 (mínimo) a 636 (máximo) ms. » 60 % de todos os dispositivos são melhores. Isso significa que o tempo de resposta medido é pior que a média de todos os dispositivos testados (31 ms). | ||
Cintilação da tela / PWM (modulação por largura de pulso)
| Tela tremeluzindo / PWM não detectado | 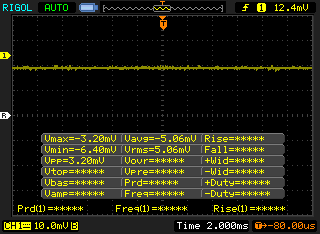 | ||
[pwm_comparison] Em comparação: 52 % de todos os dispositivos testados não usam PWM para escurecer a tela. Se PWM foi detectado, uma média de 7754 (mínimo: 5 - máximo: 343500) Hz foi medida. | |||
| PCMark 8 Home Score Accelerated v2 | 3846 pontos | |
| PCMark 10 Score | 4027 pontos | |
Ajuda | ||
| Lenovo ThinkPad T480-20L50010US Samsung SSD PM981 MZVLB512HAJQ | Lenovo ThinkPad T480s-20L7002AUS Samsung PM961 MZVLW256HEHP | Dell Latitude 7490 Samsung PM961 MZVLW256HEHP | HP EliteBook 840 G5-3JX61EA Toshiba KXG50ZNV1T02 | Lenovo ThinkPad X1 Carbon 2018-20KGS03900 Samsung SSD PM981 MZVLB512HAJQ | Média Samsung SSD PM981 MZVLB512HAJQ | |
|---|---|---|---|---|---|---|
| AS SSD | -18% | -18% | -31% | 5% | -13% | |
| Copy Game MB/s (MB/s) | 382.3 | 905 | 1107 | 1057 ? | ||
| Copy Program MB/s (MB/s) | 227.1 | 326.2 | 460.2 | 454 ? | ||
| Copy ISO MB/s (MB/s) | 872 | 1688 | 1247 | 1755 ? | ||
| Score Total (Points) | 4425 | 3048 -31% | 2350 -47% | 2630 -41% | 3529 -20% | 3966 ? -10% |
| Score Write (Points) | 1945 | 921 -53% | 536 -72% | 1084 -44% | 1801 -7% | 1780 ? -8% |
| Score Read (Points) | 1639 | 1435 -12% | 1242 -24% | 1070 -35% | 1168 -29% | 1451 ? -11% |
| Access Time Write * (ms) | 0.035 | 0.038 -9% | 0.03 14% | 0.055 -57% | 0.027 23% | 0.08337 ? -138% |
| Access Time Read * (ms) | 0.045 | 0.055 -22% | 0.04 11% | 0.059 -31% | 0.029 36% | 0.05092 ? -13% |
| 4K-64 Write (MB/s) | 1704 | 706 -59% | 329.6 -81% | 908 -47% | 1529 -10% | 1504 ? -12% |
| 4K-64 Read (MB/s) | 1447 | 1183 -18% | 955 -34% | 813 -44% | 876 -39% | 1203 ? -17% |
| 4K Write (MB/s) | 107.4 | 97.8 -9% | 114.9 7% | 90 -16% | 134.3 25% | 112 ? 4% |
| 4K Read (MB/s) | 50.5 | 42.09 -17% | 48.13 -5% | 26.75 -47% | 52.4 4% | 50.5 ? 0% |
| Seq Write (MB/s) | 1341 | 1172 -13% | 919 -31% | 856 -36% | 1376 3% | 1637 ? 22% |
| Seq Read (MB/s) | 1420 | 2094 47% | 2385 68% | 2300 62% | 2396 69% | 1976 ? 39% |
* ... menor é melhor

| 3DMark 11 Performance | 1978 pontos | |
Ajuda | ||
| baixo | média | alto | ultra | |
|---|---|---|---|---|
| BioShock Infinite (2013) | 63 | 31 | 27 | 9 |
Barulho
| Ocioso |
| 28.3 / 28.3 / 28.3 dB |
| Carga |
| 35.7 / 38.8 dB |
 | ||
30 dB silencioso 40 dB(A) audível 50 dB(A) ruidosamente alto |
||
min: | ||
| Lenovo ThinkPad T480-20L50010US UHD Graphics 620, i7-8650U, Samsung SSD PM981 MZVLB512HAJQ | Lenovo ThinkPad T480s-20L7002AUS UHD Graphics 620, i5-8250U, Samsung PM961 MZVLW256HEHP | Lenovo ThinkPad T480-20L6S01V00 GeForce MX150, i5-8550U, Samsung SSD PM981 MZVLB512HAJQ | Dell Latitude 7490 UHD Graphics 620, i7-8650U, Samsung PM961 MZVLW256HEHP | HP EliteBook 840 G5-3JX61EA UHD Graphics 620, i5-8550U, Toshiba KXG50ZNV1T02 | Lenovo ThinkPad X1 Carbon 2018-20KGS03900 UHD Graphics 620, i5-8550U, Samsung SSD PM981 MZVLB512HAJQ | |
|---|---|---|---|---|---|---|
| Noise | -0% | 0% | -1% | -2% | -2% | |
| desligado / ambiente * (dB) | 28.3 | 28.1 1% | 29 -2% | 28.2 -0% | 30.3 -7% | 28.9 -2% |
| Idle Minimum * (dB) | 28.3 | 28.1 1% | 29 -2% | 28.2 -0% | 30.3 -7% | 28.9 -2% |
| Idle Average * (dB) | 28.3 | 28.1 1% | 29 -2% | 28.2 -0% | 30.3 -7% | 28.9 -2% |
| Idle Maximum * (dB) | 28.3 | 28.1 1% | 29 -2% | 31.4 -11% | 30.3 -7% | 32.5 -15% |
| Load Average * (dB) | 35.7 | 35.5 1% | 35.6 -0% | 31.7 11% | 33.8 5% | 35.1 2% |
| Load Maximum * (dB) | 38.8 | 41.5 -7% | 35.6 8% | 41.2 -6% | 33.8 13% | 35.1 10% |
| Witcher 3 ultra * (dB) | 32.5 |
* ... menor é melhor
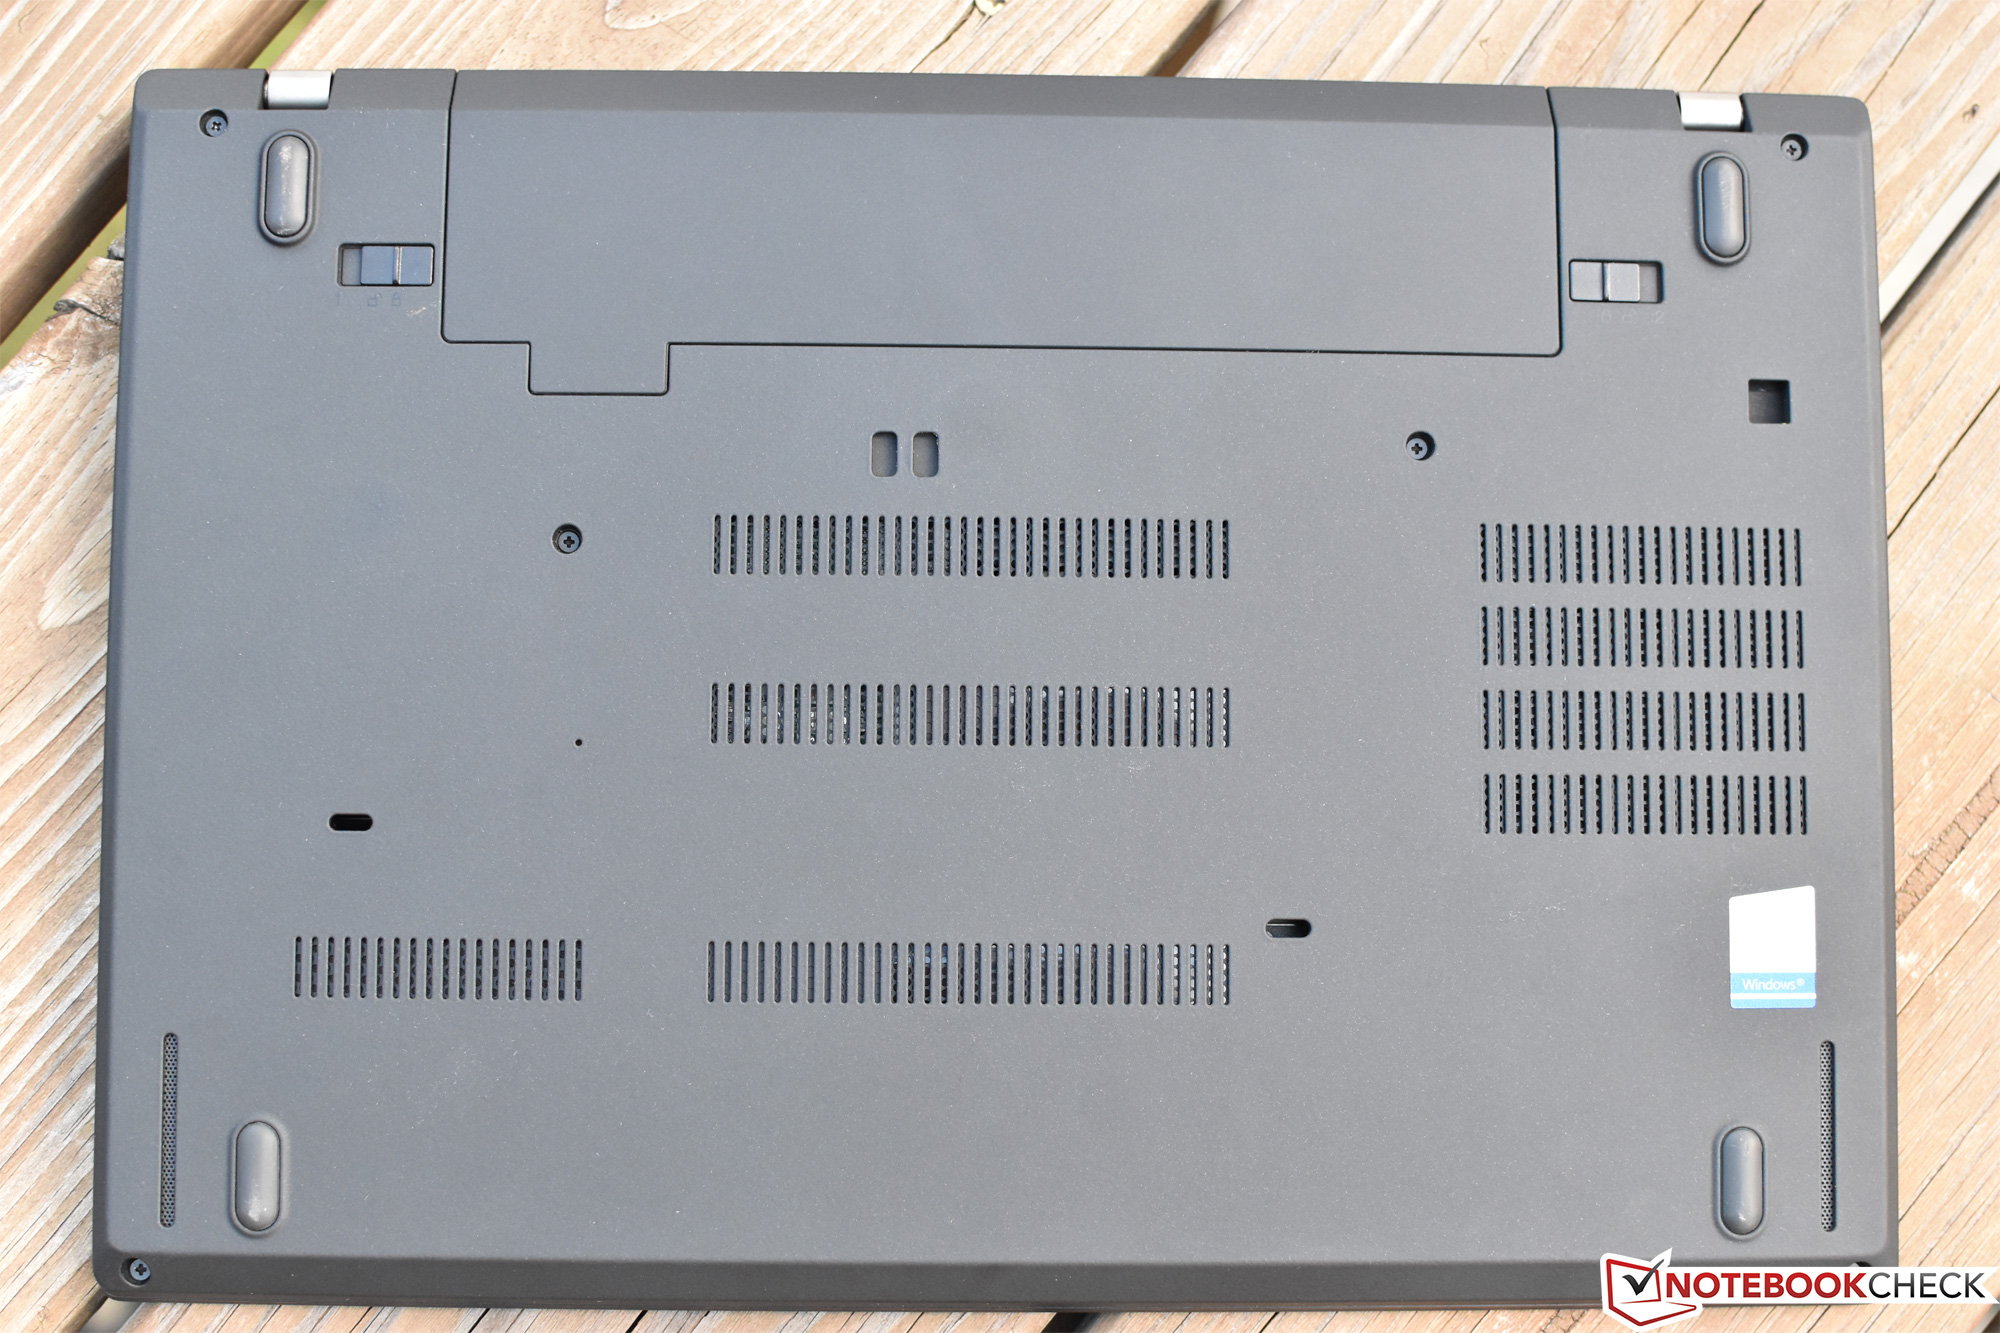
(±) A temperatura máxima no lado superior é 40.2 °C / 104 F, em comparação com a média de 34.3 °C / 94 F , variando de 21.2 a 62.5 °C para a classe Office.
(-) A parte inferior aquece até um máximo de 54.6 °C / 130 F, em comparação com a média de 36.8 °C / 98 F
(+) Em uso inativo, a temperatura média para o lado superior é 26.2 °C / 79 F, em comparação com a média do dispositivo de 29.5 °C / ### class_avg_f### F.
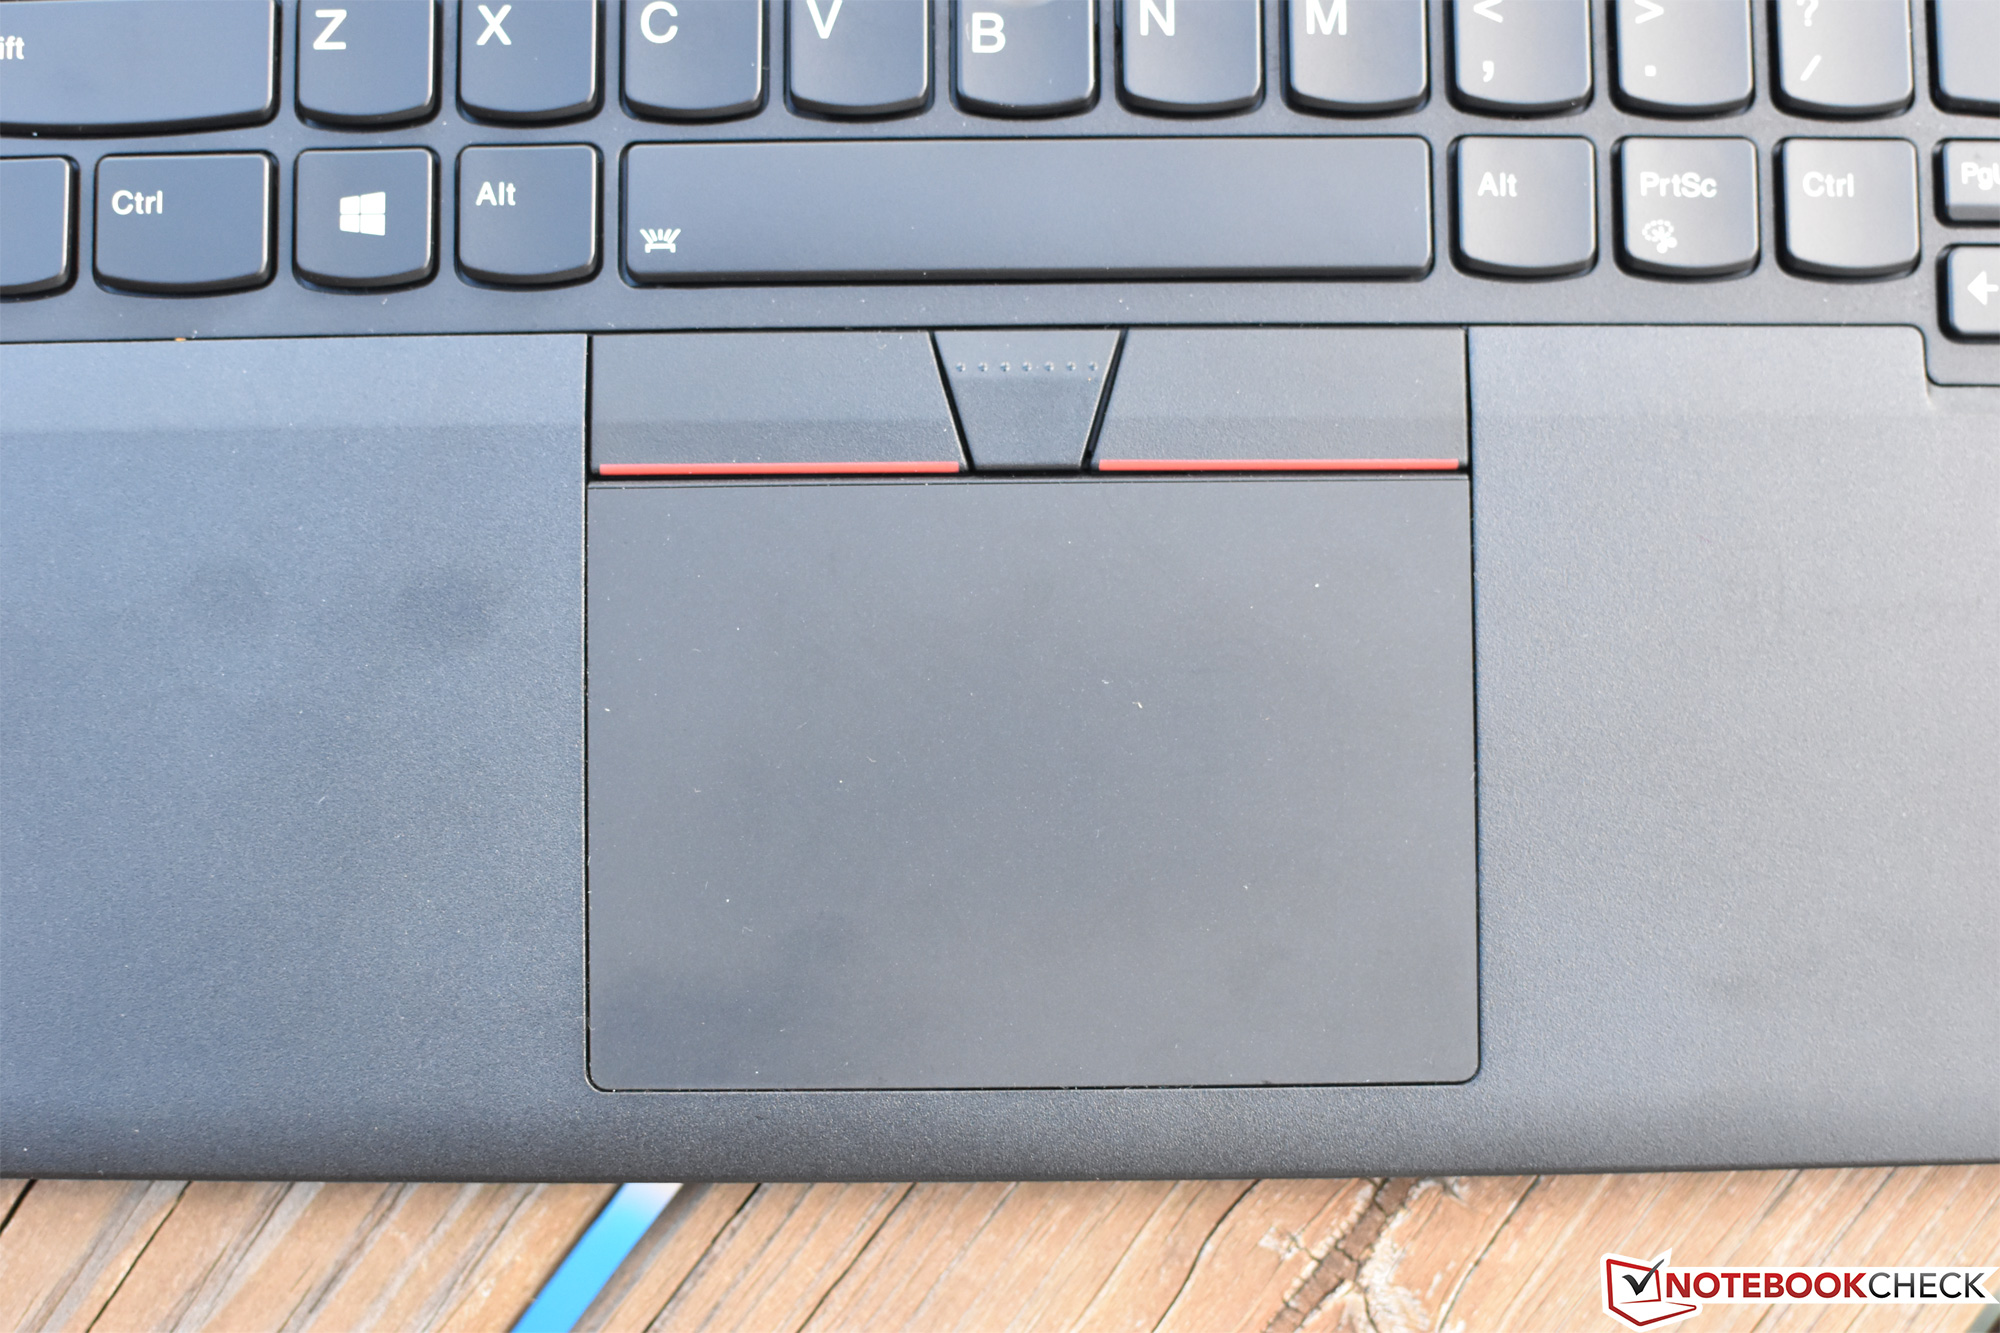
(+) Os apoios para as mãos e o touchpad são mais frios que a temperatura da pele, com um máximo de 30.4 °C / 86.7 F e, portanto, são frios ao toque.
(-) A temperatura média da área do apoio para as mãos de dispositivos semelhantes foi 27.5 °C / 81.5 F (-2.9 °C / -5.2 F).
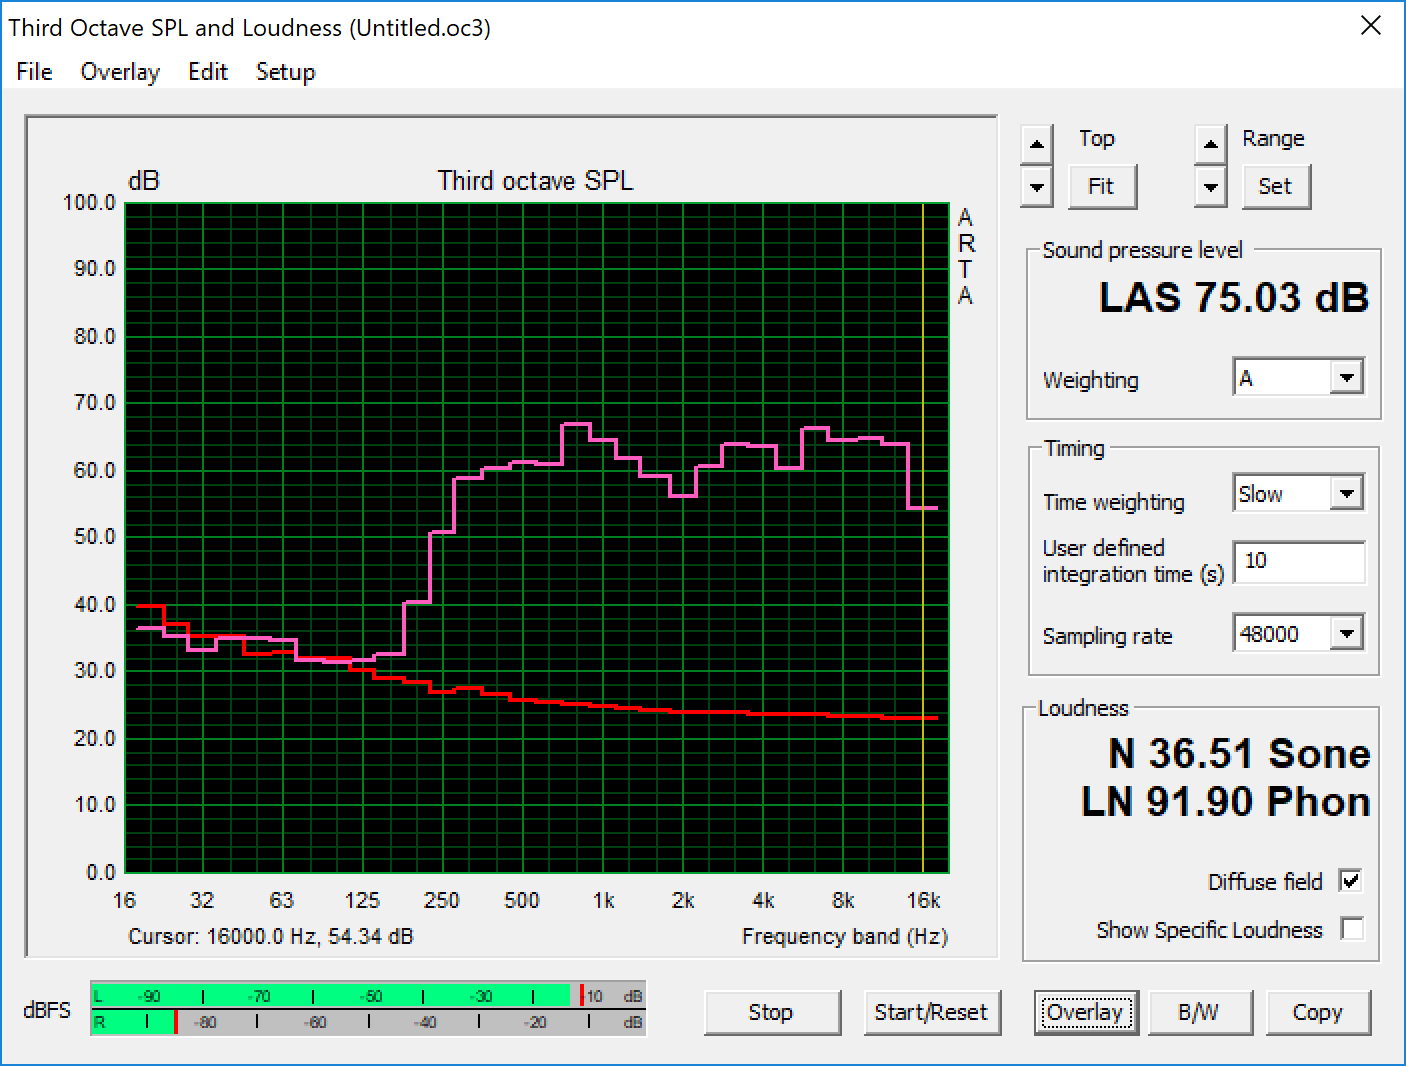
Lenovo ThinkPad T480-20L50010US análise de áudio
(±) | o volume do alto-falante é médio, mas bom (###valor### dB)
Graves 100 - 315Hz
(-) | quase nenhum baixo - em média 19.8% menor que a mediana
(±) | a linearidade dos graves é média (12.7% delta para a frequência anterior)
Médios 400 - 2.000 Hz
(+) | médios equilibrados - apenas 2.3% longe da mediana
(+) | médios são lineares (6.7% delta para frequência anterior)
Altos 2 - 16 kHz
(+) | agudos equilibrados - apenas 2.8% longe da mediana
(±) | a linearidade dos máximos é média (7.4% delta para frequência anterior)
Geral 100 - 16.000 Hz
(±) | a linearidade do som geral é média (22.6% diferença em relação à mediana)
Comparado com a mesma classe
» 61% de todos os dispositivos testados nesta classe foram melhores, 8% semelhantes, 31% piores
» O melhor teve um delta de 7%, a média foi 21%, o pior foi 53%
Comparado com todos os dispositivos testados
» 67% de todos os dispositivos testados foram melhores, 6% semelhantes, 28% piores
» O melhor teve um delta de 4%, a média foi 23%, o pior foi 134%
Dell Latitude 7490 análise de áudio
(±) | o volume do alto-falante é médio, mas bom (###valor### dB)
Graves 100 - 315Hz
(±) | graves reduzidos - em média 14.8% menor que a mediana
(±) | a linearidade dos graves é média (9.4% delta para a frequência anterior)
Médios 400 - 2.000 Hz
(+) | médios equilibrados - apenas 4.4% longe da mediana
(±) | a linearidade dos médios é média (8% delta para frequência anterior)
Altos 2 - 16 kHz
(+) | agudos equilibrados - apenas 4.4% longe da mediana
(±) | a linearidade dos máximos é média (8.2% delta para frequência anterior)
Geral 100 - 16.000 Hz
(±) | a linearidade do som geral é média (19.9% diferença em relação à mediana)
Comparado com a mesma classe
» 42% de todos os dispositivos testados nesta classe foram melhores, 9% semelhantes, 49% piores
» O melhor teve um delta de 7%, a média foi 21%, o pior foi 53%
Comparado com todos os dispositivos testados
» 51% de todos os dispositivos testados foram melhores, 7% semelhantes, 42% piores
» O melhor teve um delta de 4%, a média foi 23%, o pior foi 134%
| desligado | |
| Ocioso | |
| Carga |
|
Key:
min: | |
| Lenovo ThinkPad T480-20L50010US i7-8650U, UHD Graphics 620, Samsung SSD PM981 MZVLB512HAJQ, TFT-LCD, 1920x1080, 14" | Lenovo ThinkPad T480s-20L7002AUS i5-8250U, UHD Graphics 620, Samsung PM961 MZVLW256HEHP, TFT-LCD, 1920x1080, 14" | Lenovo ThinkPad T480-20L6S01V00 i5-8550U, GeForce MX150, Samsung SSD PM981 MZVLB512HAJQ, IPS, 1920x1080, 14" | Dell Latitude 7490 i7-8650U, UHD Graphics 620, Samsung PM961 MZVLW256HEHP, IPS, 1920x1080, 14" | HP EliteBook 840 G5-3JX61EA i5-8550U, UHD Graphics 620, Toshiba KXG50ZNV1T02, IPS, 1920x1080, 14" | Lenovo ThinkPad X1 Carbon 2018-20KGS03900 i5-8550U, UHD Graphics 620, Samsung SSD PM981 MZVLB512HAJQ, IPS, 2560x1440, 14" | |
|---|---|---|---|---|---|---|
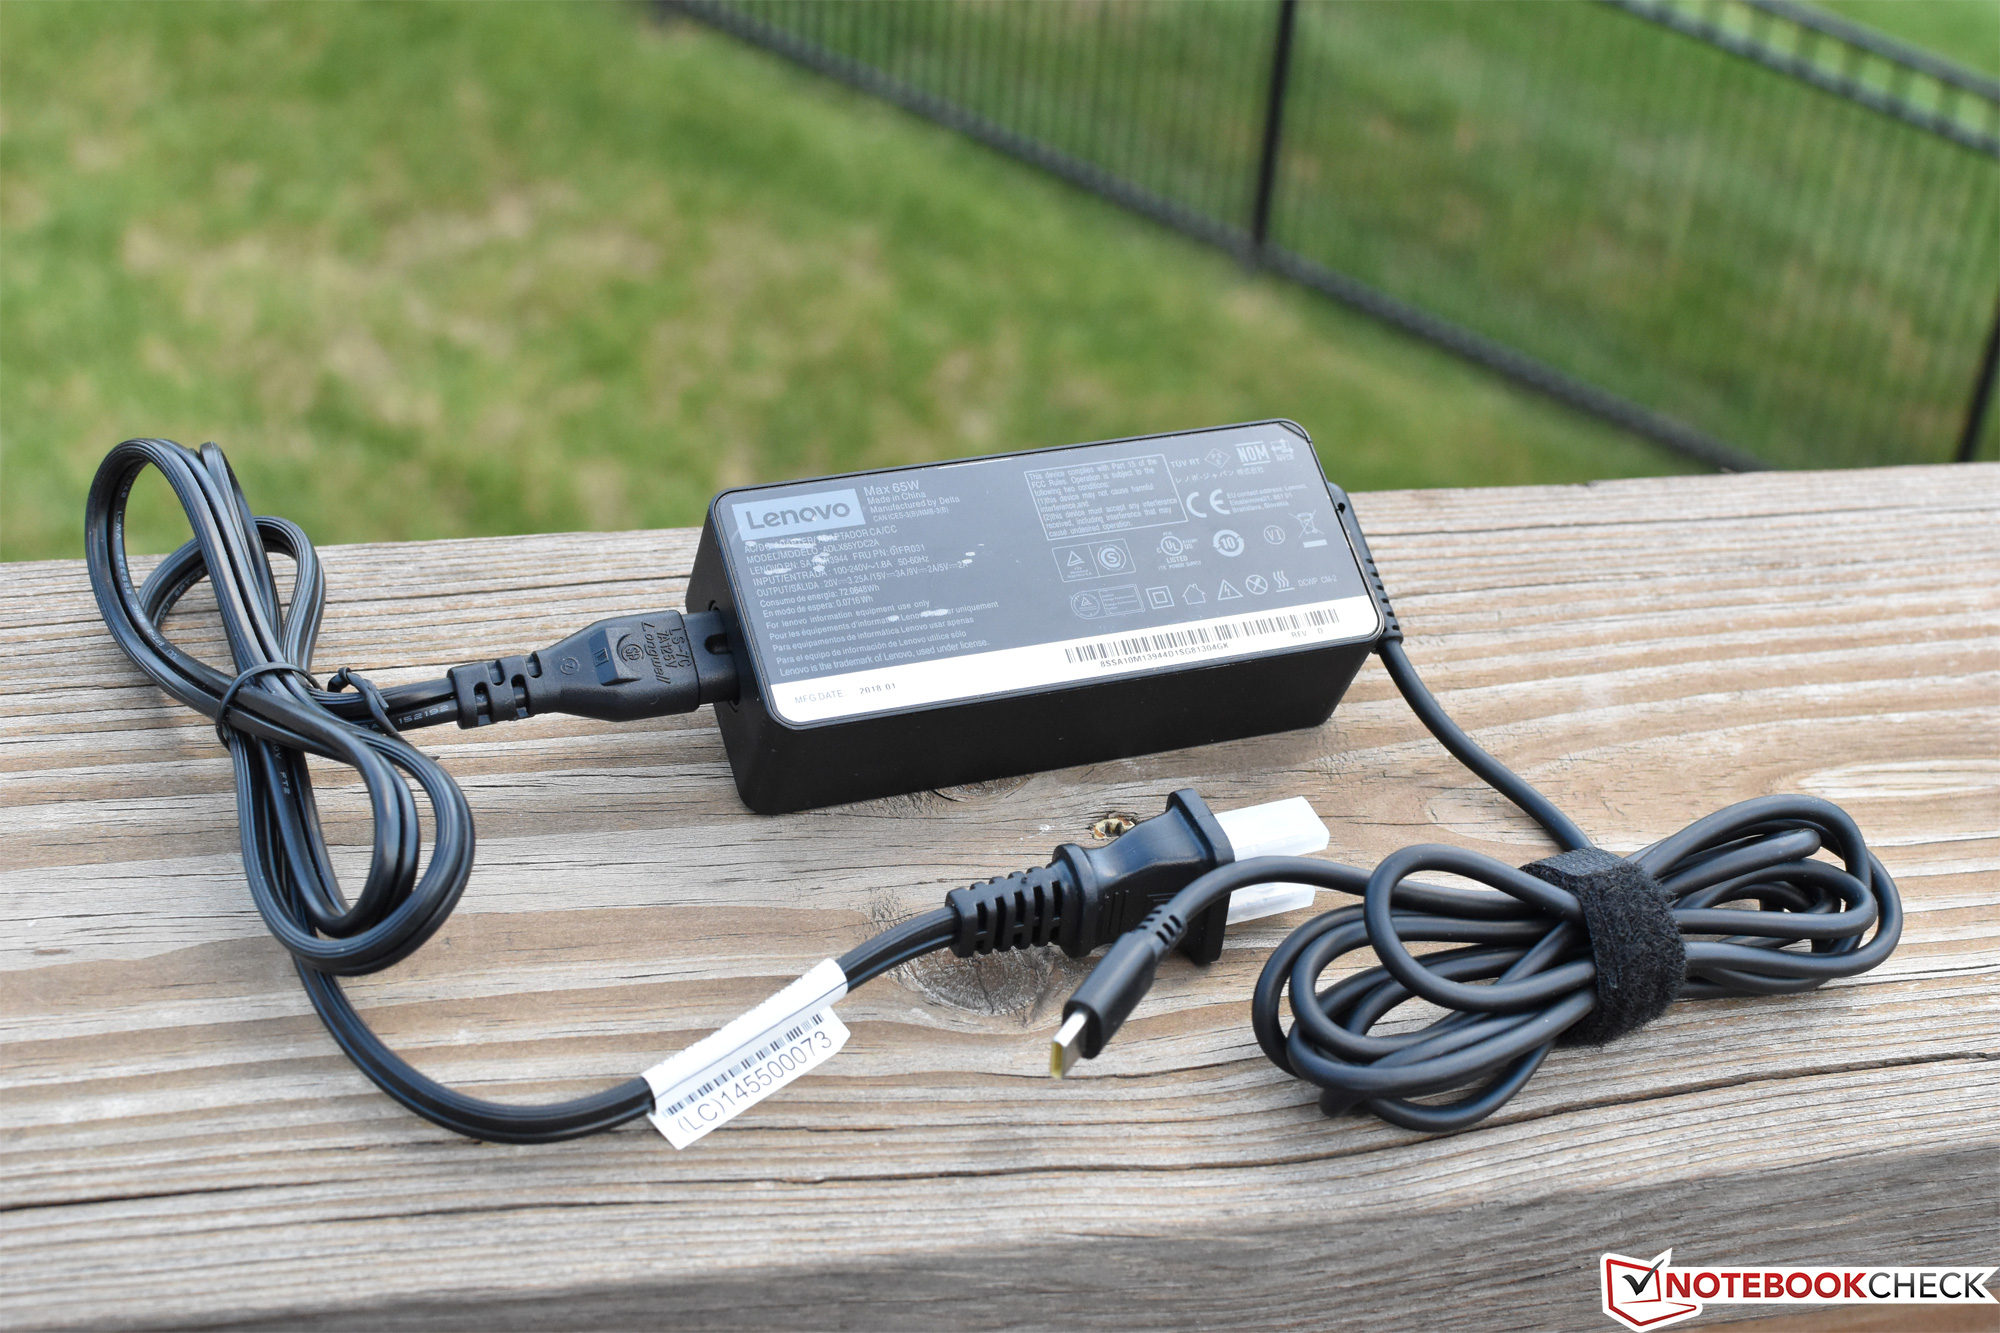
| Power Consumption | 20% | -15% | 13% | 4% | -12% | |
| Idle Minimum * (Watt) | 3.8 | 3.1 18% | 3.6 5% | 3.1 18% | 3.8 -0% | 3.8 -0% |
| Idle Average * (Watt) | 7.7 | 6.4 17% | 7.1 8% | 6.5 16% | 8.3 -8% | 8.9 -16% |
| Idle Maximum * (Watt) | 9.3 | 9.4 -1% | 9.5 -2% | 7.6 18% | 10.7 -15% | 11.9 -28% |
| Load Average * (Watt) | 45.7 | 29.8 35% | 63.9 -40% | 43 6% | 35.5 22% | 47.5 -4% |
| Load Maximum * (Watt) | 46.1 | 31.2 32% | 67.3 -46% | 43.8 5% | 37 20% | 52.5 -14% |
| Witcher 3 ultra * (Watt) | 53.9 |
* ... menor é melhor
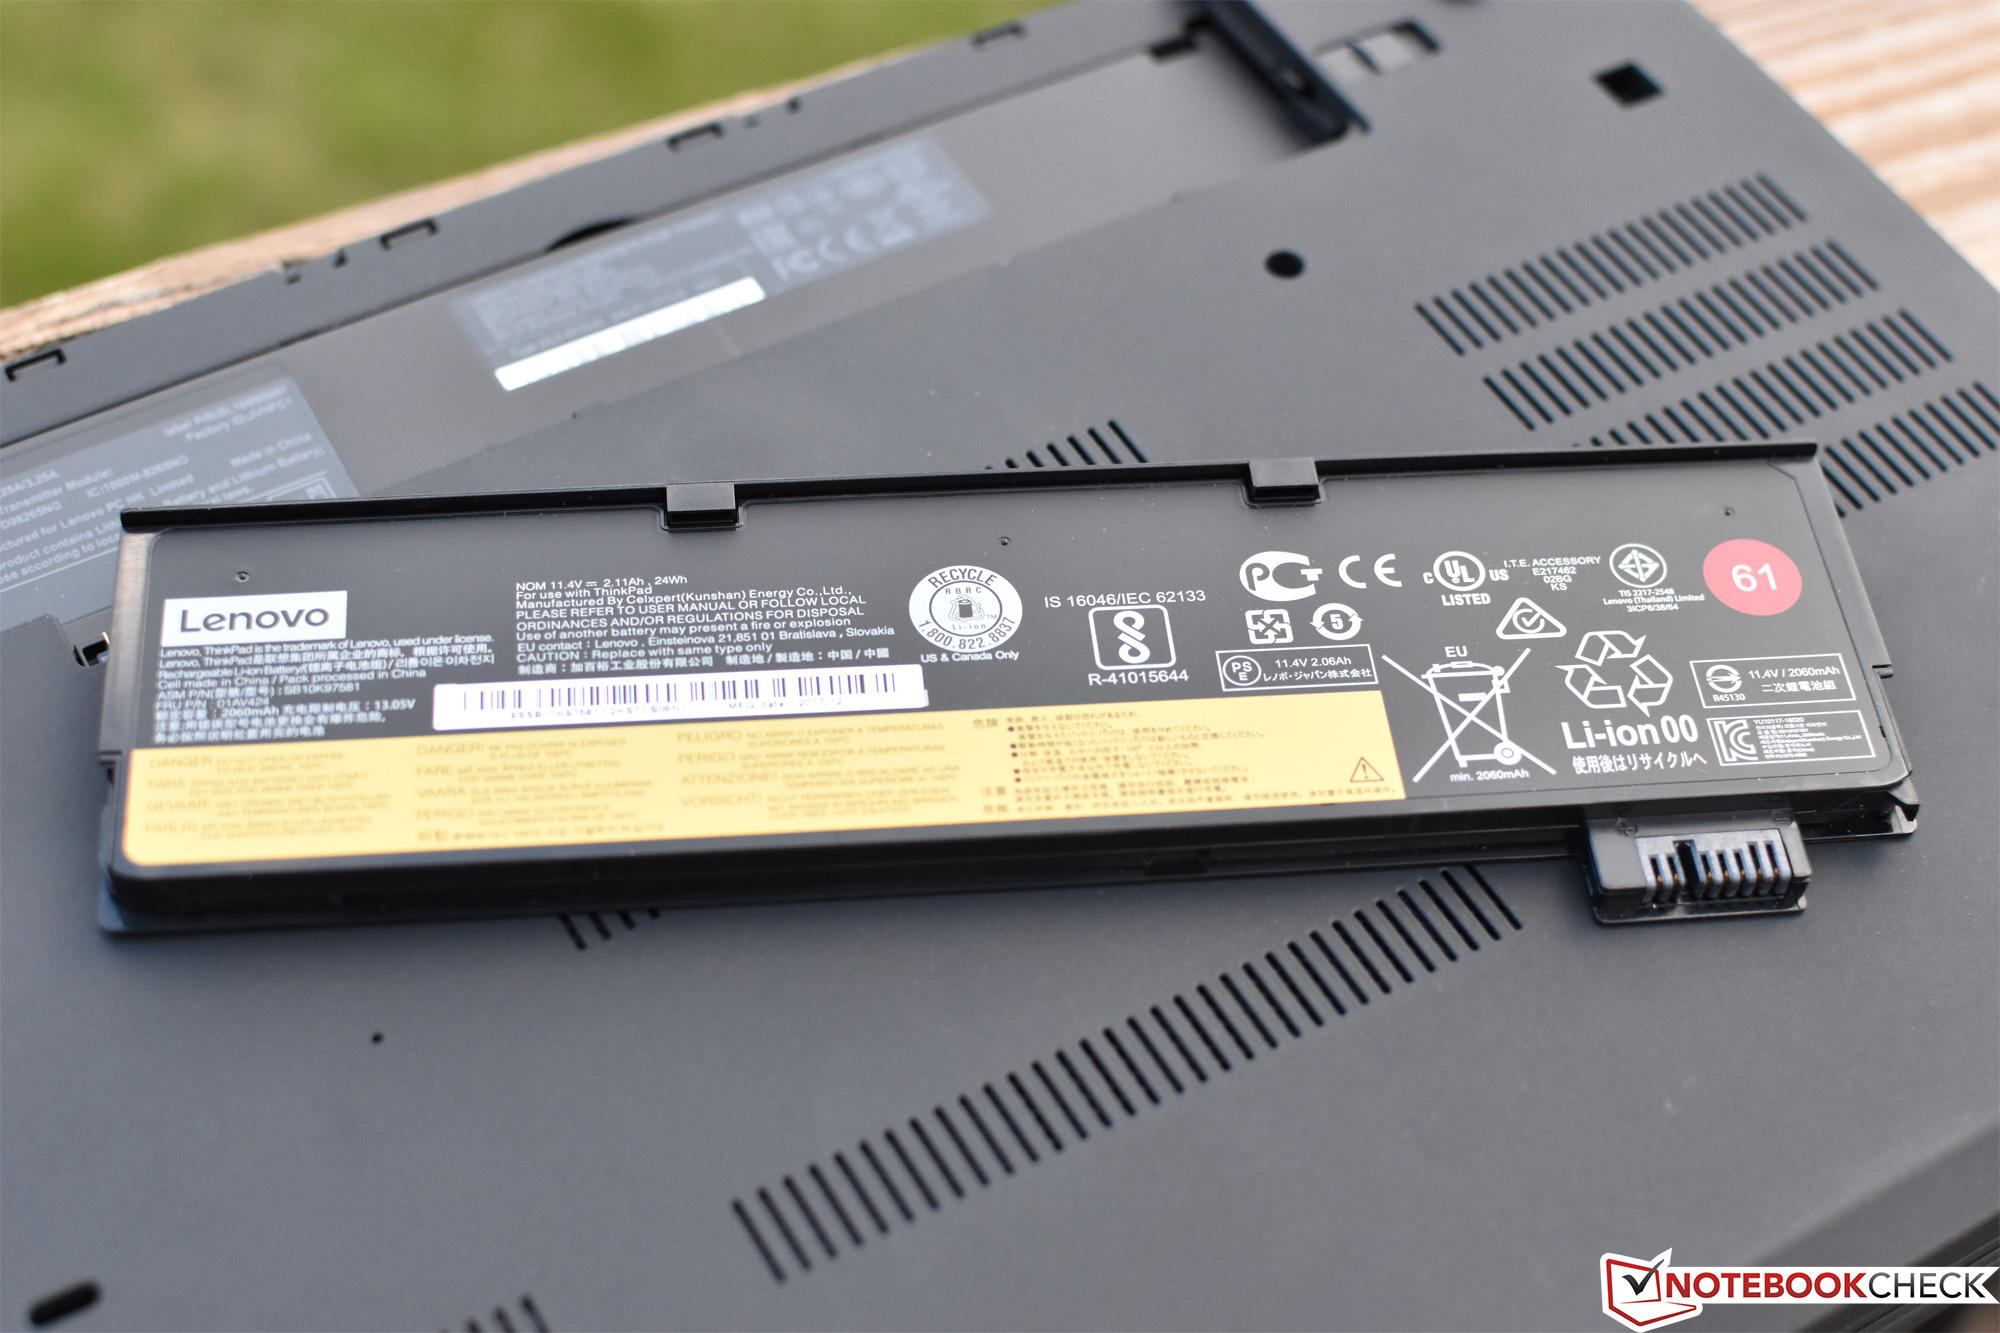
| Lenovo ThinkPad T480-20L50010US i7-8650U, UHD Graphics 620, 24 Wh | Lenovo ThinkPad T480s-20L7002AUS i5-8250U, UHD Graphics 620, 57 Wh | Lenovo ThinkPad T480-20L6S01V00 i5-8550U, GeForce MX150, 72 Wh | Dell Latitude 7490 i7-8650U, UHD Graphics 620, 60 Wh | HP EliteBook 840 G5-3JX61EA i5-8550U, UHD Graphics 620, 50 Wh | Lenovo ThinkPad X1 Carbon 2018-20KGS03900 i5-8550U, UHD Graphics 620, 57 Wh | |
|---|---|---|---|---|---|---|
| Duração da bateria | 23% | 81% | 29% | 1% | 19% | |
| WiFi v1.3 (h) | 7.3 | 9 23% | 13.2 81% | 9.4 29% | 7.4 1% | 8.7 19% |
| Reader / Idle (h) | 27.9 | 18.6 | 22.1 | |||
| Load (h) | 2.7 | 1.5 | 1.8 |
Pro
Contra
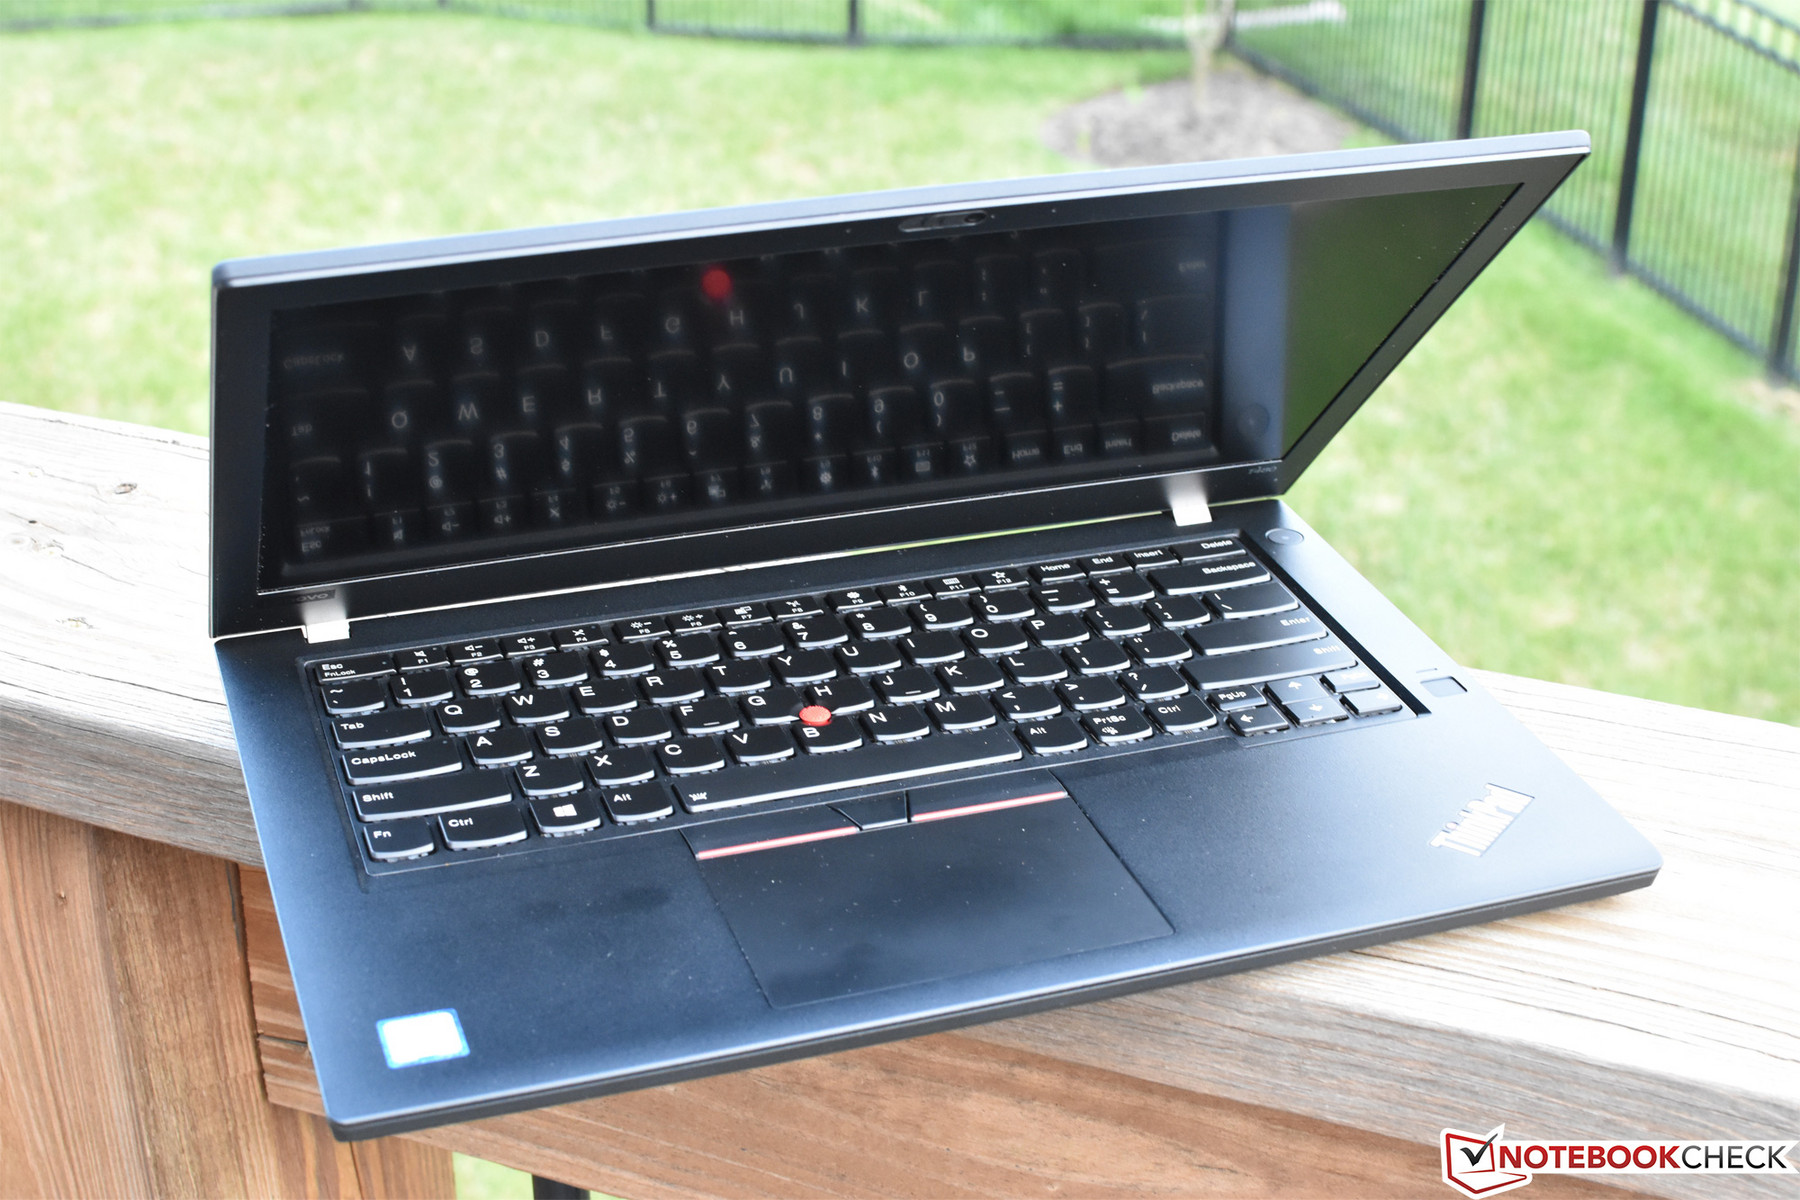
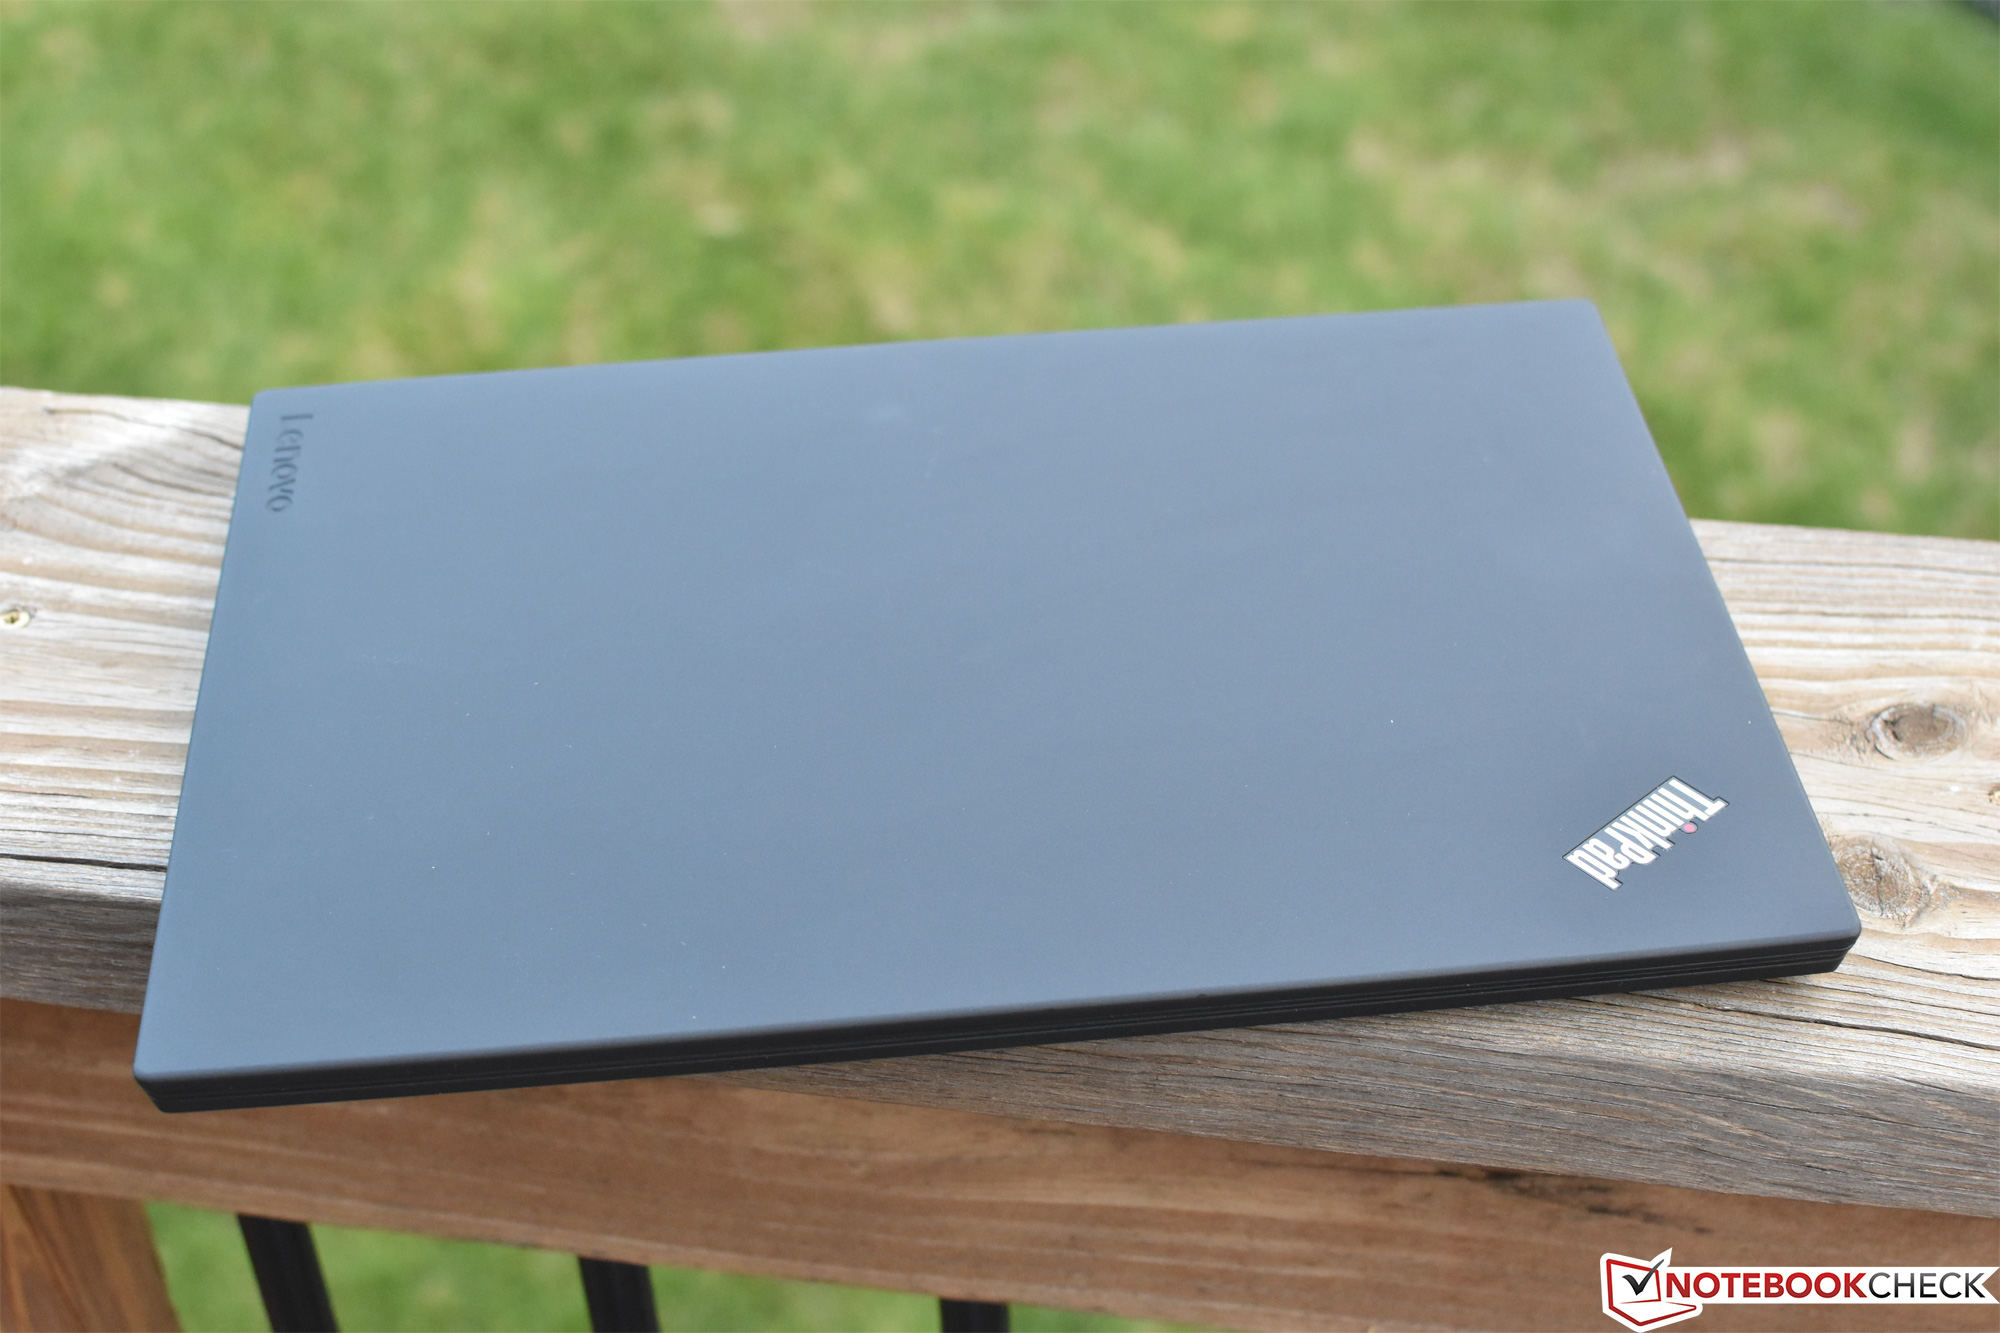
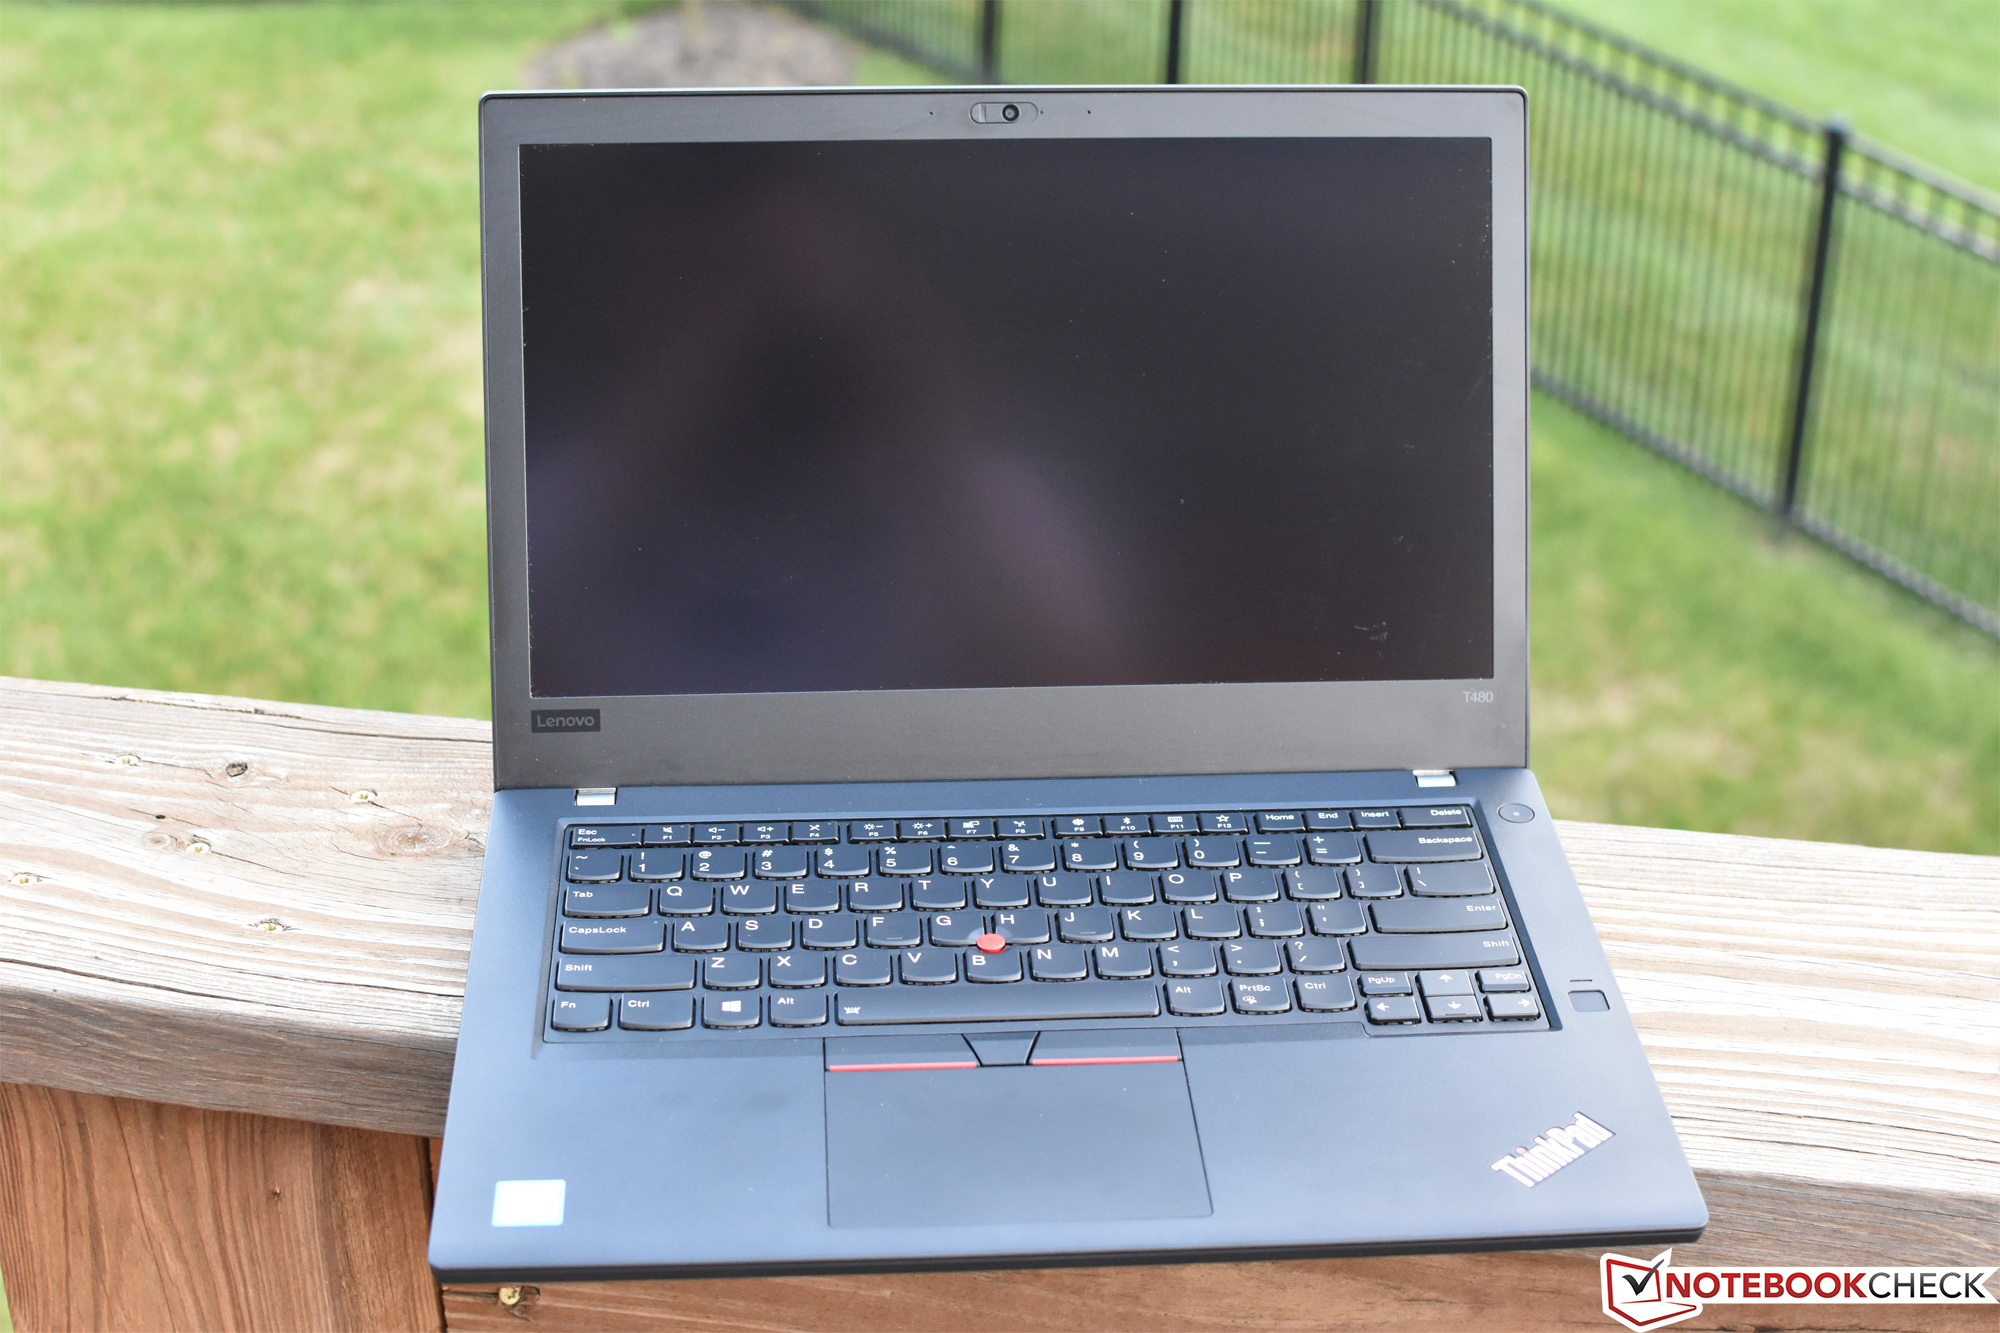
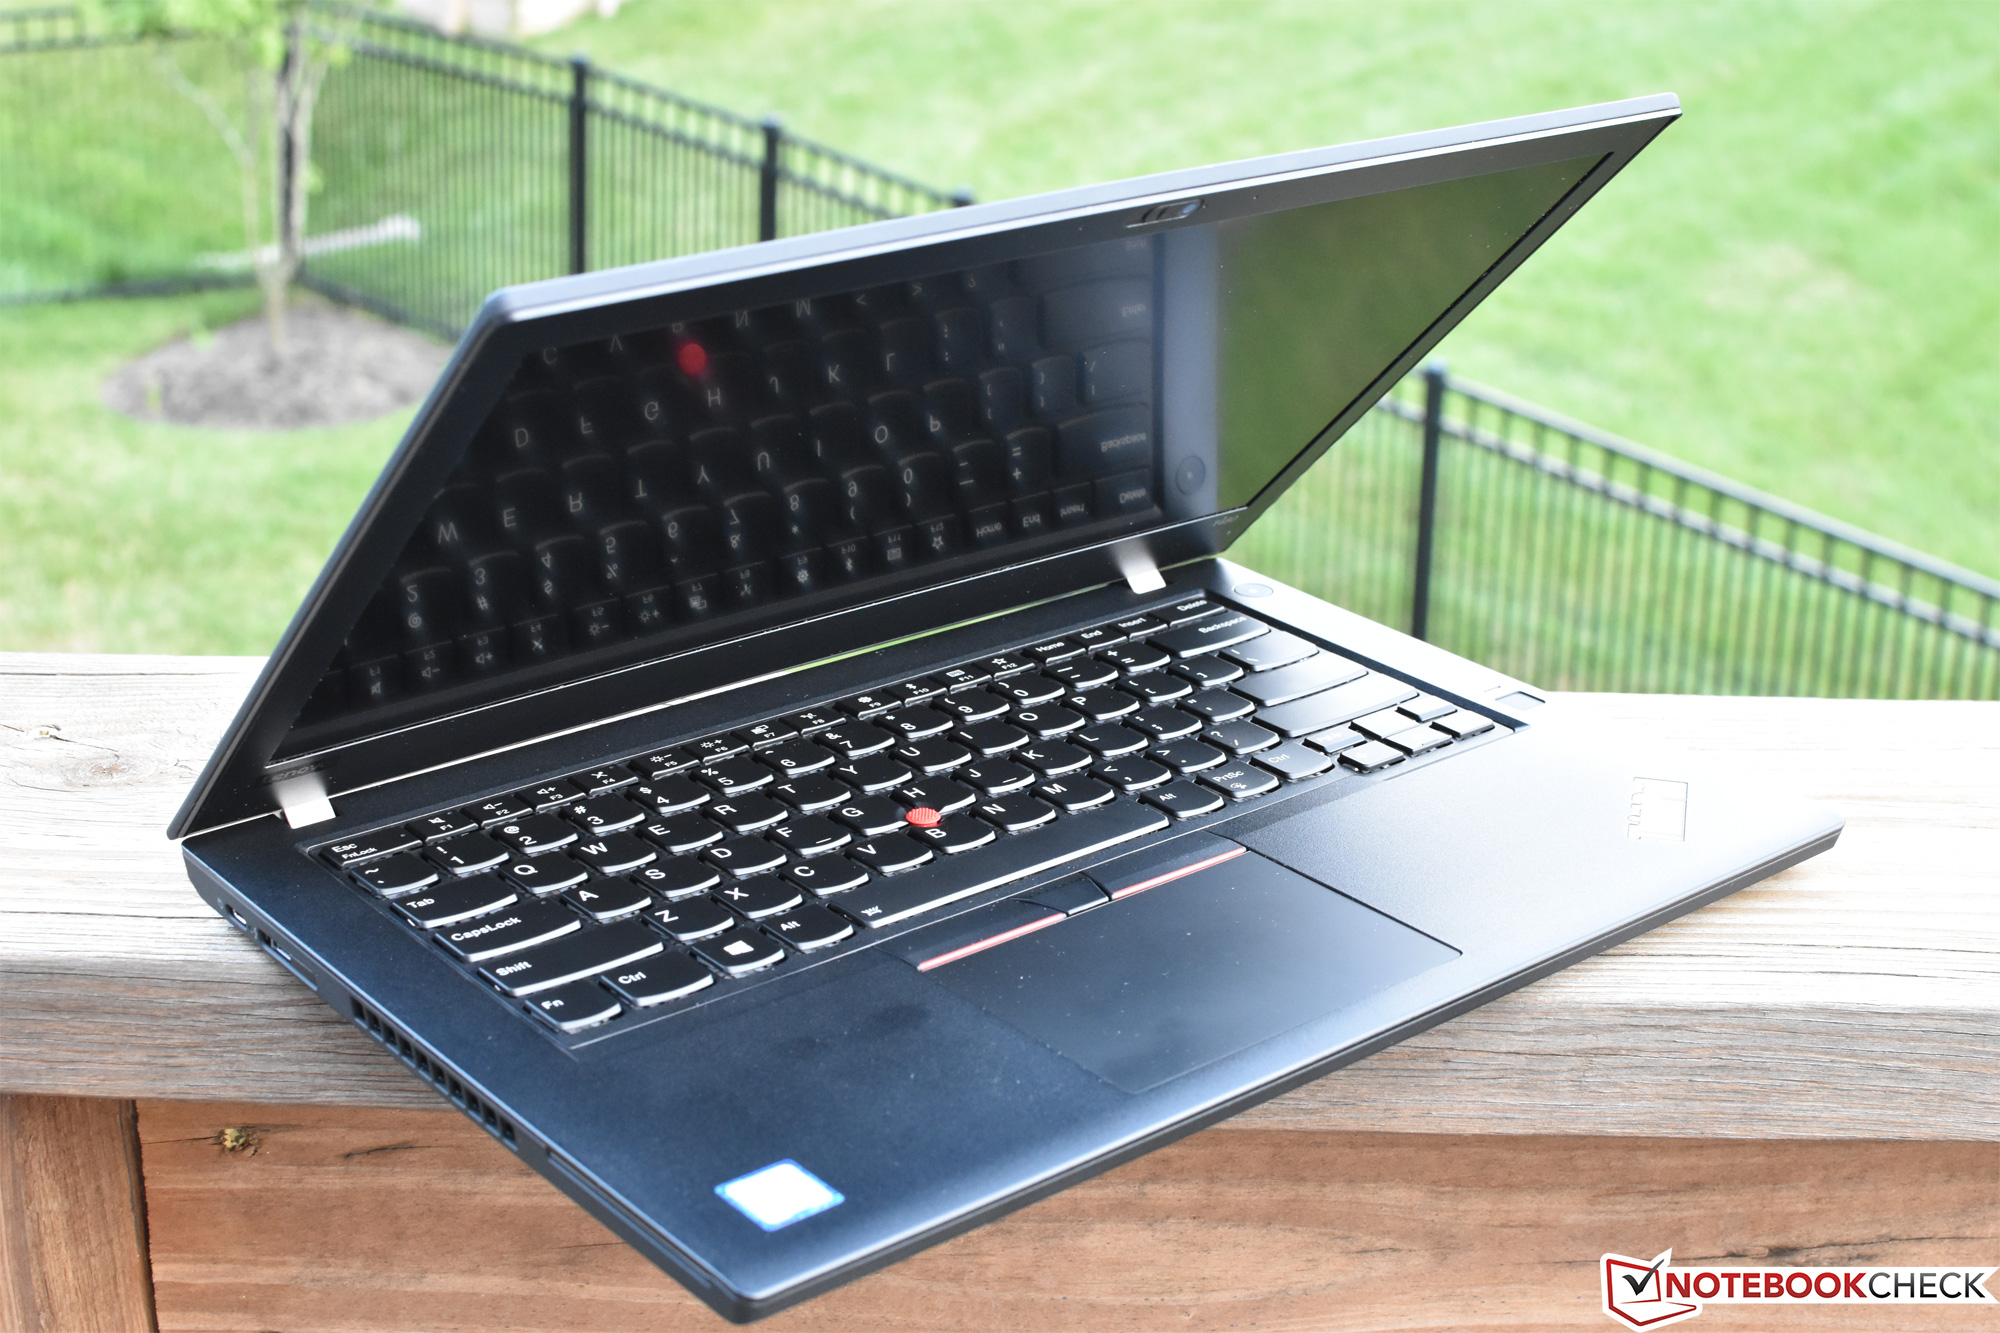
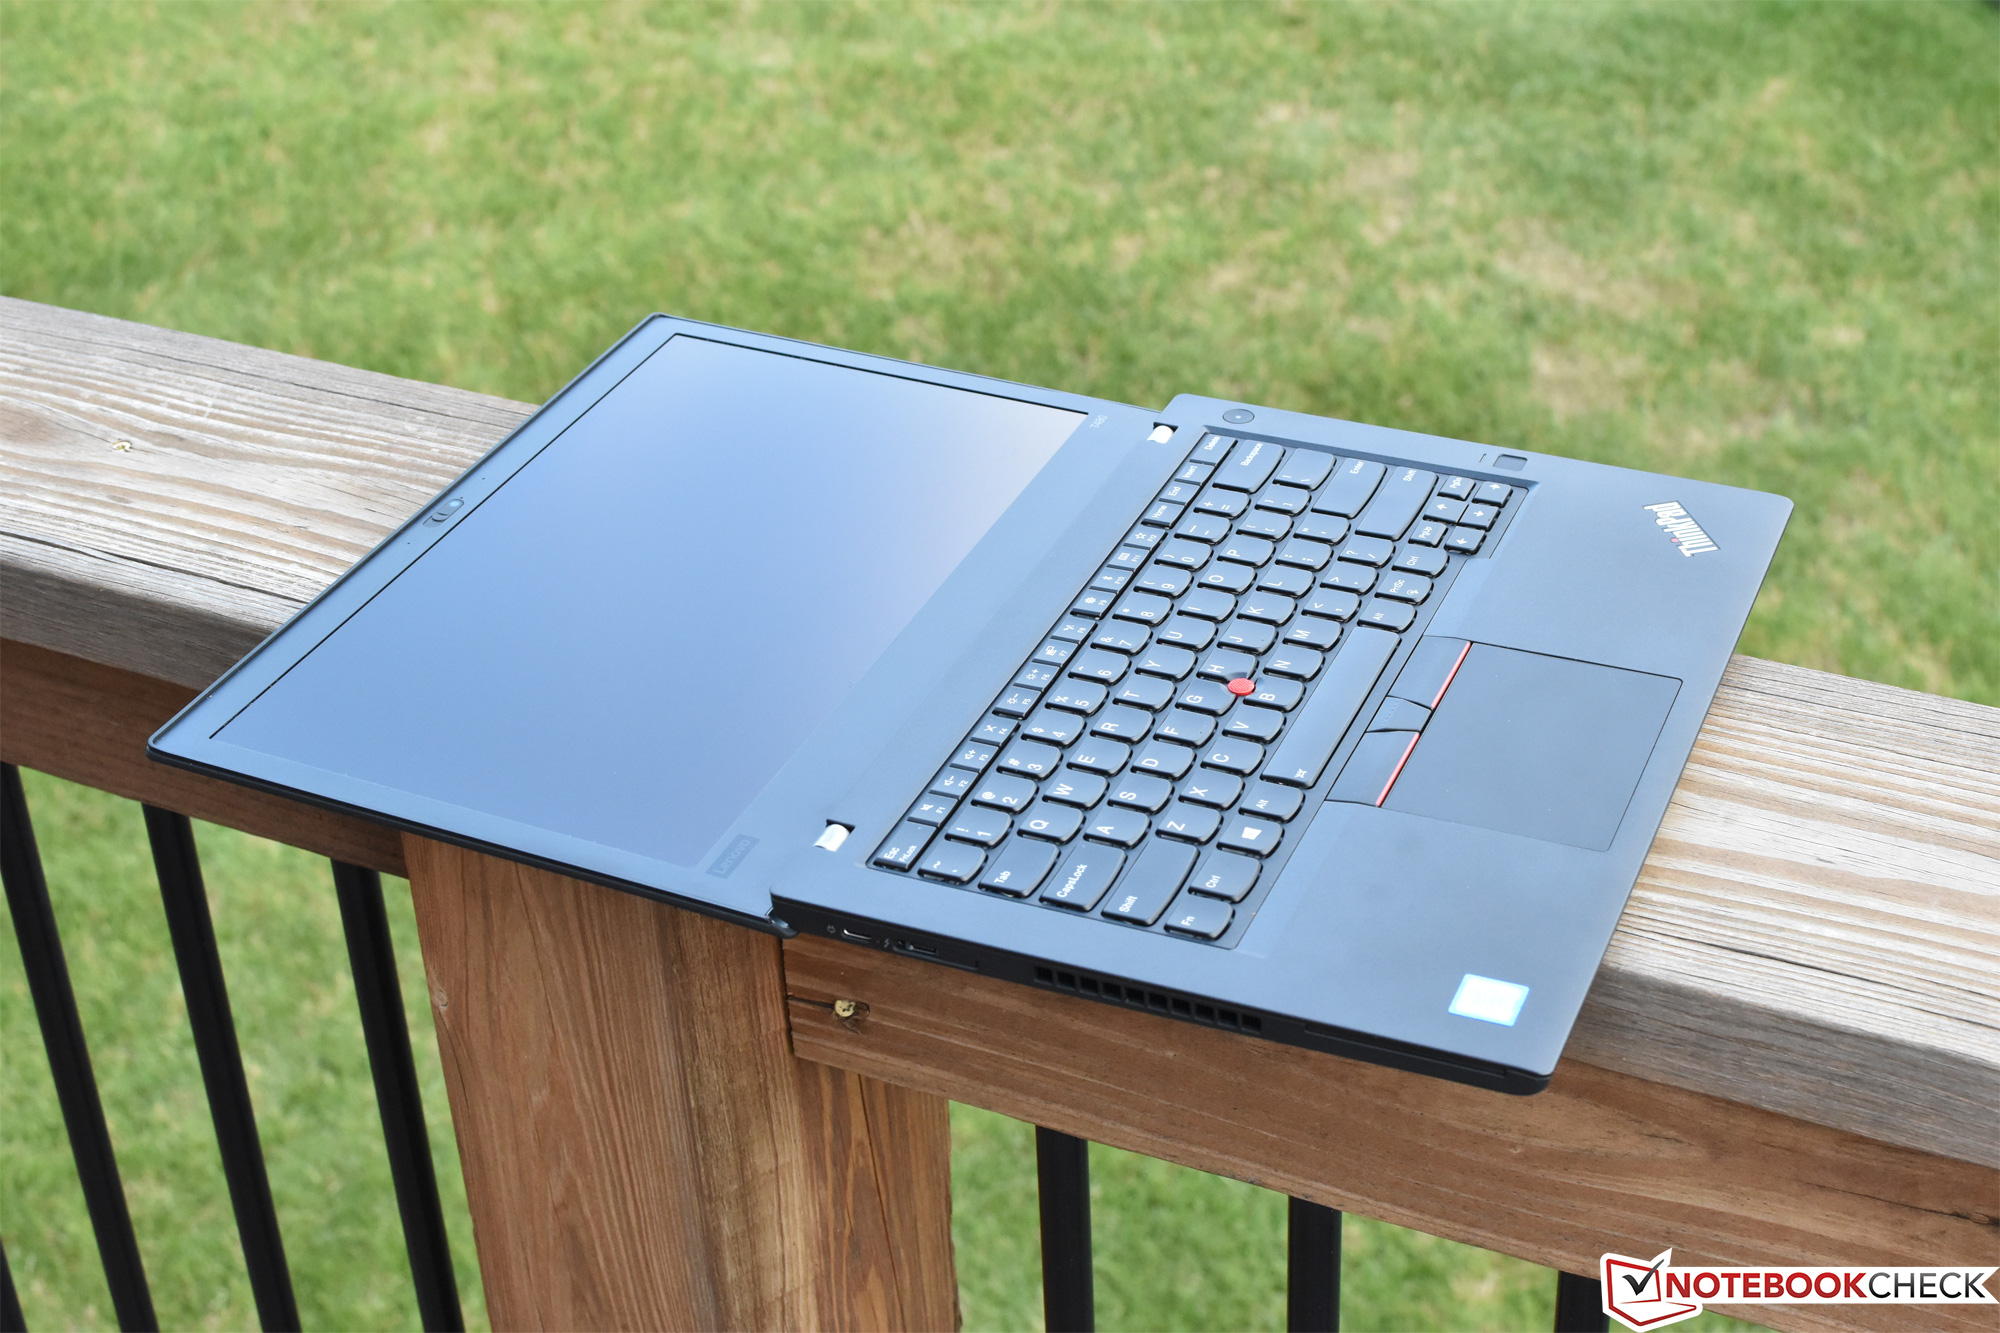
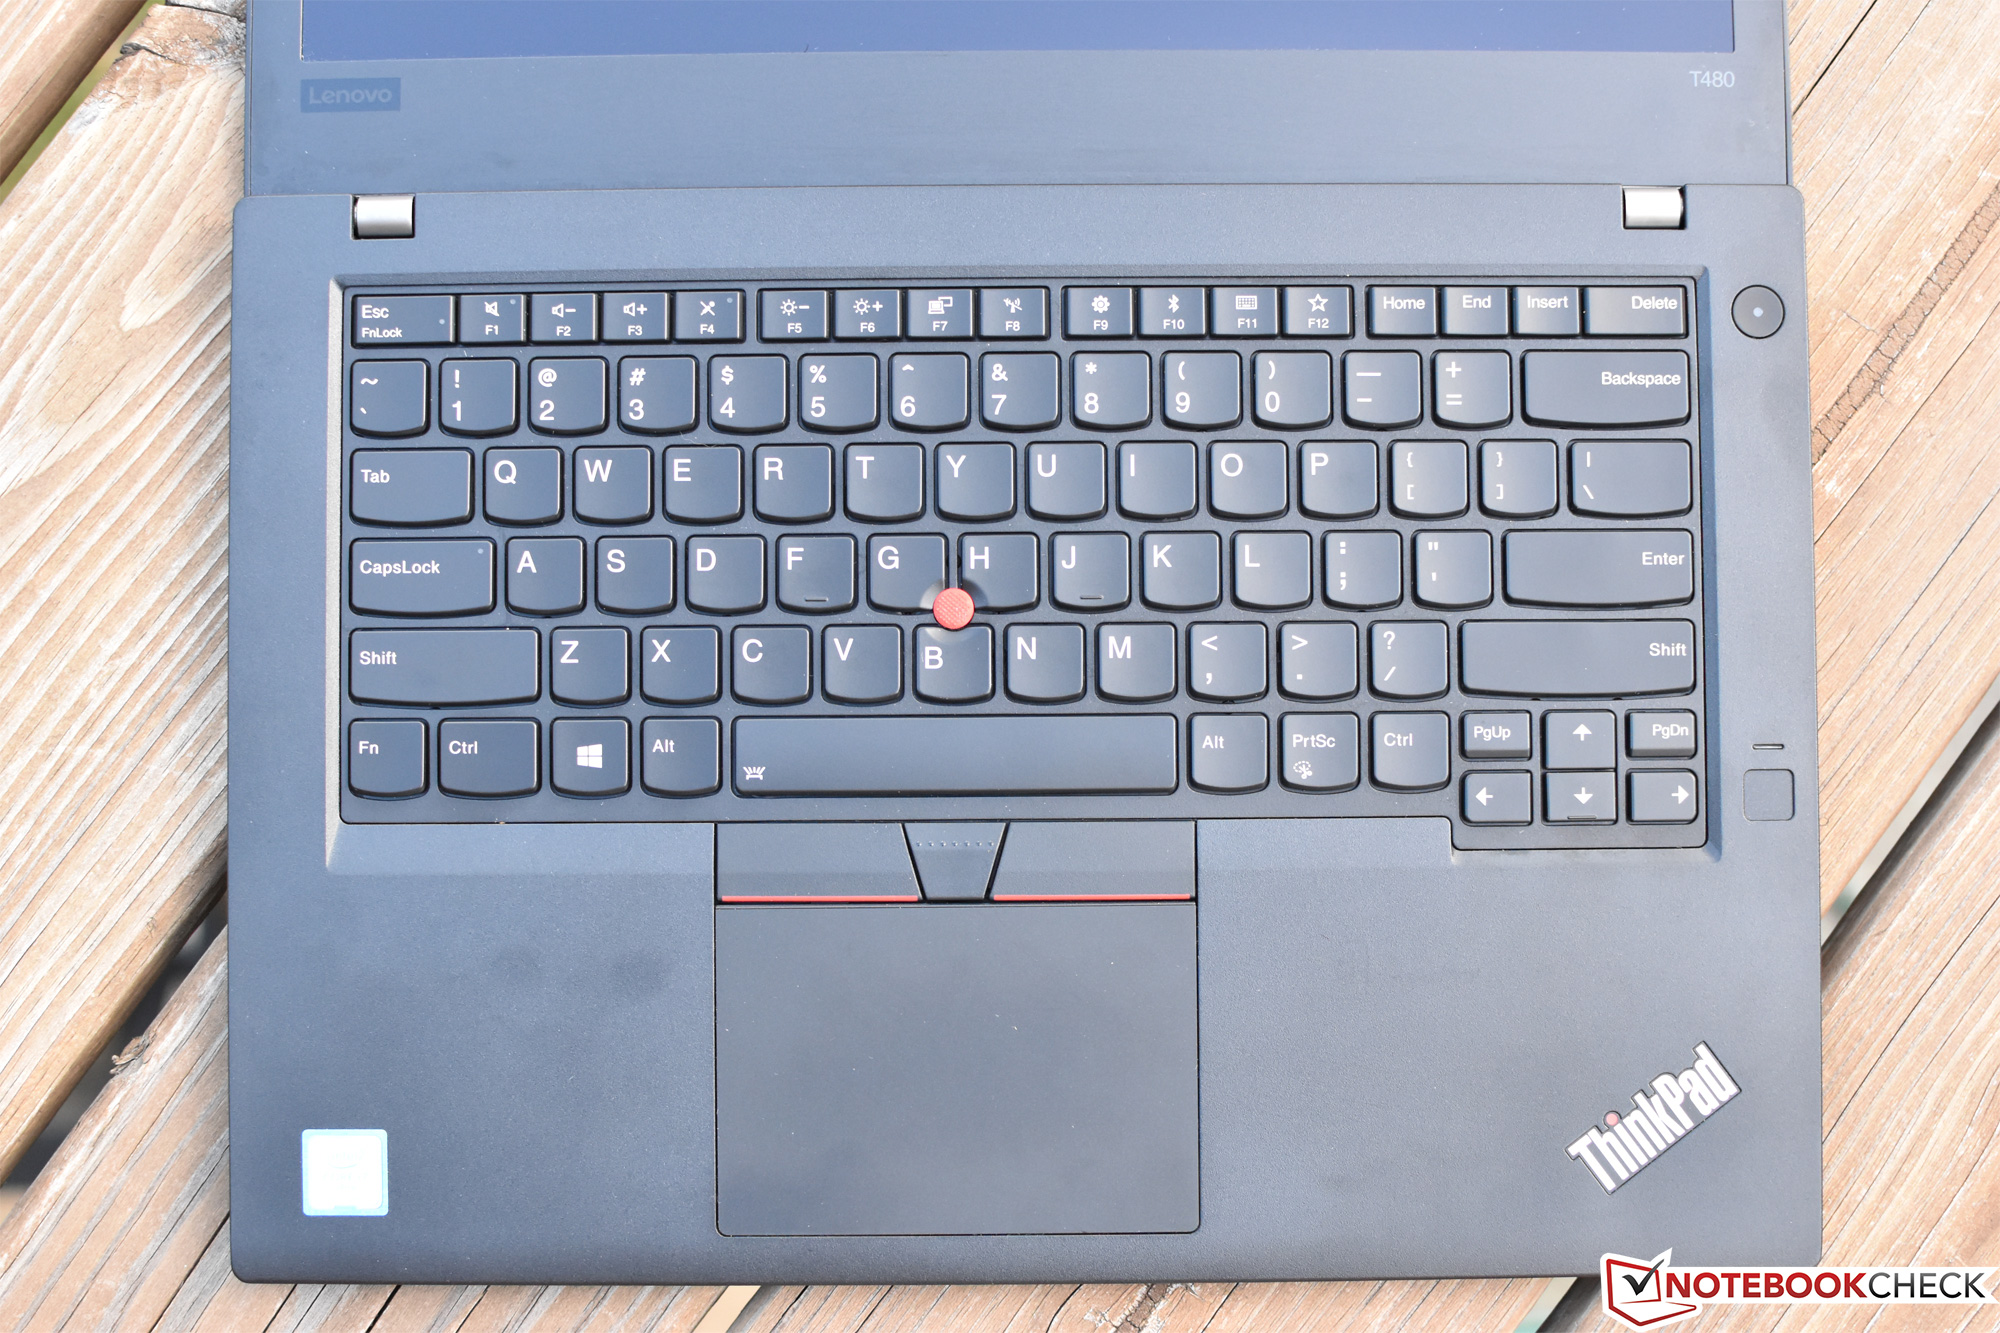
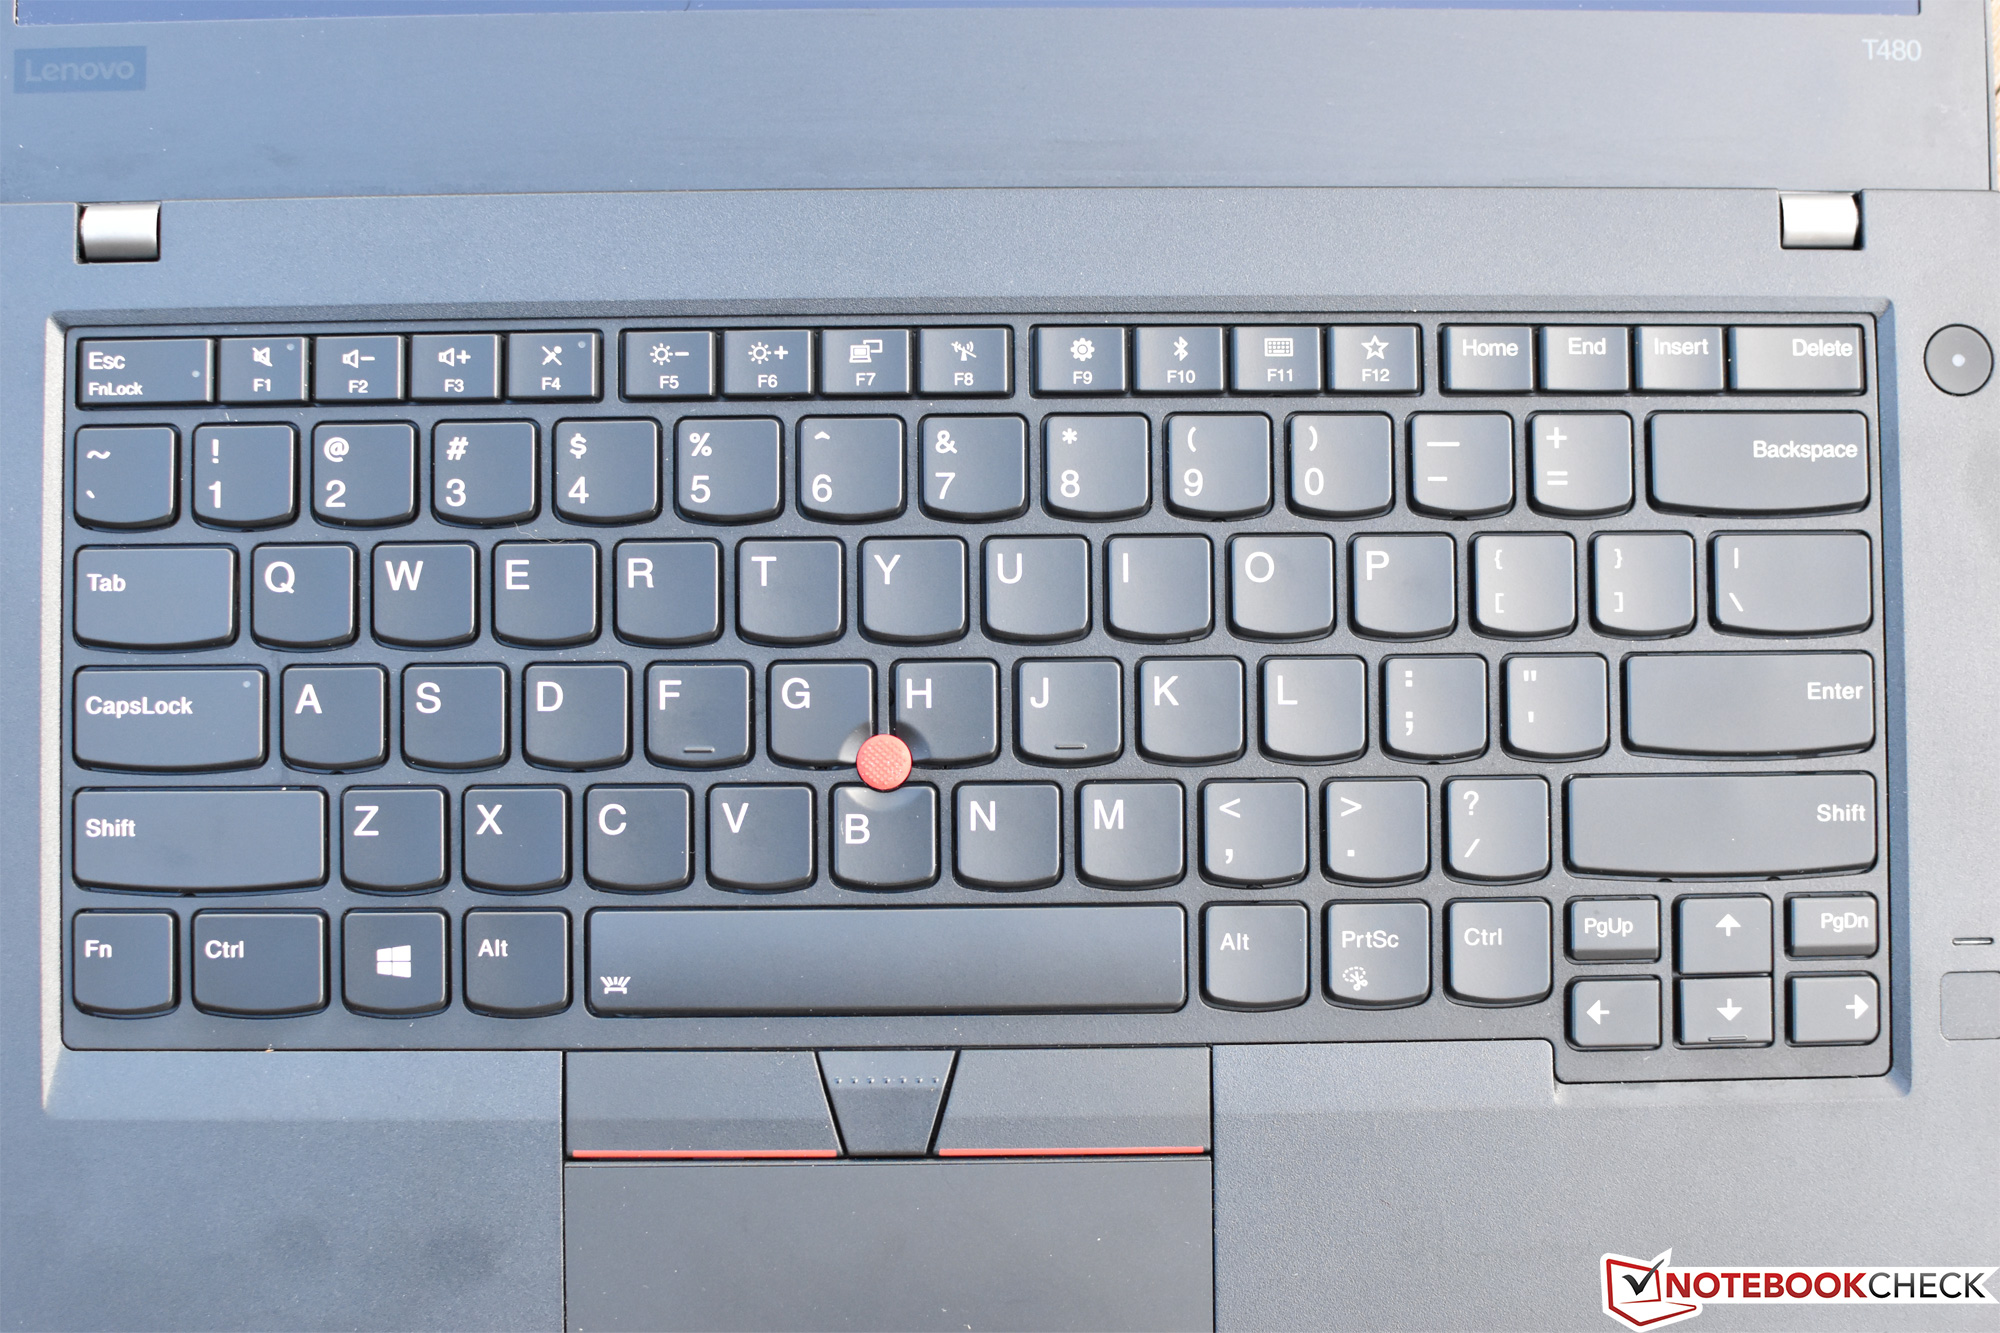
Como antes, o venerável ThinkPad T480 da Lenovo continua sendo um dos principais concorrentes no mercado corporativo. É um produto de anos de refinamento e revisão cuidadosa, rivalizado apenas por um punhado de máquinas verdadeiramente de alto nível. Como dissemos durante a nossa última análise, a sua construção é na maior parte muito sólida, o design é sempre prático (e imediatamente familiarizar), e há uma boa seleção de portas abordo. Os dispositivos de entrada também são muito bons, a máquina é silenciosa durante a operação e também é rápida - pelo menos, para o desempenho de aplicativos em geral, e no contexto das médias da categoria para o desempenho da CPU.
O que melhorou com o modelo atual em comparação com o anterior, começa com o preço, que atualmente está em torno de $1.712,00 (na Amazon). Além disso, dado que esta configuração não apresenta gráficos dedicados, as temperaturas e o consumo de energia também estão bem abaixo dos valores que medimos do modelo anterior - embora ainda haja alguns pontos quentes no lado inferior, sob carga. A tela permanece brilhante e apresenta um bom contraste, mas, como antes, a cobertura de cores é totalmente inadequada, o que resulta em cores desbotadas e a uma qualidade de imagem absurda.
Apesar de falhar no domínio da qualidade das cores da tela e de algumas outras categorias esparsas, o venerável ThinkPad T480 da Lenovo continua sendo um dos principais concorrentes no mercado corporativo. É um produto de anos de refinamento e revisão cuidadosa, rivalizado apenas por um punhado de máquinas verdadeiramente de alto nível.
Ao contrário da configuração MX150, esta máquina (é claro) não consegue lidar com nenhum tipo de operação pesada de GPU, como jogos leves. Isso é esperado - mas o que foi inesperado é o menor desempenho da CPU que recebemos do Core i7 2670QM em nossa unidade de teste, contra o modelo Core i7 2670QM mais barato, em março. Talvez o mais enigmático de tudo seja a brecha de desempenho da CPU que separa o T480s e o T480 atual; mesmo com o BIOS mais recente e todas as configurações de energia configuradas corretamente, não conseguimos provocar pontuações próximas do que vimos nos nossos T480 equipados com Core i5 na semana passada.
Ainda assim, apesar de falhar no campo da qualidade das cores da tela e de algumas outras categorias esparsas, o T480 continua sendo mencionado entre as respeitadas categorias de concorrentes como a Dell.Dell Latitude 7490, HP Elitebook 840 G5, e o X1 Carbon da própria Lenovo. A escolha real é se o T480 ou o T480s faz mais sentido para a sua aplicação em particular, mas, além dos problemas mencionados, é difícil encontrar uma falha grave em qualquer uma dessas opções.
Lenovo ThinkPad T480-20L50010US
- 07/16/2018 v6 (old)
Steve Schardein
Price comparison
