Breve Análise do Portátil Lenovo ThinkPad T480s (i5-8250U, FHD)
| |||||||||||||||||||||||||
iluminação: 86 %
iluminação com acumulador: 288.3 cd/m²
Contraste: 1373:1 (Preto: 0.21 cd/m²)
ΔE ColorChecker Calman: 6.16 | ∀{0.5-29.43 Ø4.71}
calibrated: 4.51
ΔE Greyscale Calman: 6.3 | ∀{0.09-98 Ø4.96}
58.9% sRGB (Argyll 1.6.3 3D)
37.67% AdobeRGB 1998 (Argyll 1.6.3 3D)
41% AdobeRGB 1998 (Argyll 3D)
59.2% sRGB (Argyll 3D)
39.69% Display P3 (Argyll 3D)
Gamma: 2.517
CCT: 6886 K
| Lenovo ThinkPad T480s-20L7002AUS NV140FHM-N46, TFT-LCD, 14", 1920x1080 | Lenovo ThinkPad X1 Carbon 2018-20KGS03900 B140QAN02.0, IPS, 14", 2560x1440 | Dell Latitude 7490 AUO503D (D04YD_B140HAN), IPS, 14", 1920x1080 | Dell Latitude 7390 LGD059B, IPS, 13.3", 1920x1080 | HP EliteBook 840 G5-3JX61EA IVO M140NVF7 R0, IPS, 14", 1920x1080 | Lenovo ThinkPad T480s-20L8S02D00 LP140QH2-SPB1, IPS, 14", 2560x1440 | |
|---|---|---|---|---|---|---|
| Display | 111% | 66% | 66% | 51% | 76% | |
| Display P3 Coverage (%) | 39.69 | 87.7 121% | 66.6 68% | 67.8 71% | 61 54% | 72.8 83% |
| sRGB Coverage (%) | 59.2 | 100 69% | 96.8 64% | 95.1 61% | 87.7 48% | 97.9 65% |
| AdobeRGB 1998 Coverage (%) | 41 | 99.9 144% | 67.9 66% | 67.8 65% | 62.1 51% | 74.1 81% |
| Response Times | -18% | 6% | 14% | 25% | 15% | |
| Response Time Grey 50% / Grey 80% * (ms) | 44 ? | 59.2 ? -35% | 41.6 ? 5% | 36.8 ? 16% | 33 ? 25% | 38.4 ? 13% |
| Response Time Black / White * (ms) | 34 ? | 34.4 ? -1% | 32 ? 6% | 30.4 ? 11% | 26 ? 24% | 28.4 ? 16% |
| PWM Frequency (Hz) | 990 | 3125 ? | ||||
| Screen | 55% | 20% | 26% | 34% | 16% | |
| Brightness middle (cd/m²) | 288.3 | 578 100% | 308.6 7% | 303.8 5% | 655 127% | 352 22% |
| Brightness (cd/m²) | 281 | 533 90% | 294 5% | 289 3% | 630 124% | 343 22% |
| Brightness Distribution (%) | 86 | 84 -2% | 89 3% | 86 0% | 93 8% | 91 6% |
| Black Level * (cd/m²) | 0.21 | 0.38 -81% | 0.23 -10% | 0.31 -48% | 0.56 -167% | 0.46 -119% |
| Contrast (:1) | 1373 | 1521 11% | 1342 -2% | 980 -29% | 1170 -15% | 765 -44% |
| Colorchecker dE 2000 * | 6.16 | 1.9 69% | 6.07 1% | 2.9 53% | 3.27 47% | 3.3 46% |
| Colorchecker dE 2000 max. * | 18.99 | 3.8 80% | 10.58 44% | 5.79 70% | 5.92 69% | 7.3 62% |
| Colorchecker dE 2000 calibrated * | 4.51 | 0.8 82% | 1.67 63% | 1.72 62% | 3.22 29% | |
| Greyscale dE 2000 * | 6.3 | 3 52% | 7.3 -16% | 3.7 41% | 2.85 55% | 5.3 16% |
| Gamma | 2.517 87% | 2.14 103% | 2.061 107% | 2.118 104% | 2.45 90% | 2.22 99% |
| CCT | 6886 94% | 6377 102% | 7269 89% | 6323 103% | 6065 107% | 6452 101% |
| Color Space (Percent of AdobeRGB 1998) (%) | 37.67 | 88.8 136% | 62 65% | 63 67% | 57 51% | 68.4 82% |
| Color Space (Percent of sRGB) (%) | 58.9 | 100 70% | 97 65% | 95 61% | 88 49% | 98 66% |
| Média Total (Programa/Configurações) | 49% /
57% | 31% /
27% | 35% /
32% | 37% /
36% | 36% /
28% |
* ... menor é melhor
Exibir tempos de resposta
| ↔ Tempo de resposta preto para branco | ||
|---|---|---|
| 34 ms ... ascensão ↗ e queda ↘ combinadas | ↗ 18.8 ms ascensão | 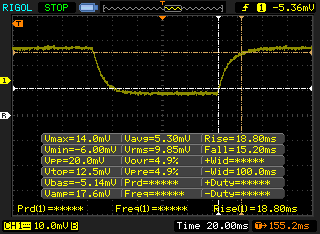 |
| ↘ 15.2 ms queda | ||
| A tela mostra taxas de resposta lentas em nossos testes e será insatisfatória para os jogadores. Em comparação, todos os dispositivos testados variam de 0.1 (mínimo) a 240 (máximo) ms. » 91 % de todos os dispositivos são melhores. Isso significa que o tempo de resposta medido é pior que a média de todos os dispositivos testados (19.8 ms). | ||
| ↔ Tempo de resposta 50% cinza a 80% cinza | ||
| 44 ms ... ascensão ↗ e queda ↘ combinadas | ↗ 26 ms ascensão | 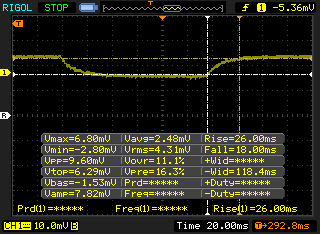 |
| ↘ 18 ms queda | ||
| A tela mostra taxas de resposta lentas em nossos testes e será insatisfatória para os jogadores. Em comparação, todos os dispositivos testados variam de 0.165 (mínimo) a 636 (máximo) ms. » 73 % de todos os dispositivos são melhores. Isso significa que o tempo de resposta medido é pior que a média de todos os dispositivos testados (31 ms). | ||
Cintilação da tela / PWM (modulação por largura de pulso)
| Tela tremeluzindo/PWM detectado | 990 Hz | 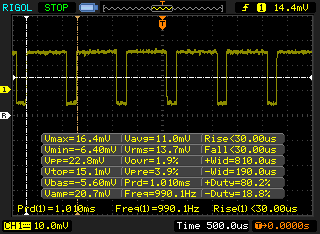 | |
A luz de fundo da tela pisca em 990 Hz (pior caso, por exemplo, utilizando PWM) . A frequência de 990 Hz é bastante alta, então a maioria dos usuários sensíveis ao PWM não deve notar nenhuma oscilação. [pwm_comparison] Em comparação: 52 % de todos os dispositivos testados não usam PWM para escurecer a tela. Se PWM foi detectado, uma média de 7754 (mínimo: 5 - máximo: 343500) Hz foi medida. | |||
| PCMark 8 Home Score Accelerated v2 | 3672 pontos | |
| PCMark 10 Score | 3771 pontos | |
Ajuda | ||
| Lenovo ThinkPad T480s-20L7002AUS Samsung PM961 MZVLW256HEHP | Lenovo ThinkPad X1 Carbon 2018-20KGS03900 Samsung SSD PM981 MZVLB512HAJQ | Dell Latitude 7490 Toshiba KSG60ZMV256G | Dell Latitude 7390 Samsung PM961 MZVLW256HEHP | HP EliteBook 840 G5-3JX61EA Toshiba KXG50ZNV1T02 | Lenovo ThinkPad T480s-20L8S02E00 Samsung SSD PM981 MZVLB512HAJQ | Média Samsung PM961 MZVLW256HEHP | |
|---|---|---|---|---|---|---|---|
| AS SSD | 32% | -64% | -16% | -12% | 32% | -115% | |
| Copy Game MB/s (MB/s) | 1107 | 352 | 905 | 1110 | 537 ? | ||
| Copy Program MB/s (MB/s) | 460.2 | 247.4 | 326.2 | 387.5 | 343 ? | ||
| Copy ISO MB/s (MB/s) | 1247 | 818 | 1688 | 1412 | 1004 ? | ||
| Score Total (Points) | 3048 | 3529 16% | 947 -69% | 2215 -27% | 2630 -14% | 4115 35% | 2565 ? -16% |
| Score Write (Points) | 921 | 1801 96% | 357 -61% | 501 -46% | 1084 18% | 1708 85% | 587 ? -36% |
| Score Read (Points) | 1435 | 1168 -19% | 391 -73% | 1158 -19% | 1070 -25% | 1623 13% | 1378 ? -4% |
| Access Time Write * (ms) | 0.038 | 0.027 29% | 0.056 -47% | 0.032 16% | 0.055 -45% | 0.033 13% | 0.4637 ? -1120% |
| Access Time Read * (ms) | 0.055 | 0.029 47% | 0.112 -104% | 0.063 -15% | 0.059 -7% | 0.045 18% | 0.06777 ? -23% |
| 4K-64 Write (MB/s) | 706 | 1529 117% | 248.1 -65% | 302.4 -57% | 908 29% | 1456 106% | 419 ? -41% |
| 4K-64 Read (MB/s) | 1183 | 876 -26% | 316.1 -73% | 932 -21% | 813 -31% | 1329 12% | 1112 ? -6% |
| 4K Write (MB/s) | 97.8 | 134.3 37% | 79.2 -19% | 115.2 18% | 90 -8% | 114.4 17% | 91.6 ? -6% |
| 4K Read (MB/s) | 42.09 | 52.4 24% | 26.66 -37% | 49.43 17% | 26.75 -36% | 49.81 18% | 45.1 ? 7% |
| Seq Write (MB/s) | 1172 | 1376 17% | 294.9 -75% | 830 -29% | 856 -27% | 1382 18% | 960 ? -18% |
| Seq Read (MB/s) | 2094 | 2396 14% | 486.2 -77% | 1761 -16% | 2300 10% | 2440 17% | 2019 ? -4% |
* ... menor é melhor

| 3DMark 11 Performance | 1862 pontos | |
Ajuda | ||
| baixo | média | alto | ultra | |
|---|---|---|---|---|
| BioShock Infinite (2013) | 55 | 30 | 24 | 8 |
Barulho
| Ocioso |
| 28.1 / 28.1 / 28.1 dB |
| Carga |
| 35.5 / 41.5 dB |
 | ||
30 dB silencioso 40 dB(A) audível 50 dB(A) ruidosamente alto |
||
min: | ||
| Lenovo ThinkPad T480s-20L7002AUS UHD Graphics 620, i5-8250U, Samsung PM961 MZVLW256HEHP | Lenovo ThinkPad X1 Carbon 2018-20KGS03900 UHD Graphics 620, i5-8550U, Samsung SSD PM981 MZVLB512HAJQ | Dell Latitude 7490 UHD Graphics 620, i5-8350U, Toshiba KSG60ZMV256G | Dell Latitude 7390 UHD Graphics 620, i7-8650U, Samsung PM961 MZVLW256HEHP | HP EliteBook 840 G5-3JX61EA UHD Graphics 620, i5-8550U, Toshiba KXG50ZNV1T02 | Lenovo ThinkPad T480s-20L8S02E00 GeForce MX150, i5-8550U, Samsung SSD PM981 MZVLB512HAJQ | |
|---|---|---|---|---|---|---|
| Noise | -2% | 3% | 1% | -1% | -1% | |
| desligado / ambiente * (dB) | 28.1 | 28.9 -3% | 28.2 -0% | 28.2 -0% | 30.3 -8% | 29 -3% |
| Idle Minimum * (dB) | 28.1 | 28.9 -3% | 28.2 -0% | 28.2 -0% | 30.3 -8% | 29 -3% |
| Idle Average * (dB) | 28.1 | 28.9 -3% | 28.2 -0% | 28.2 -0% | 30.3 -8% | 29 -3% |
| Idle Maximum * (dB) | 28.1 | 32.5 -16% | 28.7 -2% | 28.2 -0% | 30.3 -8% | 29 -3% |
| Load Average * (dB) | 35.5 | 35.1 1% | 29.9 16% | 31.5 11% | 33.8 5% | 36.5 -3% |
| Load Maximum * (dB) | 41.5 | 35.1 15% | 40.2 3% | 42.7 -3% | 33.8 19% | 38.2 8% |
| Witcher 3 ultra * (dB) | 32.8 |
* ... menor é melhor
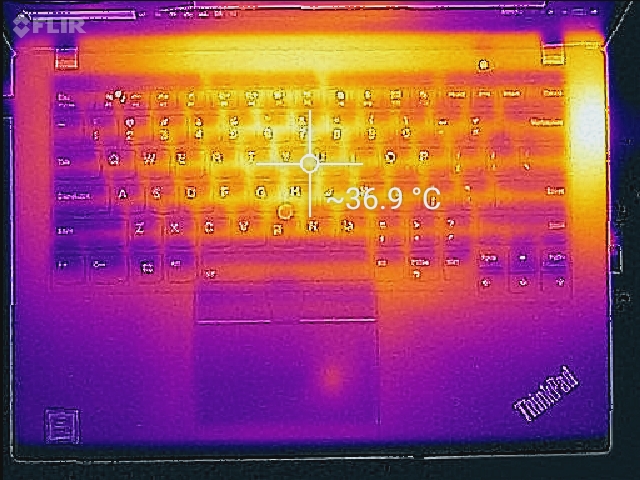
(+) A temperatura máxima no lado superior é 38.6 °C / 101 F, em comparação com a média de 34.3 °C / 94 F , variando de 21.2 a 62.5 °C para a classe Office.
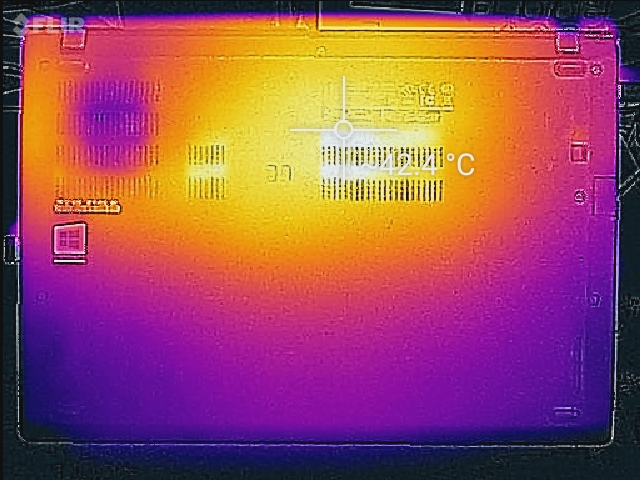
(+) A parte inferior aquece até um máximo de 39.4 °C / 103 F, em comparação com a média de 36.8 °C / 98 F
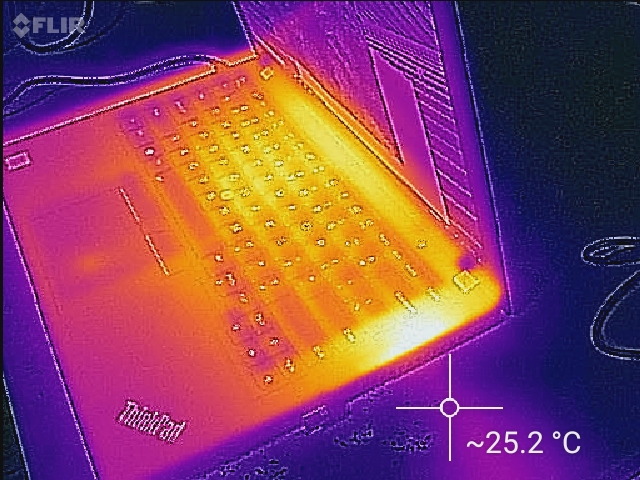
(+) Em uso inativo, a temperatura média para o lado superior é 27.4 °C / 81 F, em comparação com a média do dispositivo de 29.5 °C / ### class_avg_f### F.
(+) Os apoios para as mãos e o touchpad são mais frios que a temperatura da pele, com um máximo de 28 °C / 82.4 F e, portanto, são frios ao toque.
(±) A temperatura média da área do apoio para as mãos de dispositivos semelhantes foi 27.5 °C / 81.5 F (-0.5 °C / -0.9 F).
Lenovo ThinkPad T480s-20L7002AUS análise de áudio
(-) | alto-falantes não muito altos (###valor### dB)
Graves 100 - 315Hz
(-) | quase nenhum baixo - em média 19.3% menor que a mediana
(±) | a linearidade dos graves é média (11.9% delta para a frequência anterior)
Médios 400 - 2.000 Hz
(+) | médios equilibrados - apenas 4.2% longe da mediana
(±) | a linearidade dos médios é média (9.3% delta para frequência anterior)
Altos 2 - 16 kHz
(+) | agudos equilibrados - apenas 1.4% longe da mediana
(±) | a linearidade dos máximos é média (7.8% delta para frequência anterior)
Geral 100 - 16.000 Hz
(±) | a linearidade do som geral é média (26.2% diferença em relação à mediana)
Comparado com a mesma classe
» 80% de todos os dispositivos testados nesta classe foram melhores, 6% semelhantes, 13% piores
» O melhor teve um delta de 7%, a média foi 21%, o pior foi 53%
Comparado com todos os dispositivos testados
» 81% de todos os dispositivos testados foram melhores, 4% semelhantes, 15% piores
» O melhor teve um delta de 4%, a média foi 23%, o pior foi 134%
Dell Latitude 7490 análise de áudio
(±) | o volume do alto-falante é médio, mas bom (###valor### dB)
Graves 100 - 315Hz
(±) | graves reduzidos - em média 13.6% menor que a mediana
(±) | a linearidade dos graves é média (10.5% delta para a frequência anterior)
Médios 400 - 2.000 Hz
(+) | médios equilibrados - apenas 3.9% longe da mediana
(±) | a linearidade dos médios é média (7.3% delta para frequência anterior)
Altos 2 - 16 kHz
(+) | agudos equilibrados - apenas 3.4% longe da mediana
(±) | a linearidade dos máximos é média (8.8% delta para frequência anterior)
Geral 100 - 16.000 Hz
(±) | a linearidade do som geral é média (18.8% diferença em relação à mediana)
Comparado com a mesma classe
» 35% de todos os dispositivos testados nesta classe foram melhores, 7% semelhantes, 58% piores
» O melhor teve um delta de 7%, a média foi 21%, o pior foi 53%
Comparado com todos os dispositivos testados
» 43% de todos os dispositivos testados foram melhores, 8% semelhantes, 49% piores
» O melhor teve um delta de 4%, a média foi 23%, o pior foi 134%
| desligado | |
| Ocioso | |
| Carga |
|
Key:
min: | |
| Lenovo ThinkPad T480s-20L7002AUS i5-8250U, UHD Graphics 620, Samsung PM961 MZVLW256HEHP, TFT-LCD, 1920x1080, 14" | Lenovo ThinkPad X1 Carbon 2018-20KGS03900 i5-8550U, UHD Graphics 620, Samsung SSD PM981 MZVLB512HAJQ, IPS, 2560x1440, 14" | Dell Latitude 7490 i5-8350U, UHD Graphics 620, Toshiba KSG60ZMV256G, IPS, 1920x1080, 14" | Dell Latitude 7390 i7-8650U, UHD Graphics 620, Samsung PM961 MZVLW256HEHP, IPS, 1920x1080, 13.3" | HP EliteBook 840 G5-3JX61EA i5-8550U, UHD Graphics 620, Toshiba KXG50ZNV1T02, IPS, 1920x1080, 14" | Lenovo ThinkPad T480s-20L8S02E00 i5-8550U, GeForce MX150, Samsung SSD PM981 MZVLB512HAJQ, IPS LED, 2560x1440, 14" | |
|---|---|---|---|---|---|---|
| Power Consumption | -43% | 9% | -11% | -21% | -51% | |
| Idle Minimum * (Watt) | 3.1 | 3.8 -23% | 2 35% | 3.3 -6% | 3.8 -23% | 3.4 -10% |
| Idle Average * (Watt) | 6.4 | 8.9 -39% | 4.7 27% | 5.9 8% | 8.3 -30% | 7.5 -17% |
| Idle Maximum * (Watt) | 9.4 | 11.9 -27% | 5.7 39% | 6.2 34% | 10.7 -14% | 10.8 -15% |
| Load Average * (Watt) | 29.8 | 47.5 -59% | 38.4 -29% | 43.2 -45% | 35.5 -19% | 55.4 -86% |
| Load Maximum * (Watt) | 31.2 | 52.5 -68% | 38.9 -25% | 45.2 -45% | 37 -19% | 70.3 -125% |
| Witcher 3 ultra * (Watt) | 34 |
* ... menor é melhor
| Lenovo ThinkPad T480s-20L7002AUS i5-8250U, UHD Graphics 620, 57 Wh | Lenovo ThinkPad X1 Carbon 2018-20KGS03900 i5-8550U, UHD Graphics 620, 57 Wh | Dell Latitude 7490 i5-8350U, UHD Graphics 620, 60 Wh | Dell Latitude 7390 i7-8650U, UHD Graphics 620, 60 Wh | HP EliteBook 840 G5-3JX61EA i5-8550U, UHD Graphics 620, 50 Wh | Lenovo ThinkPad T480s-20L8S02E00 i5-8550U, GeForce MX150, 57 Wh | |
|---|---|---|---|---|---|---|
| Duração da bateria | -3% | 1% | 23% | -18% | -2% | |
| WiFi v1.3 (h) | 9 | 8.7 -3% | 9.1 1% | 11.1 23% | 7.4 -18% | 8.8 -2% |
| Reader / Idle (h) | 22.1 | 22.8 | ||||
| Load (h) | 1.8 | 1.3 |
Pro
Contra

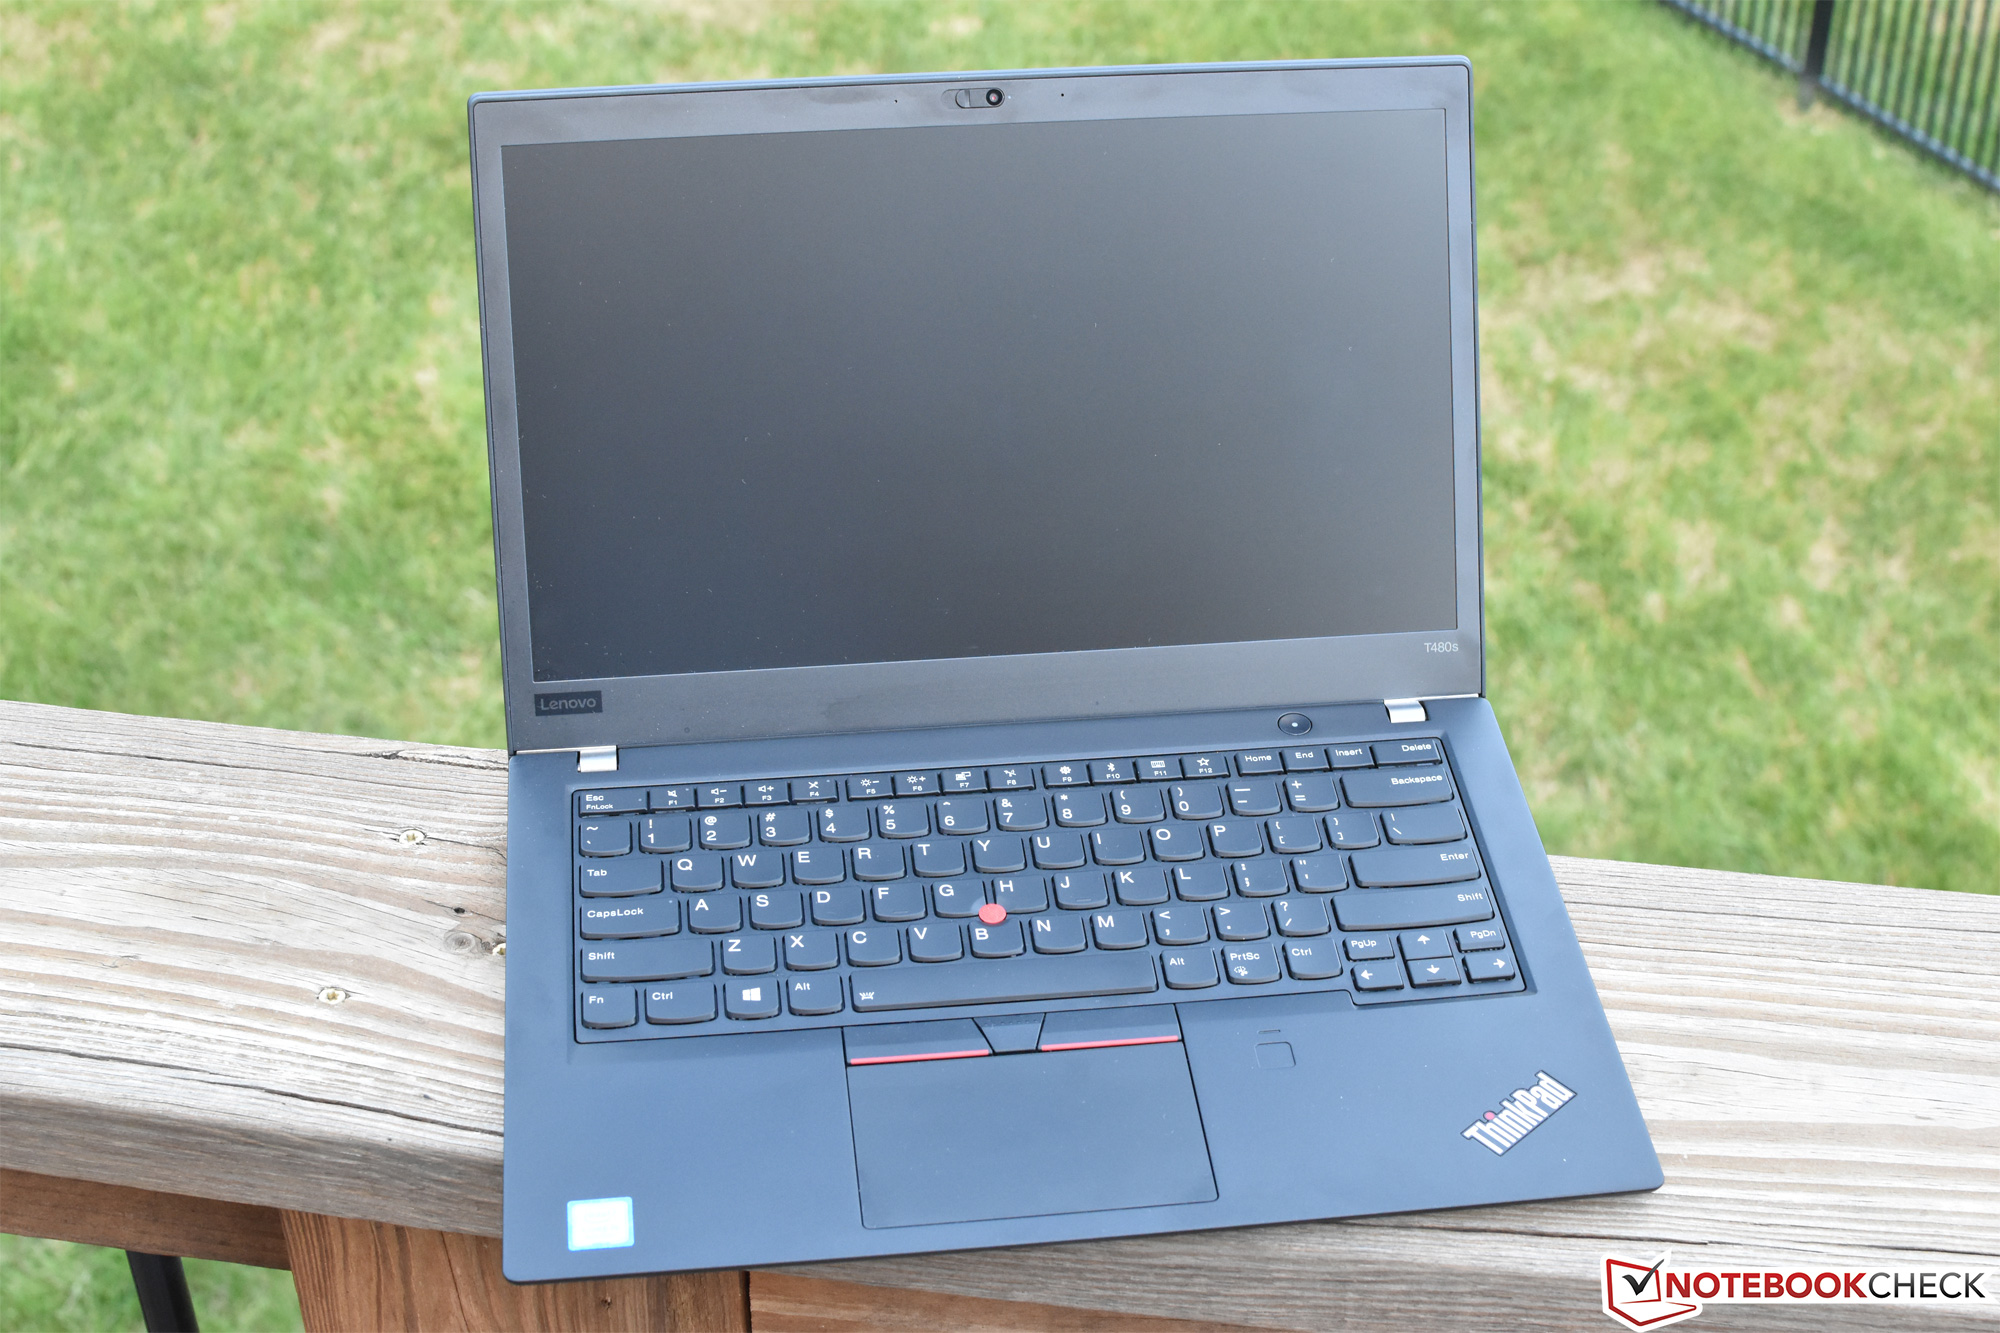
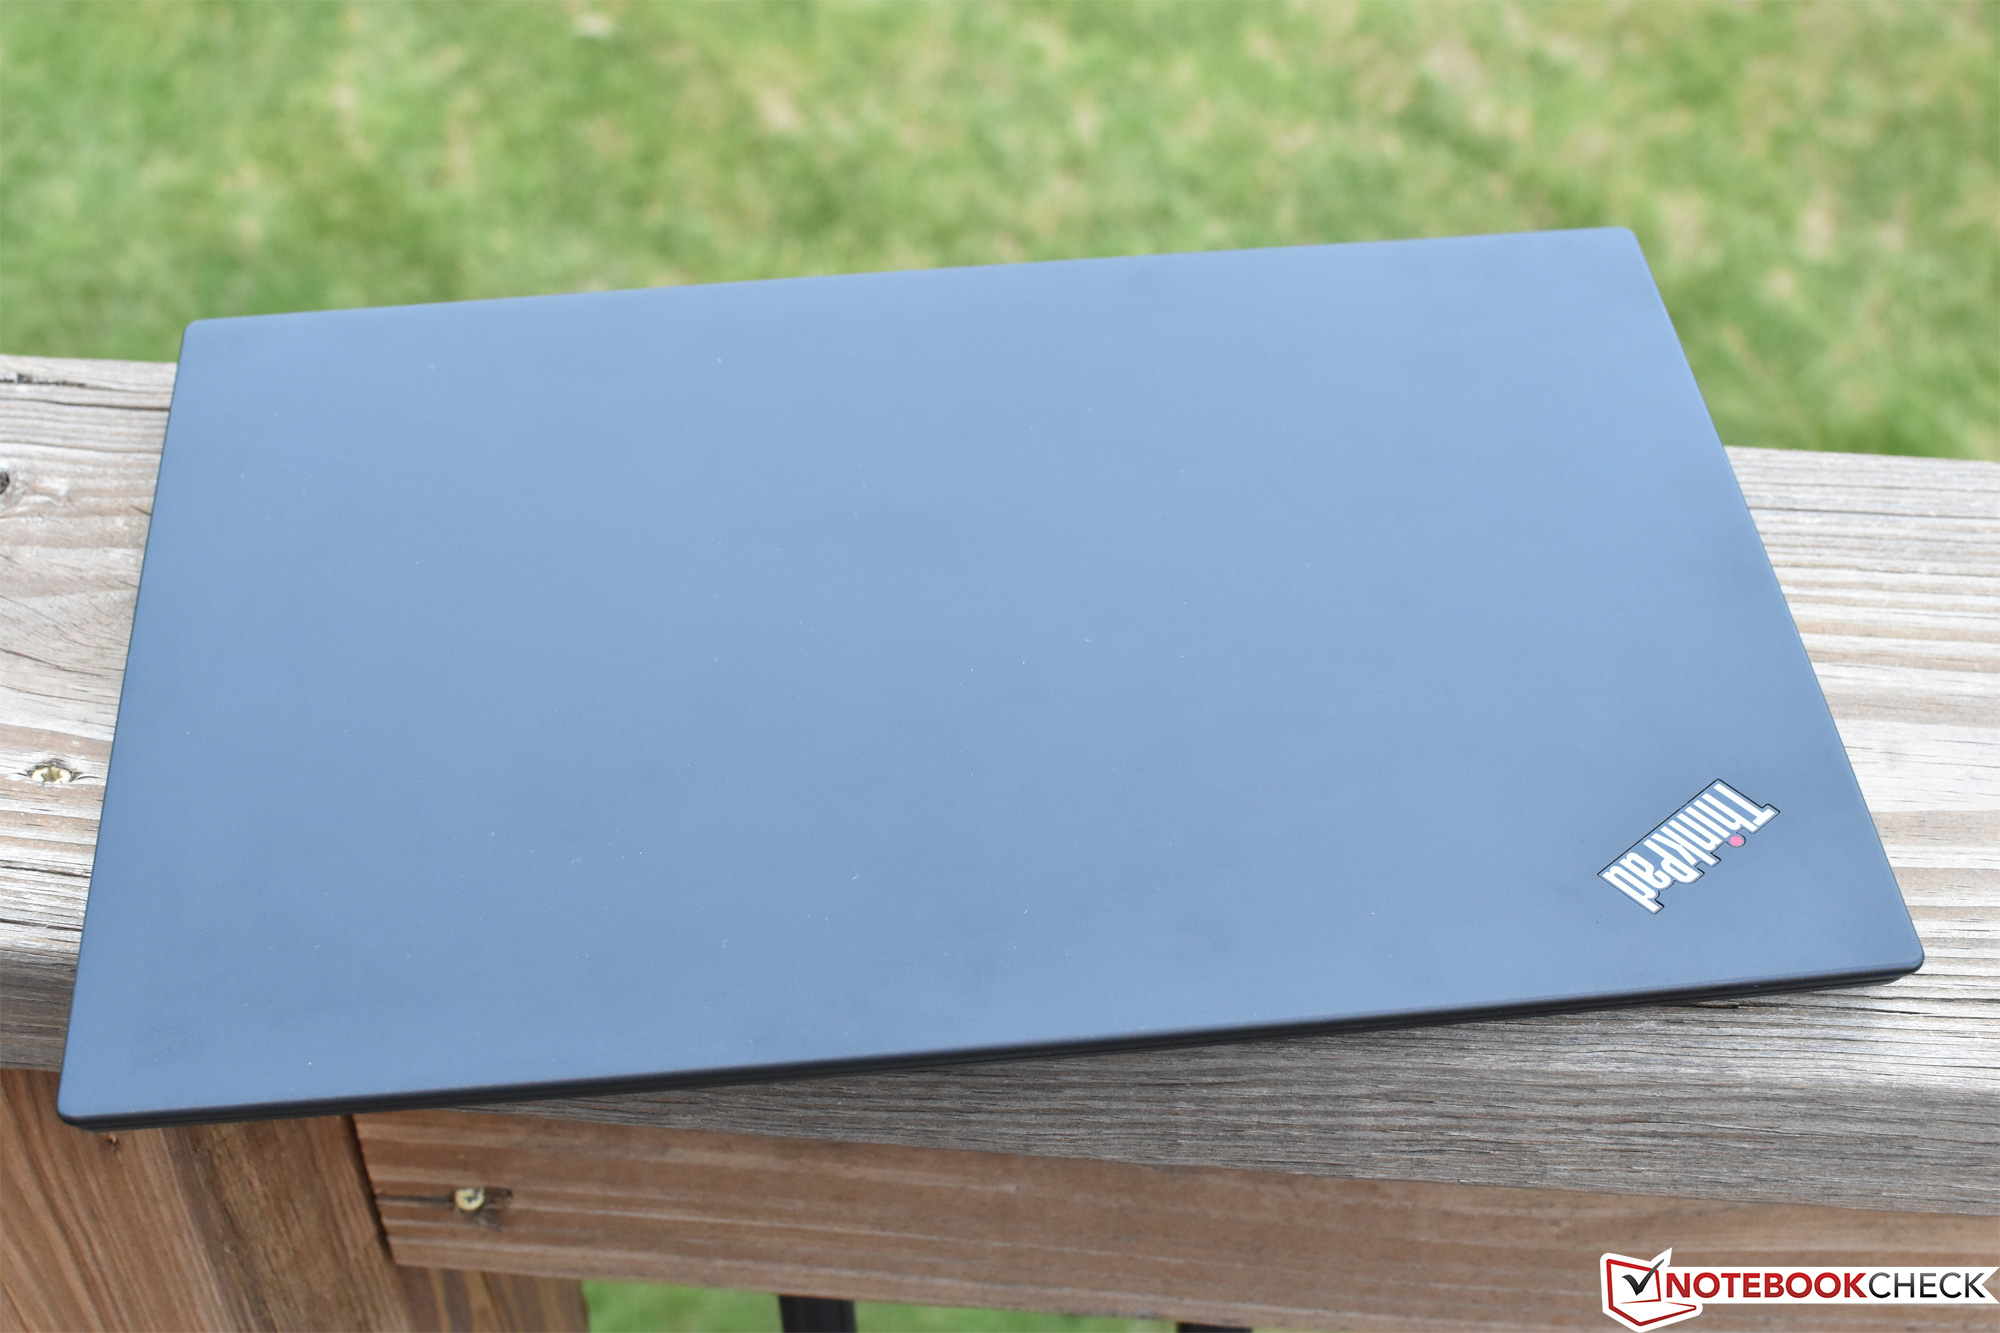
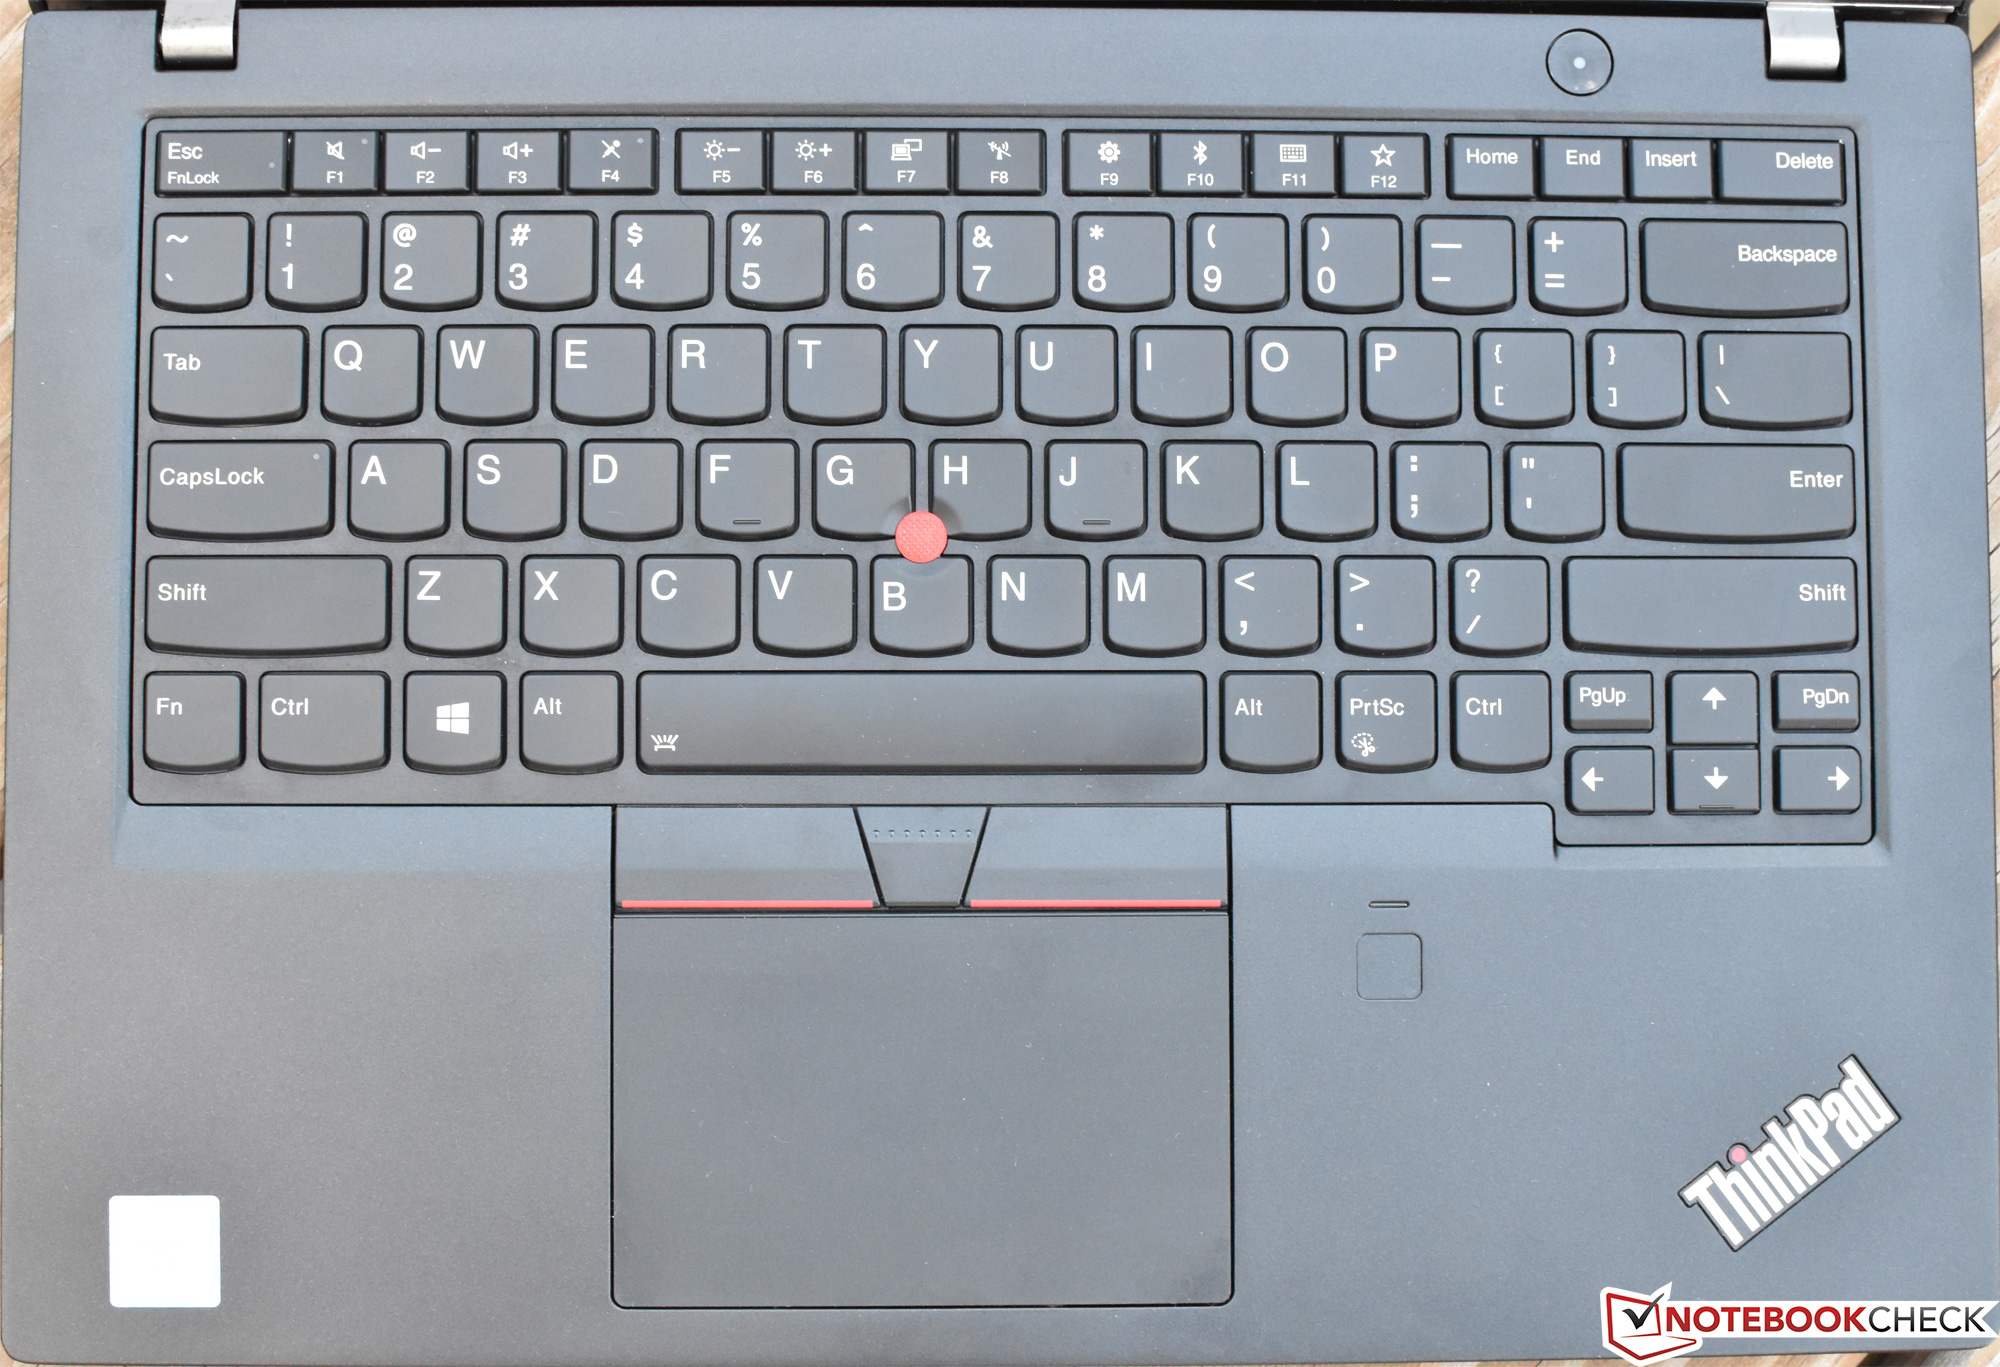
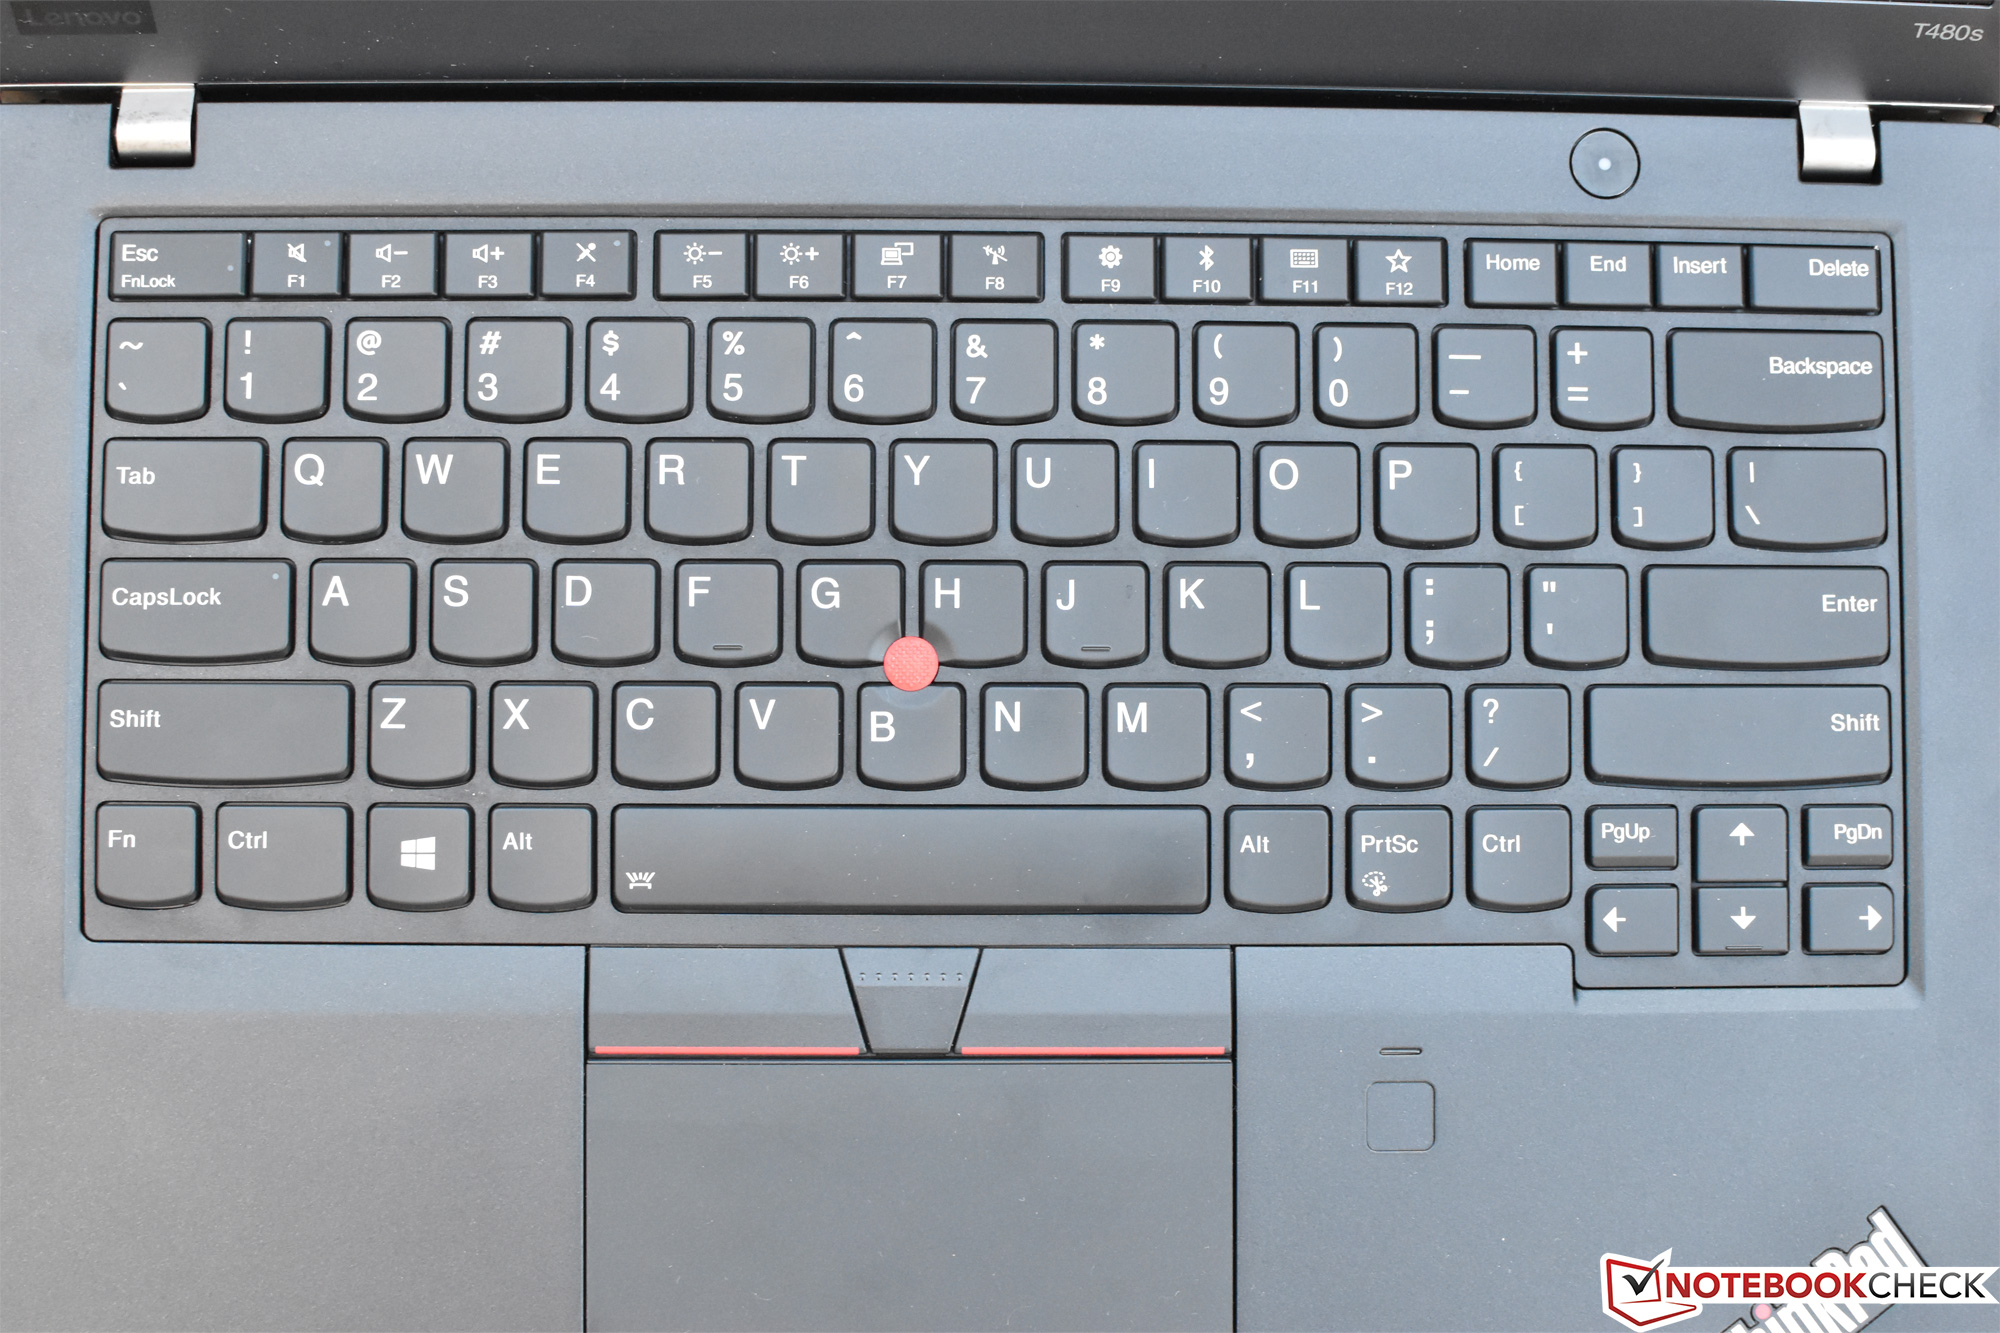
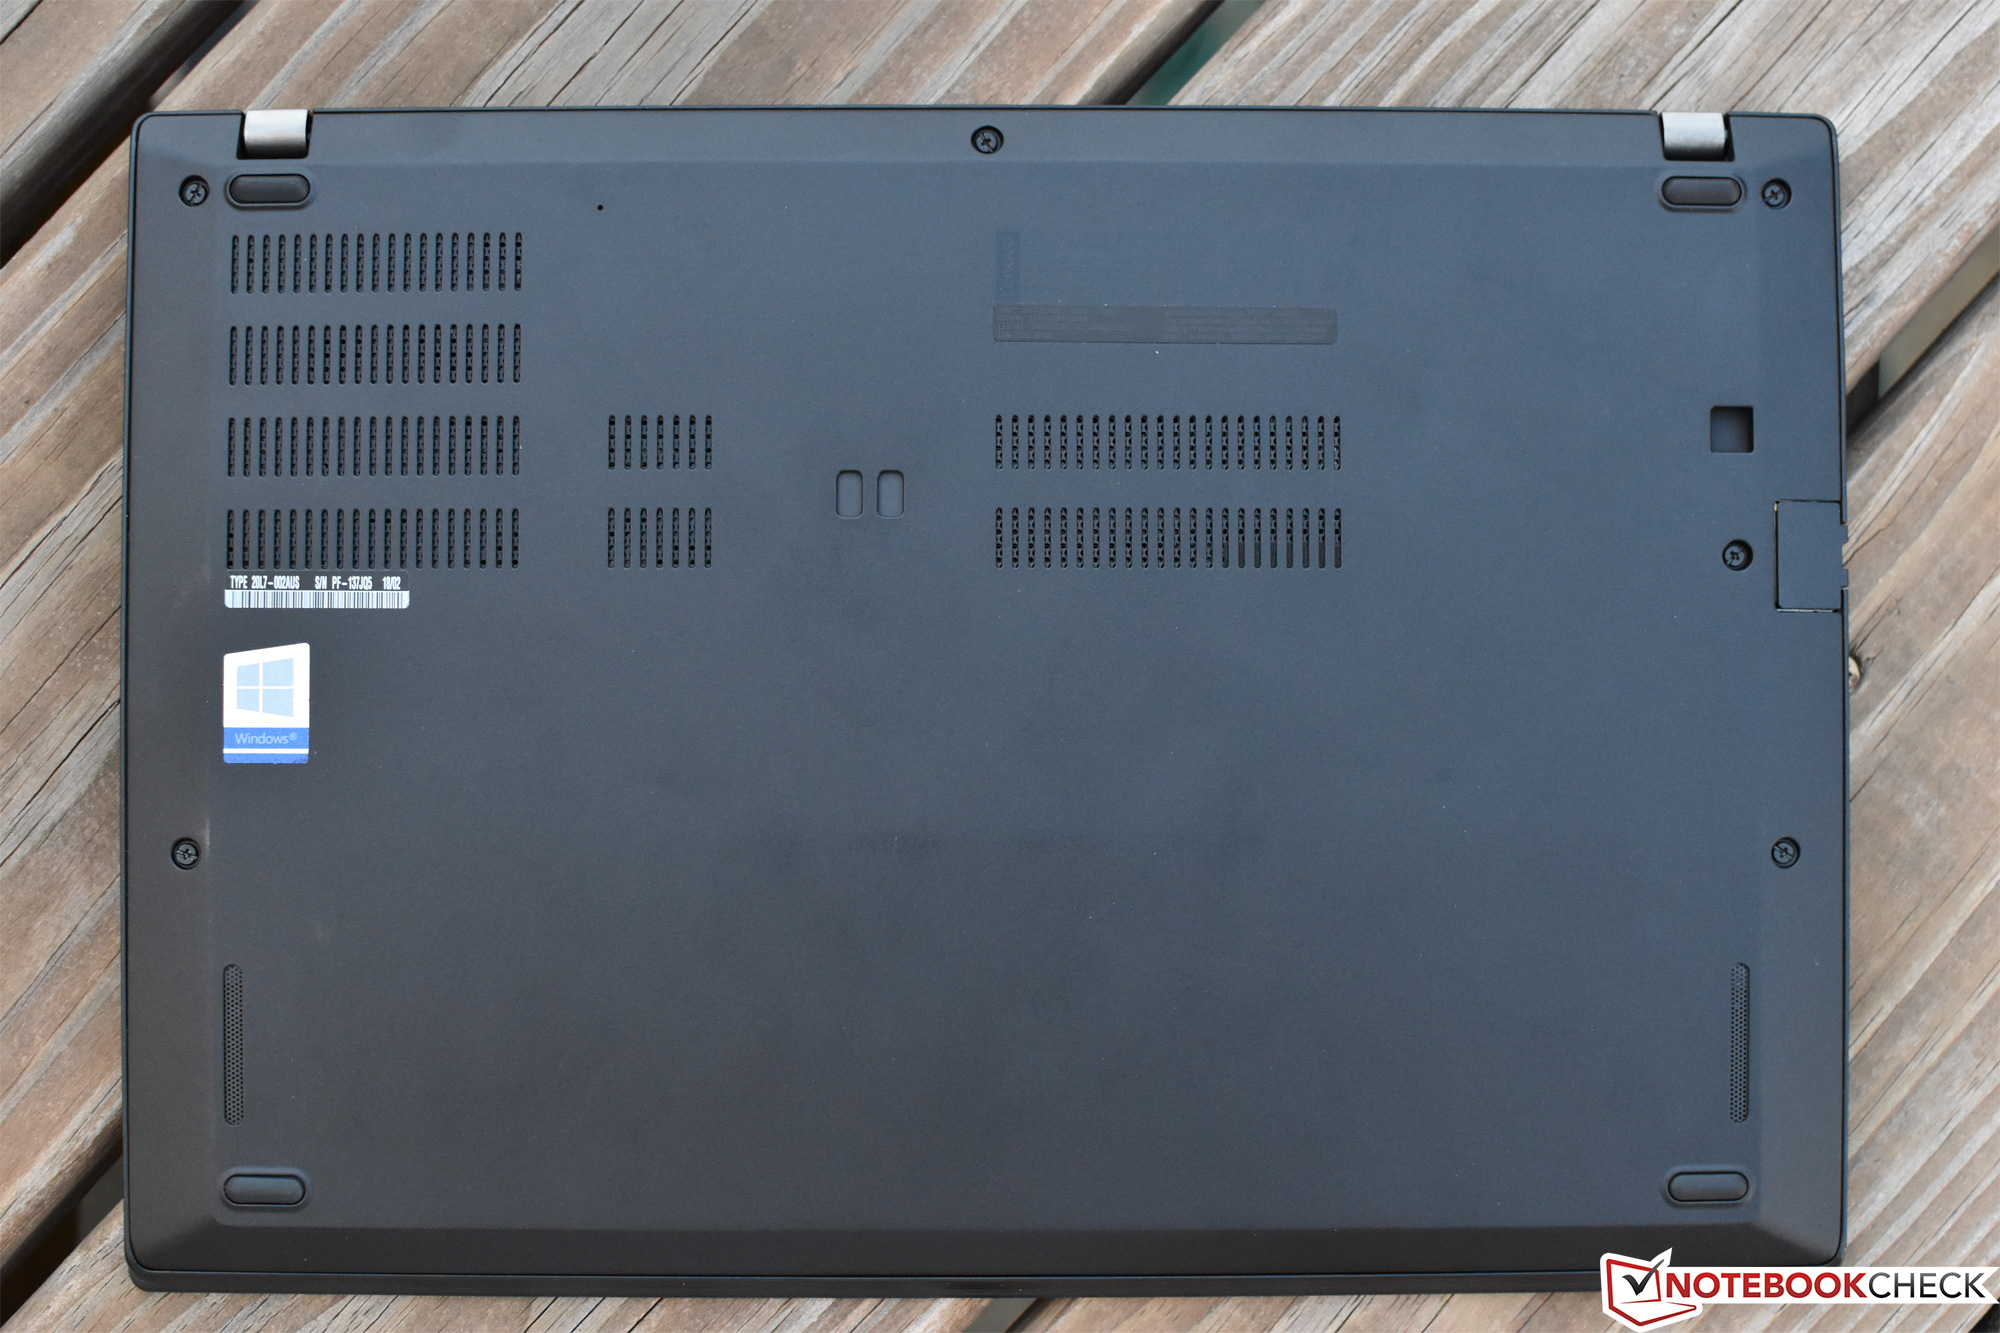
Como qualquer bom ThinkPad (ou, mais amplamente, qualquer máquina de empresarial de sucesso), são as coisas fundamentais que são o alicerce do sucesso do T480. Ainda presentes na configuração atual, é claro, todos os elementos básicos que aplaudimos durante nossas duas últimas avaliações: sólida construção CFRP de magnésio/híbrido, dispositivos de entrada de alta qualidade, muitas portas e opções de segurança robustas. O T480s é de fato um dos principais portáteis de escritório atualmente disponíveis, rivalizado por poucos em sua classe.
No entanto, para aqueles que podem ter encontrado anteriormente um preço de quase $2.000, difícil de engolir, a configuração de hoje de (aproximadamente) $1.600 somente apresenta sacrifícios menores em termos de desempenho geral. A CPU Core i5-8250U se posiciona acima da maioria dos concorrentes equipados da mesma forma, e o ainda SSD NVMe—embora abaixo do nível do ultra veloz PM981—permanece muito rápido, apesar de tudo. A opção de GPU MX150 faz sentido para aqueles interessados em um desempenho gráfico mais rápido, o Core i7 fornece um desempenho marginalmente melhor (tanto single- e multi-core), e, talvez mais significantemente—a tela WQHD está muitas ligas acima do painel FHD de hoje, que apresenta uma severa falta de saturação de cor e oferece um brilho apenas médio. Mas para um portátil de escritório básico, muito rápido e confiável, a configuração atual do T480s encaixa no perfil perfeitamente.
O T480s é de fato um dos principais portáteis de escritório atualmente disponíveis, rivalizado por poucos em sua classe. E para aqueles que podem ter encontrado anteriormente um preço de quase $2.000, difícil de engolir, a configuração de hoje de (aproximadamente) $1.600 somente apresenta sacrifícios menores em termos de desempenho geral.
Concorrentes como a venerável série Latitude 7000 da Dell (especificamente neste caso, o 7490 e 7390), o HP EliteBook 840 G5, e o excelente X1 Carbon da própria Lenovo, todos oferecem seu singular conjunto de benefícios, sem mencionar as garantias de 3 anos no local, contra a garantia de 1 ano do T480s, mas poucos conseguem alcançar o desempenho do T480s. Pelos nossos testes, um T480s equipado com um Core i5 pode ser tão capaz (ou mais) quanto um Dell Latitude 7000 ou HP EliteBook 840 equipado com um i7. É difícil errar com qualquer um destes dispositivos, mas com o T480s, a Lenovo claramente tem um vencedor em suas mãos.
Lenovo ThinkPad T480s-20L7002AUS
- 07/07/2018 v6 (old)
Steve Schardein
Price comparison
