Breve Análise do Portátil Lenovo ThinkPad X1 Carbon 2017 (Core i5, Full HD)

| SD Card Reader | |
| average JPG Copy Test (av. of 3 runs) | |
| Lenovo ThinkPad T470-20HD002HGE | |
| Fujitsu LifeBook U747 | |
| Lenovo ThinkPad X1 Carbon 2017-20HR0021GE | |
| Lenovo ThinkPad X1 Carbon 2017-20HQS03P00 | |
| maximum AS SSD Seq Read Test (1GB) | |
| Lenovo ThinkPad T470-20HD002HGE | |
| Lenovo ThinkPad X1 Carbon 2017-20HR0021GE | |
| Fujitsu LifeBook U747 | |
| Lenovo ThinkPad X1 Carbon 2017-20HQS03P00 | |
| |||||||||||||||||||||||||
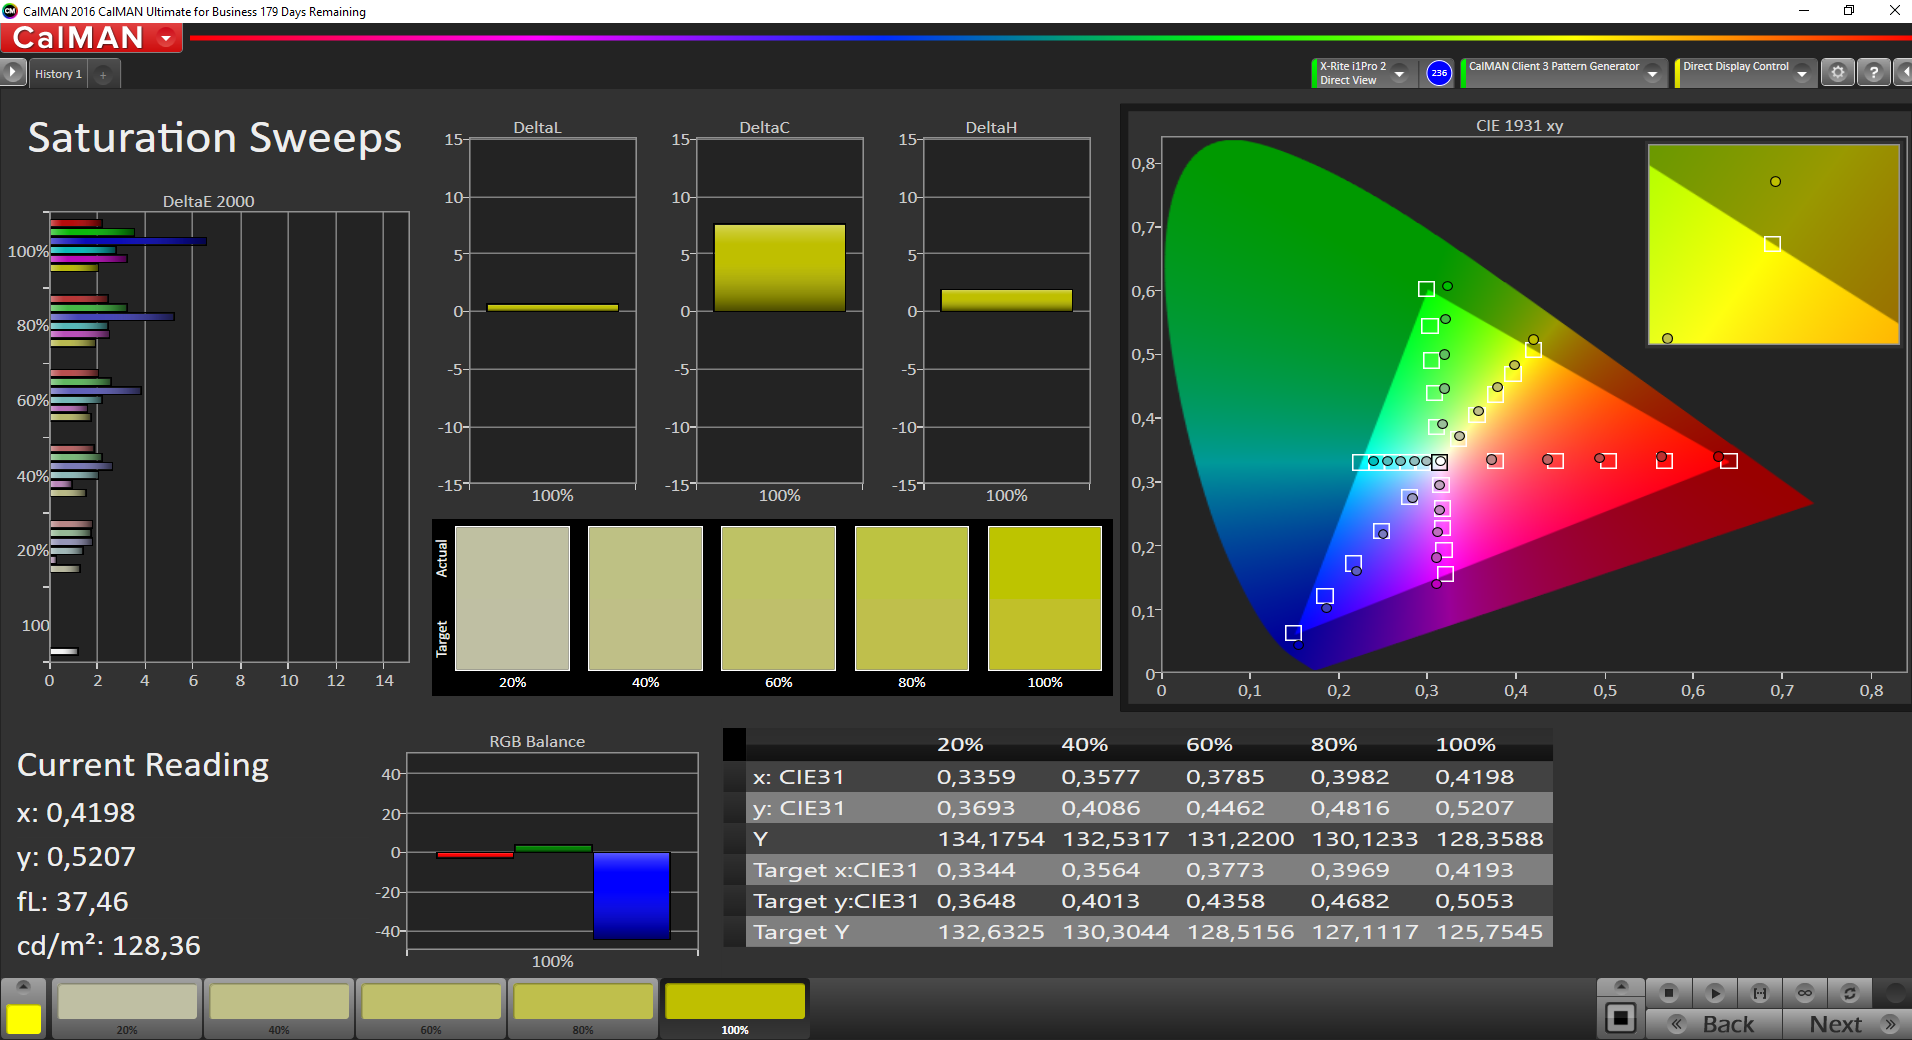
iluminação: 91 %
iluminação com acumulador: 277 cd/m²
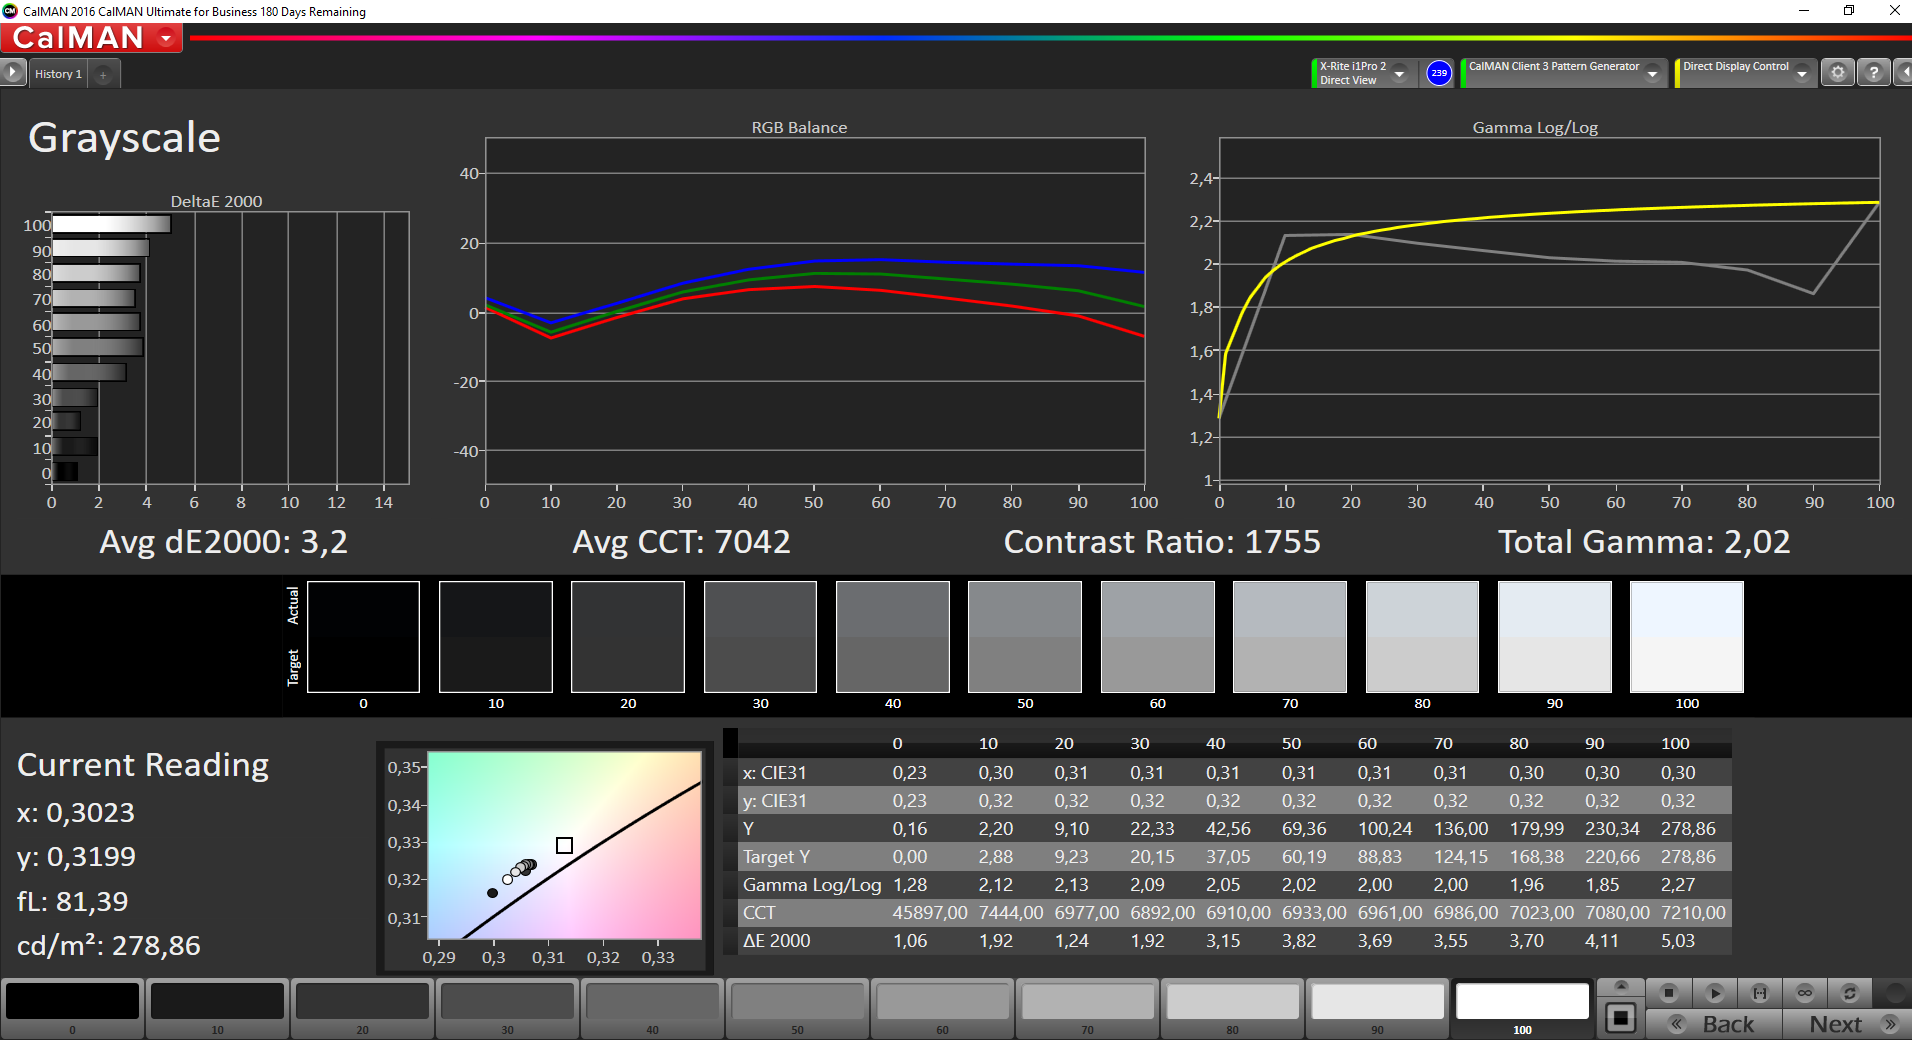
Contraste: 1738:1 (Preto: 0.16 cd/m²)
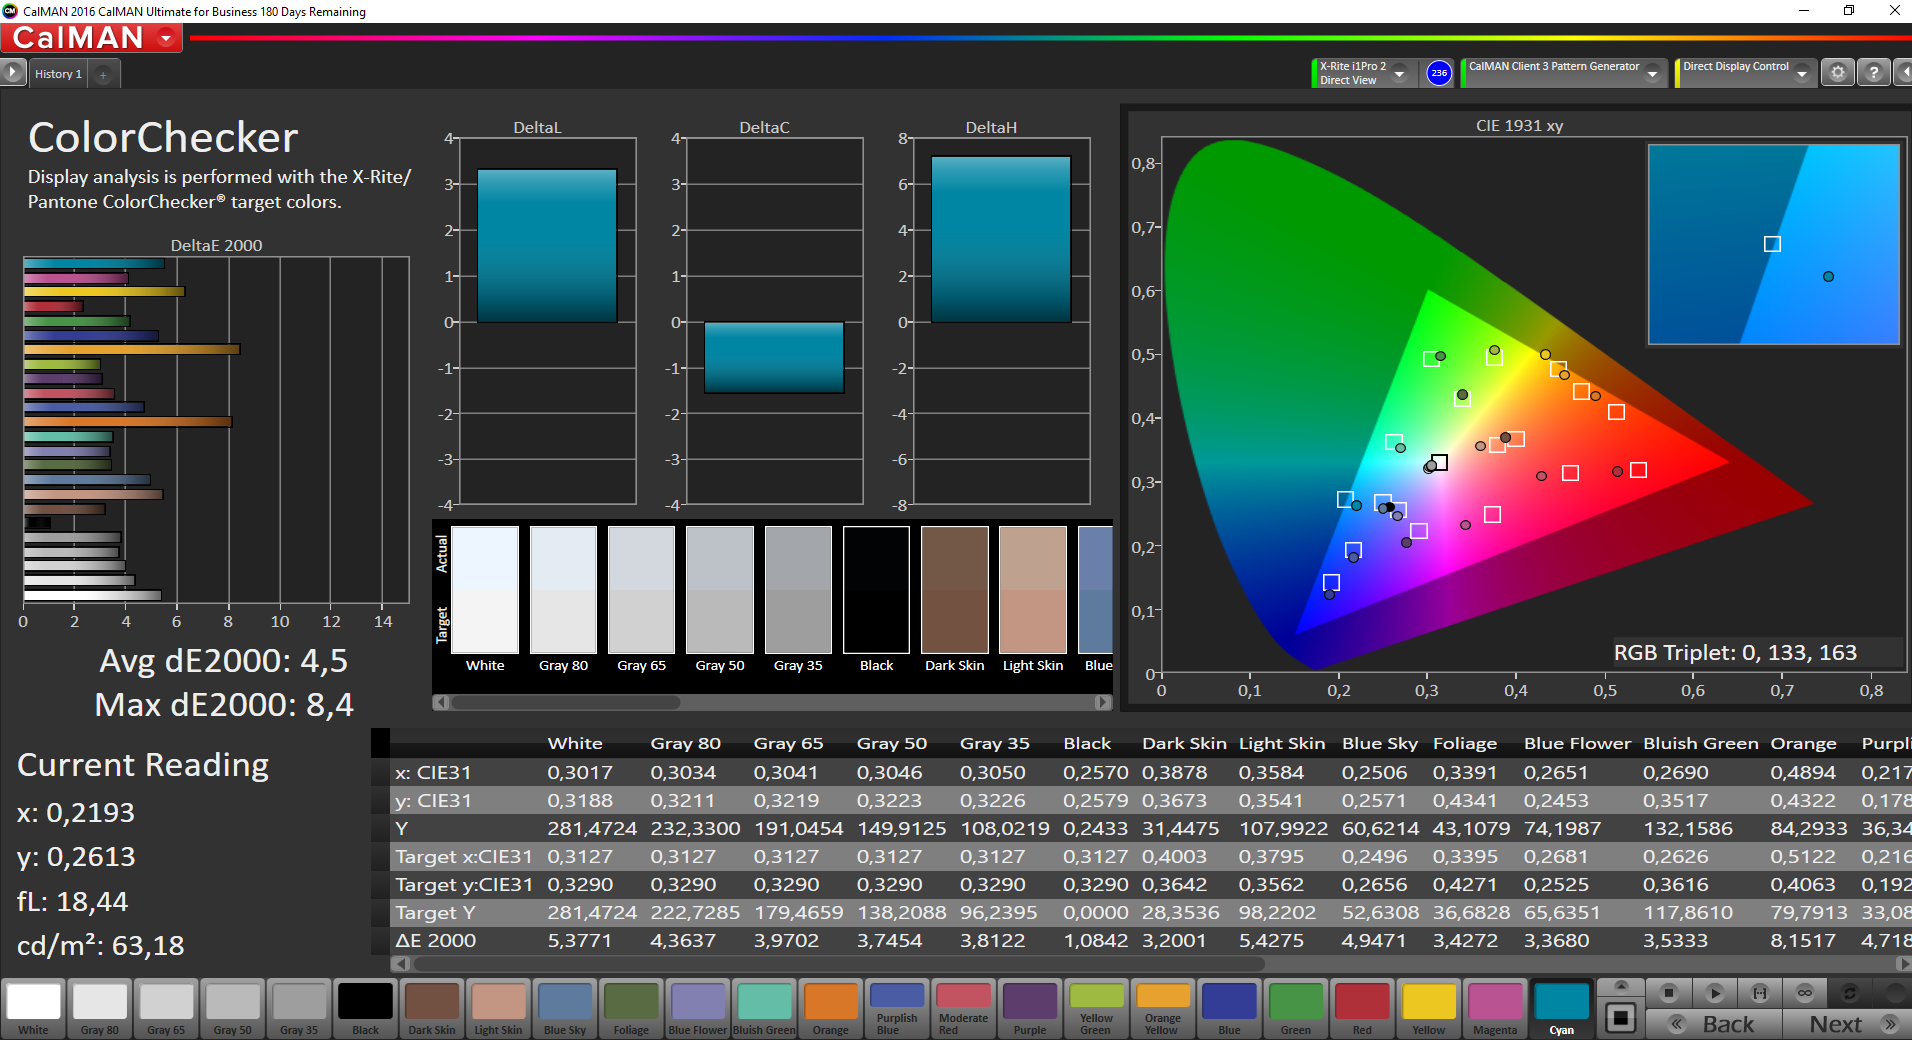
ΔE ColorChecker Calman: 4.5 | ∀{0.5-29.43 Ø4.71}
ΔE Greyscale Calman: 3.2 | ∀{0.09-98 Ø4.96}
87.5% sRGB (Argyll 1.6.3 3D)
57% AdobeRGB 1998 (Argyll 1.6.3 3D)
62.6% AdobeRGB 1998 (Argyll 3D)
87.6% sRGB (Argyll 3D)
61.6% Display P3 (Argyll 3D)
Gamma: 2.02
CCT: 7042 K
| Lenovo ThinkPad X1 Carbon 2017-20HR0021GE B140HAN03_1, , 1920x1080, 14" | Lenovo ThinkPad X1 Carbon 2017-20HQS03P00 B140HAN03_1, , 1920x1080, 14" | Lenovo ThinkPad X1 Carbon 20FB-005XUS 1920x1080, 14" | Lenovo ThinkPad X1 Carbon 20FB003RGE VVX14T058J00, , 2560x1440, 14" | Lenovo ThinkPad T470s-20HGS00V00 B140QAN01.5, , 2560x1440, 14" | HP EliteBook Folio 1040 G3 AUO1136, , 2560x1440, 14" | Fujitsu LifeBook U747 LG LP140WF3, , 1920x1080, 14" | |
|---|---|---|---|---|---|---|---|
| Display | -1% | -4% | 8% | 11% | 11% | 1% | |
| Display P3 Coverage (%) | 61.6 | 61.4 0% | 58.9 -4% | 66.7 8% | 69 12% | 67.9 10% | 66.1 7% |
| sRGB Coverage (%) | 87.6 | 85.9 -2% | 83.1 -5% | 94.7 8% | 95.1 9% | 96.8 11% | 84.8 -3% |
| AdobeRGB 1998 Coverage (%) | 62.6 | 62.4 0% | 60.3 -4% | 68.4 9% | 69.6 11% | 70 12% | 62 -1% |
| Response Times | 5% | 6% | 15% | 4% | 8% | 25% | |
| Response Time Grey 50% / Grey 80% * (ms) | 48 ? | 41.6 ? 13% | 47.2 ? 2% | 44 ? 8% | 46.4 ? 3% | 46.4 ? 3% | 36 ? 25% |
| Response Time Black / White * (ms) | 30.4 ? | 31.6 ? -4% | 27.6 ? 9% | 24 ? 21% | 28.8 ? 5% | 26.4 ? 13% | 23.2 ? 24% |
| PWM Frequency (Hz) | 220 ? | ||||||
| Screen | -19% | -7% | -7% | -29% | -15% | -17% | |
| Brightness middle (cd/m²) | 278 | 311 12% | 321.7 16% | 272 -2% | 327 18% | 327 18% | 291 5% |
| Brightness (cd/m²) | 271 | 288 6% | 301 11% | 268 -1% | 311 15% | 316 17% | 296 9% |
| Brightness Distribution (%) | 91 | 85 -7% | 89 -2% | 95 4% | 88 -3% | 87 -4% | 84 -8% |
| Black Level * (cd/m²) | 0.16 | 0.24 -50% | 0.294 -84% | 0.32 -100% | 0.25 -56% | 0.35 -119% | 0.32 -100% |
| Contrast (:1) | 1738 | 1296 -25% | 1094 -37% | 850 -51% | 1308 -25% | 934 -46% | 909 -48% |
| Colorchecker dE 2000 * | 4.5 | 5.5 -22% | 3.96 12% | 2.61 42% | 6.1 -36% | 4.39 2% | 4.3 4% |
| Colorchecker dE 2000 max. * | 8.4 | 9 -7% | 6.69 20% | 6.43 23% | 12.2 -45% | 7.27 13% | 7.5 11% |
| Greyscale dE 2000 * | 3.2 | 6.2 -94% | 3.15 2% | 3.31 -3% | 8.8 -175% | 4.69 -47% | 4.3 -34% |
| Gamma | 2.02 109% | 2.02 109% | 2.34 94% | 2.35 94% | 2.18 101% | 2.15 102% | 2.31 95% |
| CCT | 7042 92% | 5950 109% | 7082 92% | 6360 102% | 6172 105% | 7101 92% | 6529 100% |
| Color Space (Percent of AdobeRGB 1998) (%) | 57 | 55.96 -2% | 53.8 -6% | 63 11% | 61.56 8% | 62.52 10% | 55.46 -3% |
| Color Space (Percent of sRGB) (%) | 87.5 | 85.77 -2% | 82.7 -5% | 95 9% | 94.88 8% | 96.71 11% | 84.77 -3% |
| Média Total (Programa/Configurações) | -5% /
-12% | -2% /
-5% | 5% /
-1% | -5% /
-17% | 1% /
-6% | 3% /
-8% |
* ... menor é melhor


Exibir tempos de resposta
| ↔ Tempo de resposta preto para branco | ||
|---|---|---|
| 30.4 ms ... ascensão ↗ e queda ↘ combinadas | ↗ 18.8 ms ascensão | 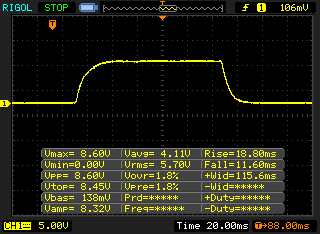 |
| ↘ 11.6 ms queda | ||
| A tela mostra taxas de resposta lentas em nossos testes e será insatisfatória para os jogadores. Em comparação, todos os dispositivos testados variam de 0.1 (mínimo) a 240 (máximo) ms. » 82 % de todos os dispositivos são melhores. Isso significa que o tempo de resposta medido é pior que a média de todos os dispositivos testados (19.8 ms). | ||
| ↔ Tempo de resposta 50% cinza a 80% cinza | ||
| 48 ms ... ascensão ↗ e queda ↘ combinadas | ↗ 22 ms ascensão | 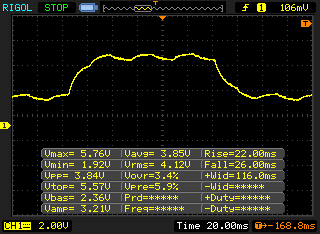 |
| ↘ 26 ms queda | ||
| A tela mostra taxas de resposta lentas em nossos testes e será insatisfatória para os jogadores. Em comparação, todos os dispositivos testados variam de 0.165 (mínimo) a 636 (máximo) ms. » 82 % de todos os dispositivos são melhores. Isso significa que o tempo de resposta medido é pior que a média de todos os dispositivos testados (31 ms). | ||
Cintilação da tela / PWM (modulação por largura de pulso)
| Tela tremeluzindo / PWM não detectado | 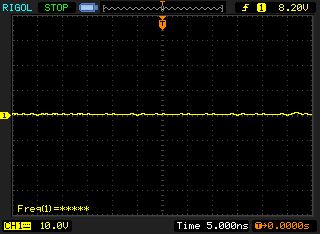 | ||
[pwm_comparison] Em comparação: 52 % de todos os dispositivos testados não usam PWM para escurecer a tela. Se PWM foi detectado, uma média de 7757 (mínimo: 5 - máximo: 343500) Hz foi medida. | |||

* ... menor é melhor

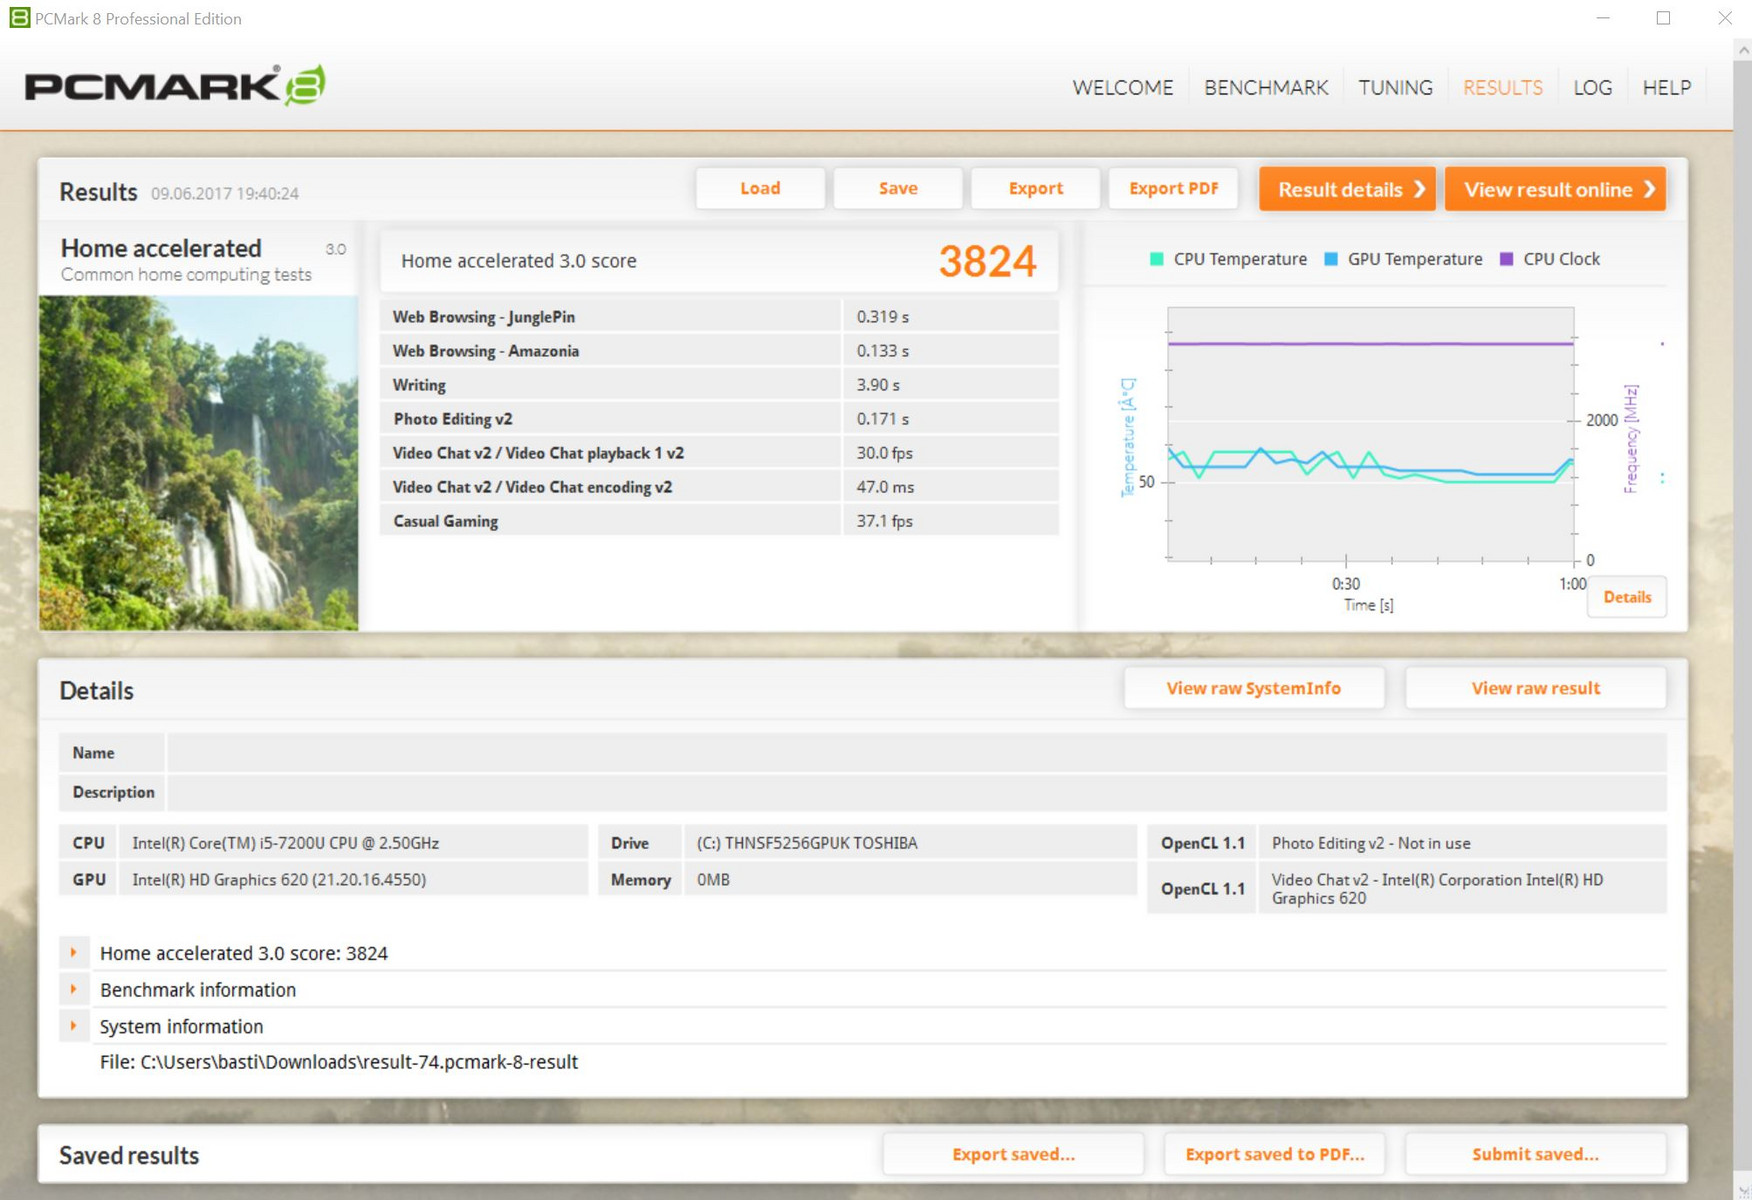
| PCMark 8 Home Score Accelerated v2 | 3824 pontos | |
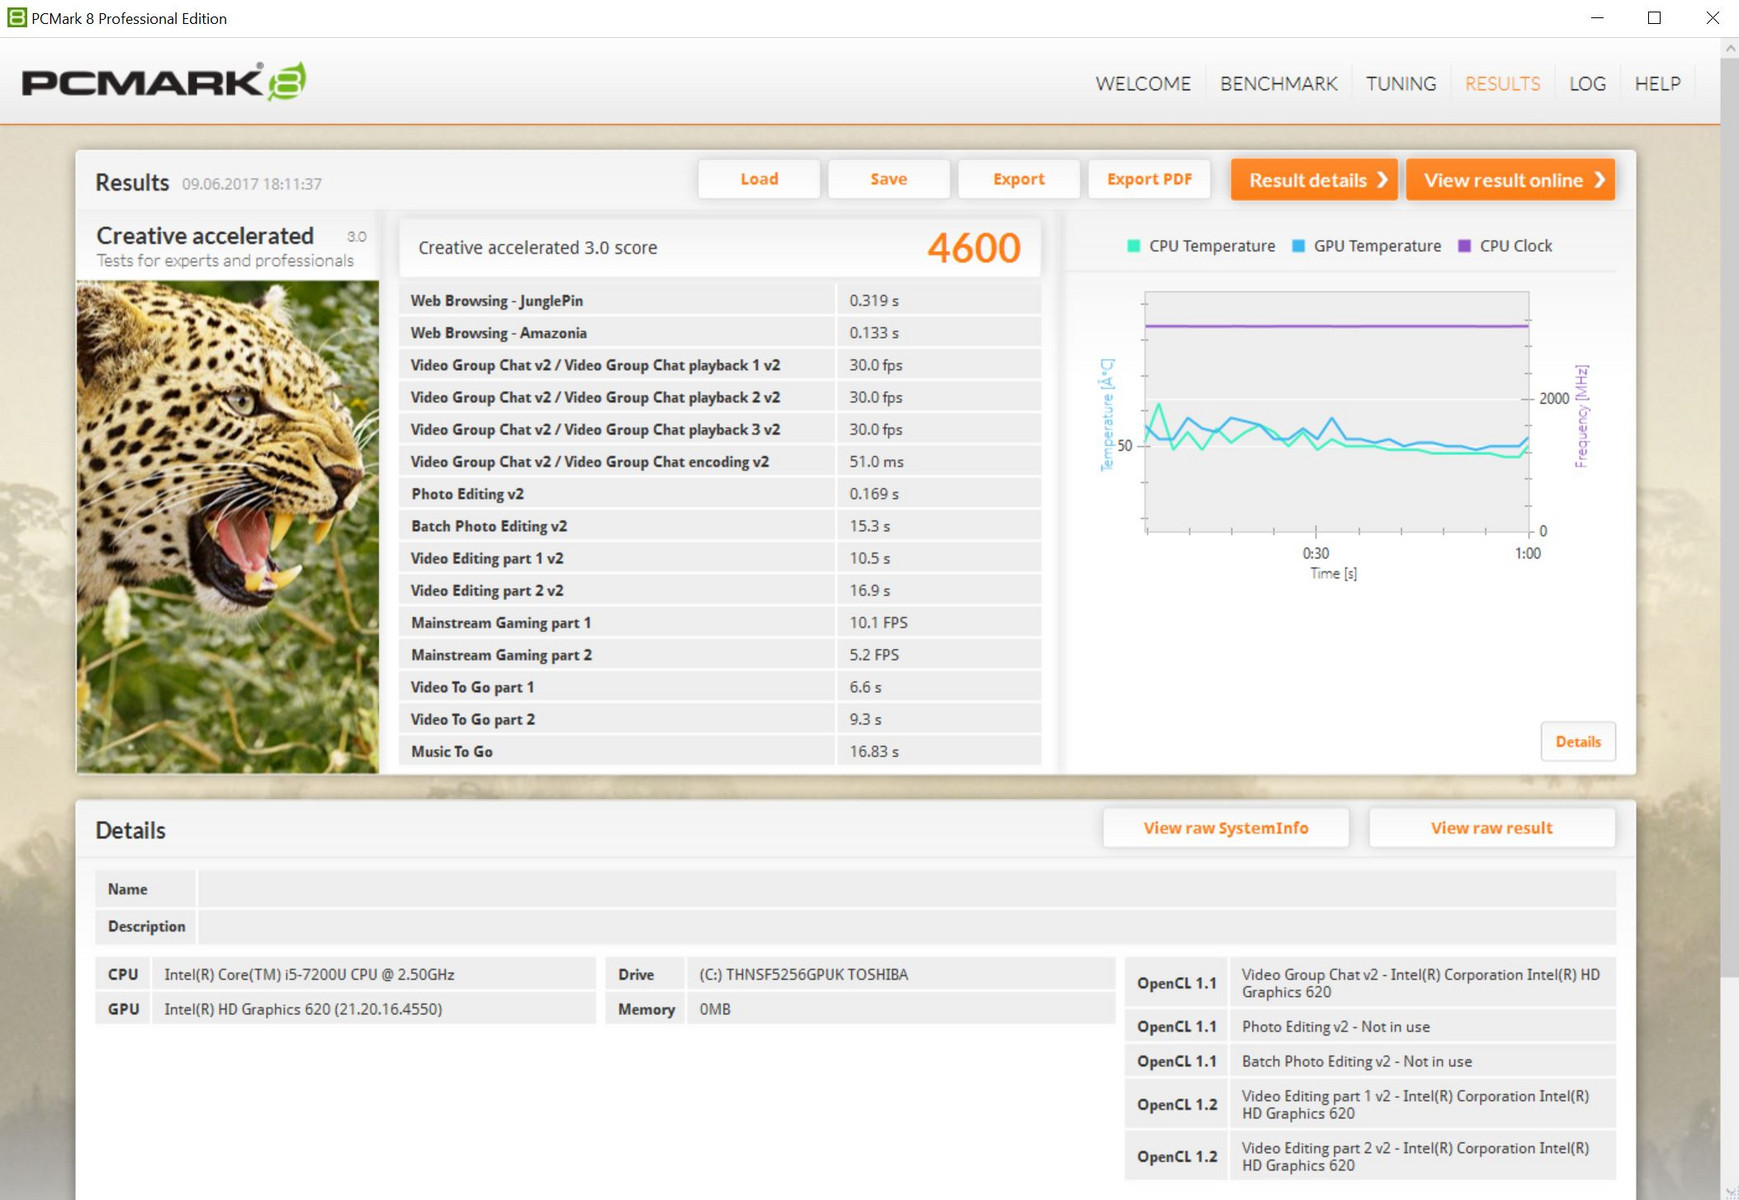
| PCMark 8 Creative Score Accelerated v2 | 4600 pontos | |
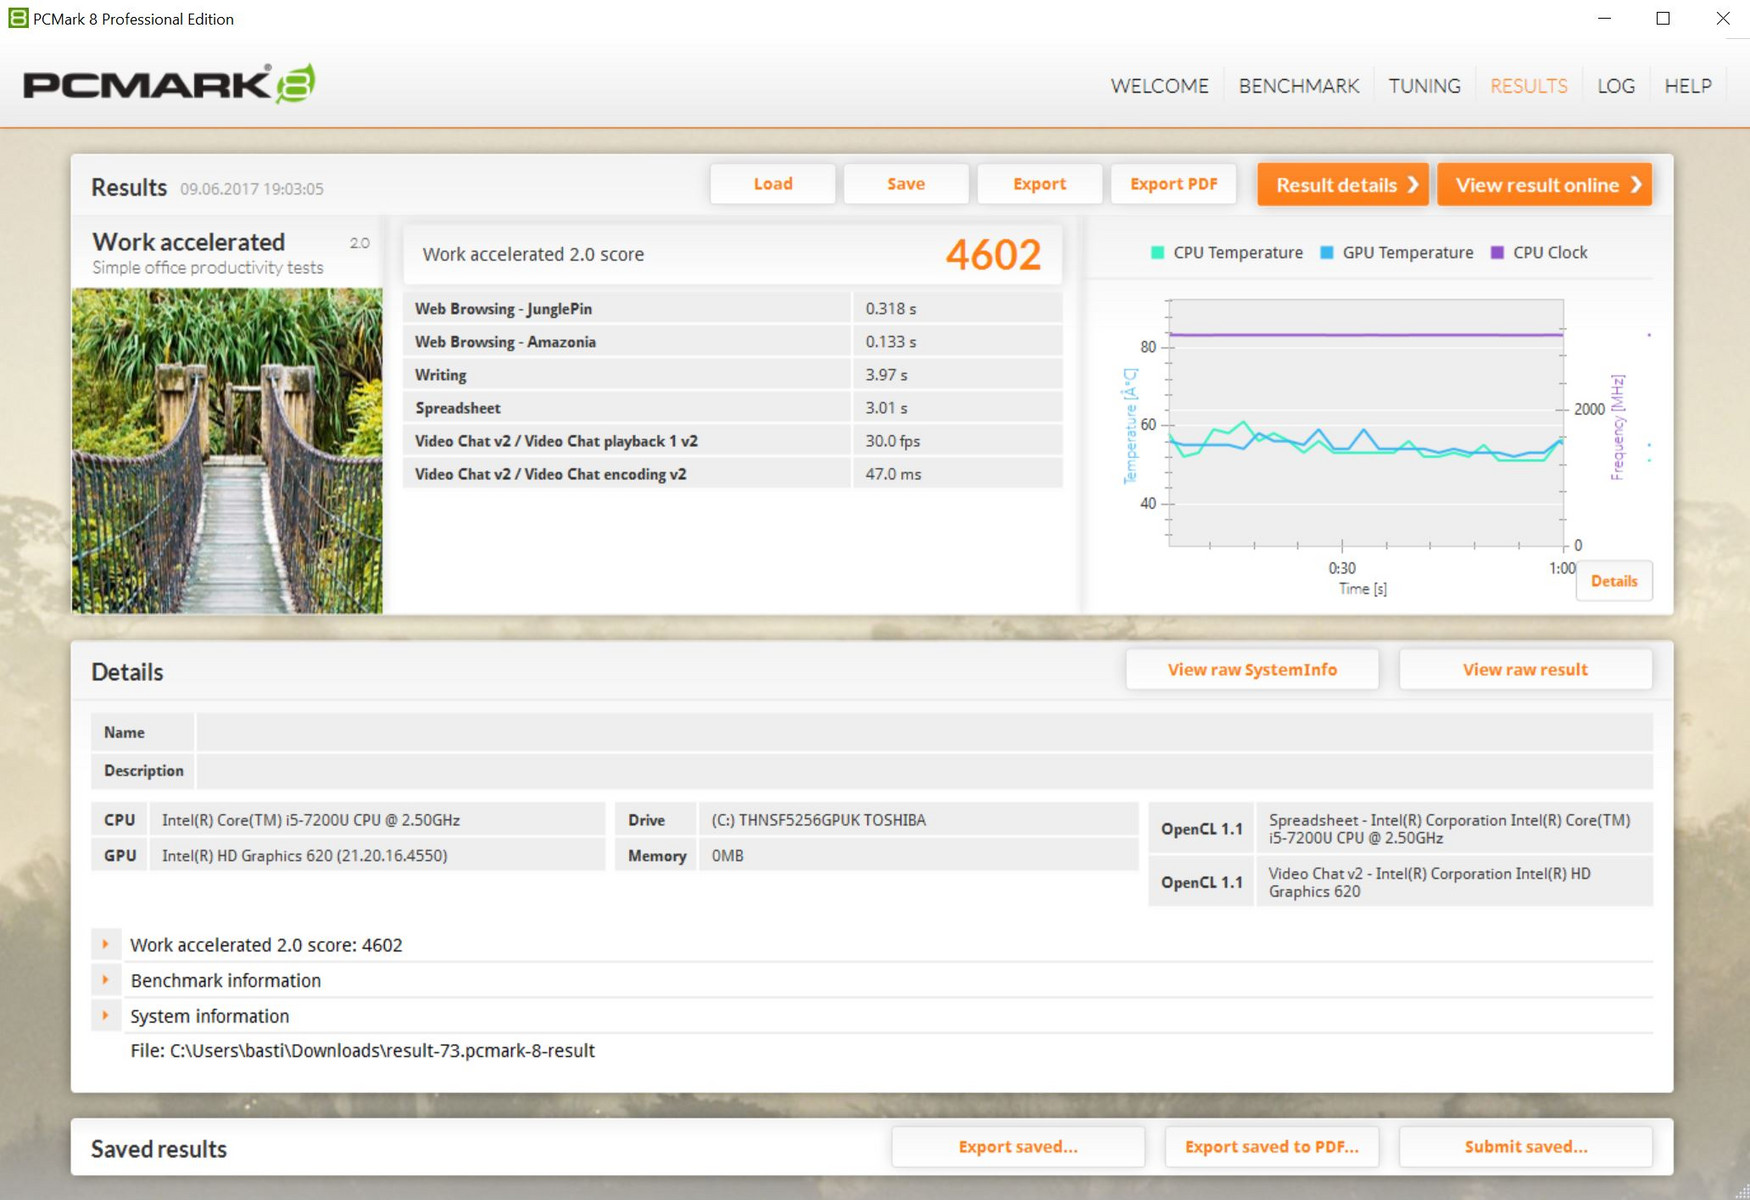
| PCMark 8 Work Score Accelerated v2 | 4602 pontos | |
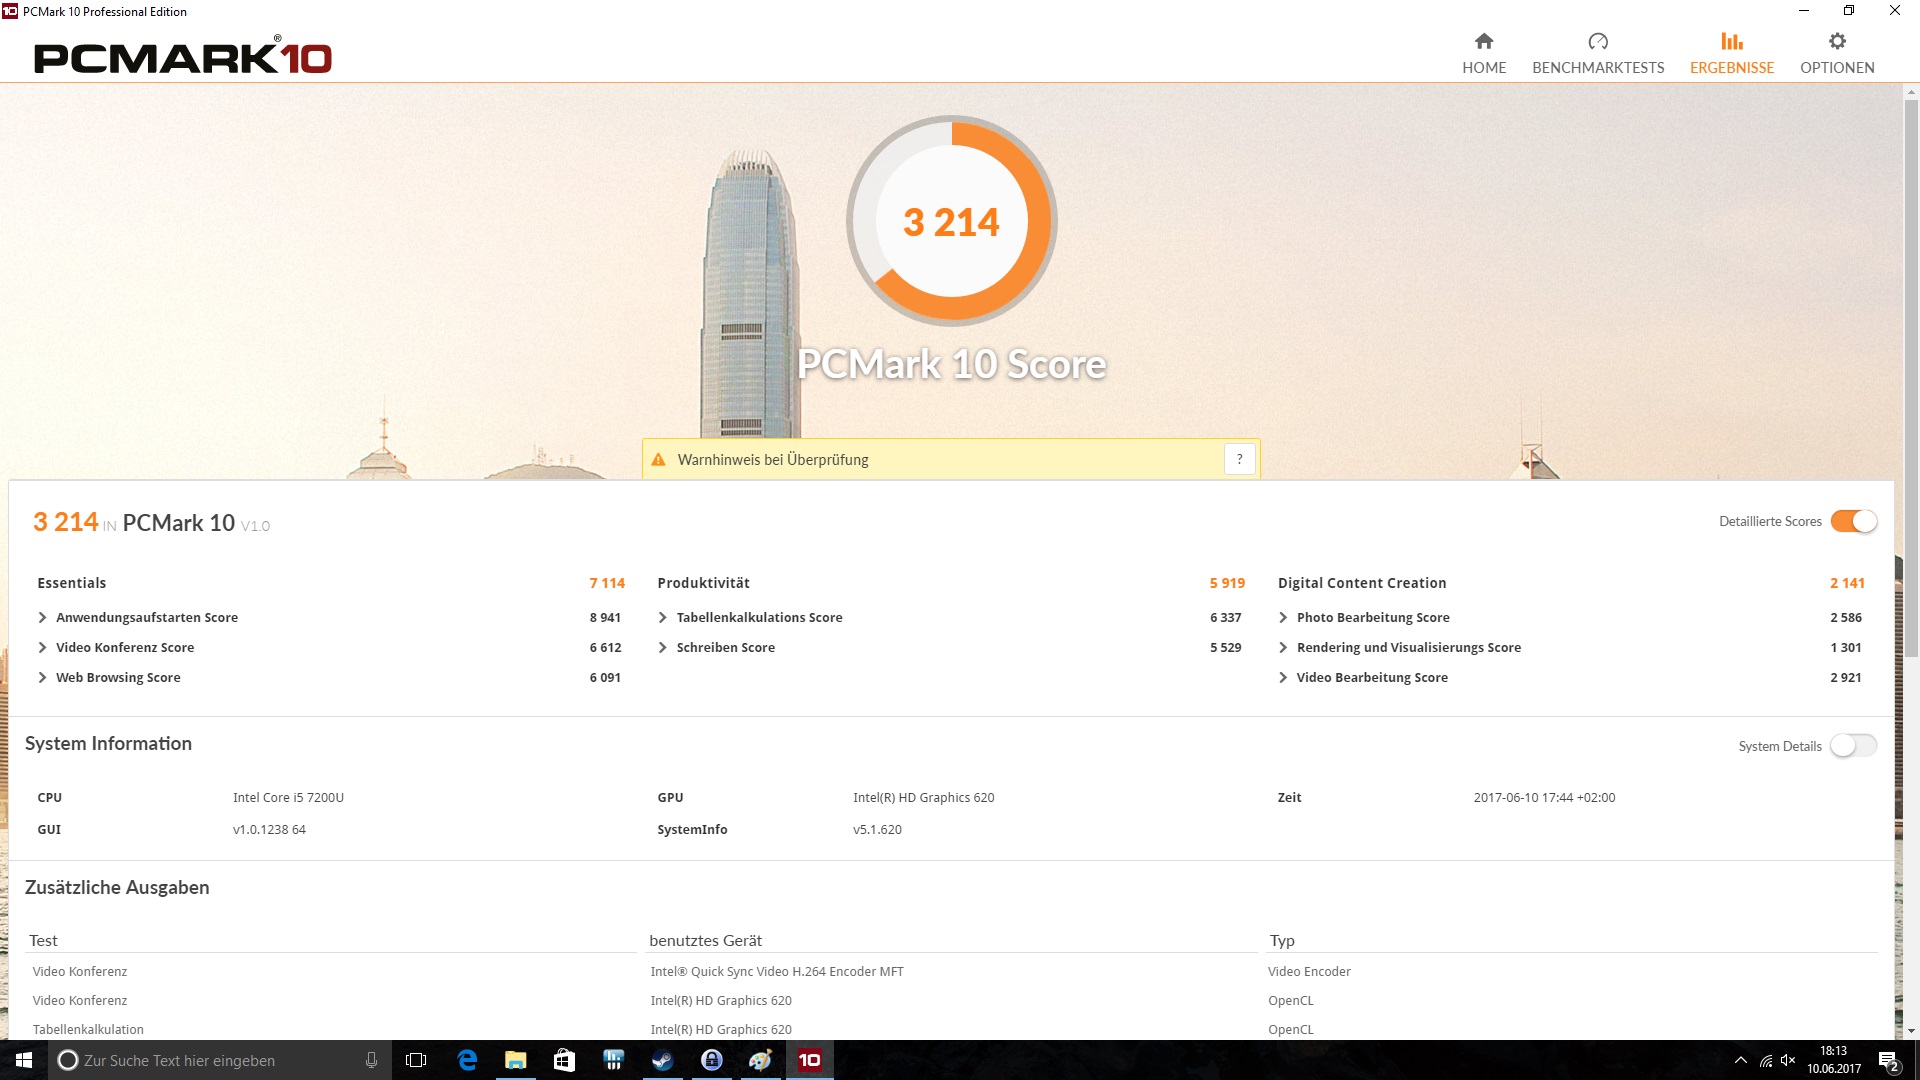
| PCMark 10 Score | 3214 pontos | |
Ajuda | ||
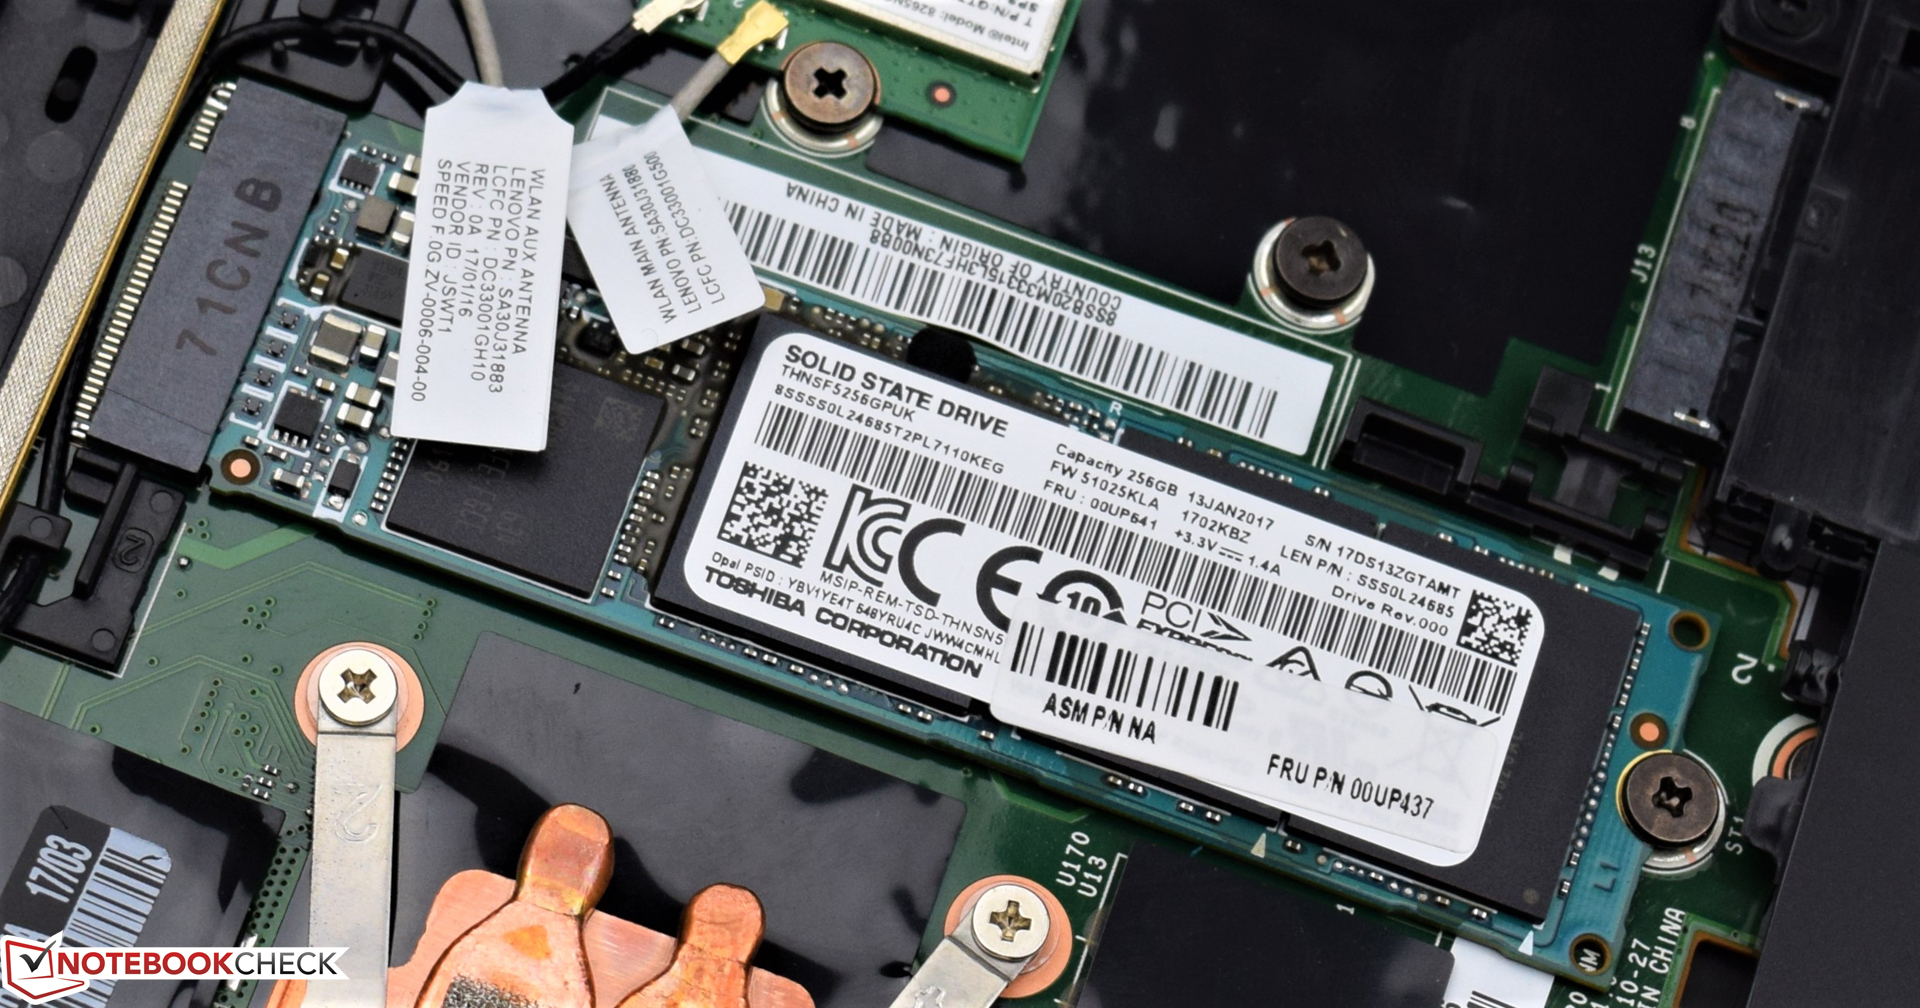
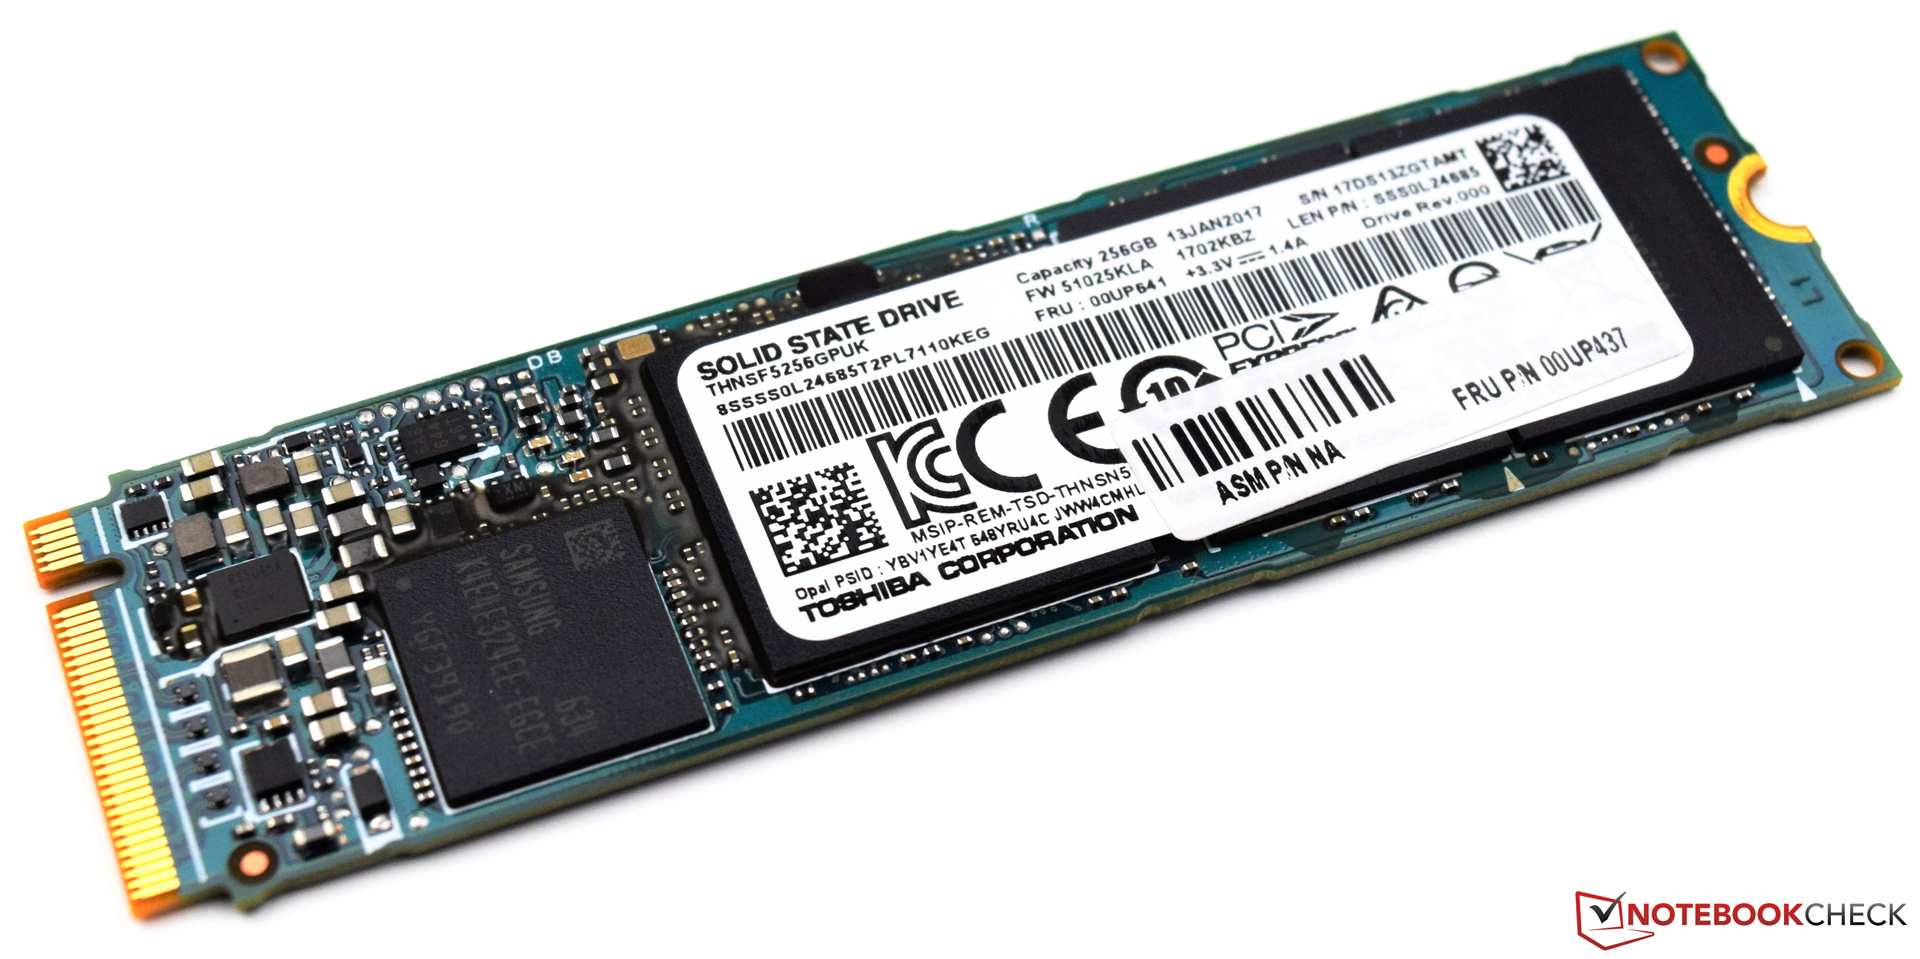
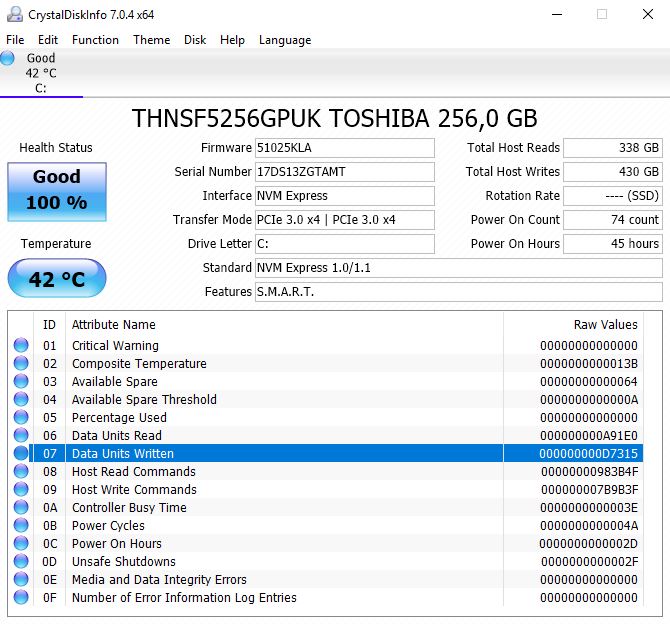
| Lenovo ThinkPad X1 Carbon 2017-20HR0021GE Toshiba THNSF5256GPUK | Lenovo ThinkPad X1 Carbon 2017-20HQS03P00 Samsung PM961 NVMe MZVLW512HMJP | Lenovo ThinkPad X1 Carbon 20FB-005XUS Samsung SM951 MZVPV256 m.2 | Lenovo ThinkPad X1 Carbon 20FB003RGE Samsung SSD PM871 MZNLN256HCHP | Lenovo ThinkPad T470s-20HGS00V00 Samsung SSD PM961 1TB M.2 PCIe 3.0 x4 NVMe (MZVLW1T0) | HP EliteBook Folio 1040 G3 Samsung SM951 MZVPV256HDGL m.2 PCI-e | Fujitsu LifeBook U747 Samsung MZYTY256HDHP | |
|---|---|---|---|---|---|---|---|
| CrystalDiskMark 3.0 | 79% | 68% | -30% | 83% | 76% | -24% | |
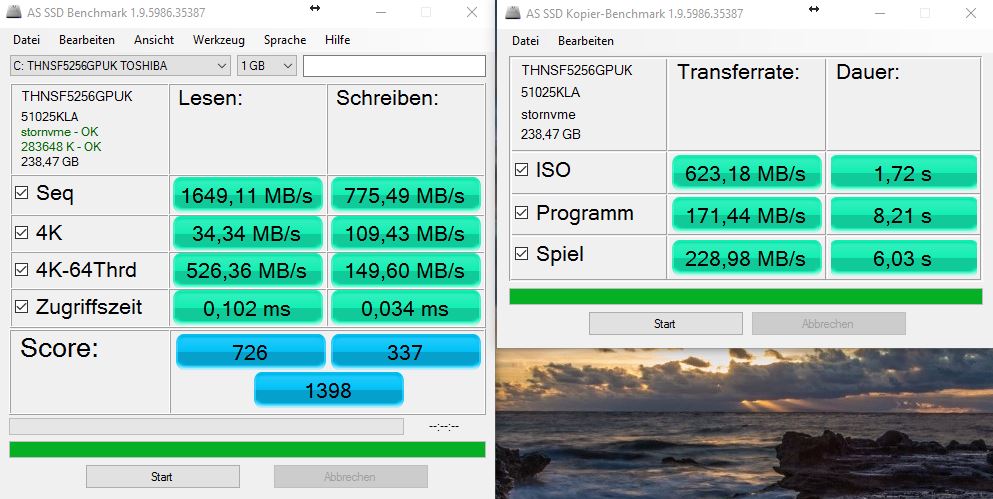
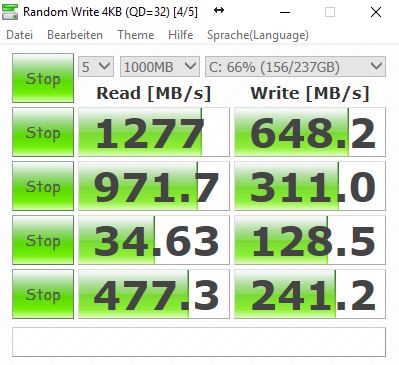
| Read Seq (MB/s) | 1277 | 1827 43% | 1720 35% | 439.3 -66% | 1760 38% | 1649 29% | 504 -61% |
| Write Seq (MB/s) | 648 | 1383 113% | 1263 95% | 308.1 -52% | 1666 157% | 1265 95% | 497.8 -23% |
| Read 512 (MB/s) | 972 | 814 -16% | 1223 26% | 299.5 -69% | 832 -14% | 1252 29% | 396.7 -59% |
| Write 512 (MB/s) | 311 | 1098 253% | 1249 302% | 304.2 -2% | 1064 242% | 1244 300% | 283.4 -9% |
| Read 4k (MB/s) | 34.63 | 61 76% | 49.65 43% | 34.05 -2% | 53.2 54% | 53.3 54% | 35.73 3% |
| Write 4k (MB/s) | 128.5 | 172.2 34% | 123 -4% | 86.5 -33% | 167.4 30% | 159.9 24% | 87.8 -32% |
| Read 4k QD32 (MB/s) | 477.3 | 601 26% | 464.6 -3% | 339.6 -29% | 630 32% | 559 17% | 399.1 -16% |
| Write 4k QD32 (MB/s) | 241.2 | 495.6 105% | 354.7 47% | 279.2 16% | 533 121% | 376.7 56% | 249.7 4% |

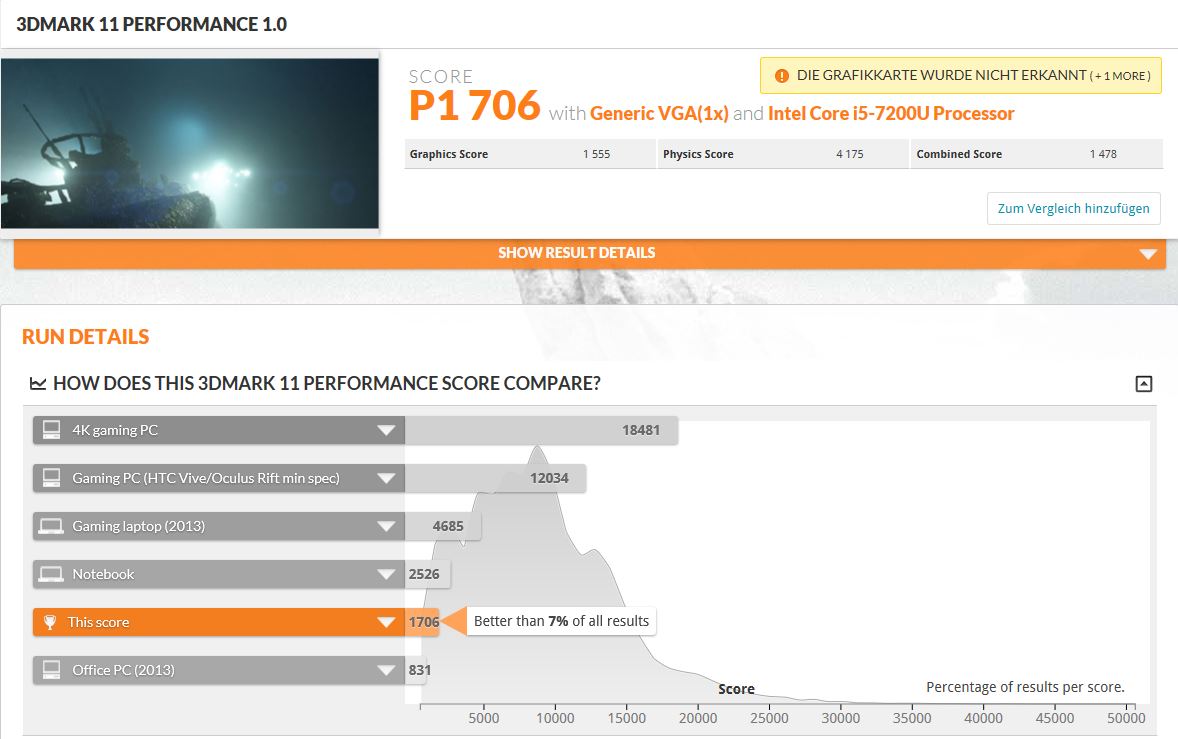
| 3DMark 11 Performance | 1706 pontos | |
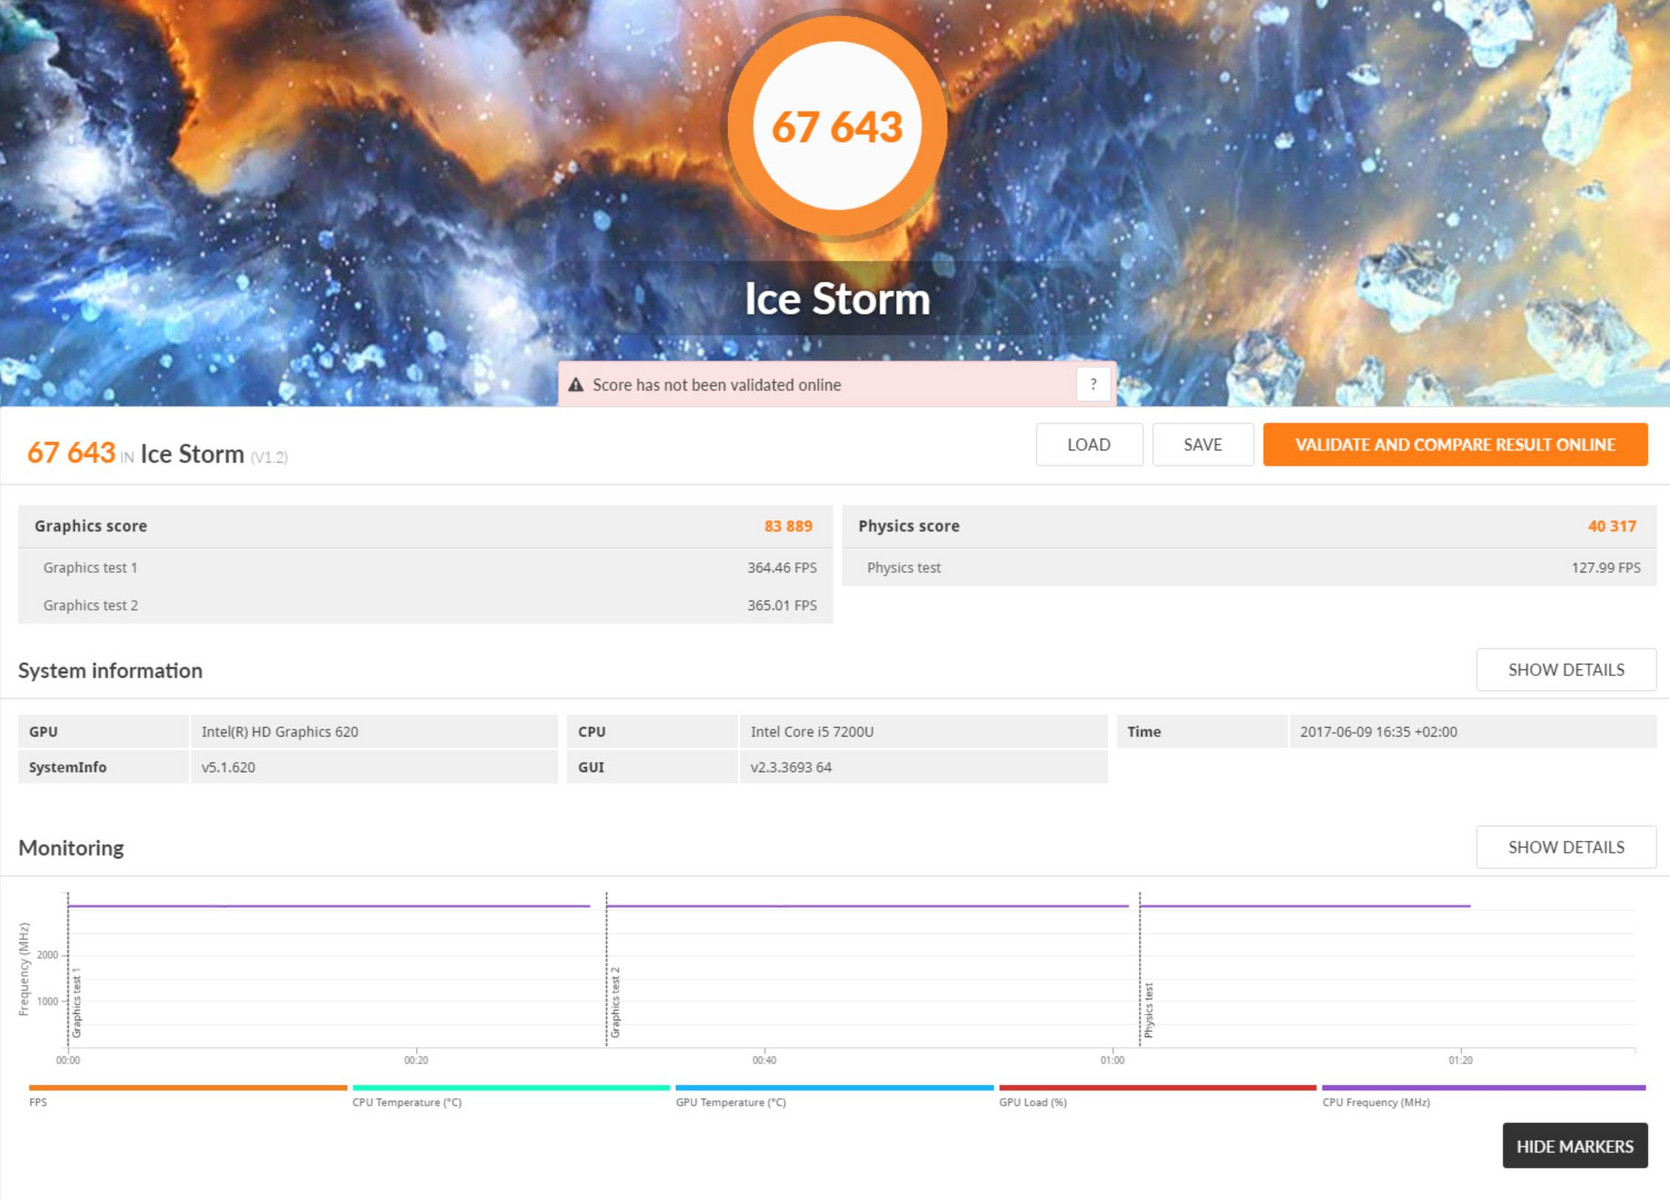
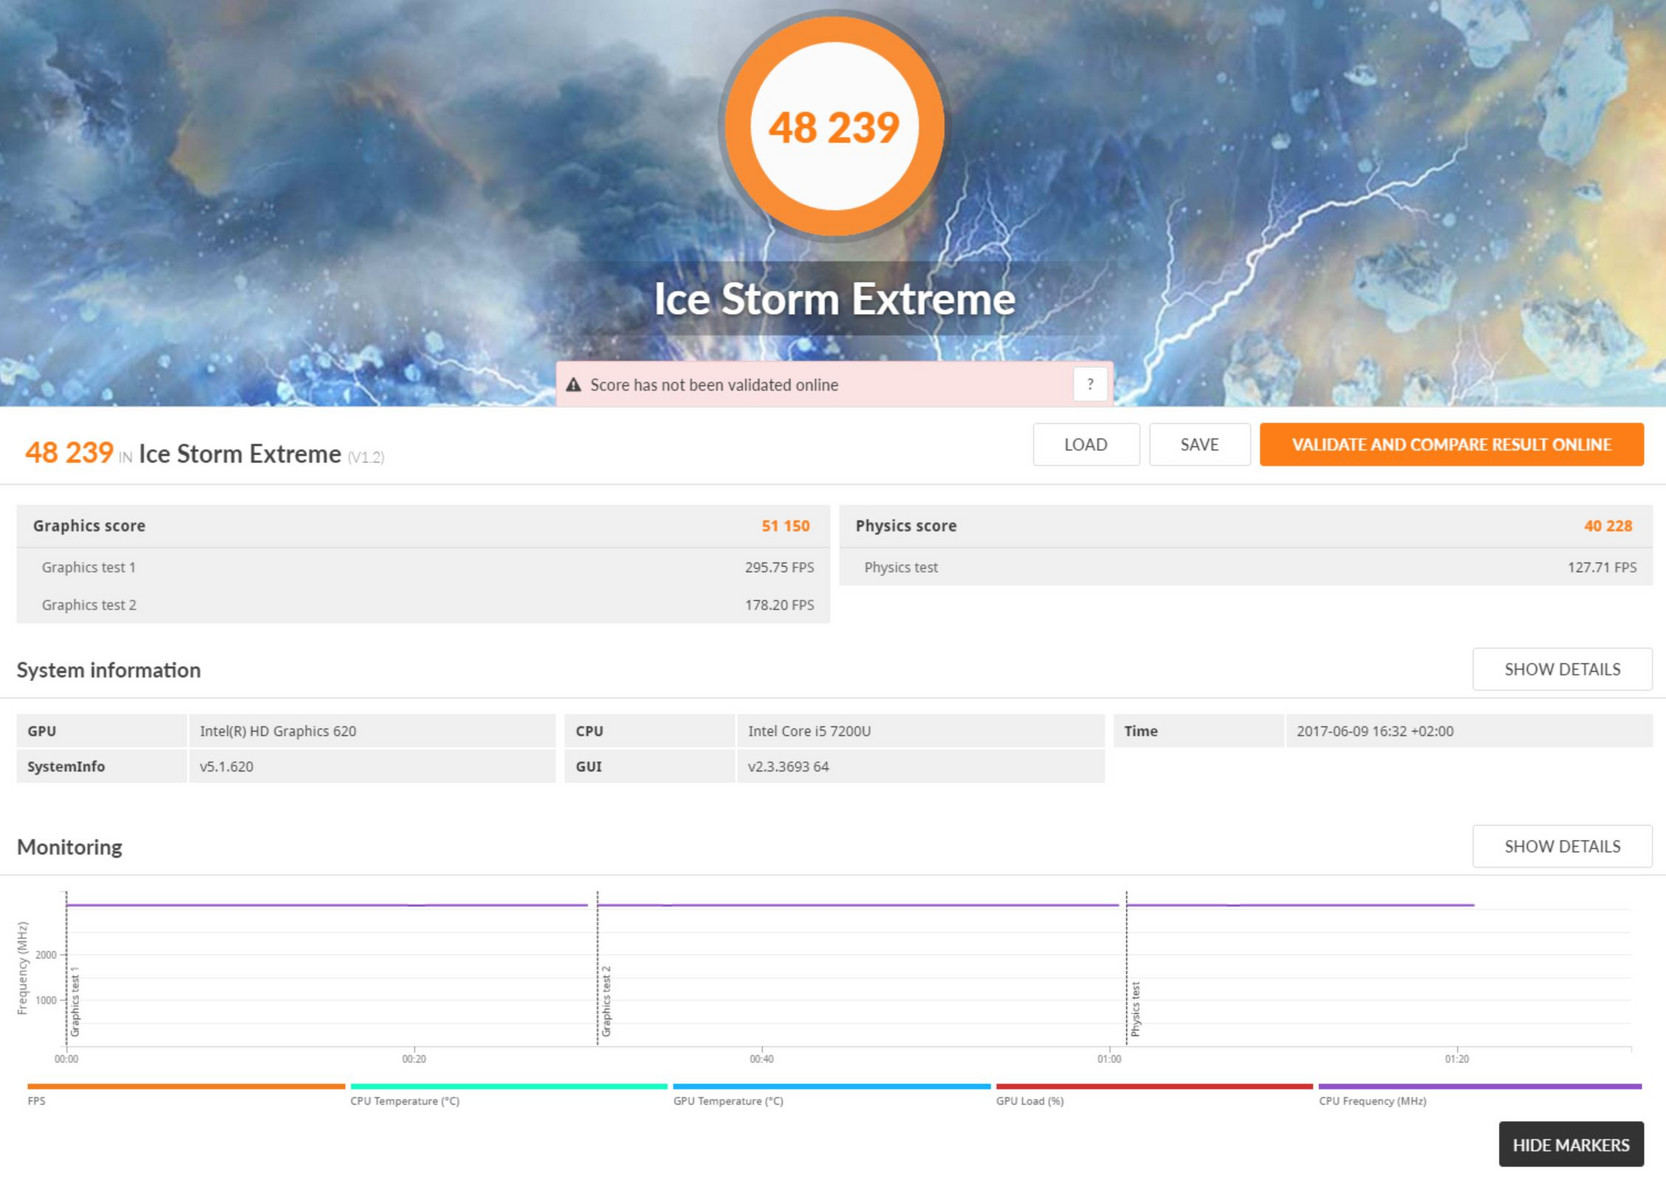
| 3DMark Ice Storm Standard Score | 67643 pontos | |
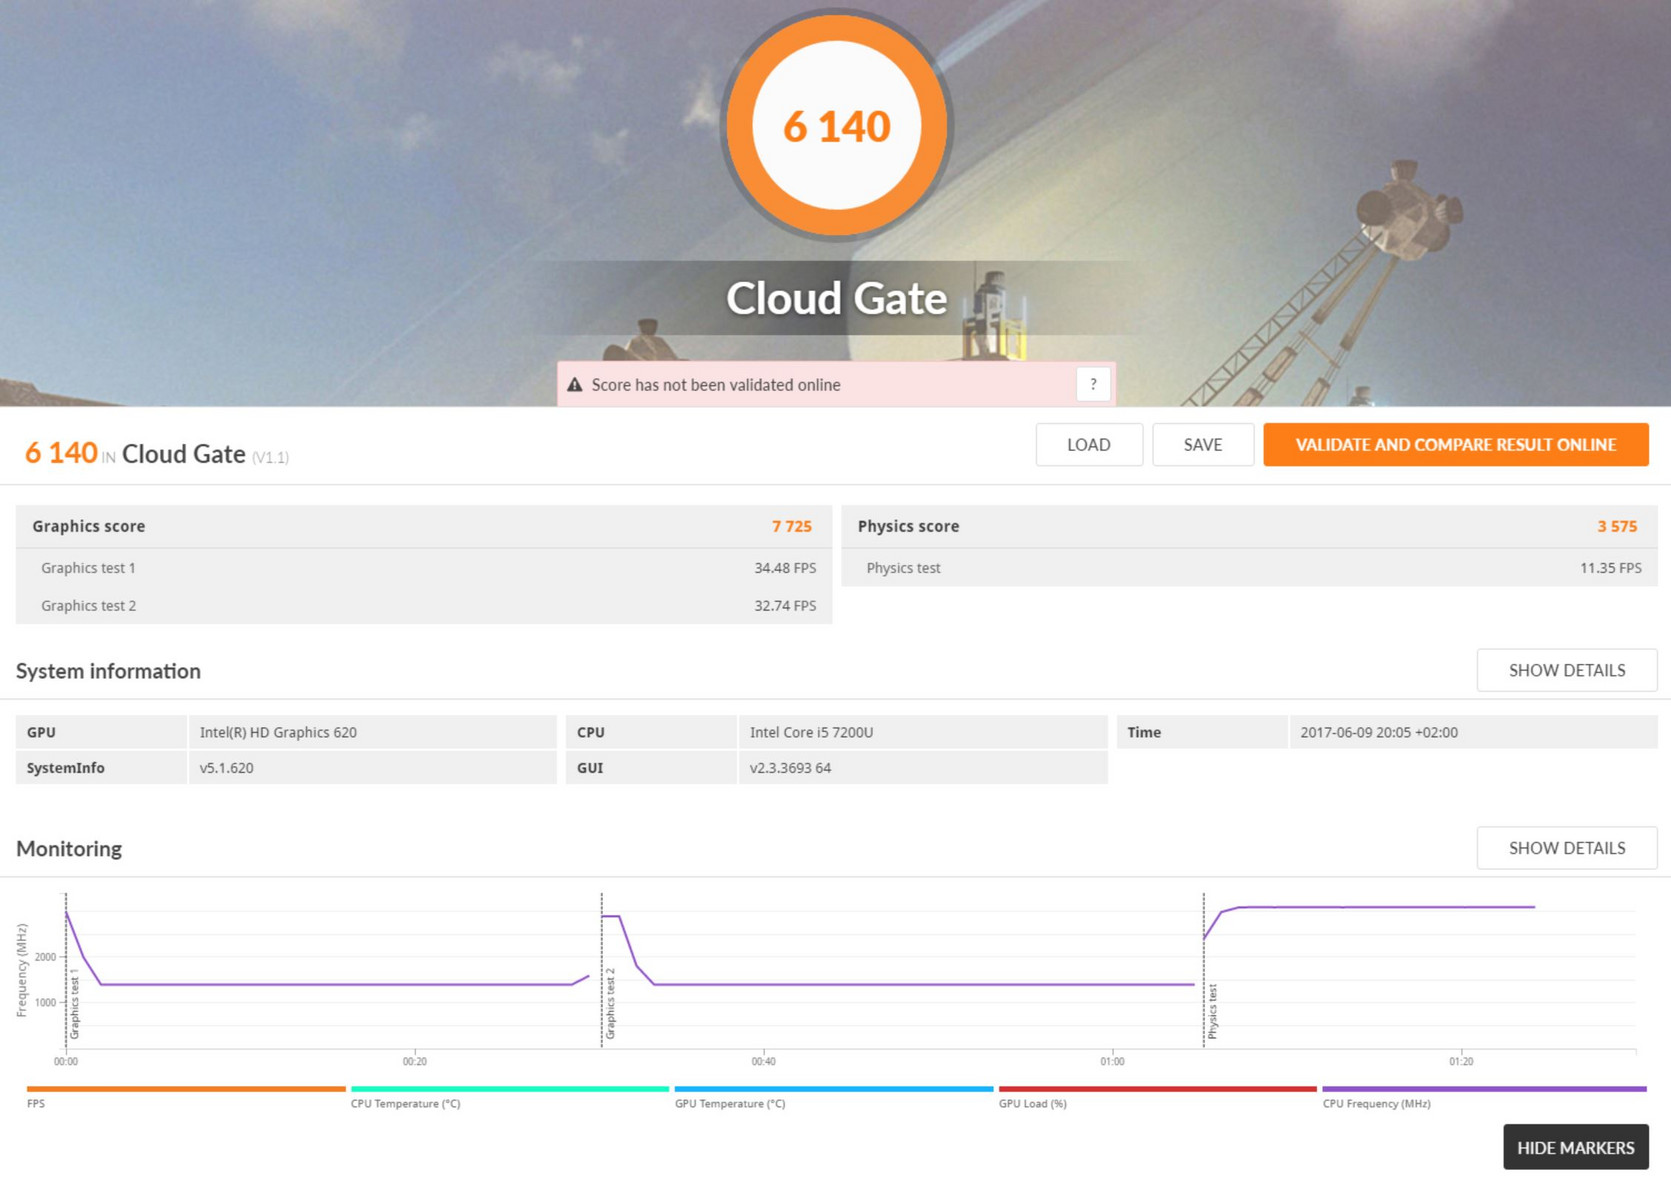
| 3DMark Cloud Gate Standard Score | 6140 pontos | |
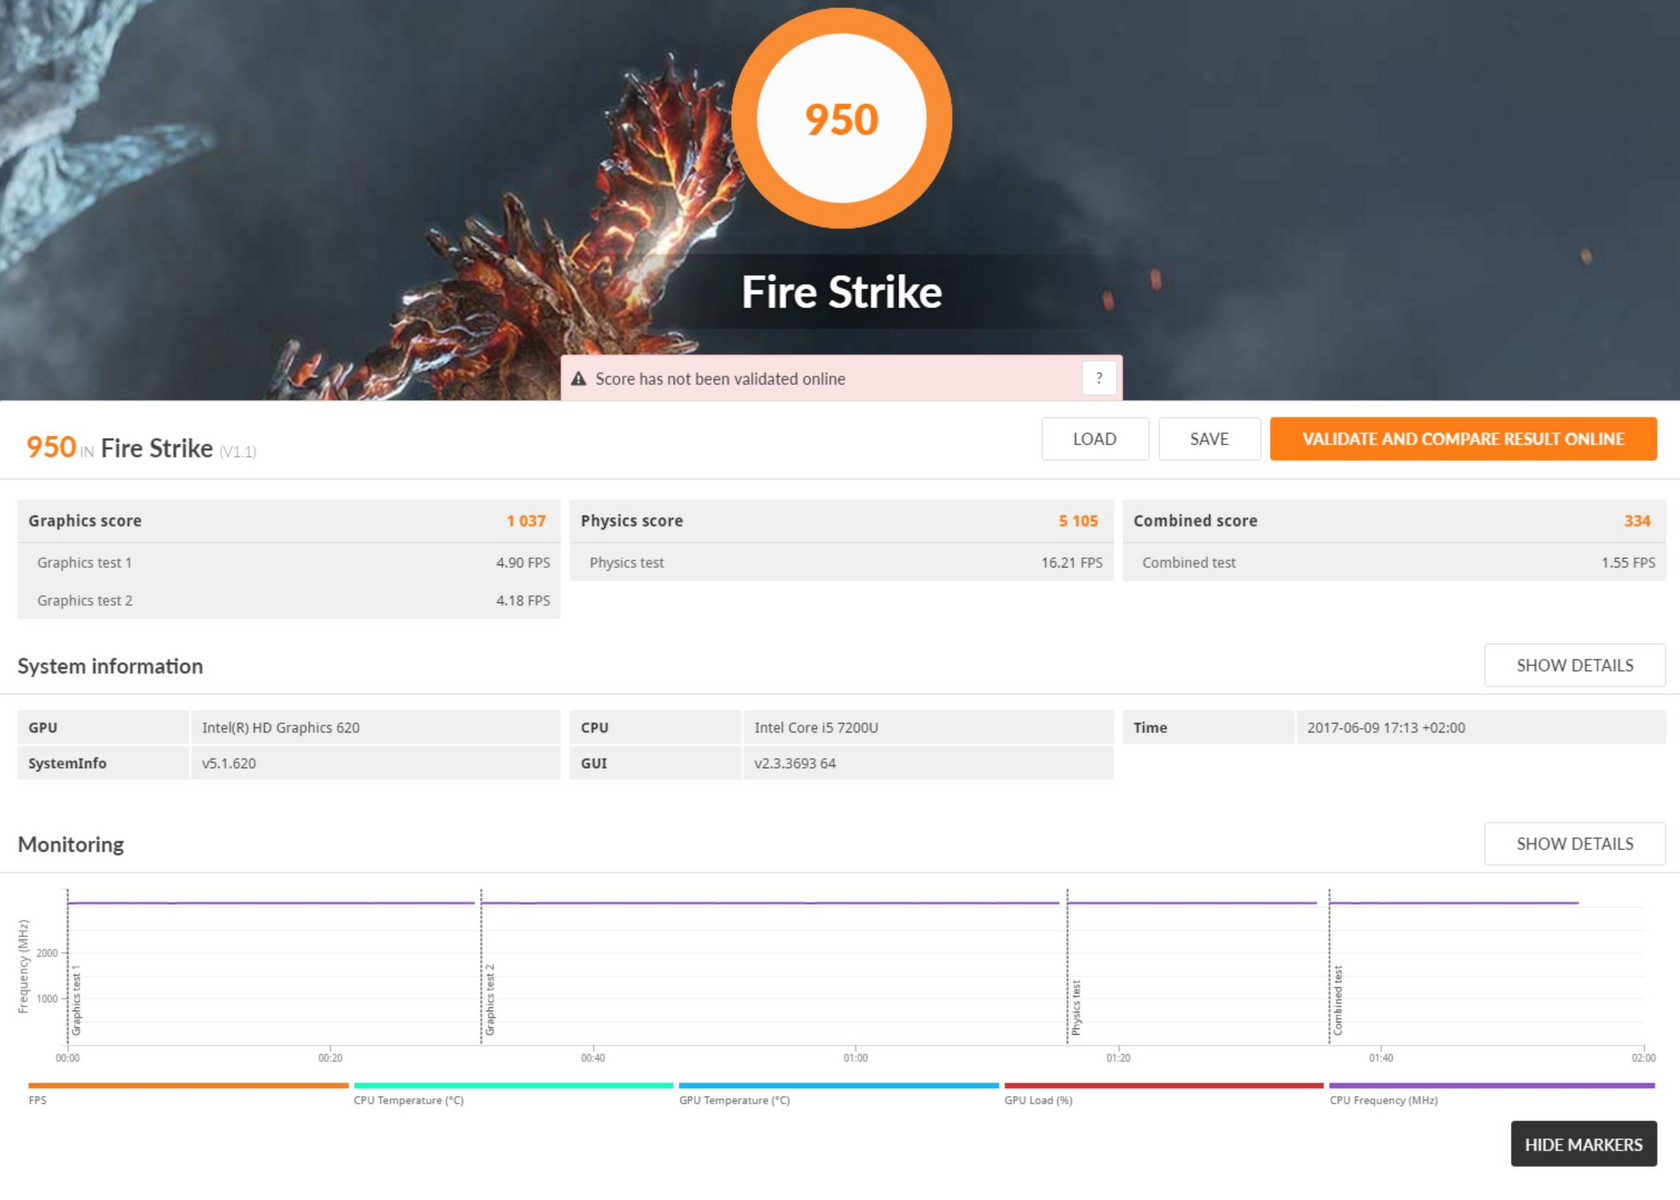
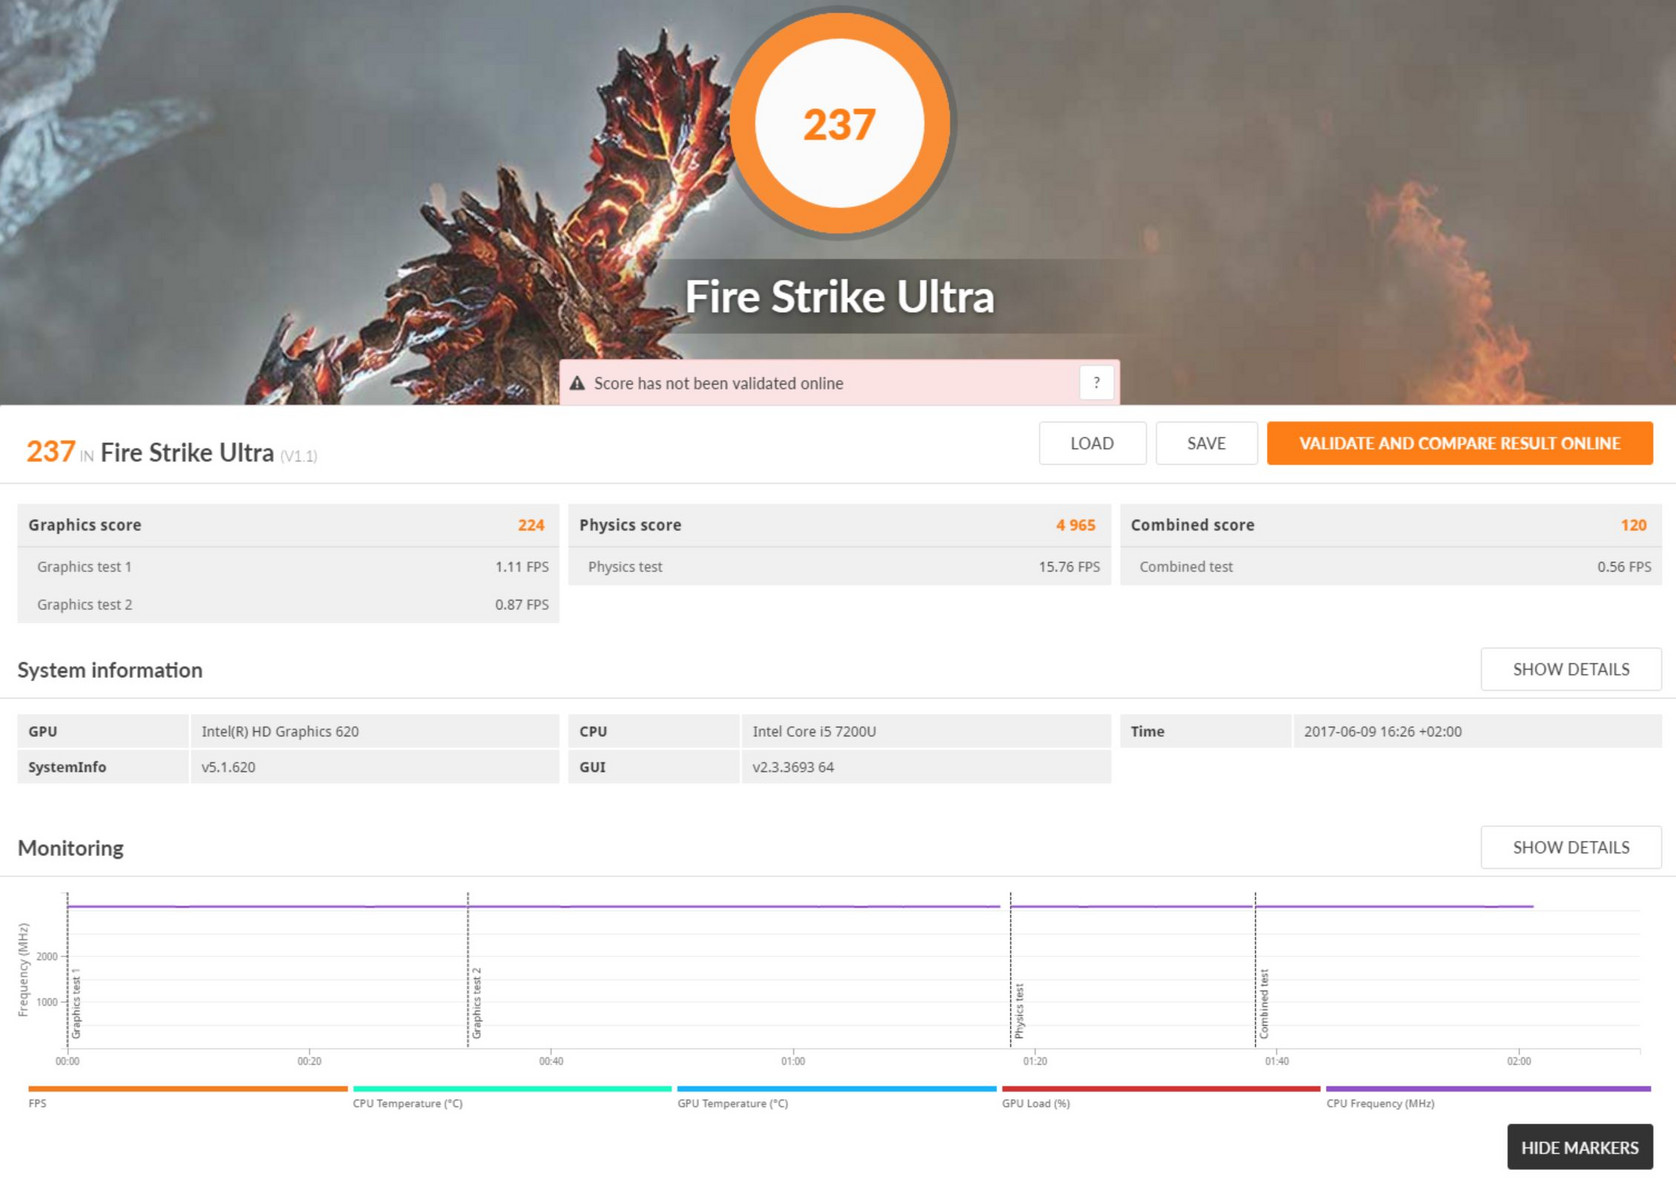
| 3DMark Fire Strike Score | 950 pontos | |
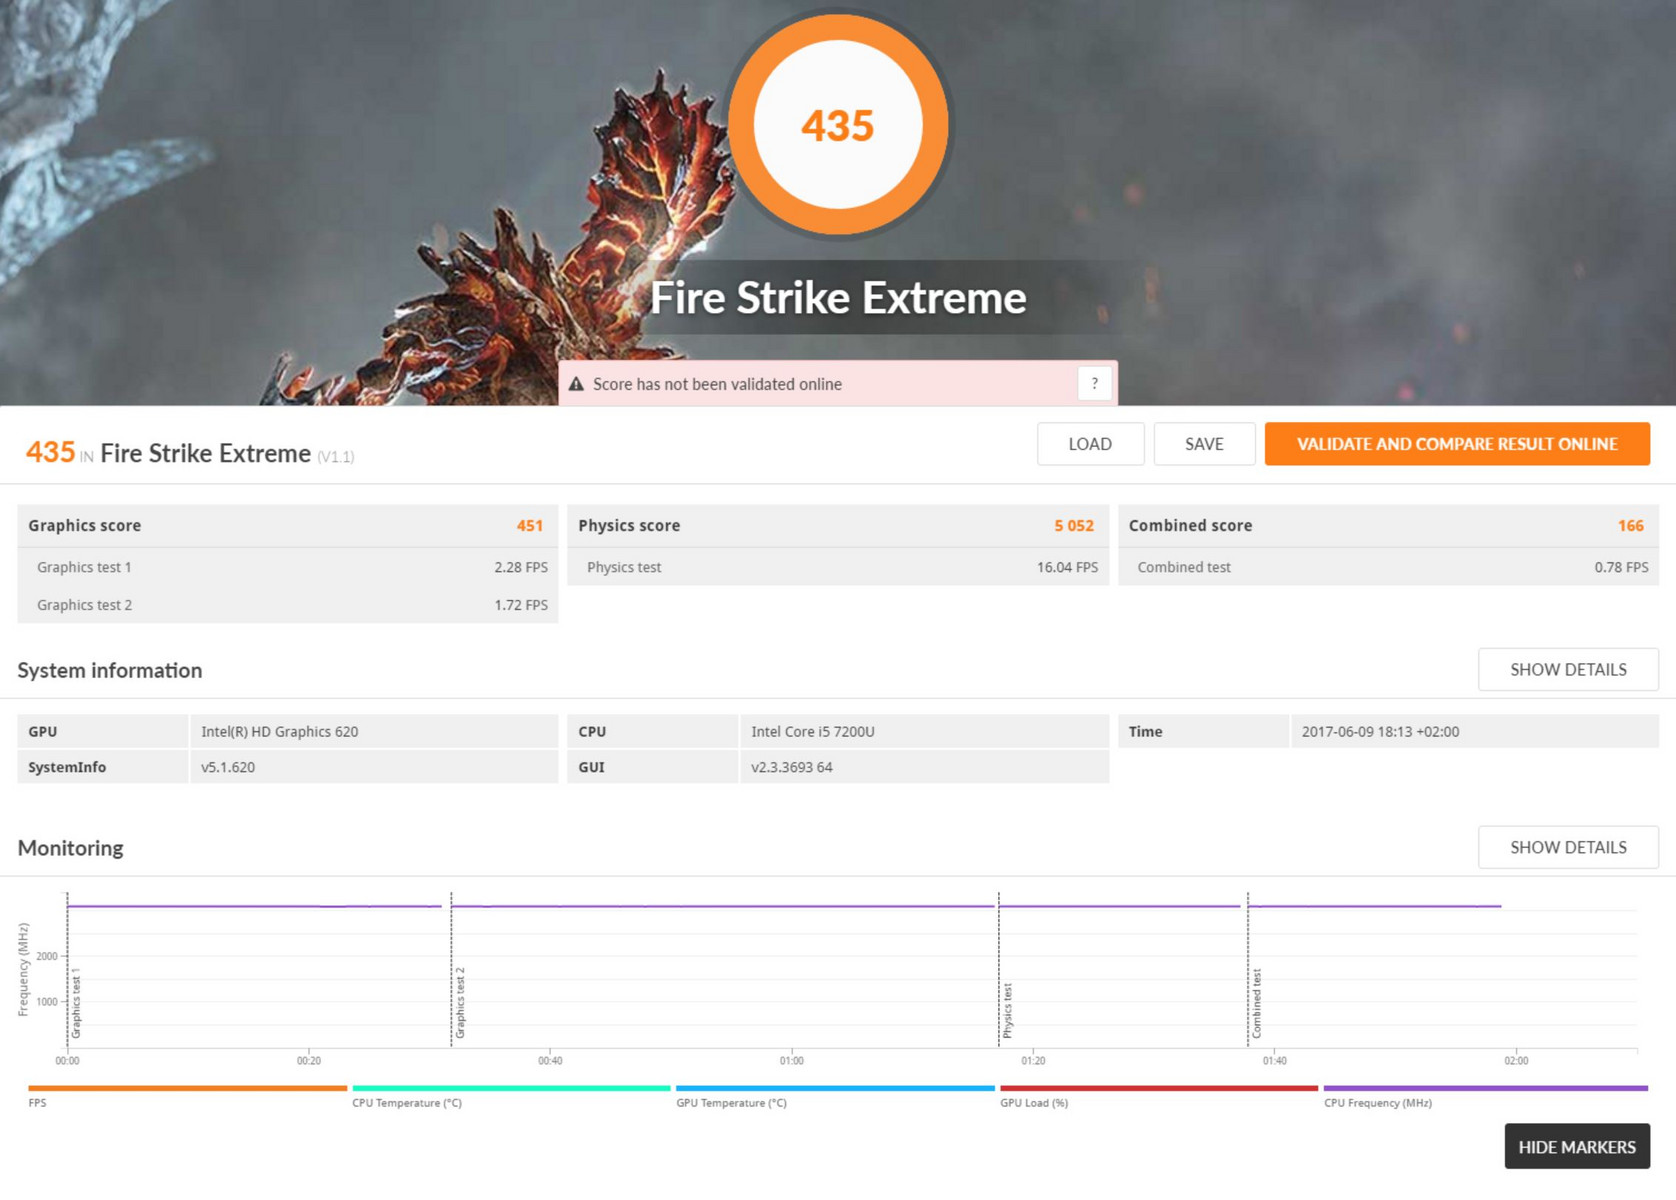
| 3DMark Fire Strike Extreme Score | 435 pontos | |
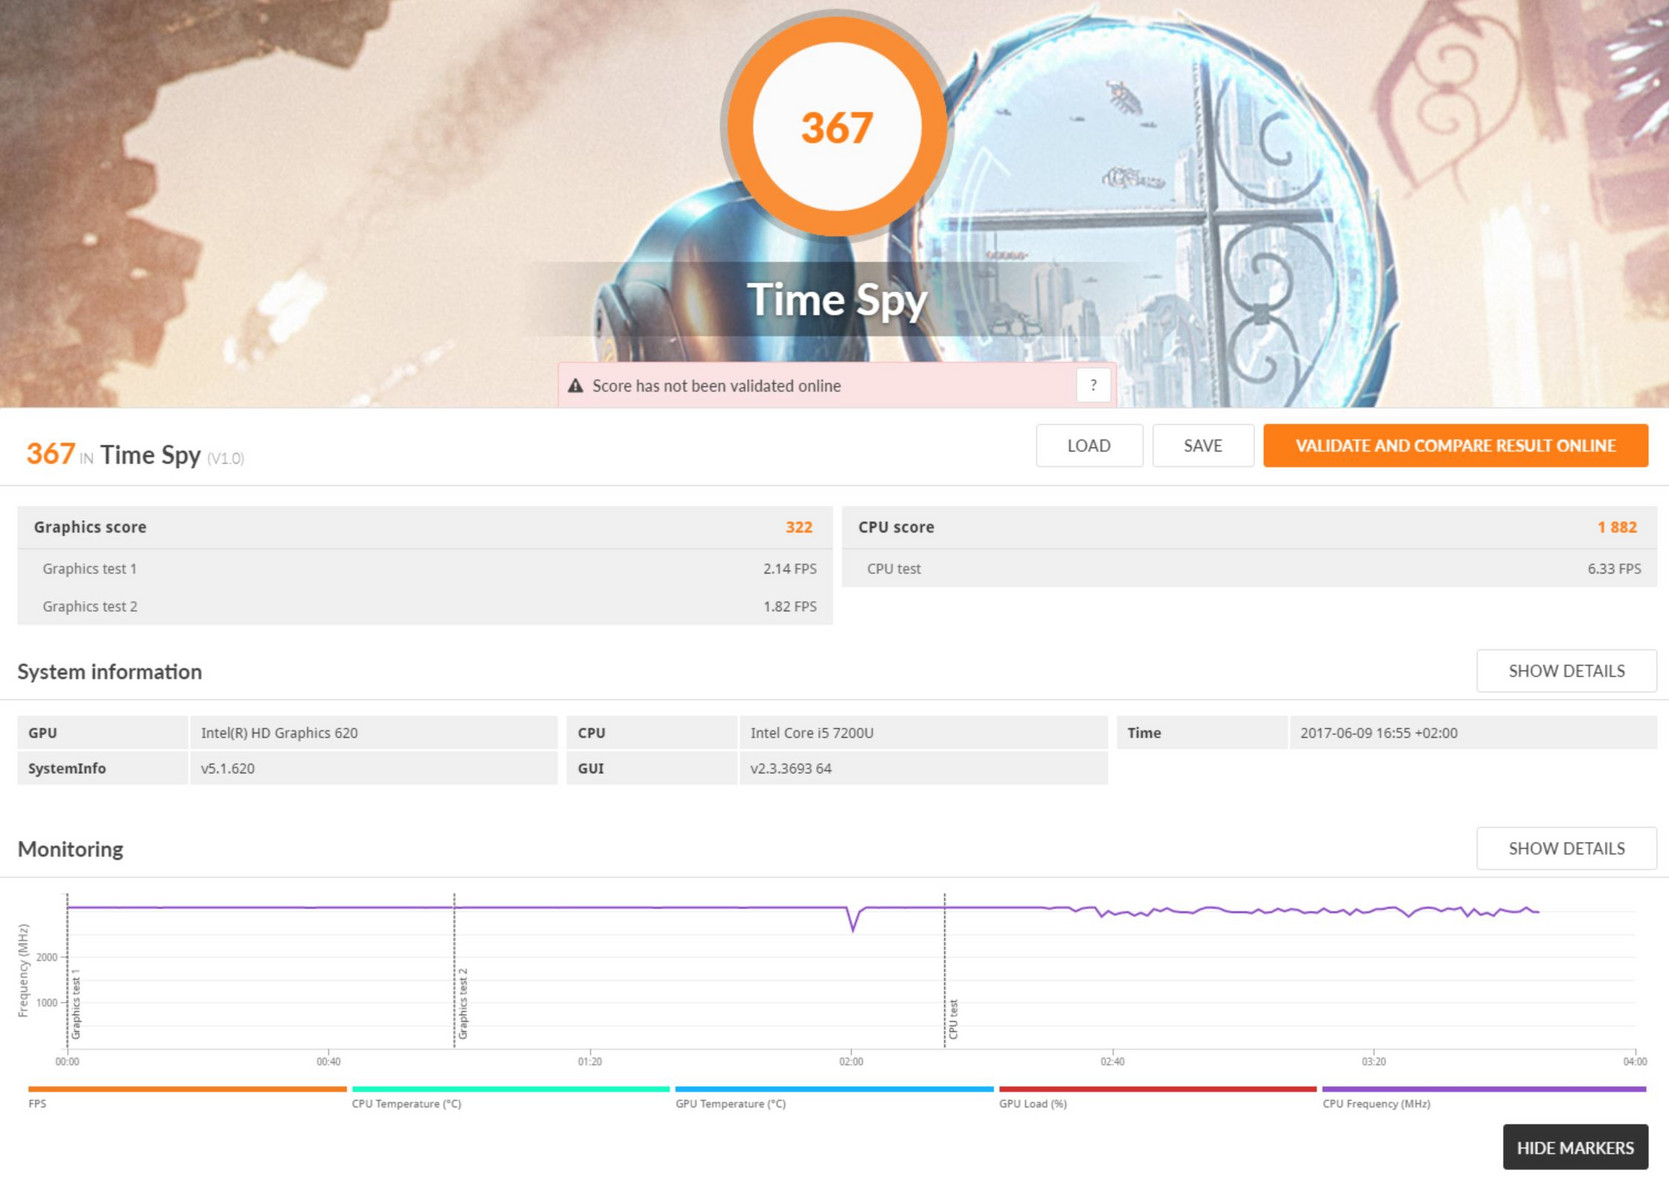
| 3DMark Time Spy Score | 367 pontos | |
Ajuda | ||
| baixo | média | alto | ultra | |
|---|---|---|---|---|
| BioShock Infinite (2013) | 46.1 | 28.6 | 27.7 | 8.5 |
| Battlefield 4 (2013) | 36.2 | 27.6 | 18.5 | 6.1 |
| The Witcher 3 (2015) | 11.1 | |||
| Rise of the Tomb Raider (2016) | 16.9 | 8.7 |
Barulho
| Ocioso |
| 29.6 / 29.6 / 32.2 dB |
| Carga |
| 34.2 / 36.1 dB |
 | ||
30 dB silencioso 40 dB(A) audível 50 dB(A) ruidosamente alto |
||
min: | ||
| Lenovo ThinkPad X1 Carbon 2017-20HR0021GE HD Graphics 620, i5-7200U, Toshiba THNSF5256GPUK | Lenovo ThinkPad X1 Carbon 2017-20HQS03P00 HD Graphics 620, i7-7500U, Samsung PM961 NVMe MZVLW512HMJP | Lenovo ThinkPad X1 Carbon 20FB-005XUS HD Graphics 520, 6300U, Samsung SM951 MZVPV256 m.2 | Lenovo ThinkPad X1 Carbon 20FB003RGE HD Graphics 520, 6500U, Samsung SSD PM871 MZNLN256HCHP | Lenovo ThinkPad T470s-20HGS00V00 HD Graphics 620, i7-7600U, Samsung SSD PM961 1TB M.2 PCIe 3.0 x4 NVMe (MZVLW1T0) | HP EliteBook Folio 1040 G3 HD Graphics 520, 6300U, Samsung SM951 MZVPV256HDGL m.2 PCI-e | Fujitsu LifeBook U747 HD Graphics 620, i5-7200U, Samsung MZYTY256HDHP | |
|---|---|---|---|---|---|---|---|
| Noise | -1% | 3% | 1% | -2% | 3% | 8% | |
| desligado / ambiente * (dB) | 29.6 | 29.3 1% | 28.8 3% | 29.1 2% | 28.9 2% | 29.1 2% | 28.2 5% |
| Idle Minimum * (dB) | 29.6 | 29.3 1% | 28.8 3% | 29.1 2% | 28.9 2% | 29.1 2% | 28.2 5% |
| Idle Average * (dB) | 29.6 | 29.3 1% | 28.9 2% | 29.1 2% | 28.9 2% | 29.1 2% | 28.2 5% |
| Idle Maximum * (dB) | 32.2 | 32.2 -0% | 28.9 10% | 29.1 10% | 30.1 7% | 29.1 10% | 28.2 12% |
| Load Average * (dB) | 34.2 | 34.3 -0% | 35 -2% | 35.6 -4% | 39.2 -15% | 32.6 5% | 31.2 9% |
| Load Maximum * (dB) | 36.1 | 39.3 -9% | 35.8 1% | 38.1 -6% | 39.2 -9% | 37.8 -5% | 33 9% |
* ... menor é melhor
| Lenovo ThinkPad X1 Carbon 2017-20HR0021GE HD Graphics 620, i5-7200U, Toshiba THNSF5256GPUK | Lenovo ThinkPad X1 Carbon 2017-20HQS03P00 HD Graphics 620, i7-7500U, Samsung PM961 NVMe MZVLW512HMJP | Lenovo ThinkPad X1 Carbon 20FB-005XUS HD Graphics 520, 6300U, Samsung SM951 MZVPV256 m.2 | Lenovo ThinkPad X1 Carbon 20FB003RGE HD Graphics 520, 6500U, Samsung SSD PM871 MZNLN256HCHP | Lenovo ThinkPad T470s-20HGS00V00 HD Graphics 620, i7-7600U, Samsung SSD PM961 1TB M.2 PCIe 3.0 x4 NVMe (MZVLW1T0) | HP EliteBook Folio 1040 G3 HD Graphics 520, 6300U, Samsung SM951 MZVPV256HDGL m.2 PCI-e | Fujitsu LifeBook U747 HD Graphics 620, i5-7200U, Samsung MZYTY256HDHP | |
|---|---|---|---|---|---|---|---|
| Heat | 9% | 8% | -1% | 9% | -3% | 15% | |
| Maximum Upper Side * (°C) | 48.5 | 48 1% | 40 18% | 43.2 11% | 43.5 10% | 43.2 11% | 42.6 12% |
| Maximum Bottom * (°C) | 46.1 | 47.2 -2% | 42.8 7% | 45 2% | 46.1 -0% | 47.1 -2% | 34.4 25% |
| Idle Upper Side * (°C) | 28.5 | 23.5 18% | 26.6 7% | 30.2 -6% | 24.7 13% | 30.5 -7% | 25.1 12% |
| Idle Bottom * (°C) | 27.8 | 22.6 19% | 27.4 1% | 30.6 -10% | 24.3 13% | 31.5 -13% | 24.6 12% |
* ... menor é melhor
(-) A temperatura máxima no lado superior é 48.5 °C / 119 F, em comparação com a média de 34.3 °C / 94 F , variando de 21.2 a 62.5 °C para a classe Office.
(-) A parte inferior aquece até um máximo de 46.1 °C / 115 F, em comparação com a média de 36.8 °C / 98 F
(+) Em uso inativo, a temperatura média para o lado superior é 27 °C / 81 F, em comparação com a média do dispositivo de 29.5 °C / ### class_avg_f### F.
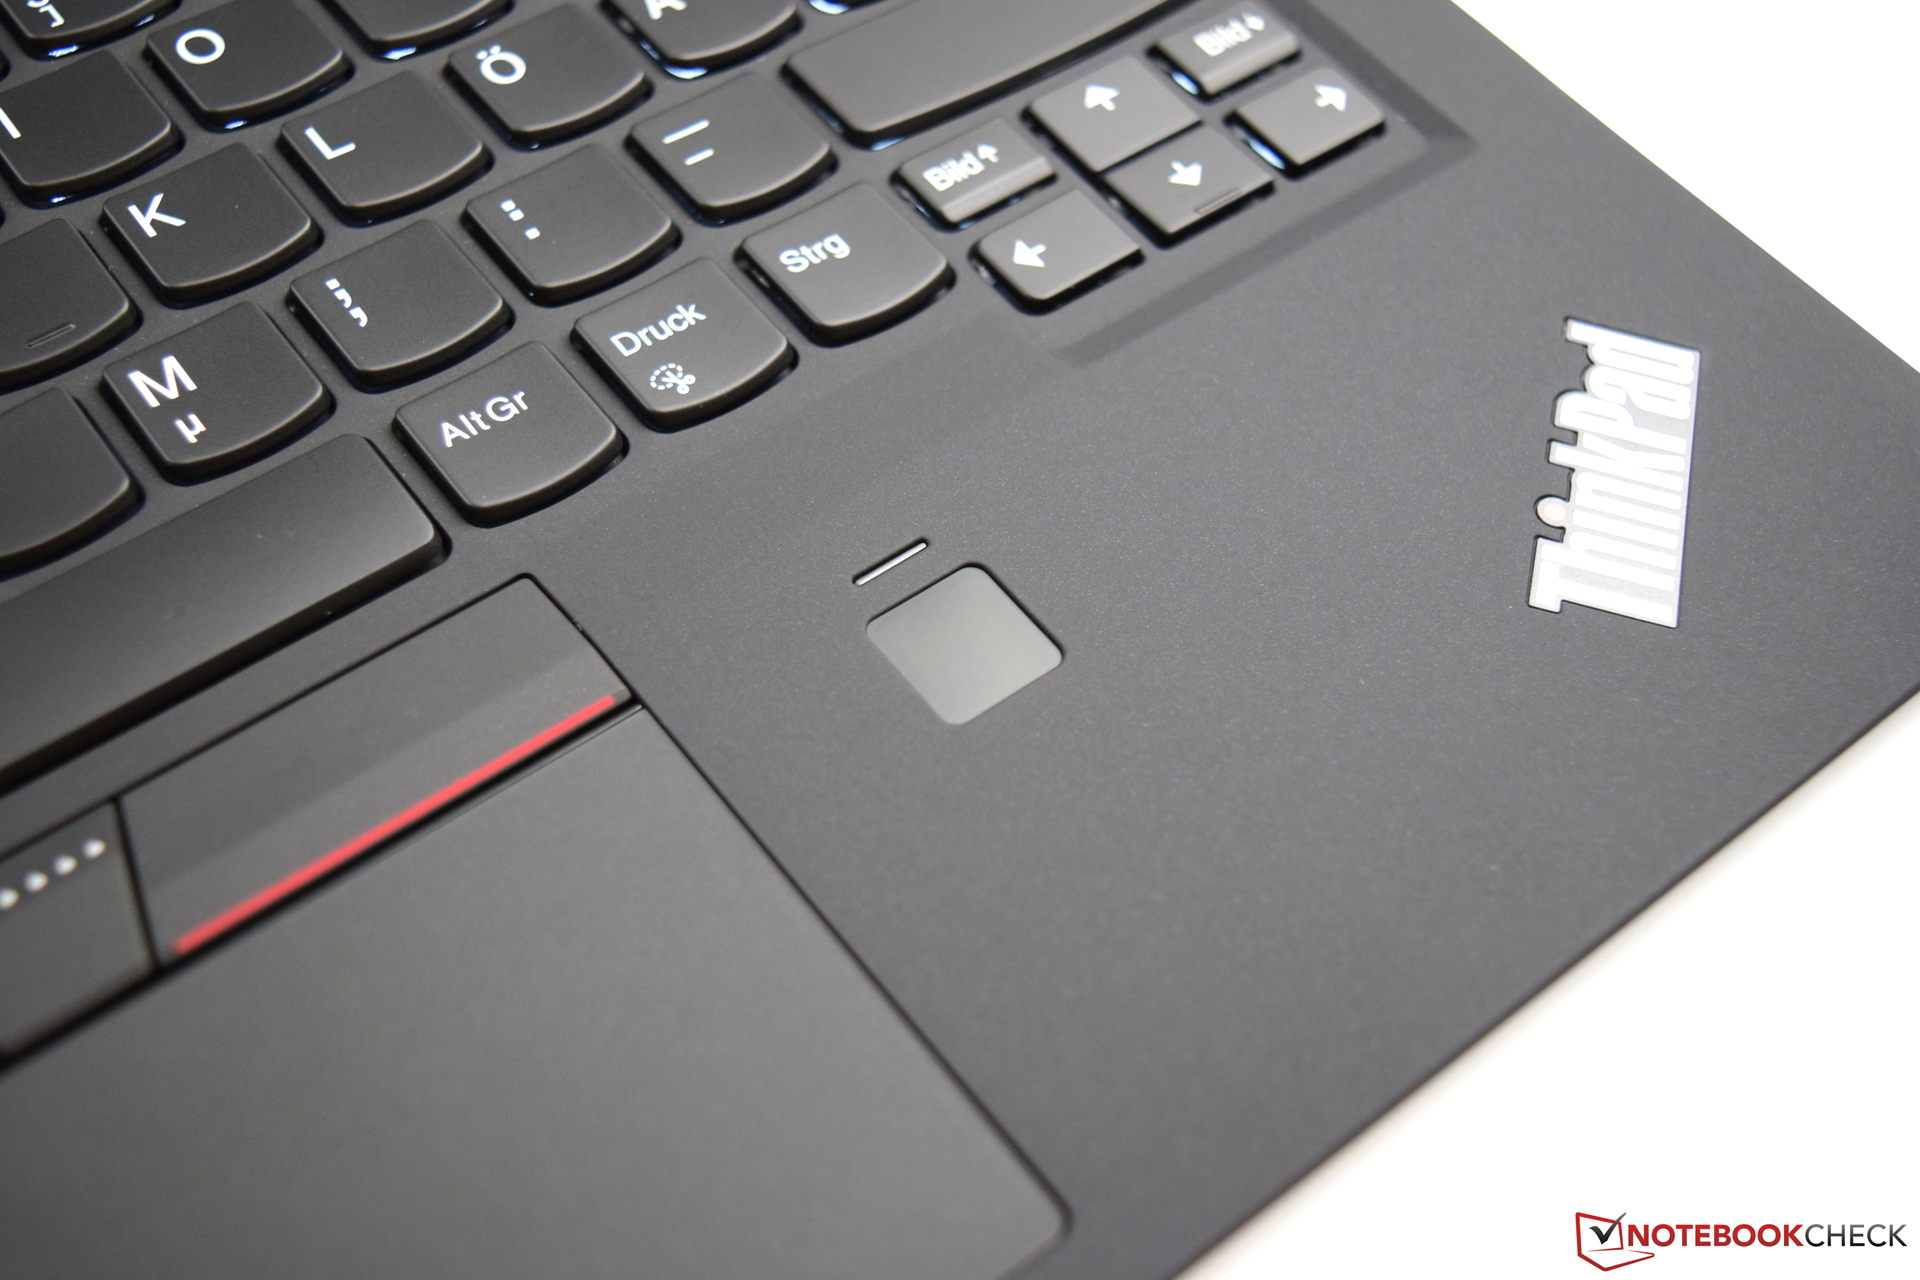
(+) Os apoios para as mãos e o touchpad estão atingindo a temperatura máxima da pele (33.9 °C / 93 F) e, portanto, não estão quentes.
(-) A temperatura média da área do apoio para as mãos de dispositivos semelhantes foi 27.5 °C / 81.5 F (-6.4 °C / -11.5 F).
| desligado | |
| Ocioso | |
| Carga |
|
Key:
min: | |
| Lenovo ThinkPad X1 Carbon 2017-20HR0021GE i5-7200U, HD Graphics 620, Toshiba THNSF5256GPUK, IPS, 1920x1080, 14" | Lenovo ThinkPad X1 Carbon 2017-20HQS03P00 i7-7500U, HD Graphics 620, Samsung PM961 NVMe MZVLW512HMJP, IPS, 1920x1080, 14" | Lenovo ThinkPad X1 Carbon 20FB-005XUS 6300U, HD Graphics 520, Samsung SM951 MZVPV256 m.2, IPS, 1920x1080, 14" | Lenovo ThinkPad X1 Carbon 20FB003RGE 6500U, HD Graphics 520, Samsung SSD PM871 MZNLN256HCHP, IPS, 2560x1440, 14" | Lenovo ThinkPad T470s-20HGS00V00 i7-7600U, HD Graphics 620, Samsung SSD PM961 1TB M.2 PCIe 3.0 x4 NVMe (MZVLW1T0), IPS, 2560x1440, 14" | HP EliteBook Folio 1040 G3 6300U, HD Graphics 520, Samsung SM951 MZVPV256HDGL m.2 PCI-e, IPS, 2560x1440, 14" | Fujitsu LifeBook U747 i5-7200U, HD Graphics 620, Samsung MZYTY256HDHP, IPS LED, 1920x1080, 14" | |
|---|---|---|---|---|---|---|---|
| Power Consumption | -6% | -17% | 3% | -18% | -26% | 3% | |
| Idle Minimum * (Watt) | 3.8 | 3.84 -1% | 7.6 -100% | 3.8 -0% | 4.64 -22% | 6.3 -66% | 4.11 -8% |
| Idle Average * (Watt) | 7.1 | 6.3 11% | 9 -27% | 7.1 -0% | 8.93 -26% | 9.4 -32% | 7.87 -11% |
| Idle Maximum * (Watt) | 8.3 | 8.6 -4% | 9.6 -16% | 7.7 7% | 9.12 -10% | 10.1 -22% | 8.74 -5% |
| Load Average * (Watt) | 34.2 | 41.9 -23% | 24.5 28% | 30.2 12% | 42.2 -23% | 33.3 3% | 30.2 12% |
| Load Maximum * (Watt) | 43.3 | 48.7 -12% | 30.3 30% | 44.7 -3% | 47.3 -9% | 49.5 -14% | 32.4 25% |
* ... menor é melhor


| Lenovo ThinkPad X1 Carbon 2017-20HR0021GE i5-7200U, HD Graphics 620, 57 Wh | Lenovo ThinkPad X1 Carbon 2017-20HQS03P00 i7-7500U, HD Graphics 620, 57 Wh | Lenovo ThinkPad X1 Carbon 20FB-005XUS 6300U, HD Graphics 520, 52 Wh | Lenovo ThinkPad X1 Carbon 20FB003RGE 6500U, HD Graphics 520, 52 Wh | Lenovo ThinkPad T470-20HD002HGE i5-7200U, HD Graphics 620, 48 Wh | HP EliteBook Folio 1040 G3 6300U, HD Graphics 520, 45.6 Wh | Fujitsu LifeBook U747 i5-7200U, HD Graphics 620, 50 Wh | |
|---|---|---|---|---|---|---|---|
| Duração da bateria | 15% | -8% | -6% | -7% | -28% | -10% | |
| Reader / Idle (h) | 13.7 | 20.9 53% | 12.9 -6% | 15.7 15% | 8.8 -36% | 13 -5% | |
| H.264 (h) | 9.6 | 11.9 24% | 8.5 -11% | 10.4 8% | 5.7 -41% | 8.2 -15% | |
| WiFi v1.3 (h) | 9.1 | 8.3 -9% | 6.9 -24% | 7.2 -21% | 7.3 -20% | 5.2 -43% | 7.2 -21% |
| Load (h) | 2 | 1.8 -10% | 2.1 5% | 1.9 -5% | 1.8 -10% | 2.2 10% | 2 0% |
Pro
Contra
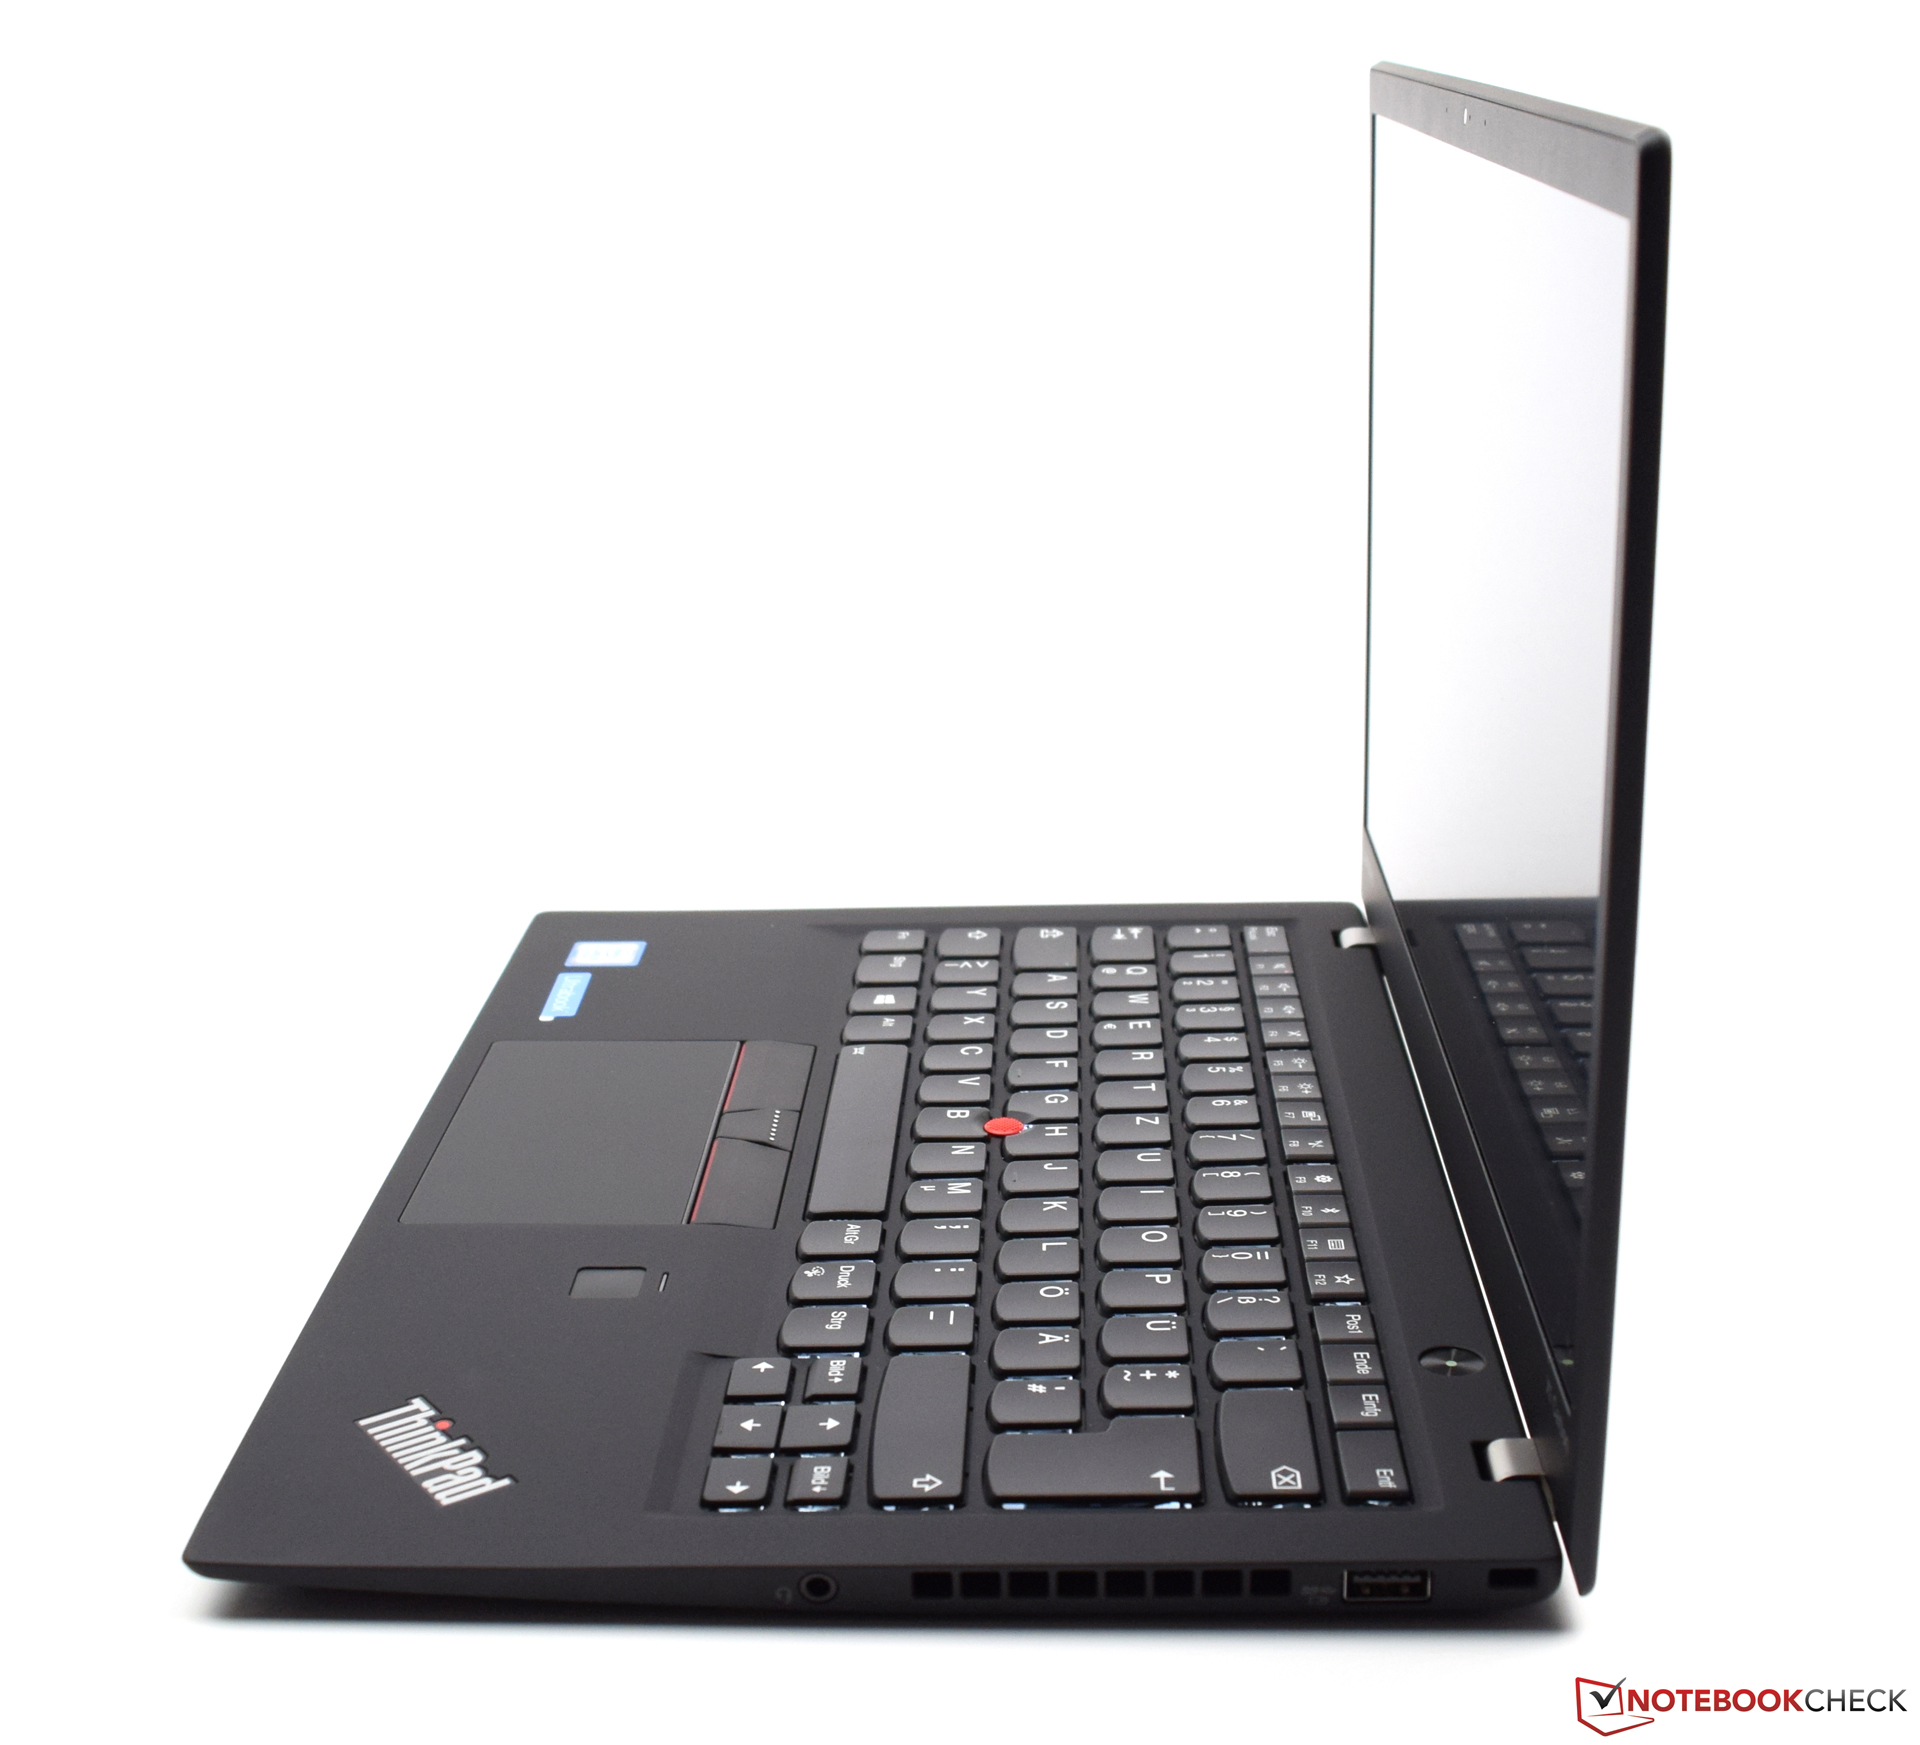
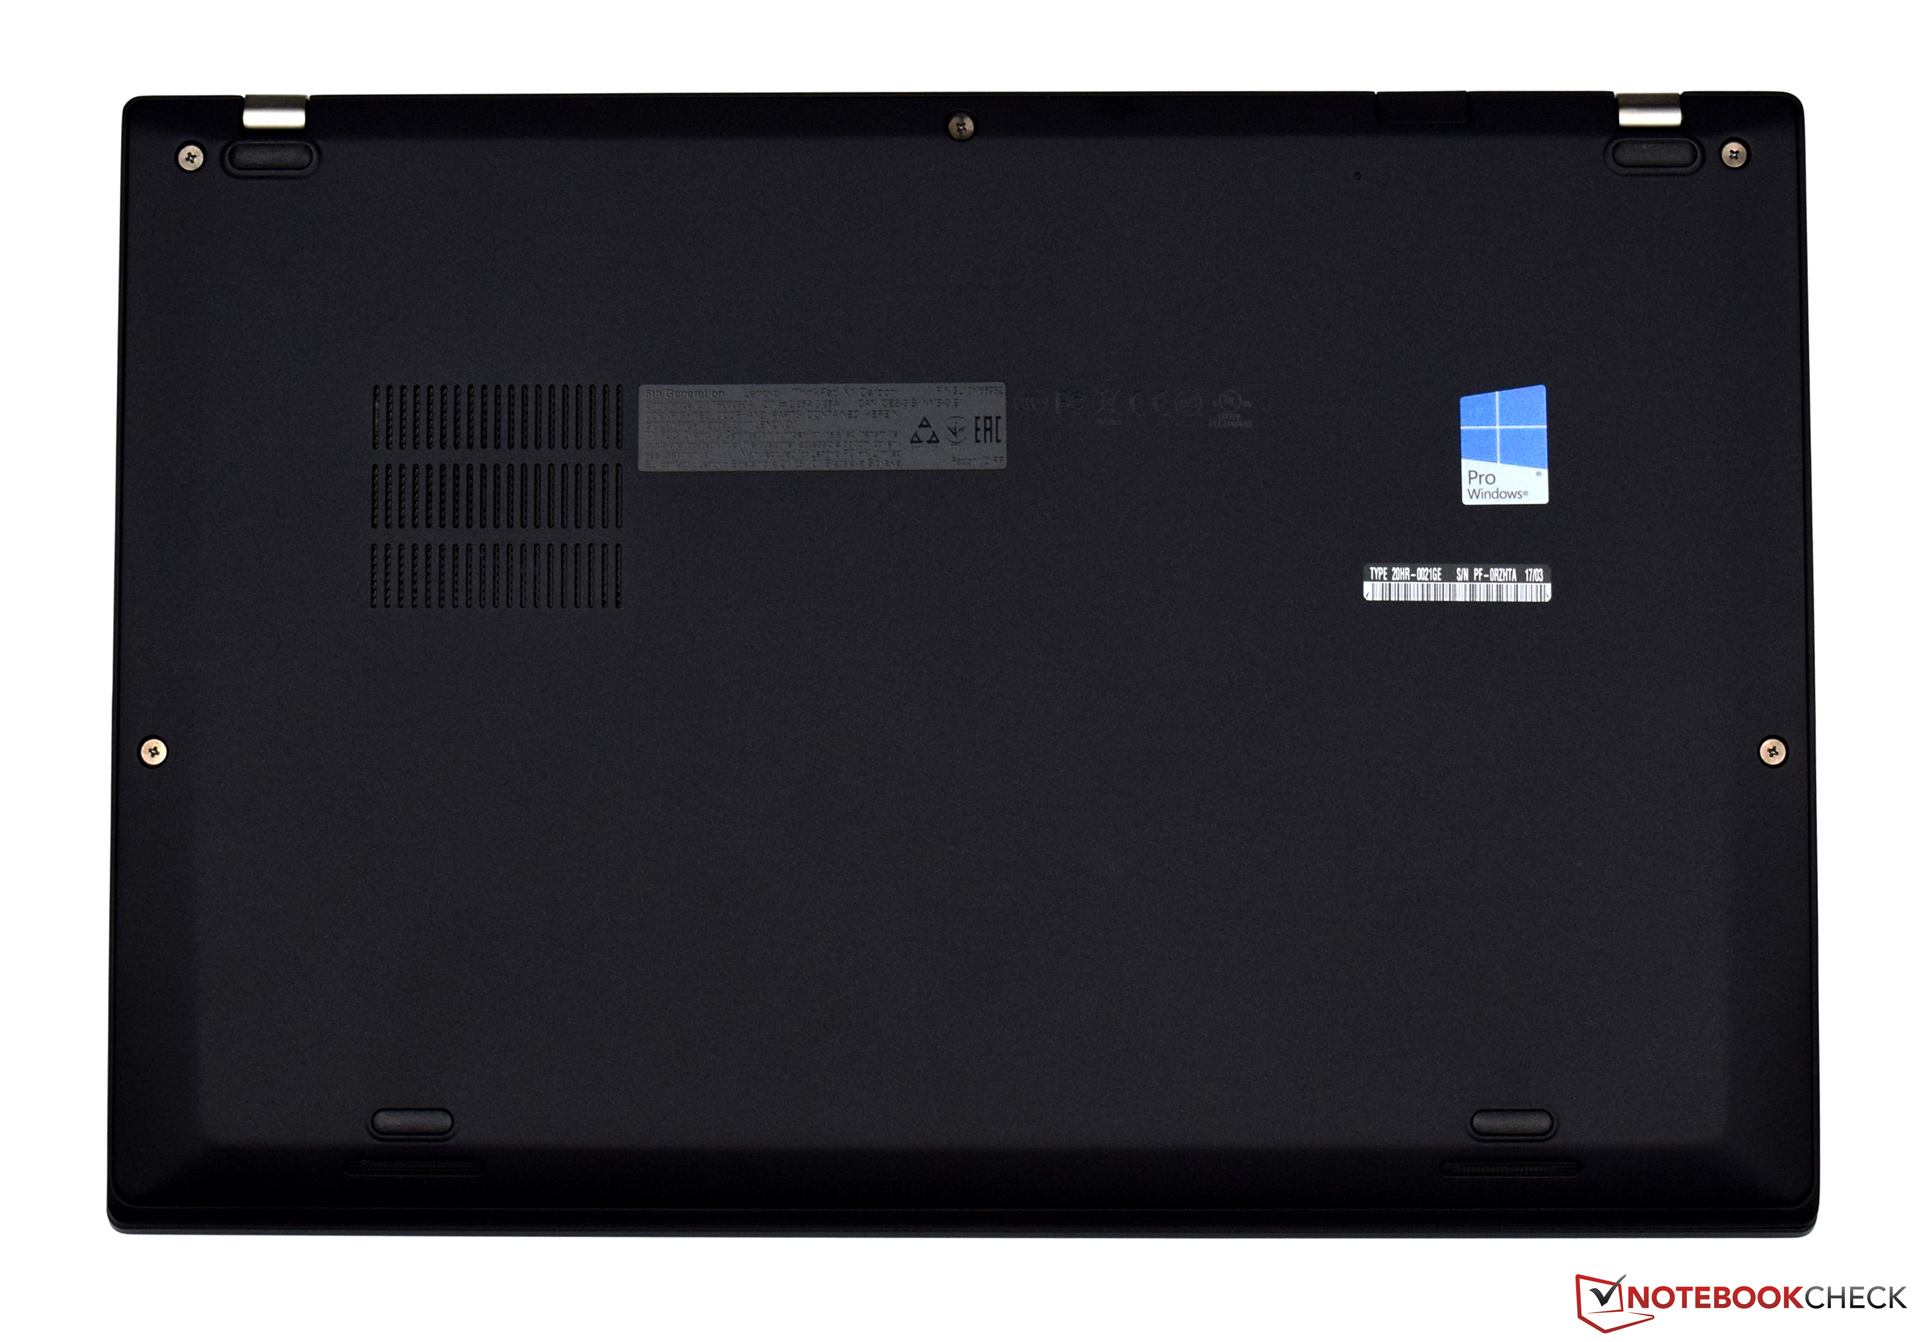
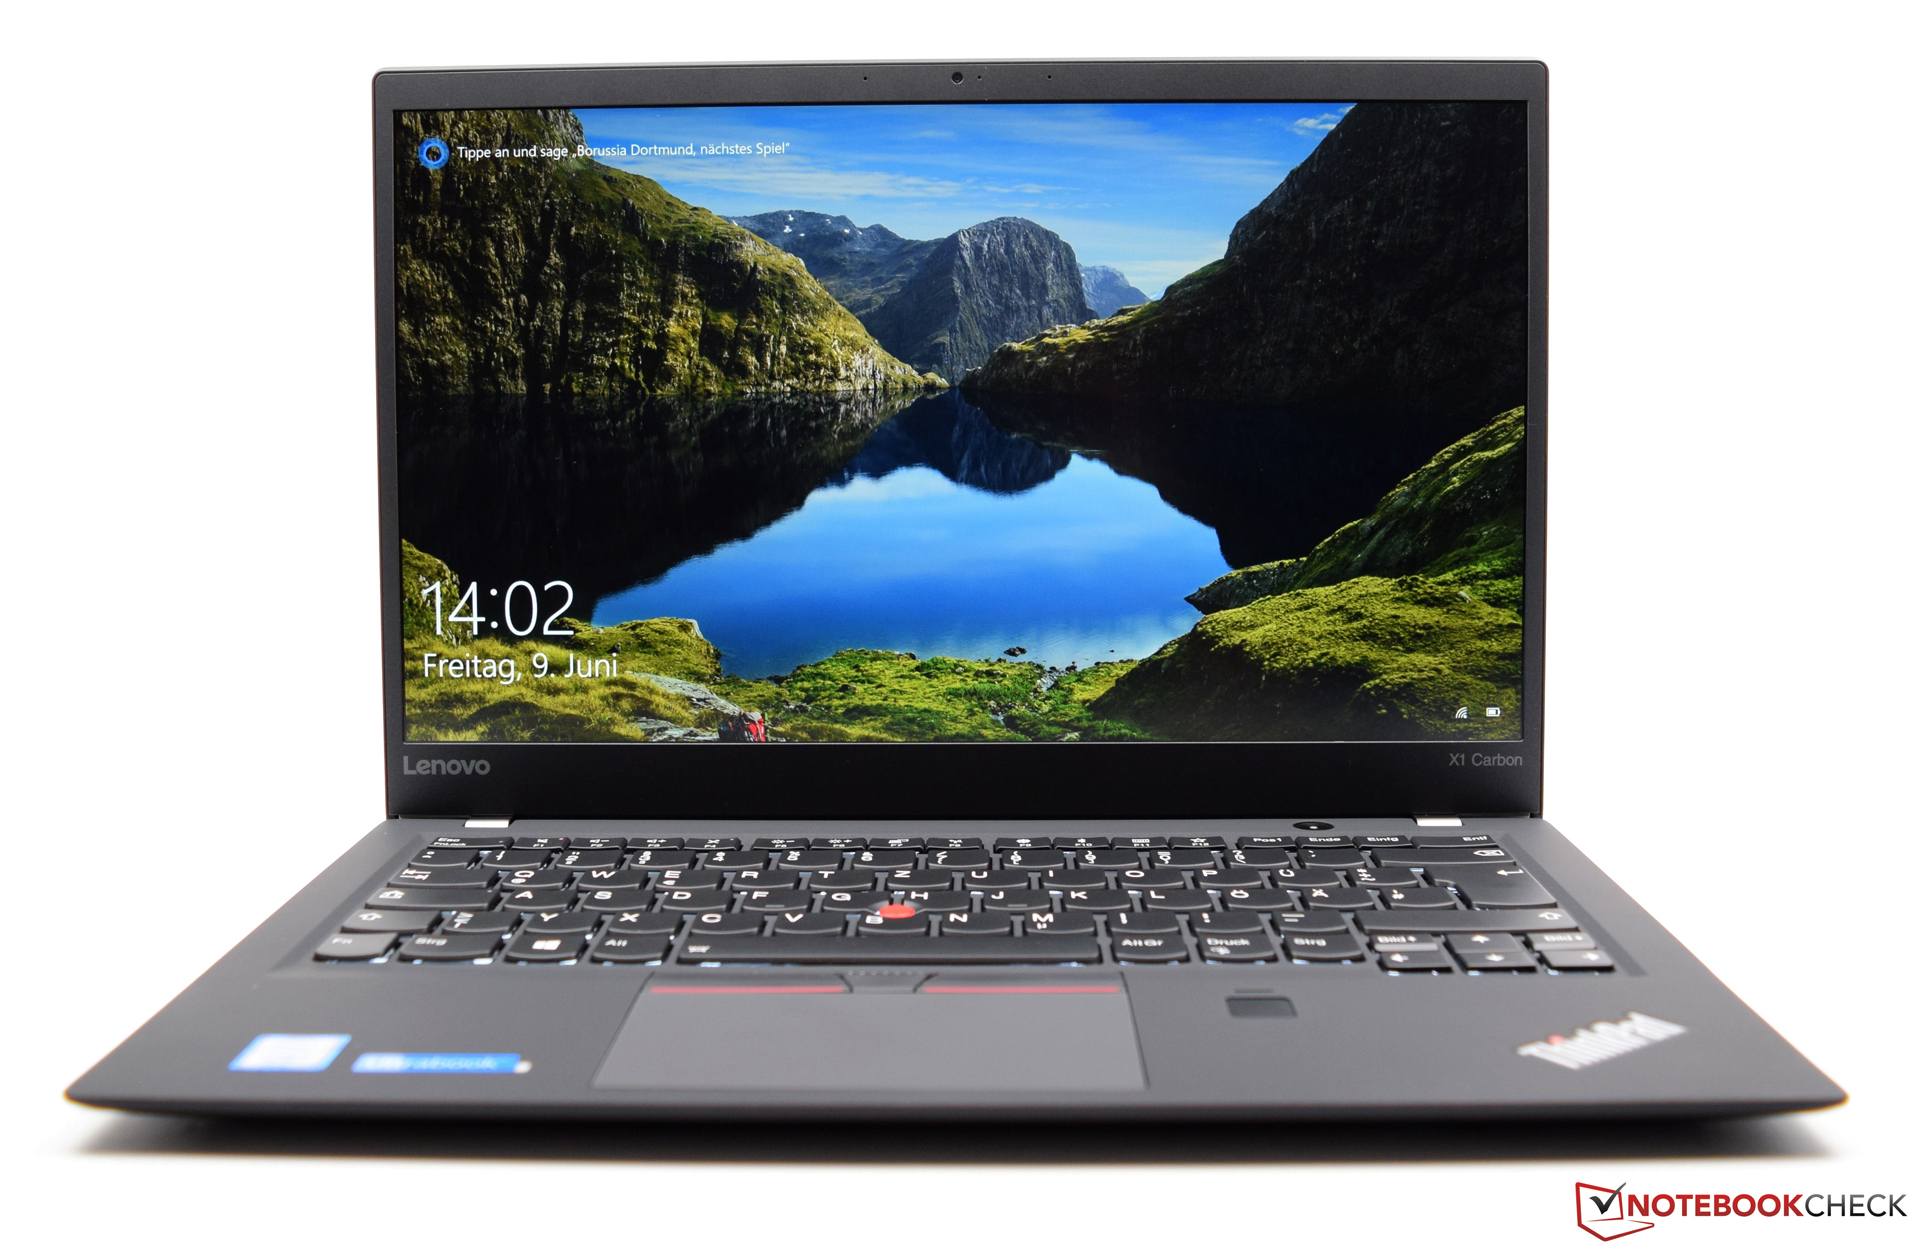
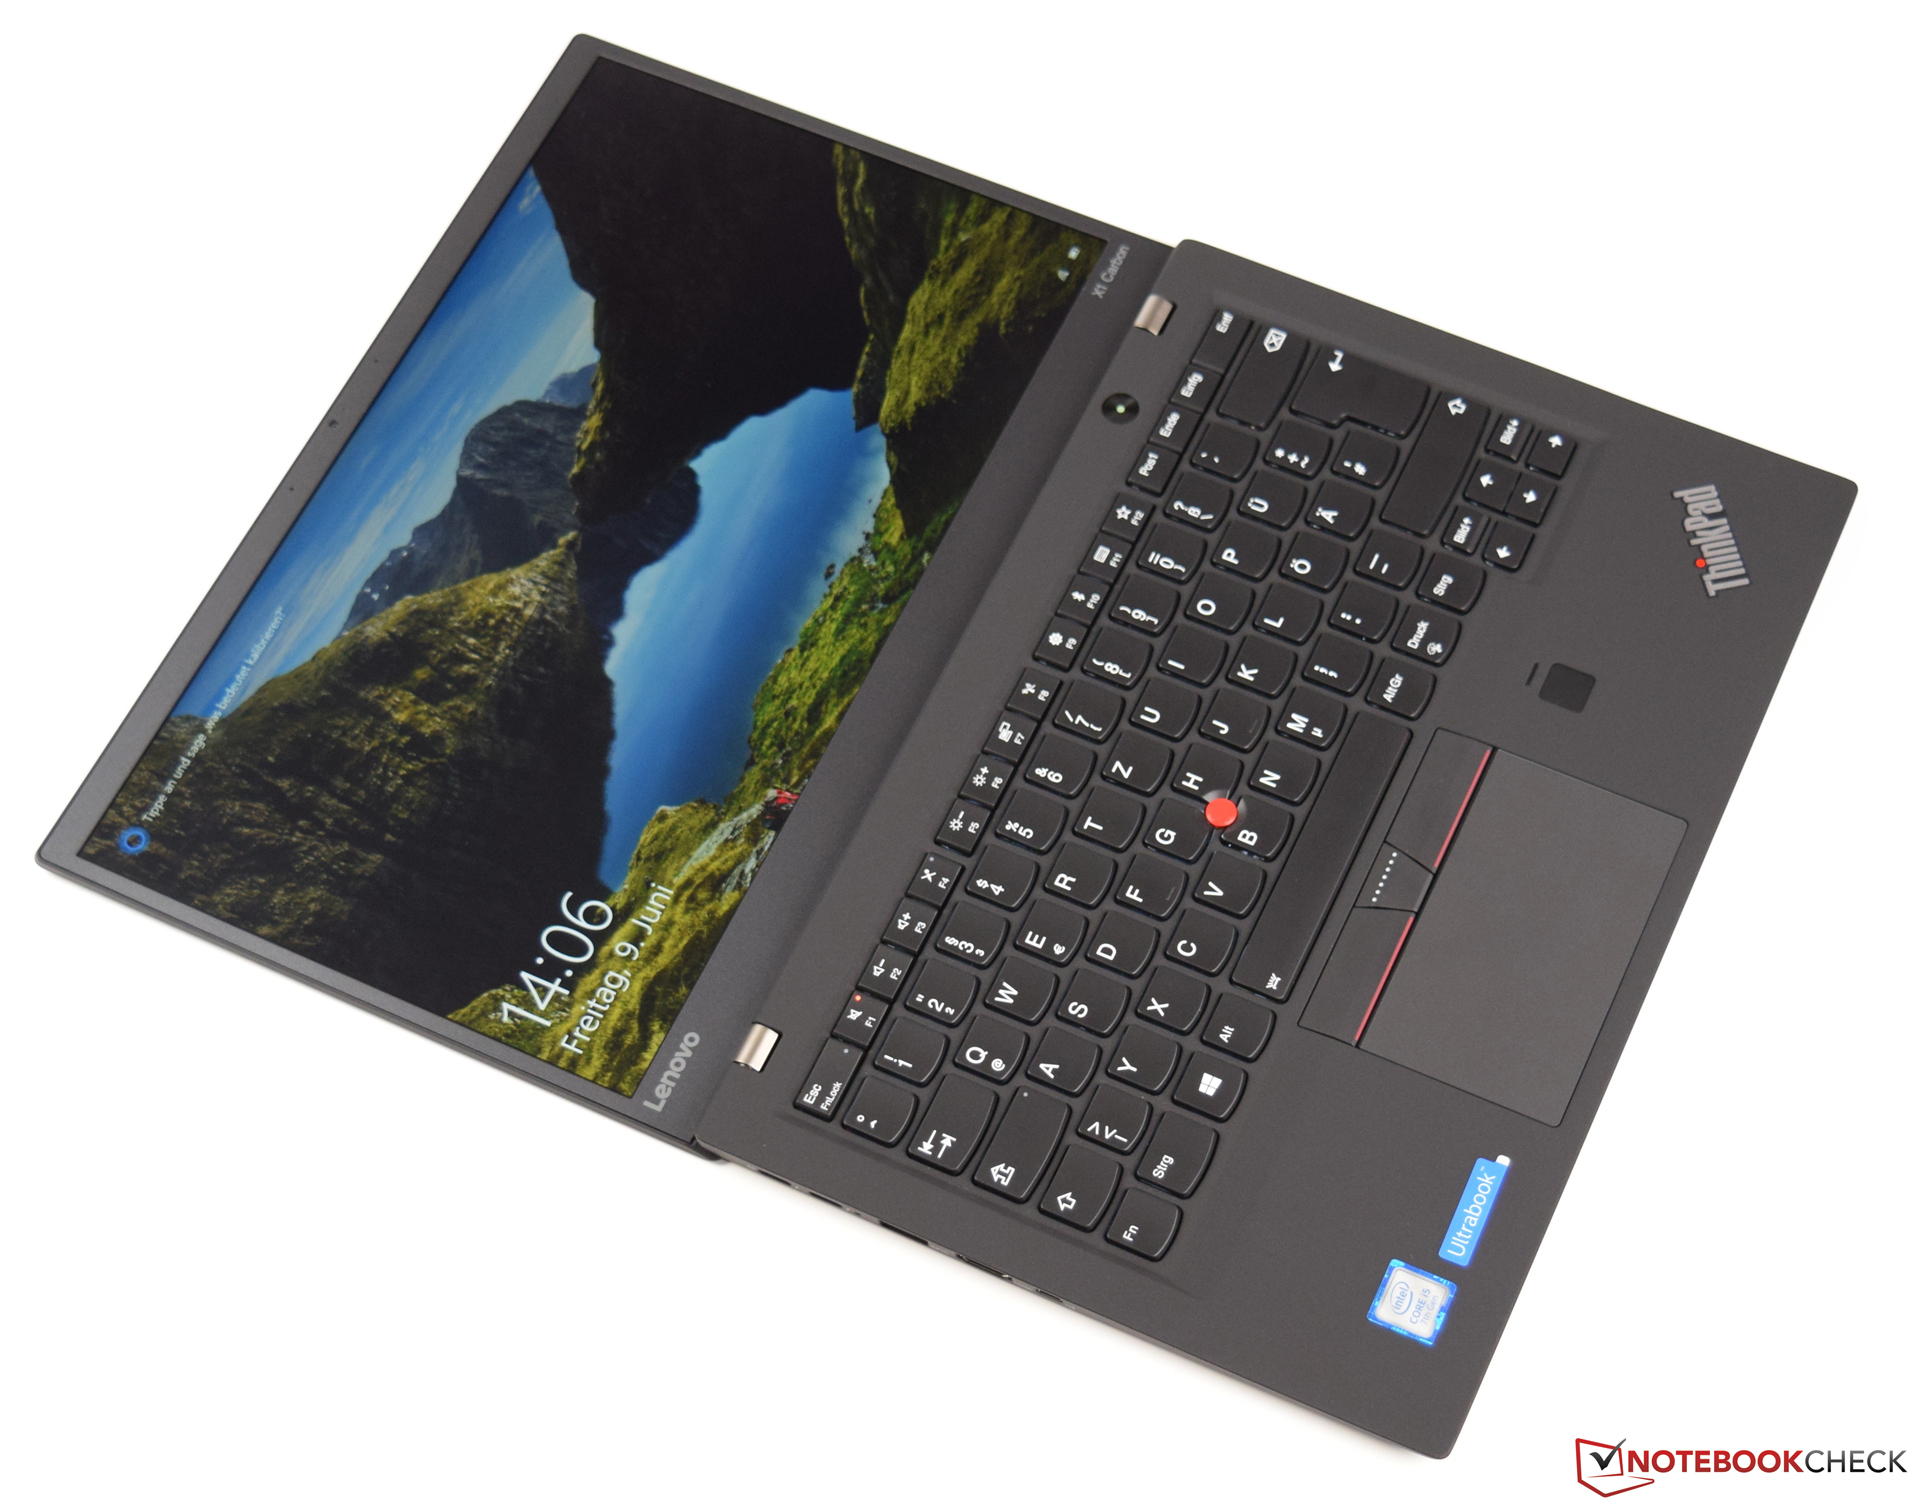
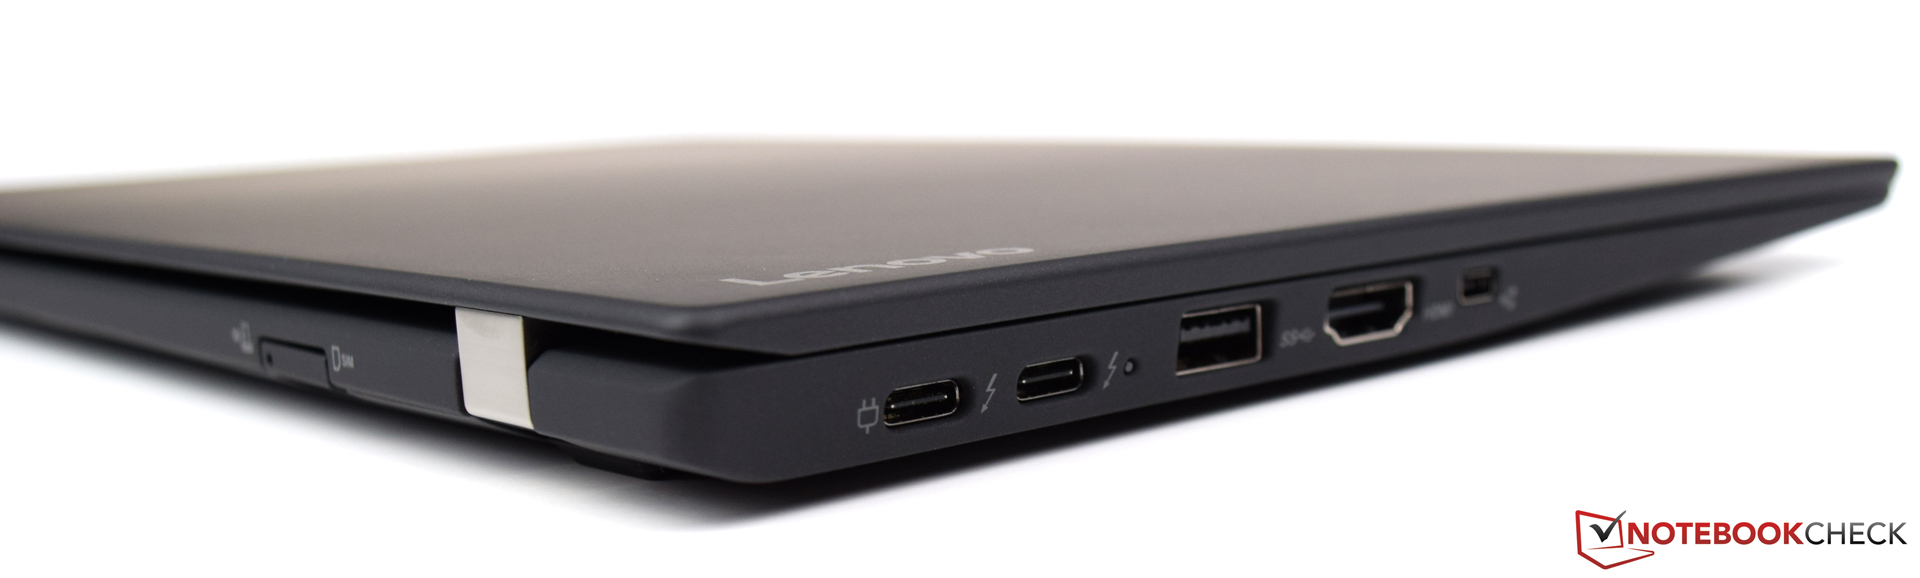
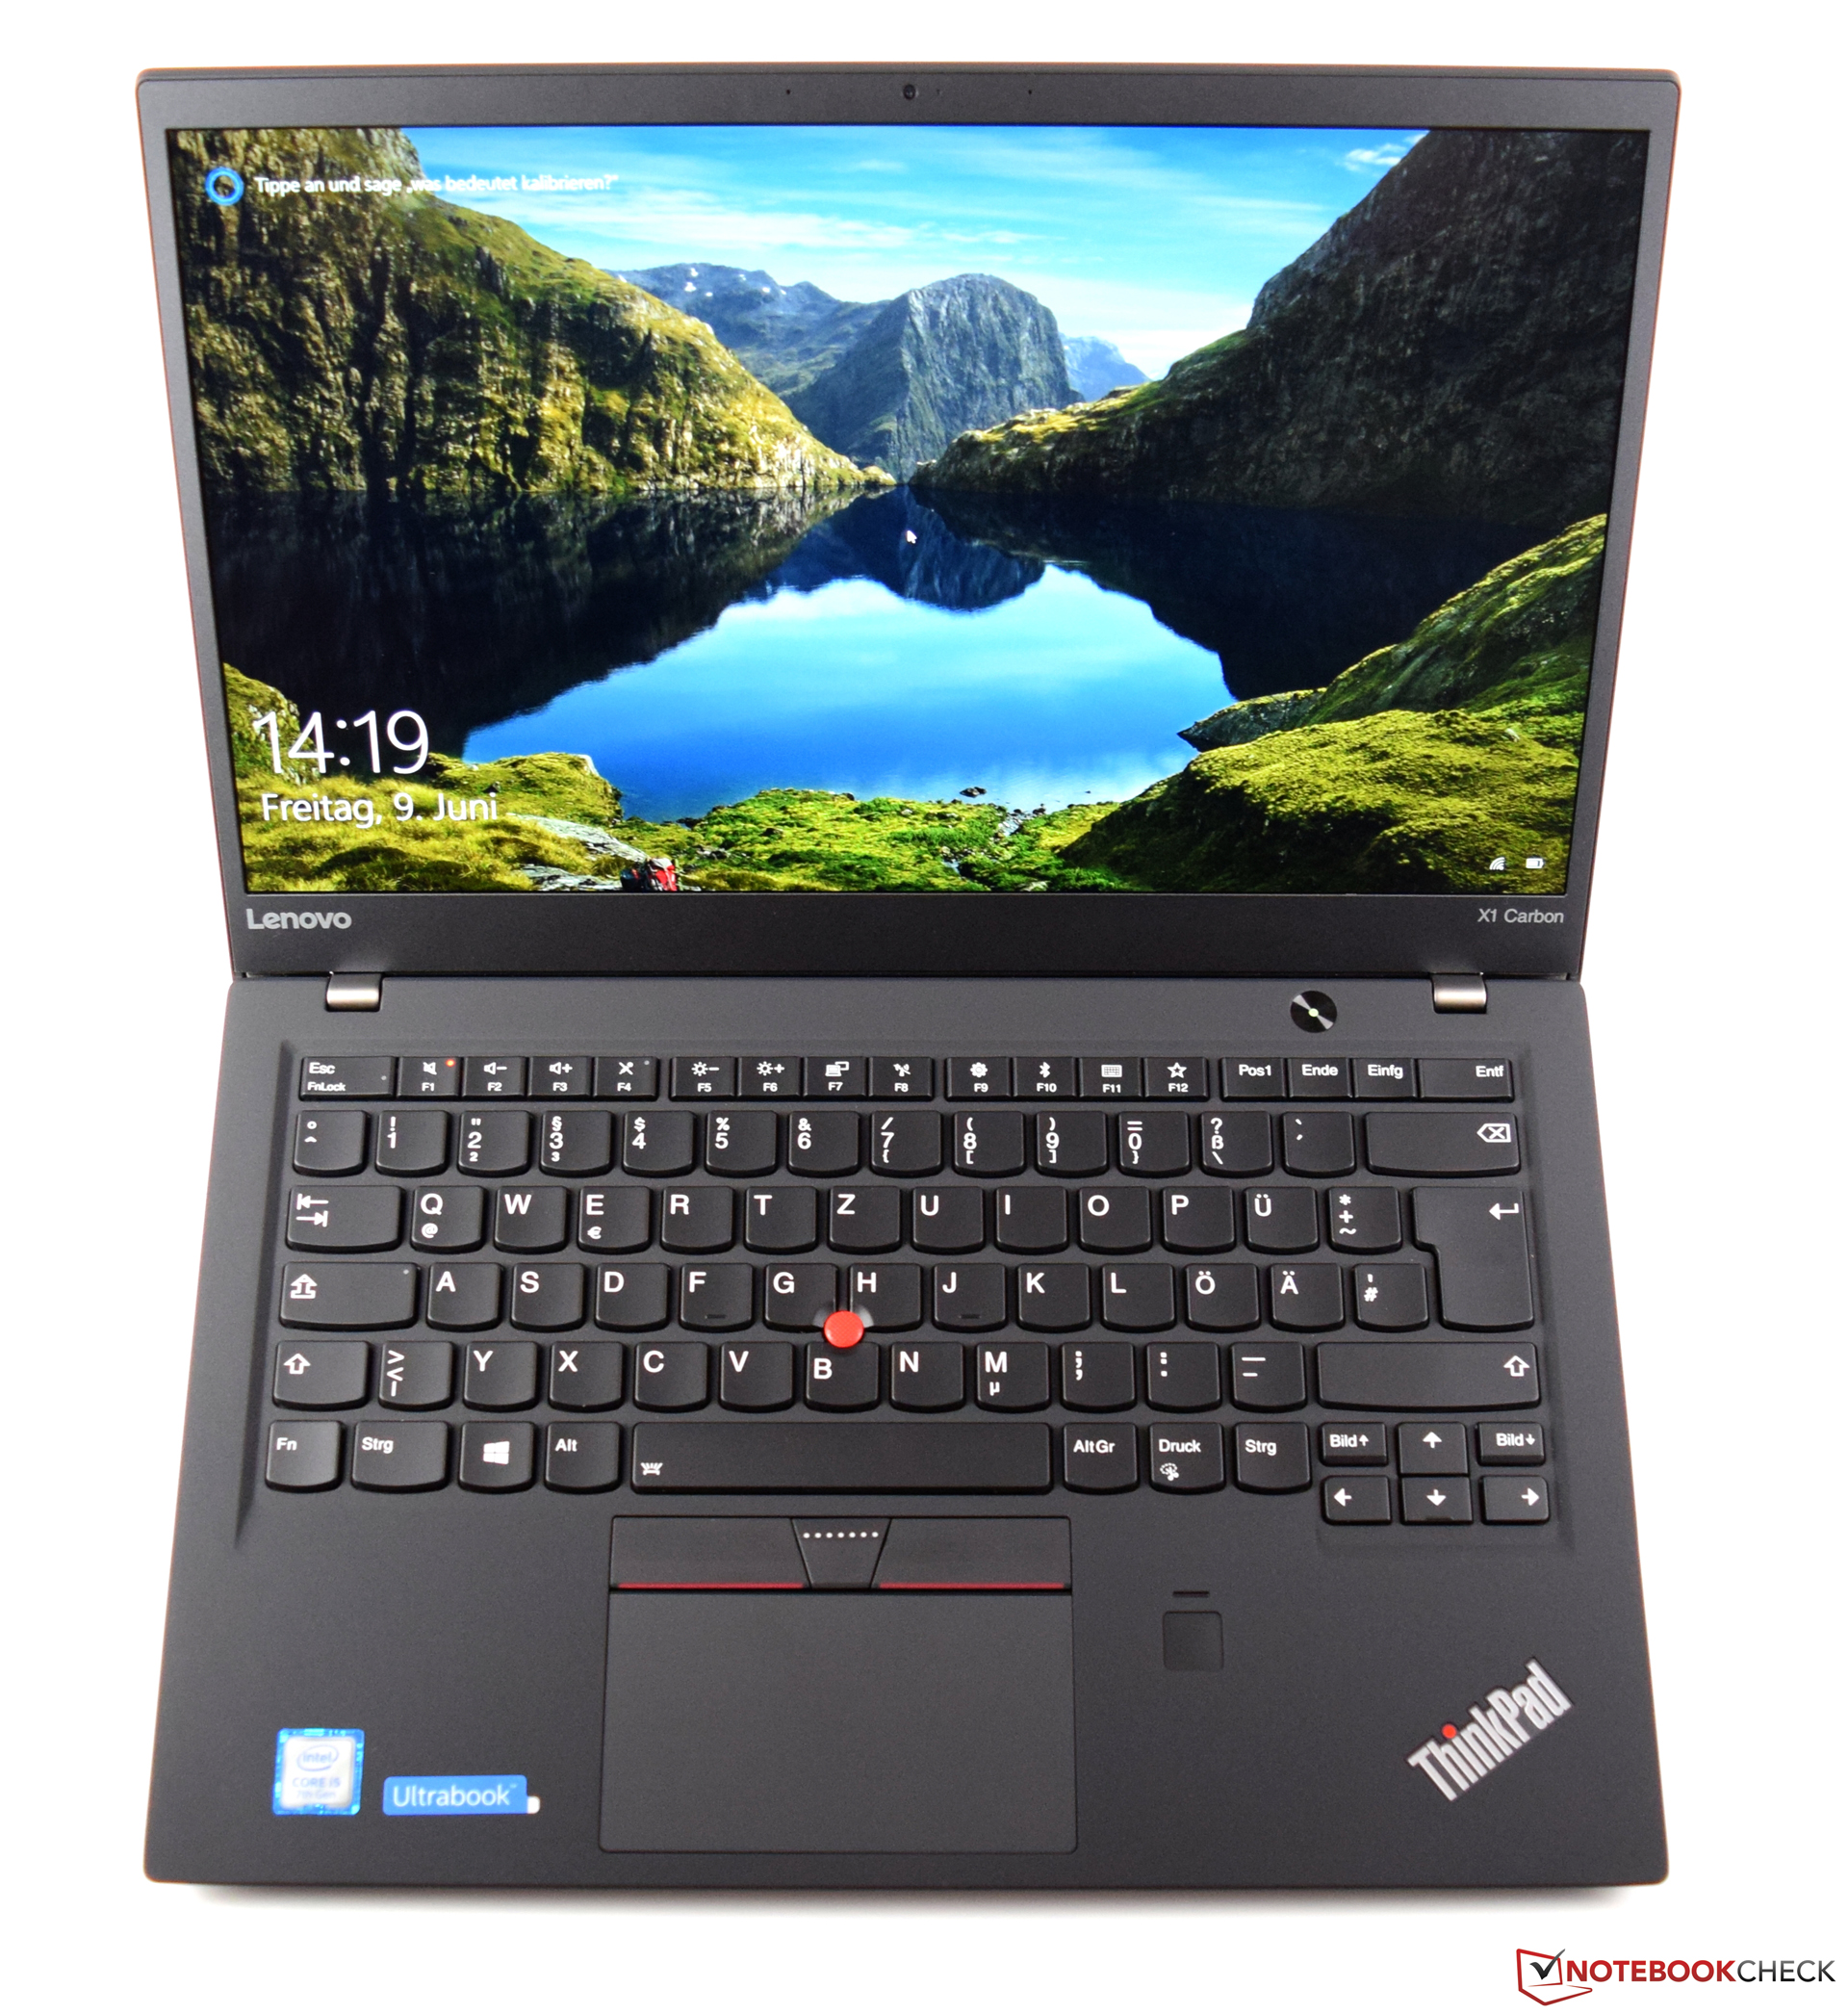
O Lenovo ThinkPad X1 Carbon 2017 é um portátil empresarial de alta qualidade com acabamento impecável. A mobilidade à qual o fabricante aspira com esta série, não decepciona de forma alguma, dado que um peso de pouco mais de apenas e 1 quilograma (~2,2 lb) é algo com o que outros conversíveis apenas poderiam sonhar. Em comparação, o modelo 2016, além de um formato menor, a nova carcaça também oferece conexões modernas, como portas Thunderbolt 3 (porta USB-C). Com isso, o aparelho também está preparado para o futuro. O bom desempenho completa o pacote, que custa 1669 Euros (~$1869) com o equipamento da nossa unidade de teste.
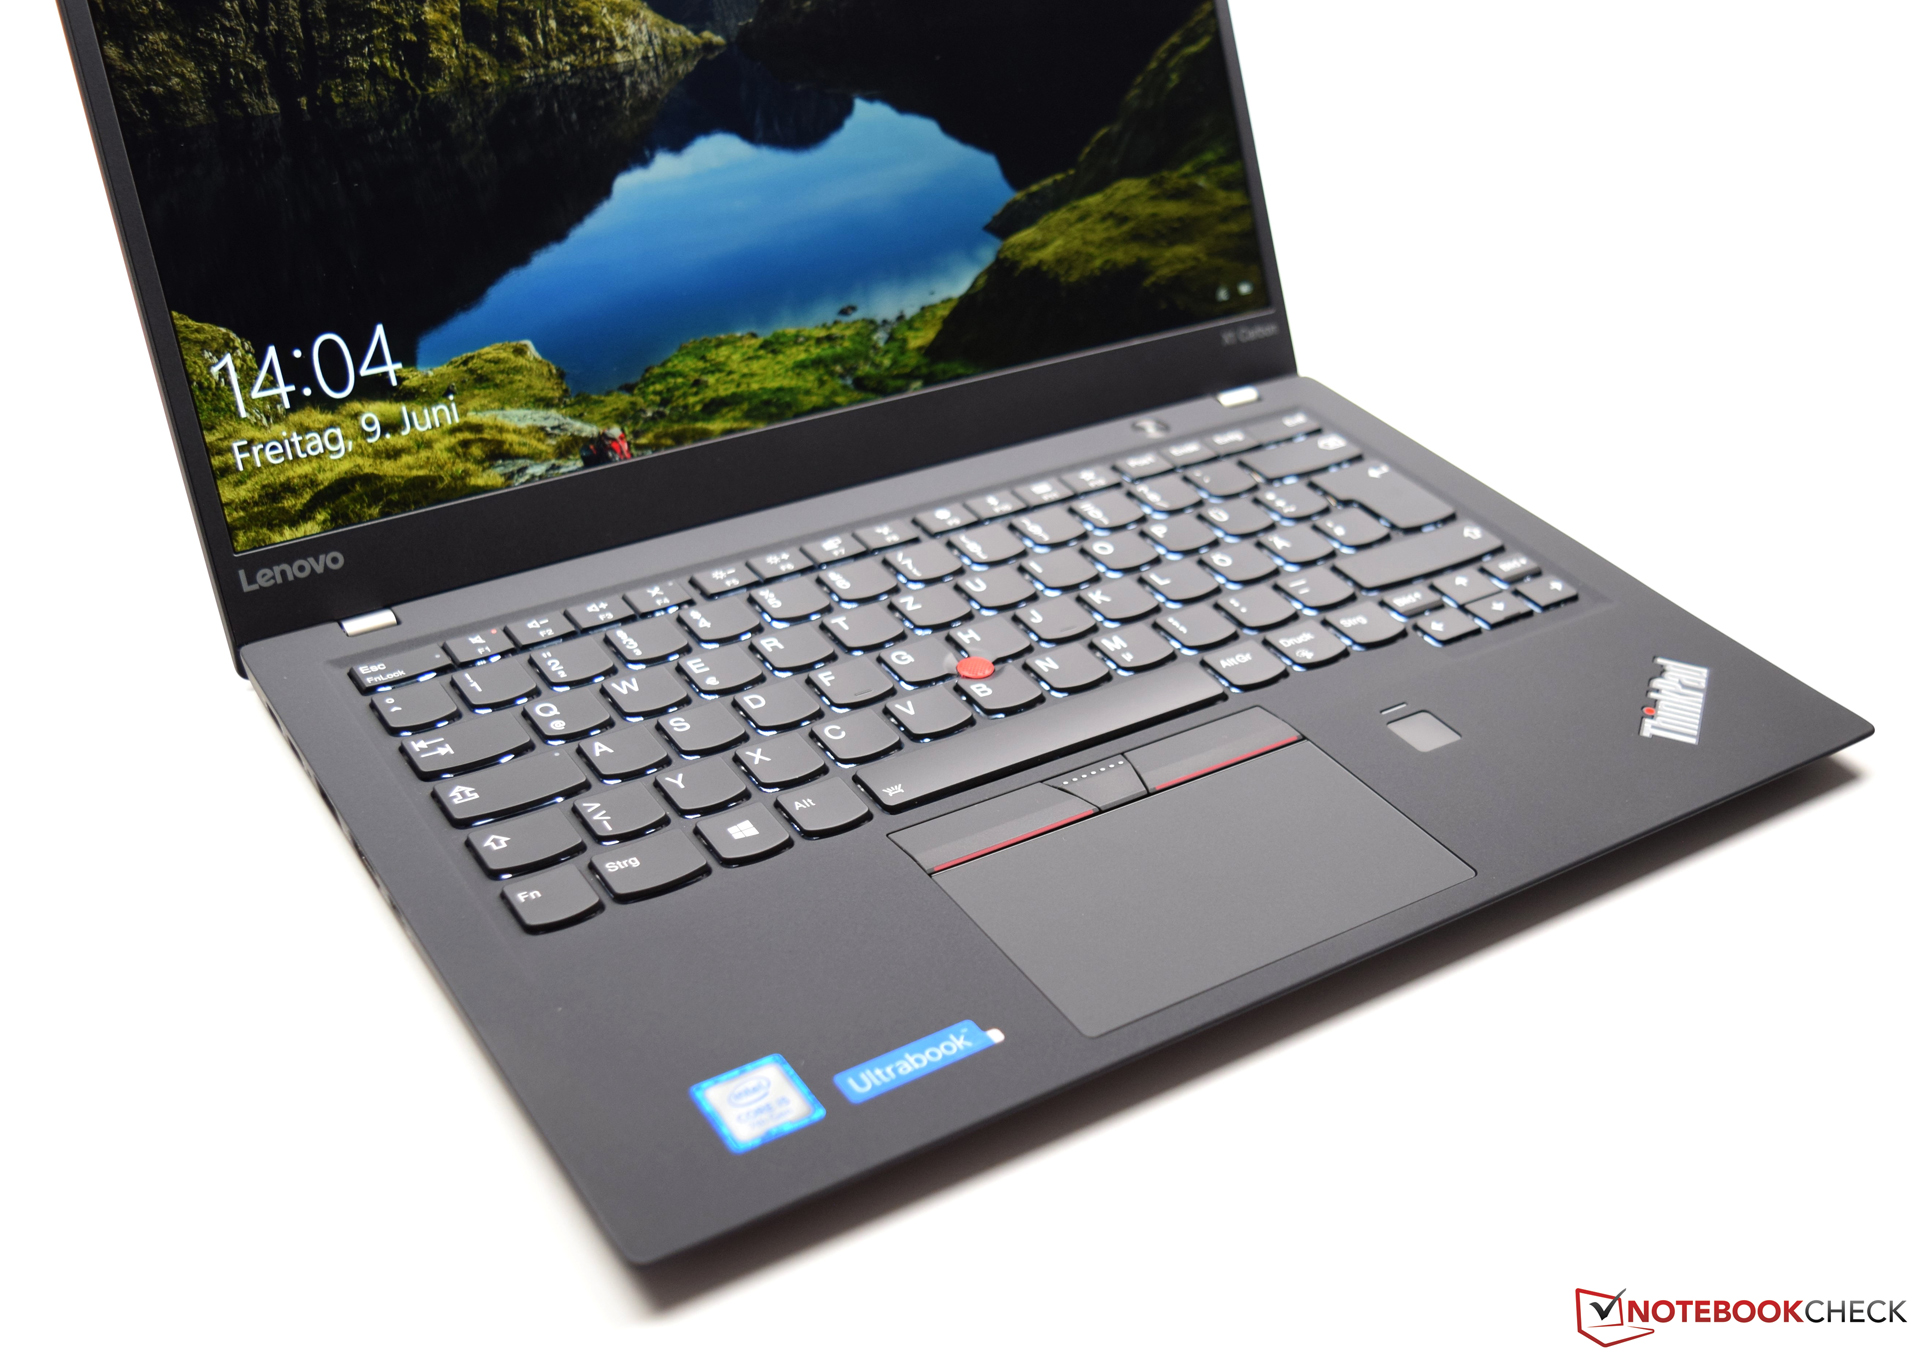
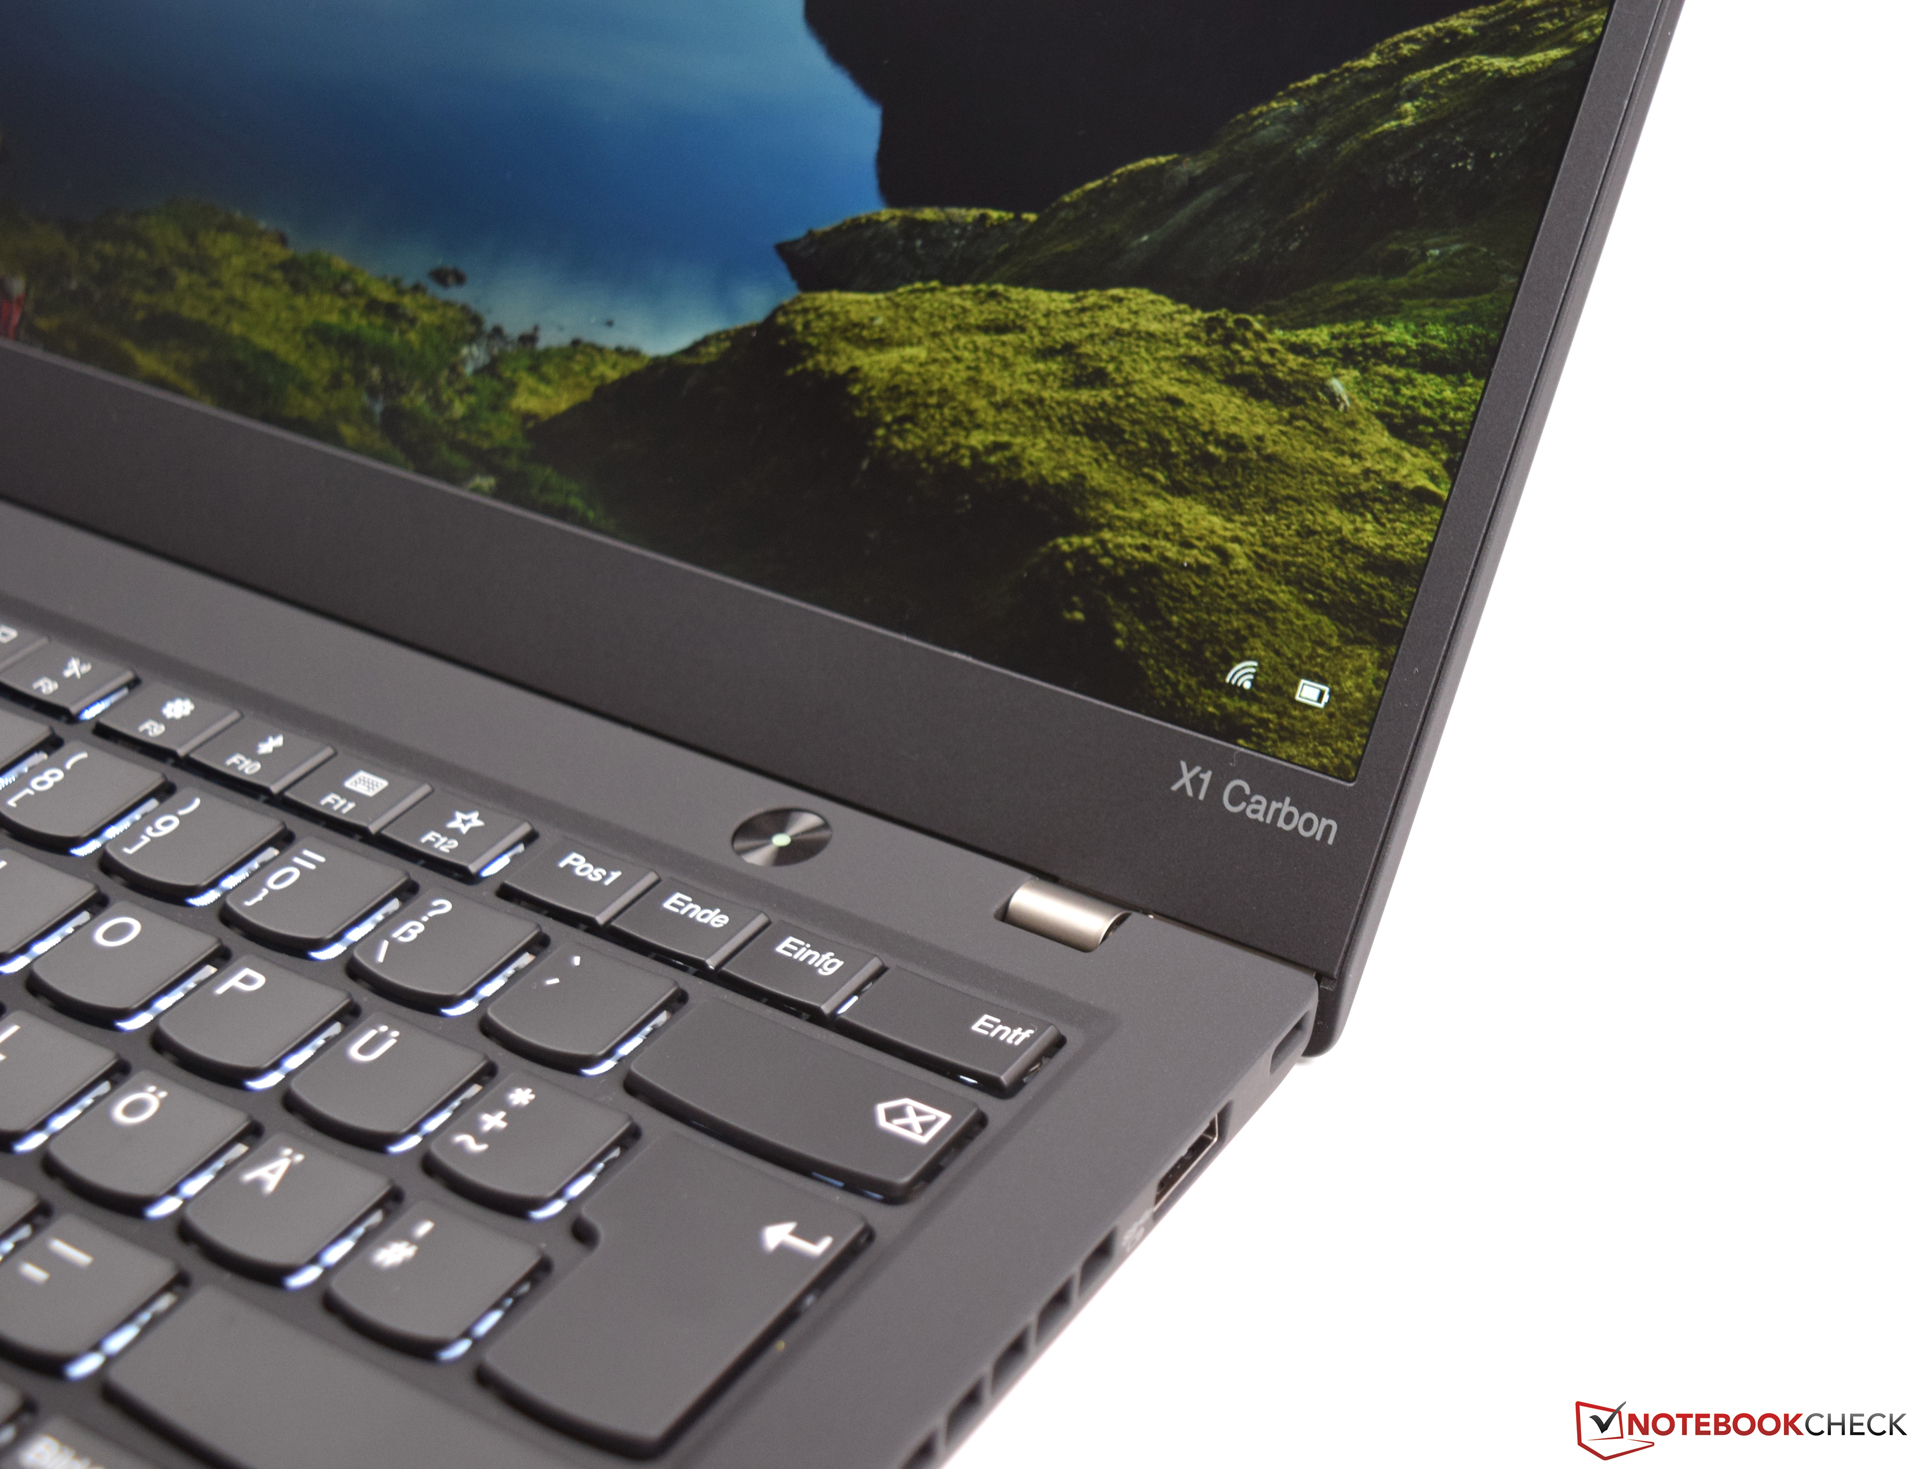
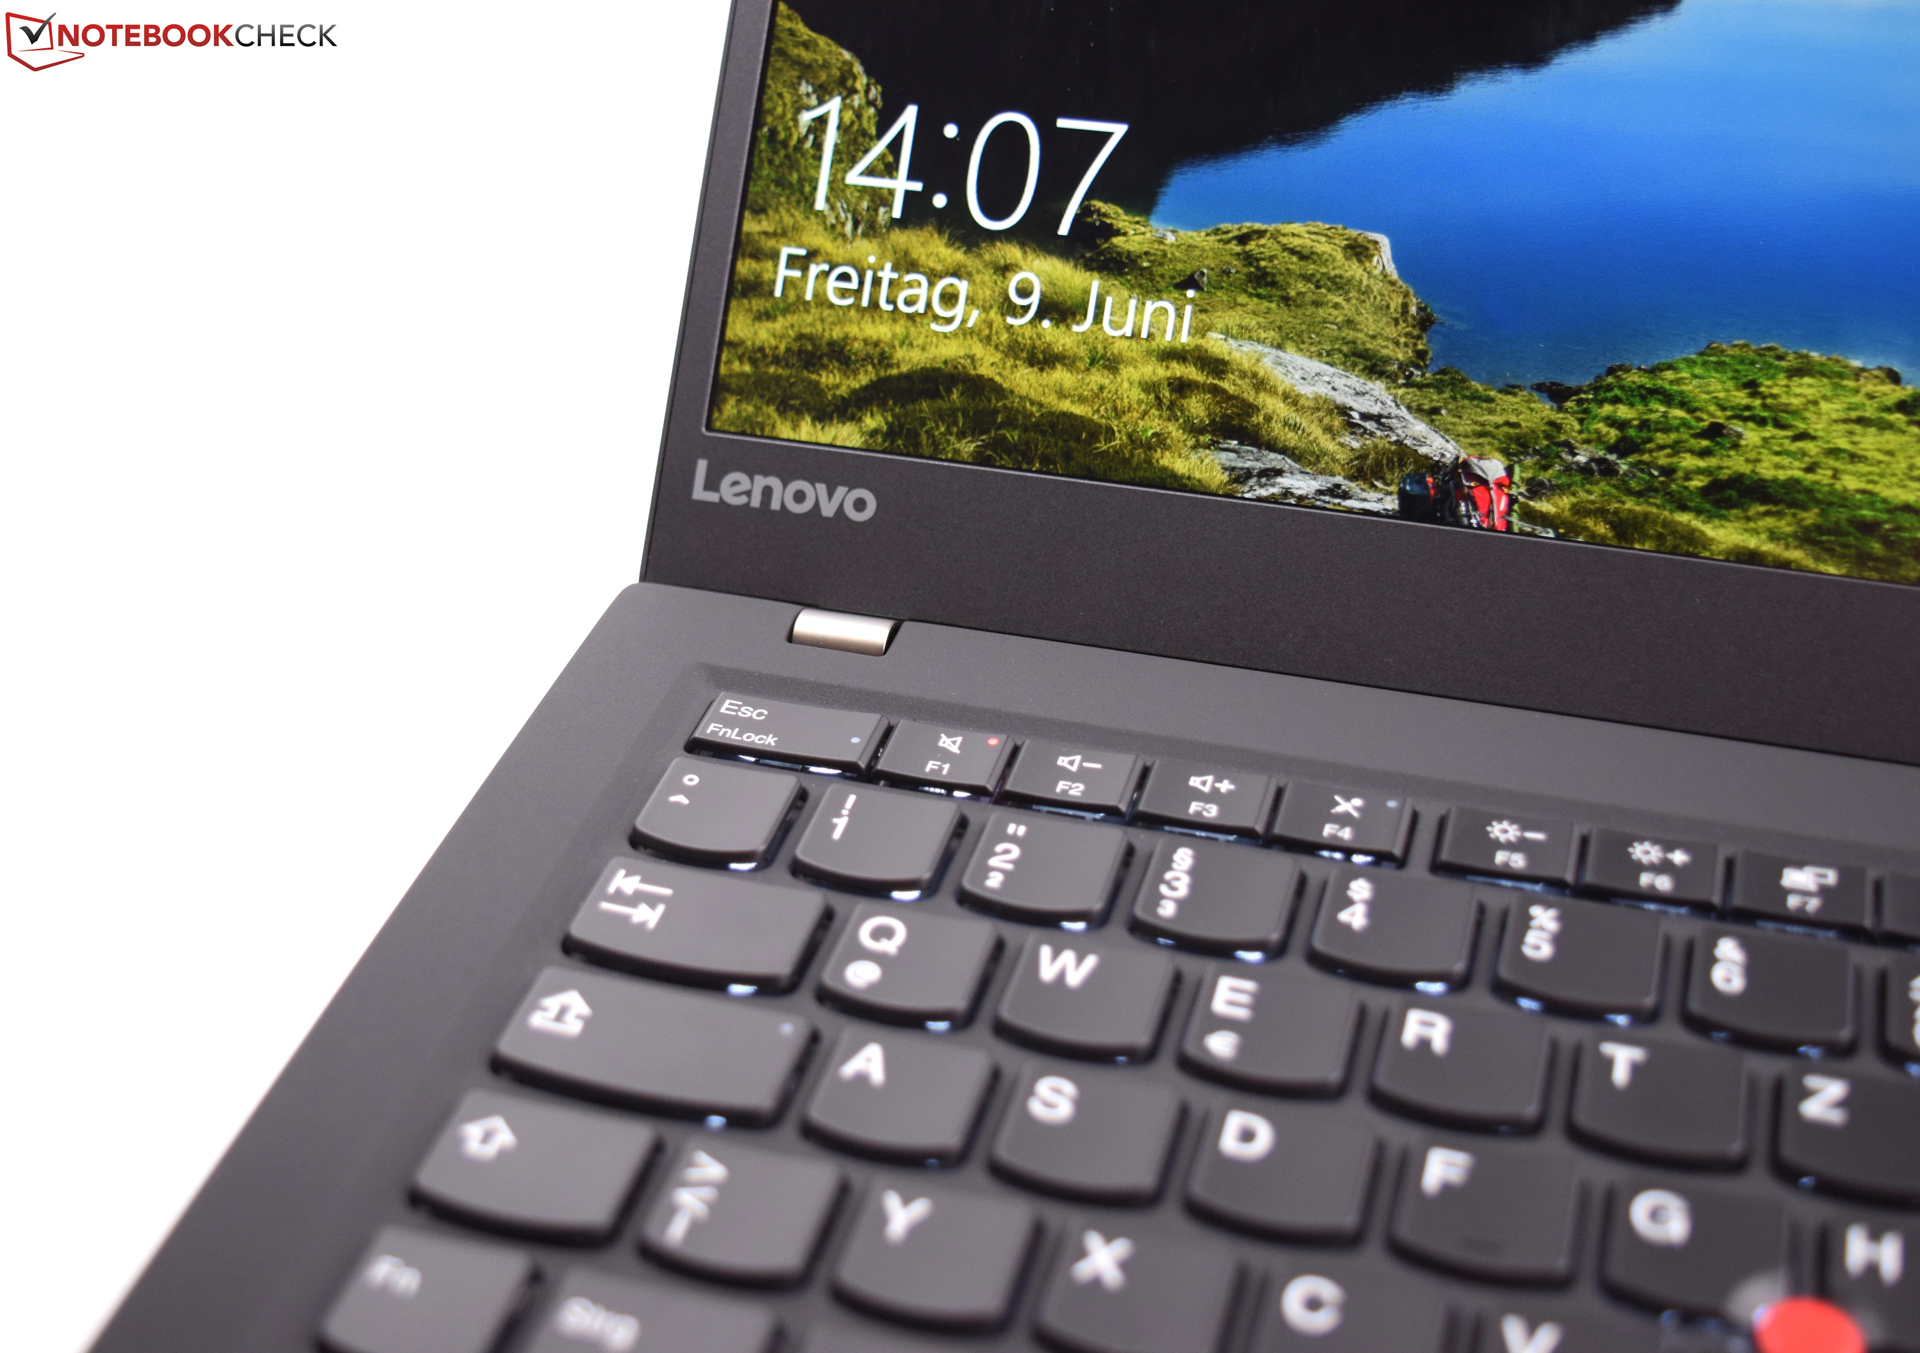
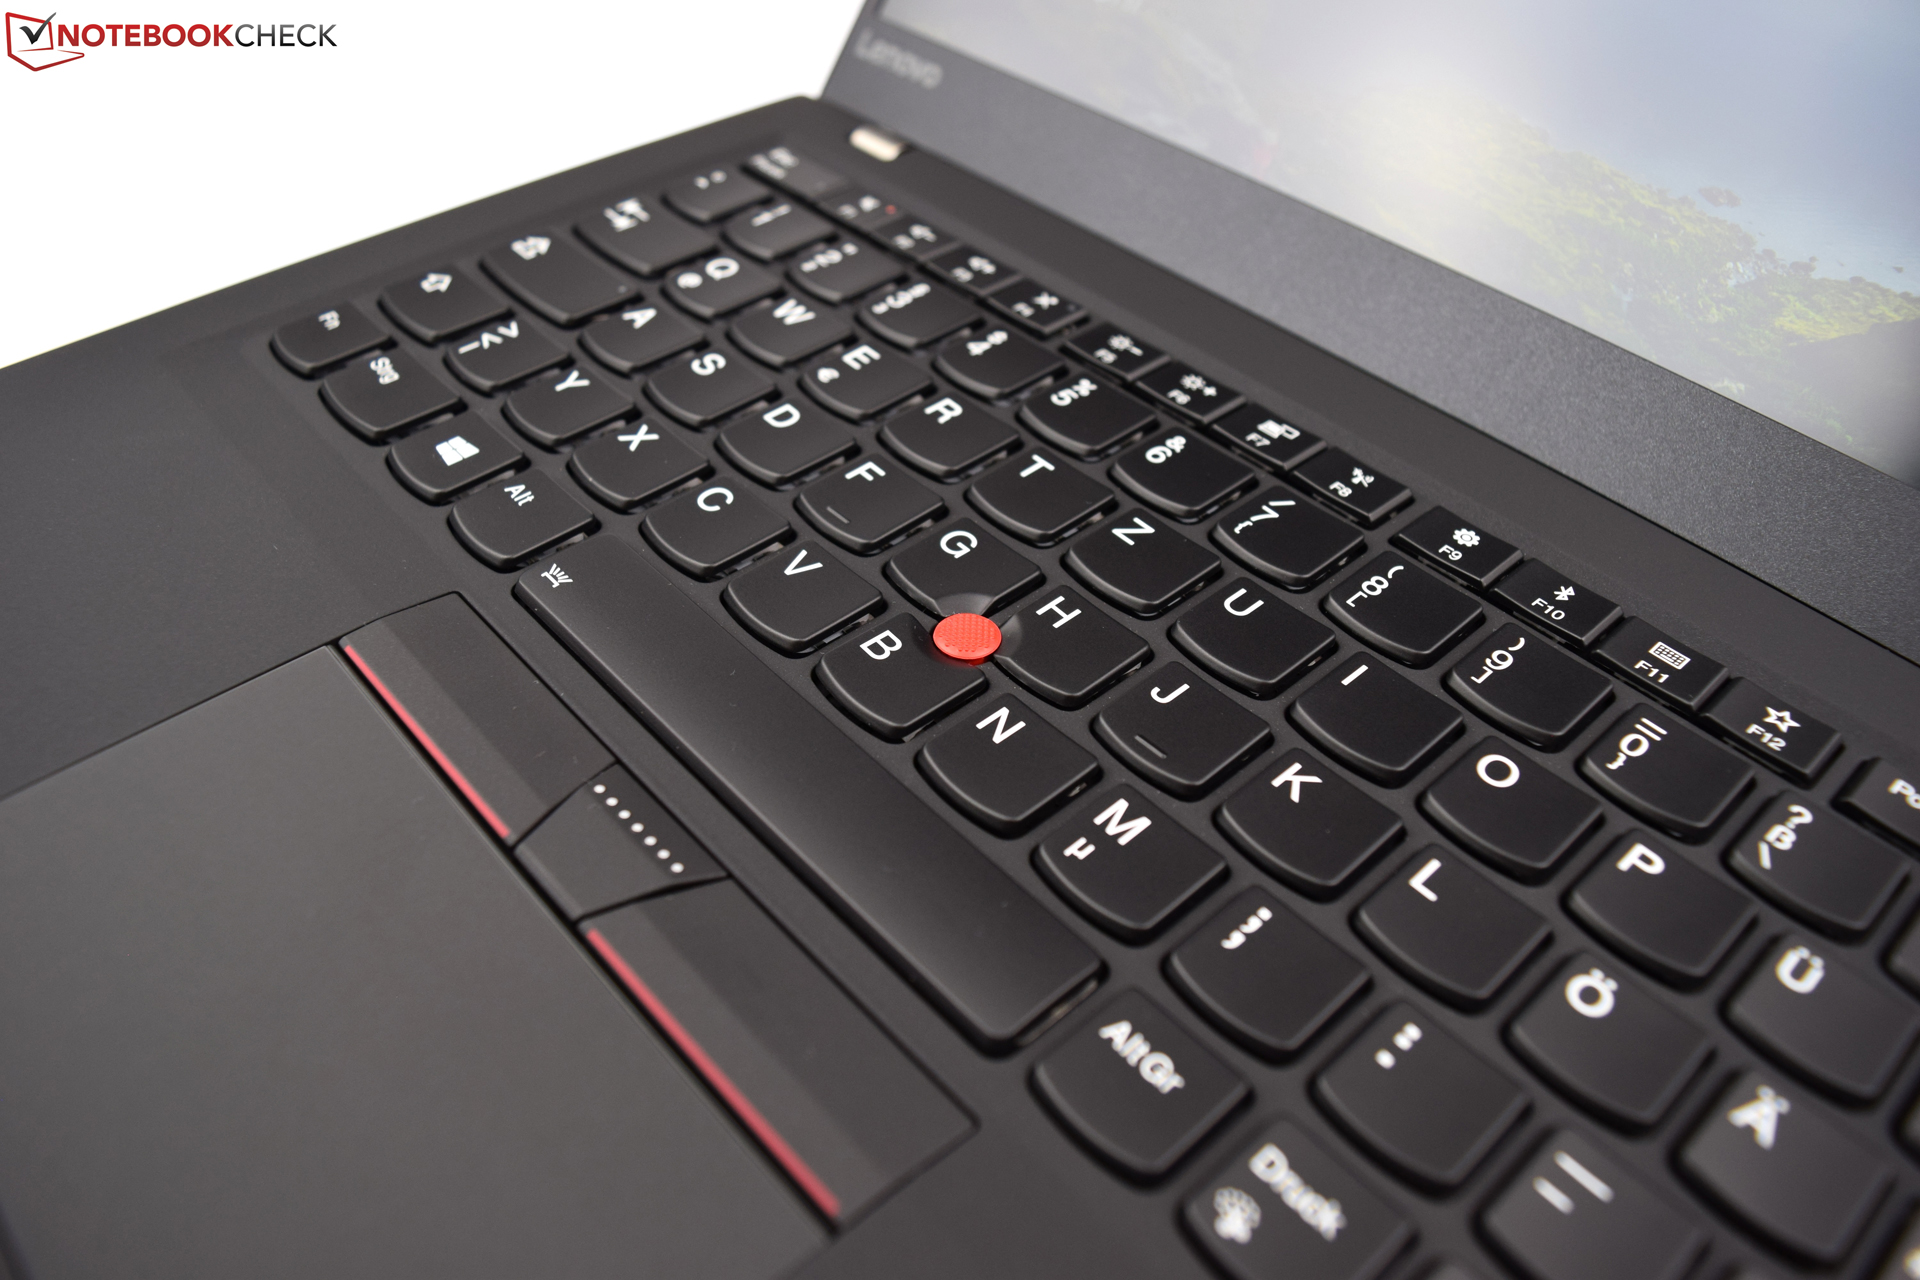
A Lenovo continua fiel a seus padrões e com o Lenovo ThinkPad X1 Carbon 2017 apresenta um portátil empresarial muito bom. Além disso, o portátil nos convenceu com seus excelentes dispositivos de entrada - mas não esperávamos outra coisa da Lenovo.
Embora a tela IPS Full HD oferece bons resultados, não consegue superar o painel WQHD do predecessor. No geral, o aparelho é atraente e agradável para trabalhar. O bom desempenho do sistema garante um bom ritmo de trabalho para a vida diária.
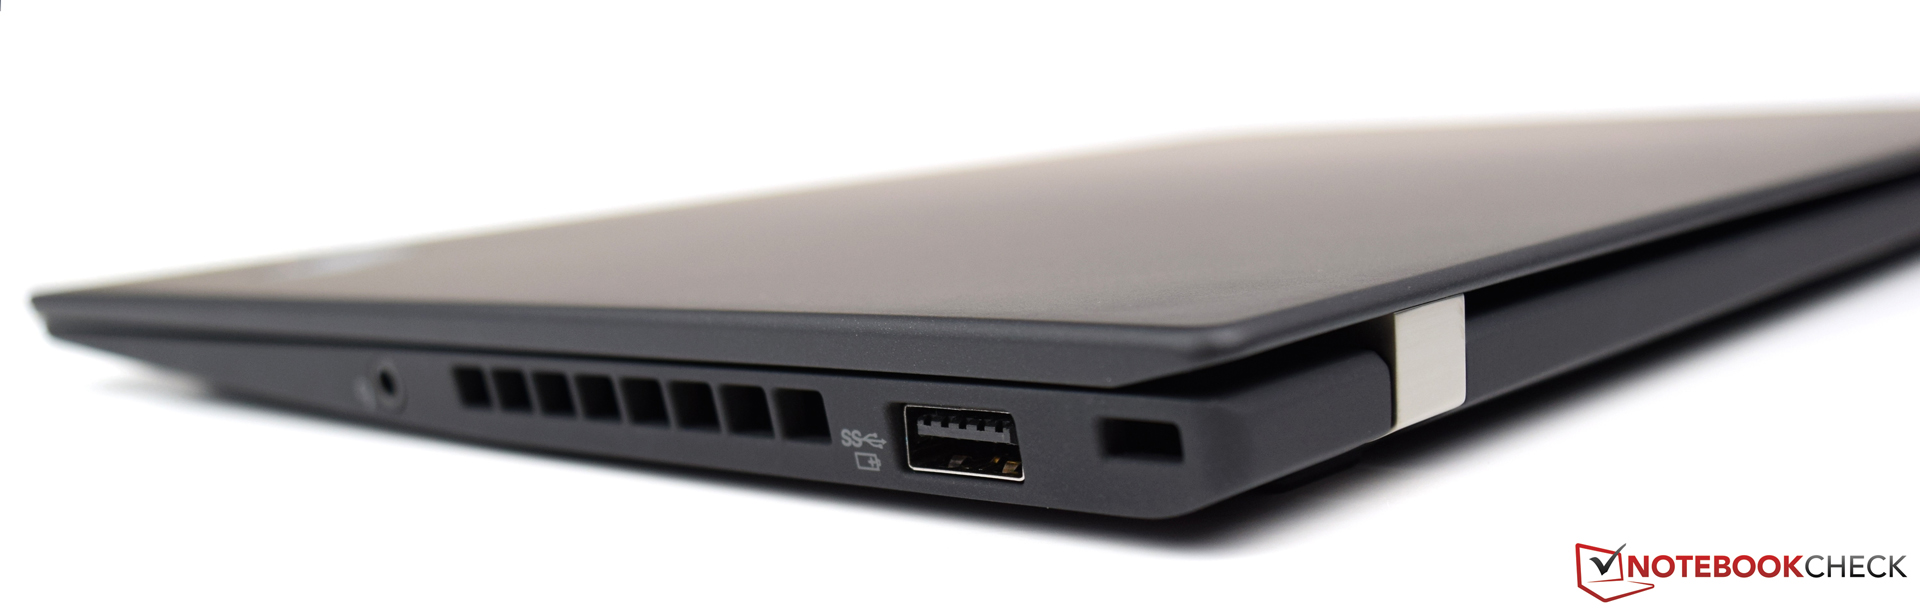
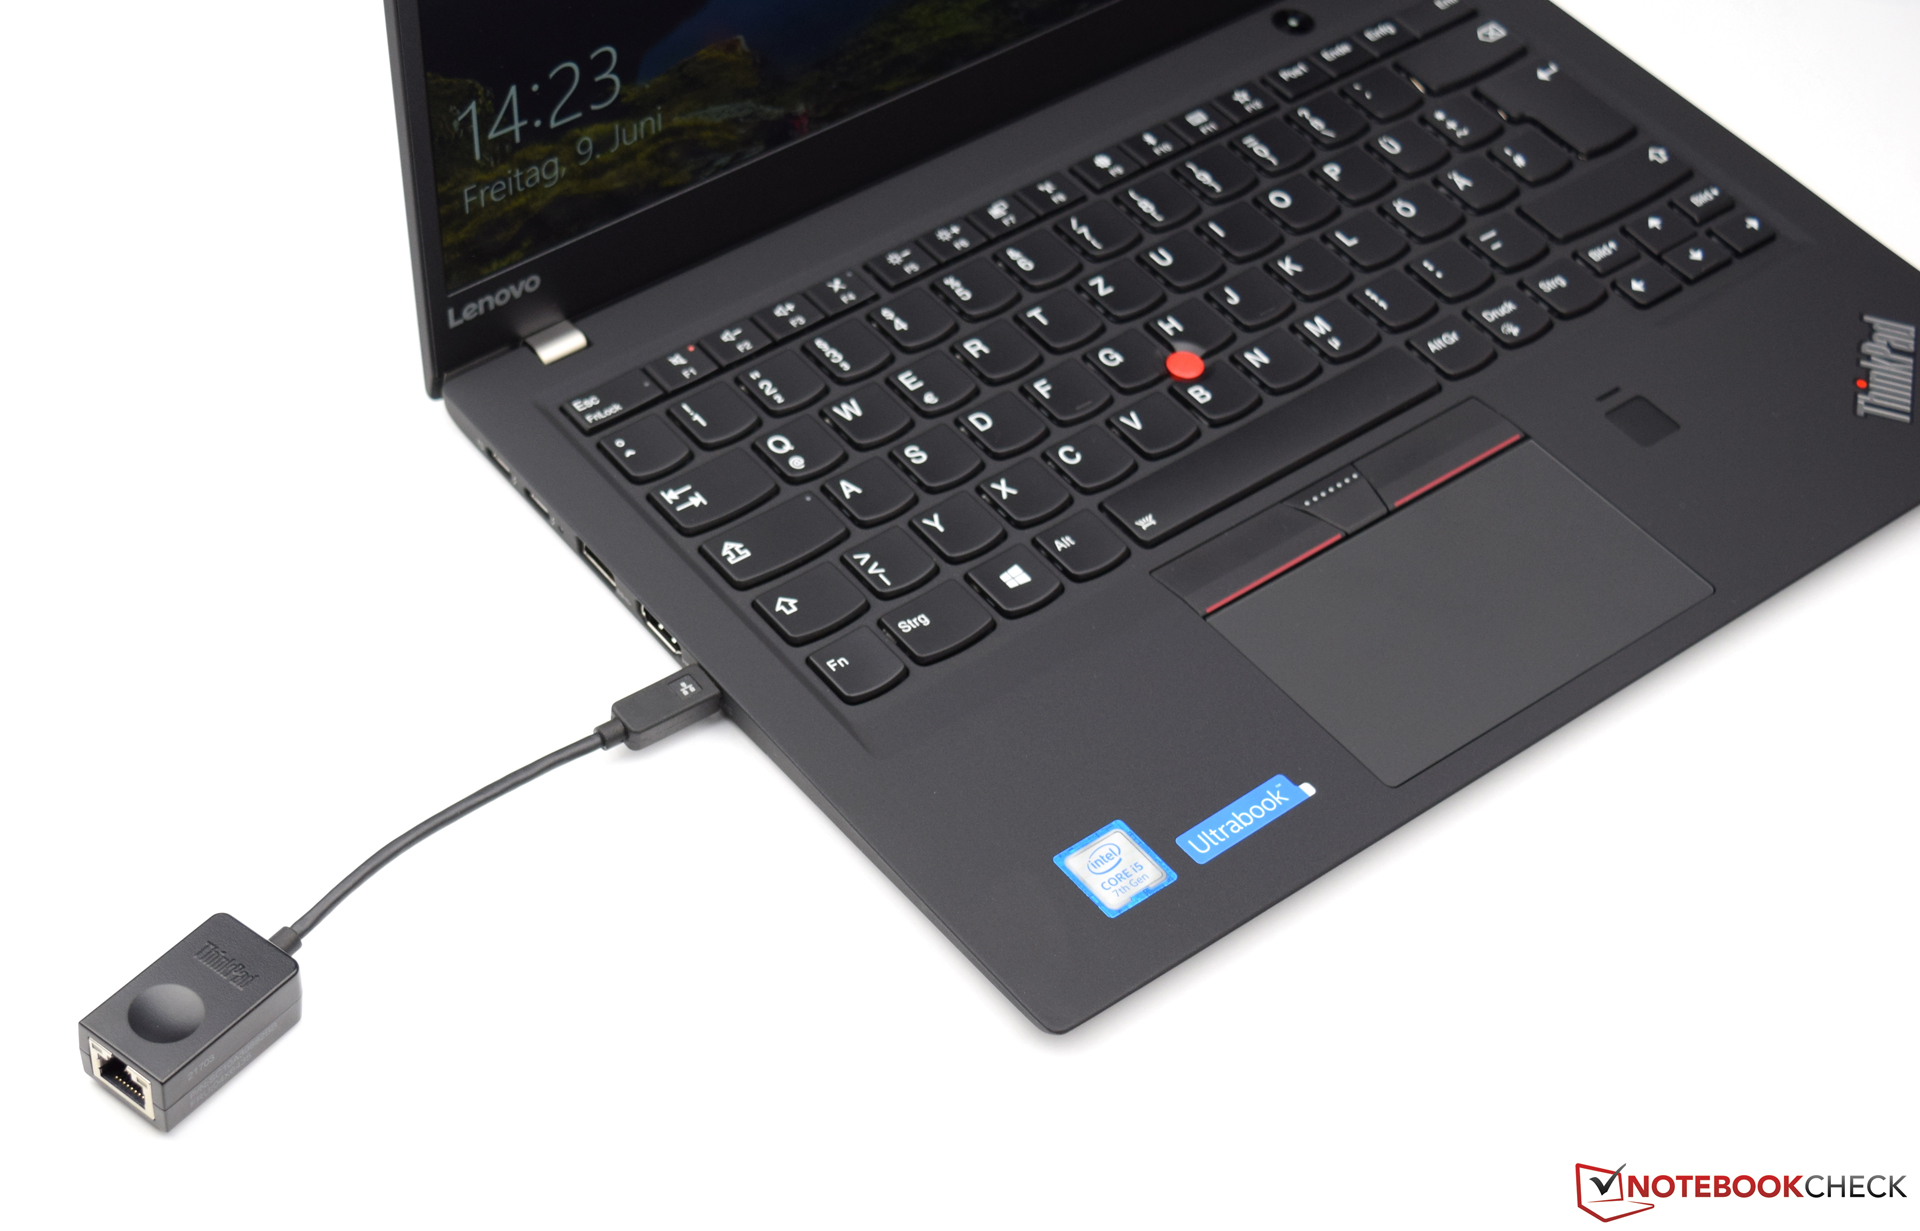
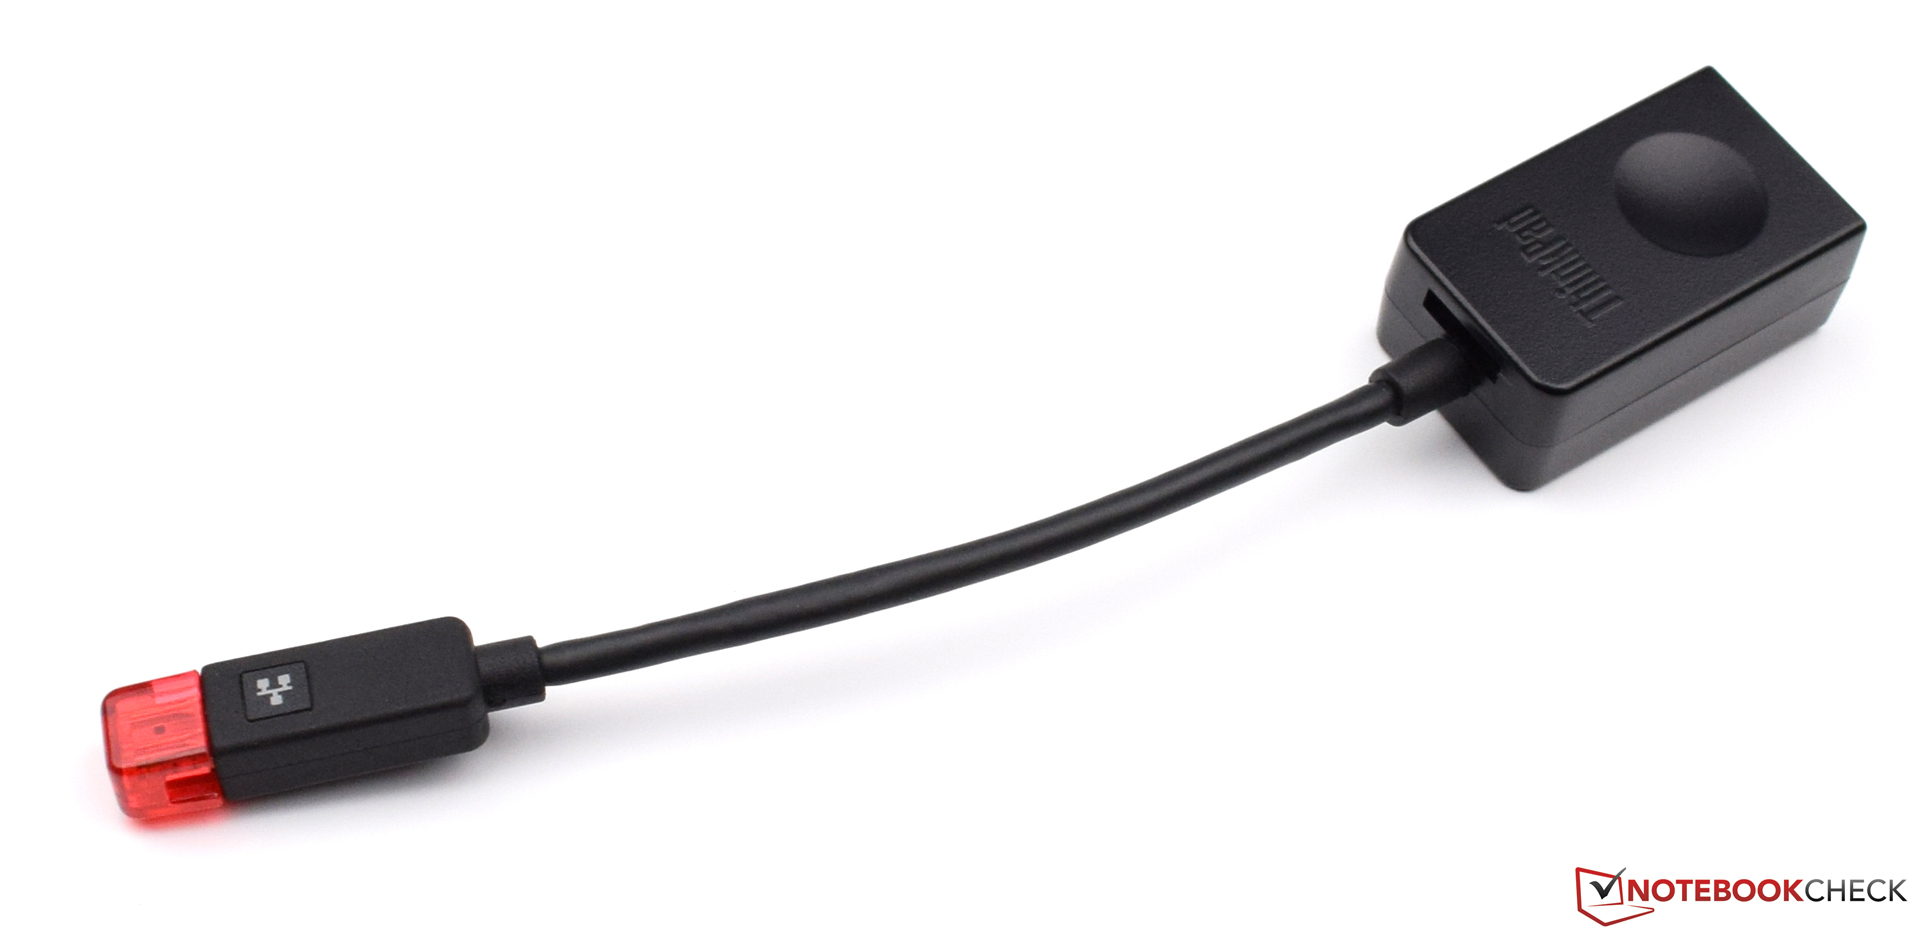
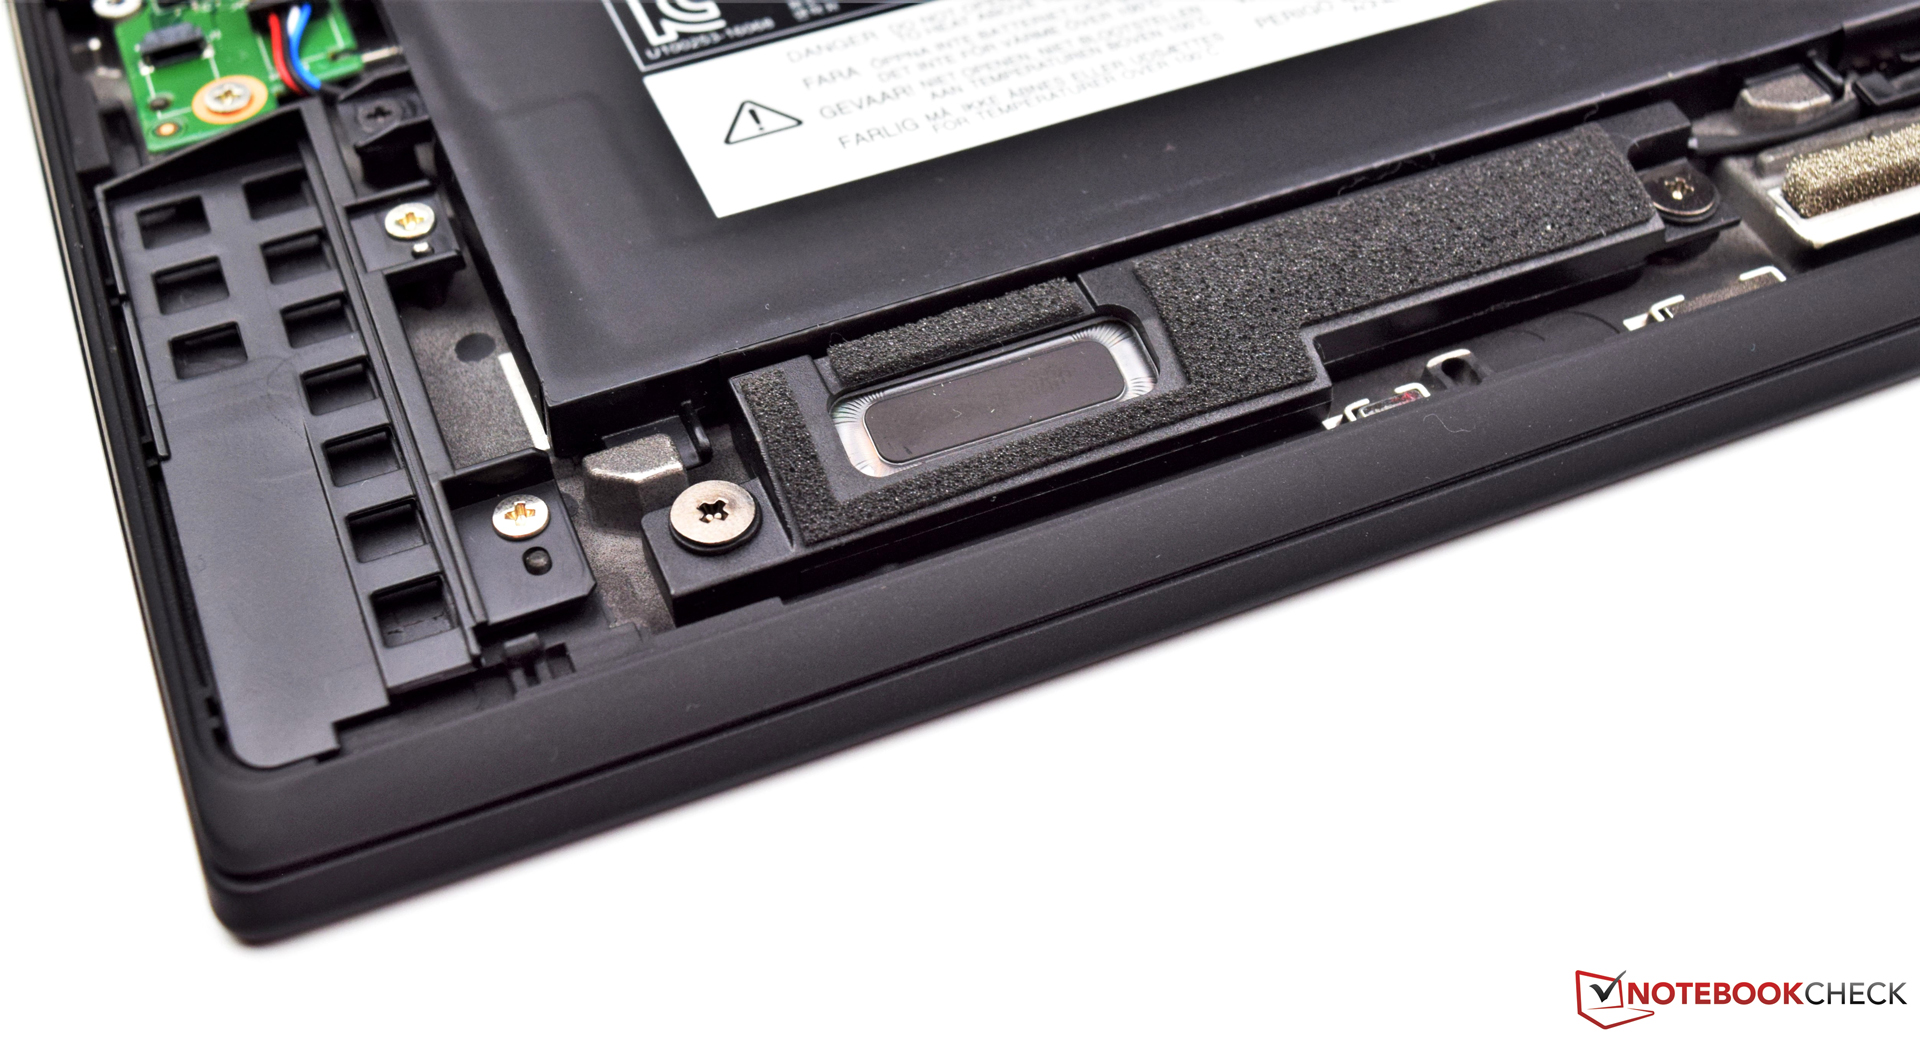
No entanto, ainda dá motivos para reclamos. A ausência de um leitor de cartões SD somente pode ser compensado com um adaptador, que é desconfortável de usar, que se usa muito os cartões SD. Dado que as altas temperaturas da carcaça sob uso intenso também são desagradáveis e poderia tornar desconfortável trabalhar com ele sobre as pernas.
Finalmente, também está a questão de qual dos aparelhos Lenovo ThinkPad X1 Carbon 2017 é melhor. à primeira vista nos dados técnicos, é claro que se fala muito do modelo com o processador Intel Core i7-7500U mais rápido, que também chama a atenção com 16 GB de RAM. Apesar disso, o Lenovo ThinkPad X1 Carbon 2017 baseado no Intel Core i5-7200U também se sai muito bem. Apesar de ter 8 GB (a metade) de memória de trabalho, garante um funcionamento fluente no futuro próximo. Em termos de desempenho, o mais veloz e evidentemente mais caro X1 Carbon é atraente durante um curto período, dado que sob uso intenso constante funciona com quase a mesma velocidade do modelo Core i5 consideravelmente mais econômico. Por este motivo, criticamos muito o cargo alto cobrado e preferiríamos optar pelo Lenovo ThinkPad X1 Carbon 2017 com o Intel Core i5-7200U. As vantagens do Core i7 são pequenas demais e também 16 GB de RAM não são absolutamente necessários.
Lenovo ThinkPad X1 Carbon 2017-20HR0021GE
- 06/14/2017 v6 (old)
Sebastian Bade