Breve Análise do Portátil Lenovo Yoga 520-14IKB (i5-7200U, SSD de 256 GB)
| SD Card Reader | |
| average JPG Copy Test (av. of 3 runs) | |
| HP Pavilion x360 14-ba011ng (Toshiba Exceria Pro SDXC 64 GB UHS-II) | |
| Lenovo Yoga 520-14IKB 80X80097GE (Toshiba Exceria Pro SDXC 64 GB UHS-II) | |
| Dell Inspiron 13 7359-4839 | |
| maximum AS SSD Seq Read Test (1GB) | |
| Lenovo Yoga 520-14IKB 80X80097GE (Toshiba Exceria Pro SDXC 64 GB UHS-II) | |
| HP Pavilion x360 14-ba011ng (Toshiba Exceria Pro SDXC 64 GB UHS-II) | |
| Dell Inspiron 13 7359-4839 | |
| Networking | |
| iperf3 transmit AX12 | |
| Asus Zenbook Flip UX360UAK-BB351T | |
| HP Pavilion x360 14-ba011ng | |
| Lenovo Yoga 520-14IKB 80X80097GE | |
| iperf3 receive AX12 | |
| Asus Zenbook Flip UX360UAK-BB351T | |
| HP Pavilion x360 14-ba011ng | |
| Lenovo Yoga 520-14IKB 80X80097GE | |
Cintilação da tela / PWM (modulação por largura de pulso)
| Tela tremeluzindo/PWM detectado | 347 Hz | ≤ 90 % configuração de brilho | 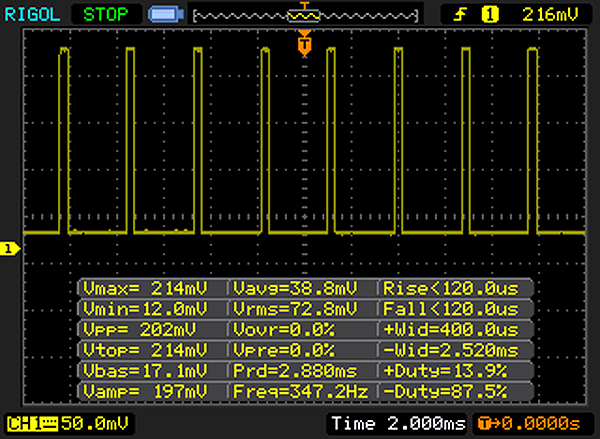 |
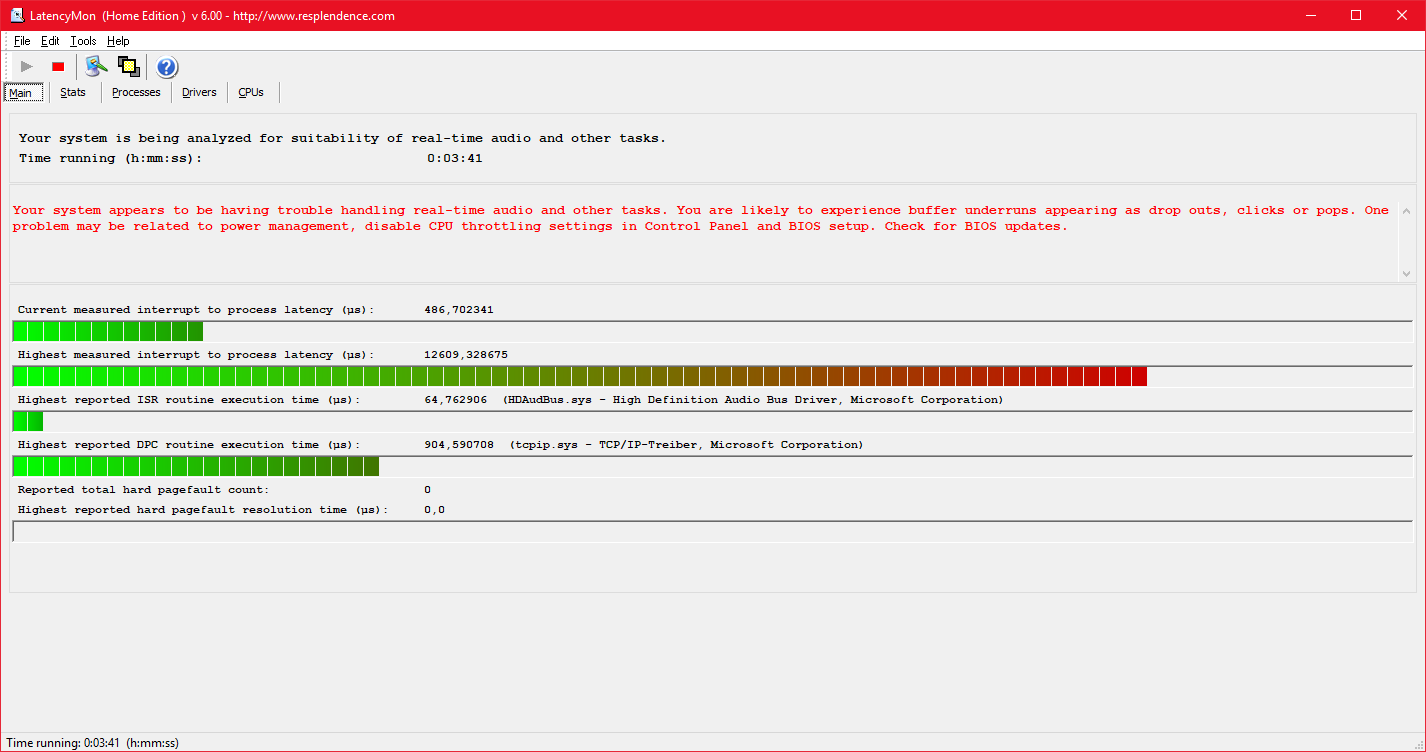
A luz de fundo da tela pisca em 347 Hz (pior caso, por exemplo, utilizando PWM) Cintilação detectada em uma configuração de brilho de 90 % e abaixo. Não deve haver cintilação ou PWM acima desta configuração de brilho. A frequência de 347 Hz é relativamente alta, portanto, a maioria dos usuários sensíveis ao PWM não deve notar nenhuma oscilação. No entanto, há relatos de que alguns usuários ainda são sensíveis ao PWM em 500 Hz e acima, portanto, esteja atento. [pwm_comparison] Em comparação: 52 % de todos os dispositivos testados não usam PWM para escurecer a tela. Se PWM foi detectado, uma média de 7754 (mínimo: 5 - máximo: 343500) Hz foi medida. | |||
| |||||||||||||||||||||||||
iluminação: 83 %
iluminação com acumulador: 255 cd/m²
Contraste: 1214:1 (Preto: 0.21 cd/m²)
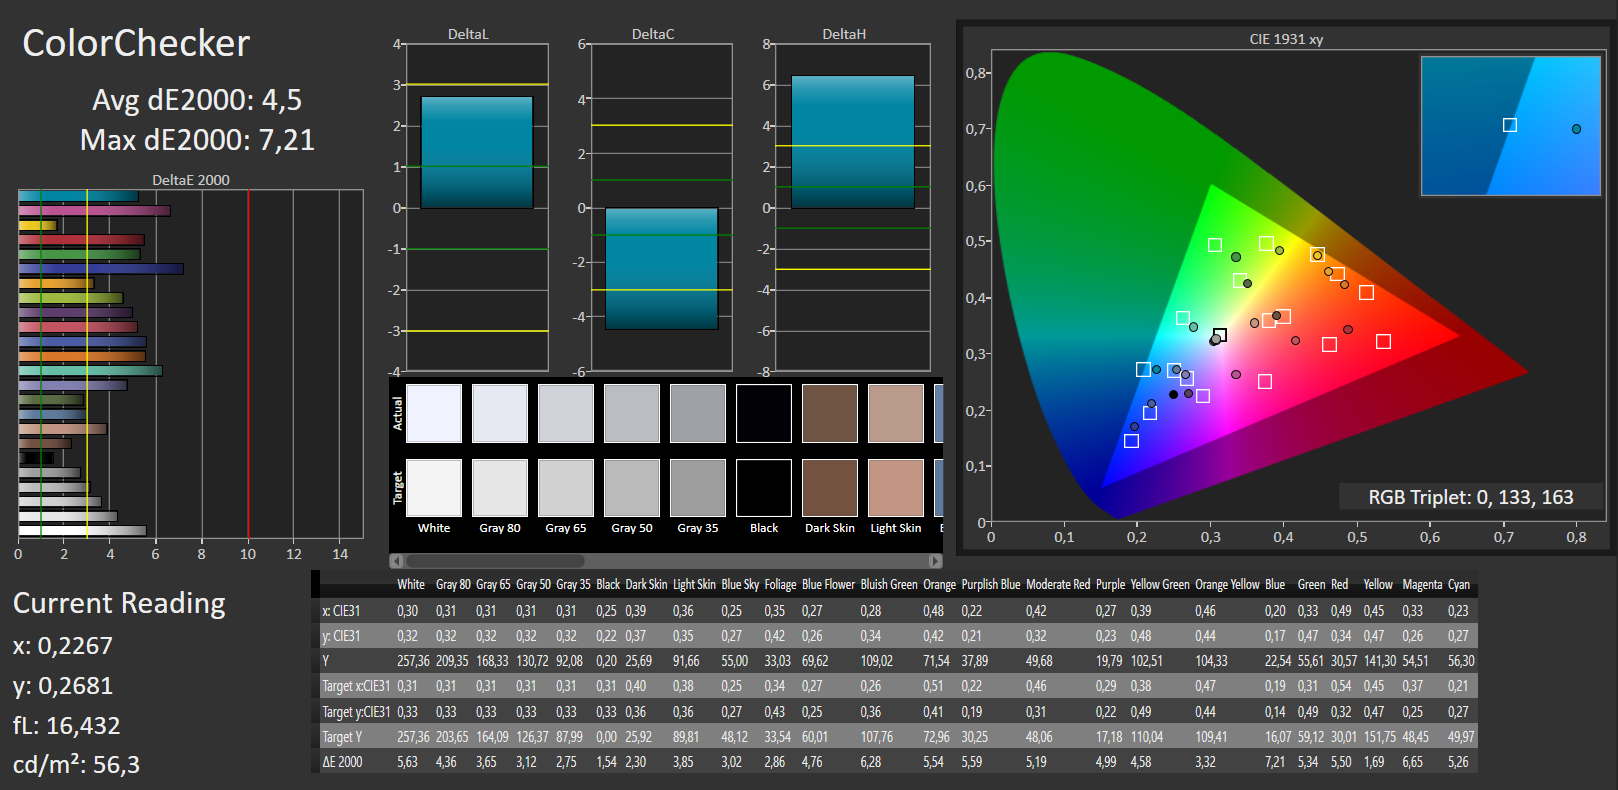
ΔE ColorChecker Calman: 4.5 | ∀{0.5-29.43 Ø4.71}
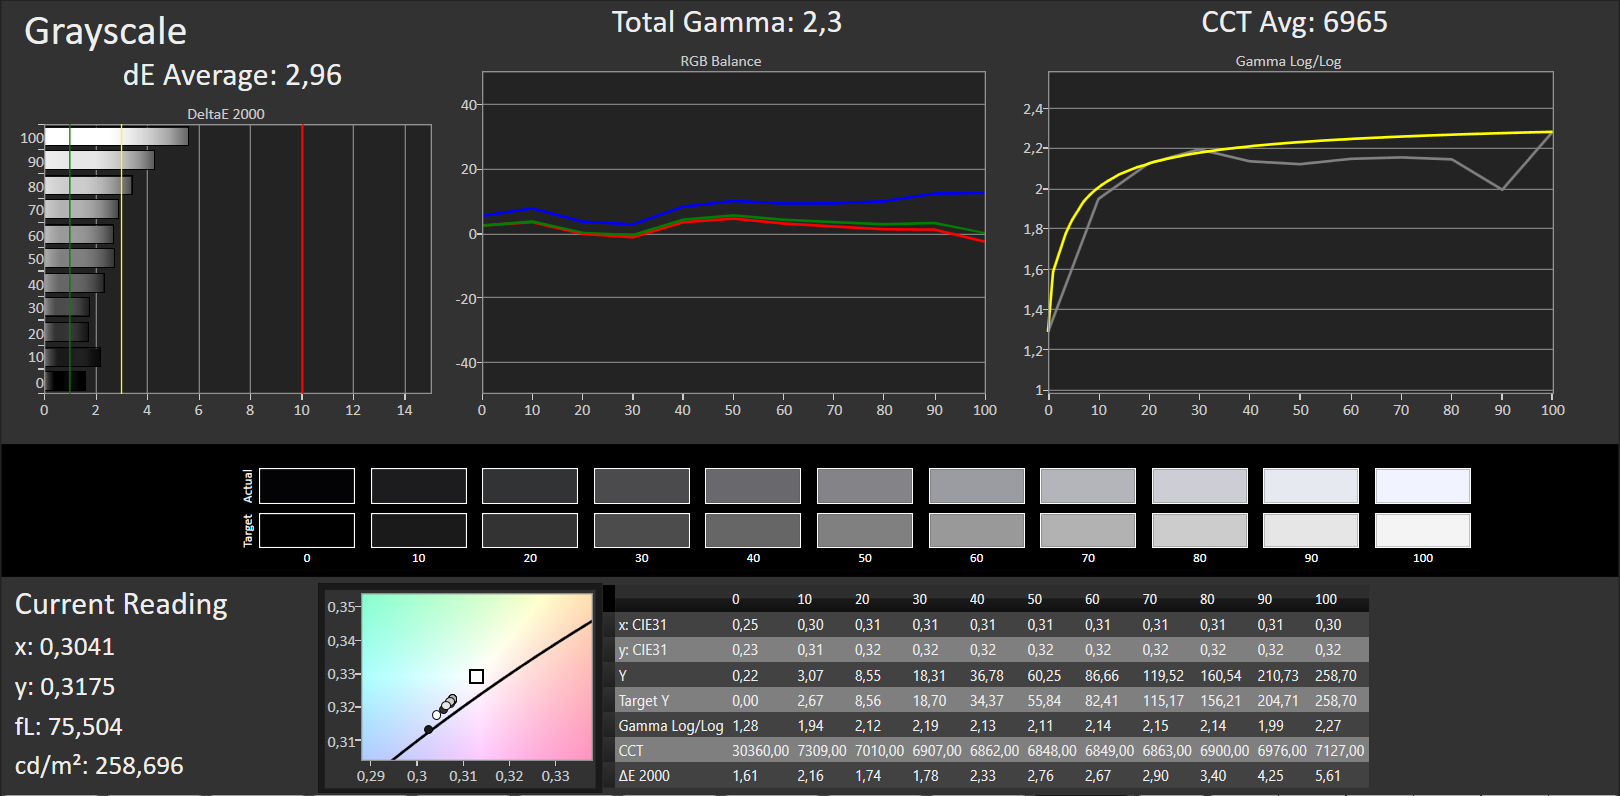
ΔE Greyscale Calman: 2.96 | ∀{0.09-98 Ø4.96}
59% sRGB (Argyll 1.6.3 3D)
38% AdobeRGB 1998 (Argyll 1.6.3 3D)
41.08% AdobeRGB 1998 (Argyll 3D)
59.3% sRGB (Argyll 3D)
39.76% Display P3 (Argyll 3D)
Gamma: 2.3
CCT: 6965 K
| Lenovo Yoga 520-14IKB 80X80097GE BOE NV140FHM-N49, , 1920x1080, 14" | Lenovo Yoga 510-14IKB BOE0637 / BOE DT NV140FHM-N41, , 1920x1080, 14" | Dell Inspiron 13 7359-4839 Samsung SDC864D / 133HL [Dell P/N: PVFF5], , 1920x1080, 13.3" | HP Pavilion x360 14-ba011ng Chi Mei, , 1920x1080, 14" | Acer Spin 5 SP513-51 B133HAB01.0, , 1920x1080, 13.3" | Asus Zenbook Flip UX360UAK-BB351T AU Optronics B133HAN02.7, , 1920x1080, 13.3" | |
|---|---|---|---|---|---|---|
| Display | 5% | 1% | 5% | 1% | 58% | |
| Display P3 Coverage (%) | 39.76 | 41.78 5% | 40.31 1% | 41.82 5% | 39.99 1% | 64.1 61% |
| sRGB Coverage (%) | 59.3 | 62.9 6% | 60.5 2% | 61.6 4% | 59.5 0% | 91.8 55% |
| AdobeRGB 1998 Coverage (%) | 41.08 | 43.17 5% | 41.65 1% | 43.33 5% | 41.32 1% | 65.2 59% |
| Response Times | -14% | 17% | 24% | 1% | 22% | |
| Response Time Grey 50% / Grey 80% * (ms) | 47 ? | 53 ? -13% | 38 ? 19% | 41 ? 13% | 56 ? -19% | 36 ? 23% |
| Response Time Black / White * (ms) | 34 ? | 39 ? -15% | 29 ? 15% | 22 ? 35% | 27 ? 21% | 27 ? 21% |
| PWM Frequency (Hz) | 347 ? | 350 ? | 25000 ? | 50 ? | ||
| Screen | -19% | -43% | -35% | -6% | 4% | |
| Brightness middle (cd/m²) | 255 | 243 -5% | 253 -1% | 252 -1% | 245 -4% | 368 44% |
| Brightness (cd/m²) | 247 | 248 0% | 232 -6% | 237 -4% | 233 -6% | 350 42% |
| Brightness Distribution (%) | 83 | 91 10% | 83 0% | 90 8% | 87 5% | 87 5% |
| Black Level * (cd/m²) | 0.21 | 0.32 -52% | 0.28 -33% | 0.21 -0% | 0.21 -0% | 0.29 -38% |
| Contrast (:1) | 1214 | 759 -37% | 904 -26% | 1200 -1% | 1167 -4% | 1269 5% |
| Colorchecker dE 2000 * | 4.5 | 5.44 -21% | 6.36 -41% | 7.29 -62% | 4.2 7% | 5.26 -17% |
| Colorchecker dE 2000 max. * | 7.21 | 9.73 -35% | 12.72 -76% | 17.55 -143% | 8.75 -21% | 8.78 -22% |
| Greyscale dE 2000 * | 2.96 | 4.74 -60% | 10.26 -247% | 7.48 -153% | 3.94 -33% | 5.87 -98% |
| Gamma | 2.3 96% | 2.38 92% | 2.28 96% | 2.45 90% | 2.66 83% | 2.42 91% |
| CCT | 6965 93% | 7799 83% | 6500 100% | 6953 93% | 6096 107% | 6998 93% |
| Color Space (Percent of AdobeRGB 1998) (%) | 38 | 39.6 4% | 38 0% | 40 5% | 38 0% | 60 58% |
| Color Space (Percent of sRGB) (%) | 59 | 62.5 6% | 60 2% | 61 3% | 59 0% | 92 56% |
| Média Total (Programa/Configurações) | -9% /
-13% | -8% /
-26% | -2% /
-19% | -1% /
-3% | 28% /
17% |
* ... menor é melhor
Exibir tempos de resposta
| ↔ Tempo de resposta preto para branco | ||
|---|---|---|
| 34 ms ... ascensão ↗ e queda ↘ combinadas | ↗ 20 ms ascensão | 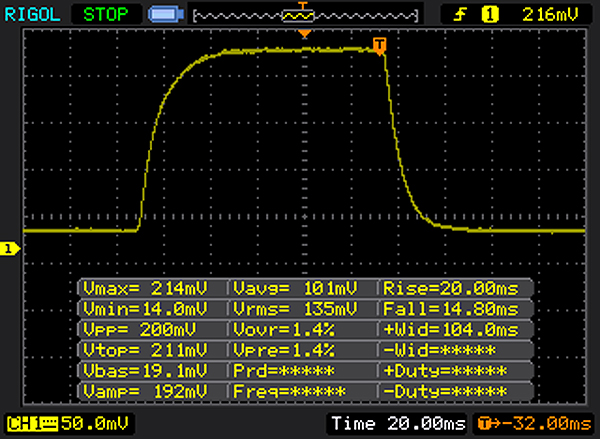 |
| ↘ 14 ms queda | ||
| A tela mostra taxas de resposta lentas em nossos testes e será insatisfatória para os jogadores. Em comparação, todos os dispositivos testados variam de 0.1 (mínimo) a 240 (máximo) ms. » 91 % de todos os dispositivos são melhores. Isso significa que o tempo de resposta medido é pior que a média de todos os dispositivos testados (19.8 ms). | ||
| ↔ Tempo de resposta 50% cinza a 80% cinza | ||
| 47 ms ... ascensão ↗ e queda ↘ combinadas | ↗ 24 ms ascensão | 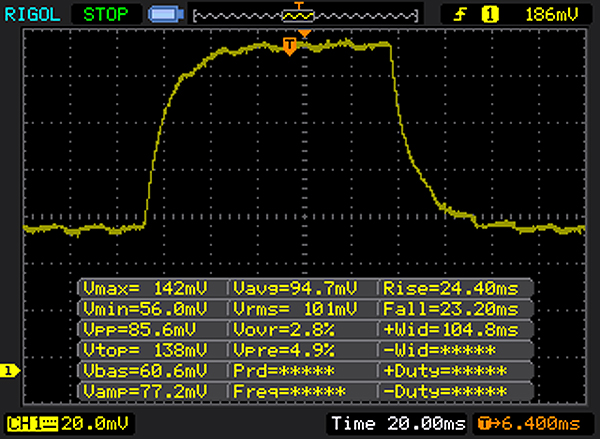 |
| ↘ 23 ms queda | ||
| A tela mostra taxas de resposta lentas em nossos testes e será insatisfatória para os jogadores. Em comparação, todos os dispositivos testados variam de 0.165 (mínimo) a 636 (máximo) ms. » 81 % de todos os dispositivos são melhores. Isso significa que o tempo de resposta medido é pior que a média de todos os dispositivos testados (31 ms). | ||
| Cinebench R15 | |
| CPU Single 64Bit | |
| Lenovo Yoga 920-13IKB-80Y7 | |
| Lenovo Yoga 510-14IKB | |
| HP Pavilion x360 14-ba011ng | |
| Asus Zenbook Flip UX360UAK-BB351T | |
| Lenovo Yoga 520-14IKB 80X80097GE | |
| Dell Inspiron 13 7359-4839 | |
| Acer Spin 5 SP513-51 | |
| CPU Multi 64Bit | |
| Lenovo Yoga 920-13IKB-80Y7 | |
| HP Pavilion x360 14-ba011ng | |
| Lenovo Yoga 510-14IKB | |
| Asus Zenbook Flip UX360UAK-BB351T | |
| Dell Inspiron 13 7359-4839 | |
| Lenovo Yoga 520-14IKB 80X80097GE | |
| Acer Spin 5 SP513-51 | |
| PCMark 8 | |
| Home Score Accelerated v2 | |
| Asus Zenbook Flip UX360UAK-BB351T | |
| Lenovo Yoga 510-14IKB | |
| Lenovo Yoga 520-14IKB 80X80097GE | |
| HP Pavilion x360 14-ba011ng | |
| Dell Inspiron 13 7359-4839 | |
| Acer Spin 5 SP513-51 | |
| Work Score Accelerated v2 | |
| Lenovo Yoga 520-14IKB 80X80097GE | |
| Dell Inspiron 13 7359-4839 | |
| Acer Spin 5 SP513-51 | |
| PCMark 8 Home Score Accelerated v2 | 3455 pontos | |
| PCMark 8 Work Score Accelerated v2 | 4556 pontos | |
| PCMark 10 Score | 3329 pontos | |
Ajuda | ||
| Lenovo Yoga 520-14IKB 80X80097GE Intel SSD 600p SSDPEKKW256G7 | Dell Inspiron 13 7359-4839 Liteonit LCH-256V2S | HP Pavilion x360 14-ba011ng Samsung CM871a MZNTY128HDHP | Asus Zenbook Flip UX360UAK-BB351T Micron SSD 1100 (MTFDDAV256TBN) | Lenovo Yoga 510-14IKB Samsung MZYTY256HDHP | |
|---|---|---|---|---|---|
| CrystalDiskMark 3.0 | -37% | -33% | -40% | -24% | |
| Read Seq (MB/s) | 1171 | 486.3 -58% | 519 -56% | 478.4 -59% | 518 -56% |
| Write Seq (MB/s) | 605 | 283.7 -53% | 328.2 -46% | 419.9 -31% | 476.5 -21% |
| Read 512 (MB/s) | 720 | 337.5 -53% | 408.1 -43% | 351.7 -51% | 408 -43% |
| Write 512 (MB/s) | 472.8 | 283.5 -40% | 170.2 -64% | 294.2 -38% | 274.5 -42% |
| Read 4k (MB/s) | 35.92 | 26.75 -26% | 35.29 -2% | 24 -33% | 35.66 -1% |
| Write 4k (MB/s) | 132.5 | 85.3 -36% | 95.5 -28% | 87 -34% | 106.7 -19% |
| Read 4k QD32 (MB/s) | 290.1 | 309.7 7% | 398.4 37% | 199.3 -31% | 368.7 27% |
| Write 4k QD32 (MB/s) | 389.6 | 250.8 -36% | 161.2 -59% | 232.4 -40% | 246.3 -37% |

| 3DMark 11 - 1280x720 Performance GPU | |
| HP Pavilion x360 14-ba011ng | |
| Lenovo Yoga 510-14IKB | |
| Asus Zenbook Flip UX360UAK-BB351T | |
| Lenovo Yoga 520-14IKB 80X80097GE | |
| Dell Inspiron 13 7359-4839 | |
| Acer Spin 5 SP513-51 | |
| 3DMark | |
| 1280x720 Cloud Gate Standard Graphics | |
| Lenovo Yoga 520-14IKB 80X80097GE | |
| Acer Spin 5 SP513-51 | |
| Dell Inspiron 13 7359-4839 | |
| Lenovo Yoga 510-14IKB | |
| 1920x1080 Fire Strike Graphics | |
| Lenovo Yoga 510-14IKB | |
| Lenovo Yoga 520-14IKB 80X80097GE | |
| Acer Spin 5 SP513-51 | |
| 3DMark 11 Performance | 1518 pontos | |
| 3DMark Cloud Gate Standard Score | 4933 pontos | |
| 3DMark Fire Strike Score | 722 pontos | |
Ajuda | ||
| baixo | média | alto | ultra | |
|---|---|---|---|---|
| BioShock Infinite (2013) | 38.97 | 23 | 19.02 | |
| Company of Heroes 2 (2013) | 17.33 | |||
| Rise of the Tomb Raider (2016) | 16.73 |
Barulho
| Ocioso |
| 30.3 / 30.3 / 30.3 dB |
| Carga |
| 37.2 / 35.2 dB |
 | ||
30 dB silencioso 40 dB(A) audível 50 dB(A) ruidosamente alto |
||
min: | ||
(+) A temperatura máxima no lado superior é 35 °C / 95 F, em comparação com a média de 35.4 °C / 96 F , variando de 19.6 a 60 °C para a classe Convertible.
(+) A parte inferior aquece até um máximo de 29.6 °C / 85 F, em comparação com a média de 36.9 °C / 98 F
(+) Em uso inativo, a temperatura média para o lado superior é 26.4 °C / 80 F, em comparação com a média do dispositivo de 30.3 °C / ### class_avg_f### F.
(+) Os apoios para as mãos e o touchpad são mais frios que a temperatura da pele, com um máximo de 26.2 °C / 79.2 F e, portanto, são frios ao toque.
(±) A temperatura média da área do apoio para as mãos de dispositivos semelhantes foi 28 °C / 82.4 F (+1.8 °C / 3.2 F).
Lenovo Yoga 520-14IKB 80X80097GE análise de áudio
(-) | alto-falantes não muito altos (###valor### dB)
Graves 100 - 315Hz
(-) | quase nenhum baixo - em média 16.4% menor que a mediana
(±) | a linearidade dos graves é média (13.9% delta para a frequência anterior)
Médios 400 - 2.000 Hz
(+) | médios equilibrados - apenas 3.6% longe da mediana
(±) | a linearidade dos médios é média (9.2% delta para frequência anterior)
Altos 2 - 16 kHz
(+) | agudos equilibrados - apenas 2.2% longe da mediana
(+) | os máximos são lineares (4.5% delta da frequência anterior)
Geral 100 - 16.000 Hz
(±) | a linearidade do som geral é média (18.7% diferença em relação à mediana)
Comparado com a mesma classe
» 43% de todos os dispositivos testados nesta classe foram melhores, 7% semelhantes, 50% piores
» O melhor teve um delta de 6%, a média foi 20%, o pior foi 57%
Comparado com todos os dispositivos testados
» 43% de todos os dispositivos testados foram melhores, 8% semelhantes, 49% piores
» O melhor teve um delta de 4%, a média foi 23%, o pior foi 134%
HP Pavilion x360 14-ba011ng análise de áudio
(-) | alto-falantes não muito altos (###valor### dB)
Graves 100 - 315Hz
(±) | graves reduzidos - em média 13% menor que a mediana
(+) | o baixo é linear (6.8% delta para a frequência anterior)
Médios 400 - 2.000 Hz
(+) | médios equilibrados - apenas 2.1% longe da mediana
(+) | médios são lineares (4.2% delta para frequência anterior)
Altos 2 - 16 kHz
(+) | agudos equilibrados - apenas 1.8% longe da mediana
(+) | os máximos são lineares (2.9% delta da frequência anterior)
Geral 100 - 16.000 Hz
(+) | o som geral é linear (13.4% diferença em relação à mediana)
Comparado com a mesma classe
» 17% de todos os dispositivos testados nesta classe foram melhores, 4% semelhantes, 79% piores
» O melhor teve um delta de 6%, a média foi 20%, o pior foi 57%
Comparado com todos os dispositivos testados
» 14% de todos os dispositivos testados foram melhores, 4% semelhantes, 82% piores
» O melhor teve um delta de 4%, a média foi 23%, o pior foi 134%
| desligado | |
| Ocioso | |
| Carga |
|
Key:
min: | |
| Lenovo Yoga 520-14IKB 80X80097GE i5-7200U, HD Graphics 620, Intel SSD 600p SSDPEKKW256G7, IPS LED, 1920x1080, 14" | Dell Inspiron 13 7359-4839 6500U, HD Graphics 520, Liteonit LCH-256V2S, IPS, 1920x1080, 13.3" | HP Pavilion x360 14-ba011ng i5-7200U, GeForce 940MX, Samsung CM871a MZNTY128HDHP, IPS, 1920x1080, 14" | Acer Spin 5 SP513-51 6100U, HD Graphics 520, Hynix HFS128G39TND, IPS LED, 1920x1080, 13.3" | Asus Zenbook Flip UX360UAK-BB351T i5-7200U, HD Graphics 620, Micron SSD 1100 (MTFDDAV256TBN), IPS, 1920x1080, 13.3" | Lenovo Yoga 510-14IKB i5-7200U, Radeon R5 M430, Samsung MZYTY256HDHP, IPS, 1920x1080, 14" | |
|---|---|---|---|---|---|---|
| Power Consumption | 0% | -47% | 0% | -14% | -29% | |
| Idle Minimum * (Watt) | 3.5 | 4 -14% | 4.2 -20% | 4.1 -17% | 4.2 -20% | 3.9 -11% |
| Idle Average * (Watt) | 6.2 | 4.8 23% | 7.2 -16% | 6.8 -10% | 7.4 -19% | 7.1 -15% |
| Idle Maximum * (Watt) | 7.4 | 7.6 -3% | 9.8 -32% | 7.9 -7% | 8.6 -16% | 7.7 -4% |
| Load Average * (Watt) | 32.2 | 30 7% | 44 -37% | 20.4 37% | 32 1% | 33.4 -4% |
| Load Maximum * (Watt) | 26.4 | 29.3 -11% | 61 -131% | 26.8 -2% | 30.2 -14% | 55.9 -112% |
* ... menor é melhor
| Lenovo Yoga 520-14IKB 80X80097GE i5-7200U, HD Graphics 620, 53 Wh | Dell Inspiron 13 7359-4839 6500U, HD Graphics 520, 44 Wh | HP Pavilion x360 14-ba011ng i5-7200U, GeForce 940MX, 41.5 Wh | Acer Spin 5 SP513-51 6100U, HD Graphics 520, 45 Wh | Asus Zenbook Flip UX360UAK-BB351T i5-7200U, HD Graphics 620, 57 Wh | Lenovo Yoga 510-14IKB i5-7200U, Radeon R5 M430, 35 Wh | |
|---|---|---|---|---|---|---|
| Duração da bateria | -13% | -25% | -16% | 41% | -28% | |
| Reader / Idle (h) | 14.8 | 14.8 0% | 12.5 -16% | 12 -19% | ||
| H.264 (h) | 10 | |||||
| WiFi v1.3 (h) | 8.3 | 8.1 -2% | 6.2 -25% | 7.7 -7% | 11.7 41% | 6.2 -25% |
| Load (h) | 2.9 | 1.8 -38% | 2.2 -24% | 1.7 -41% |
Pro
Contra
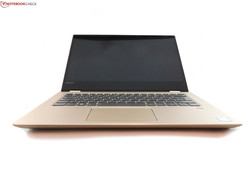
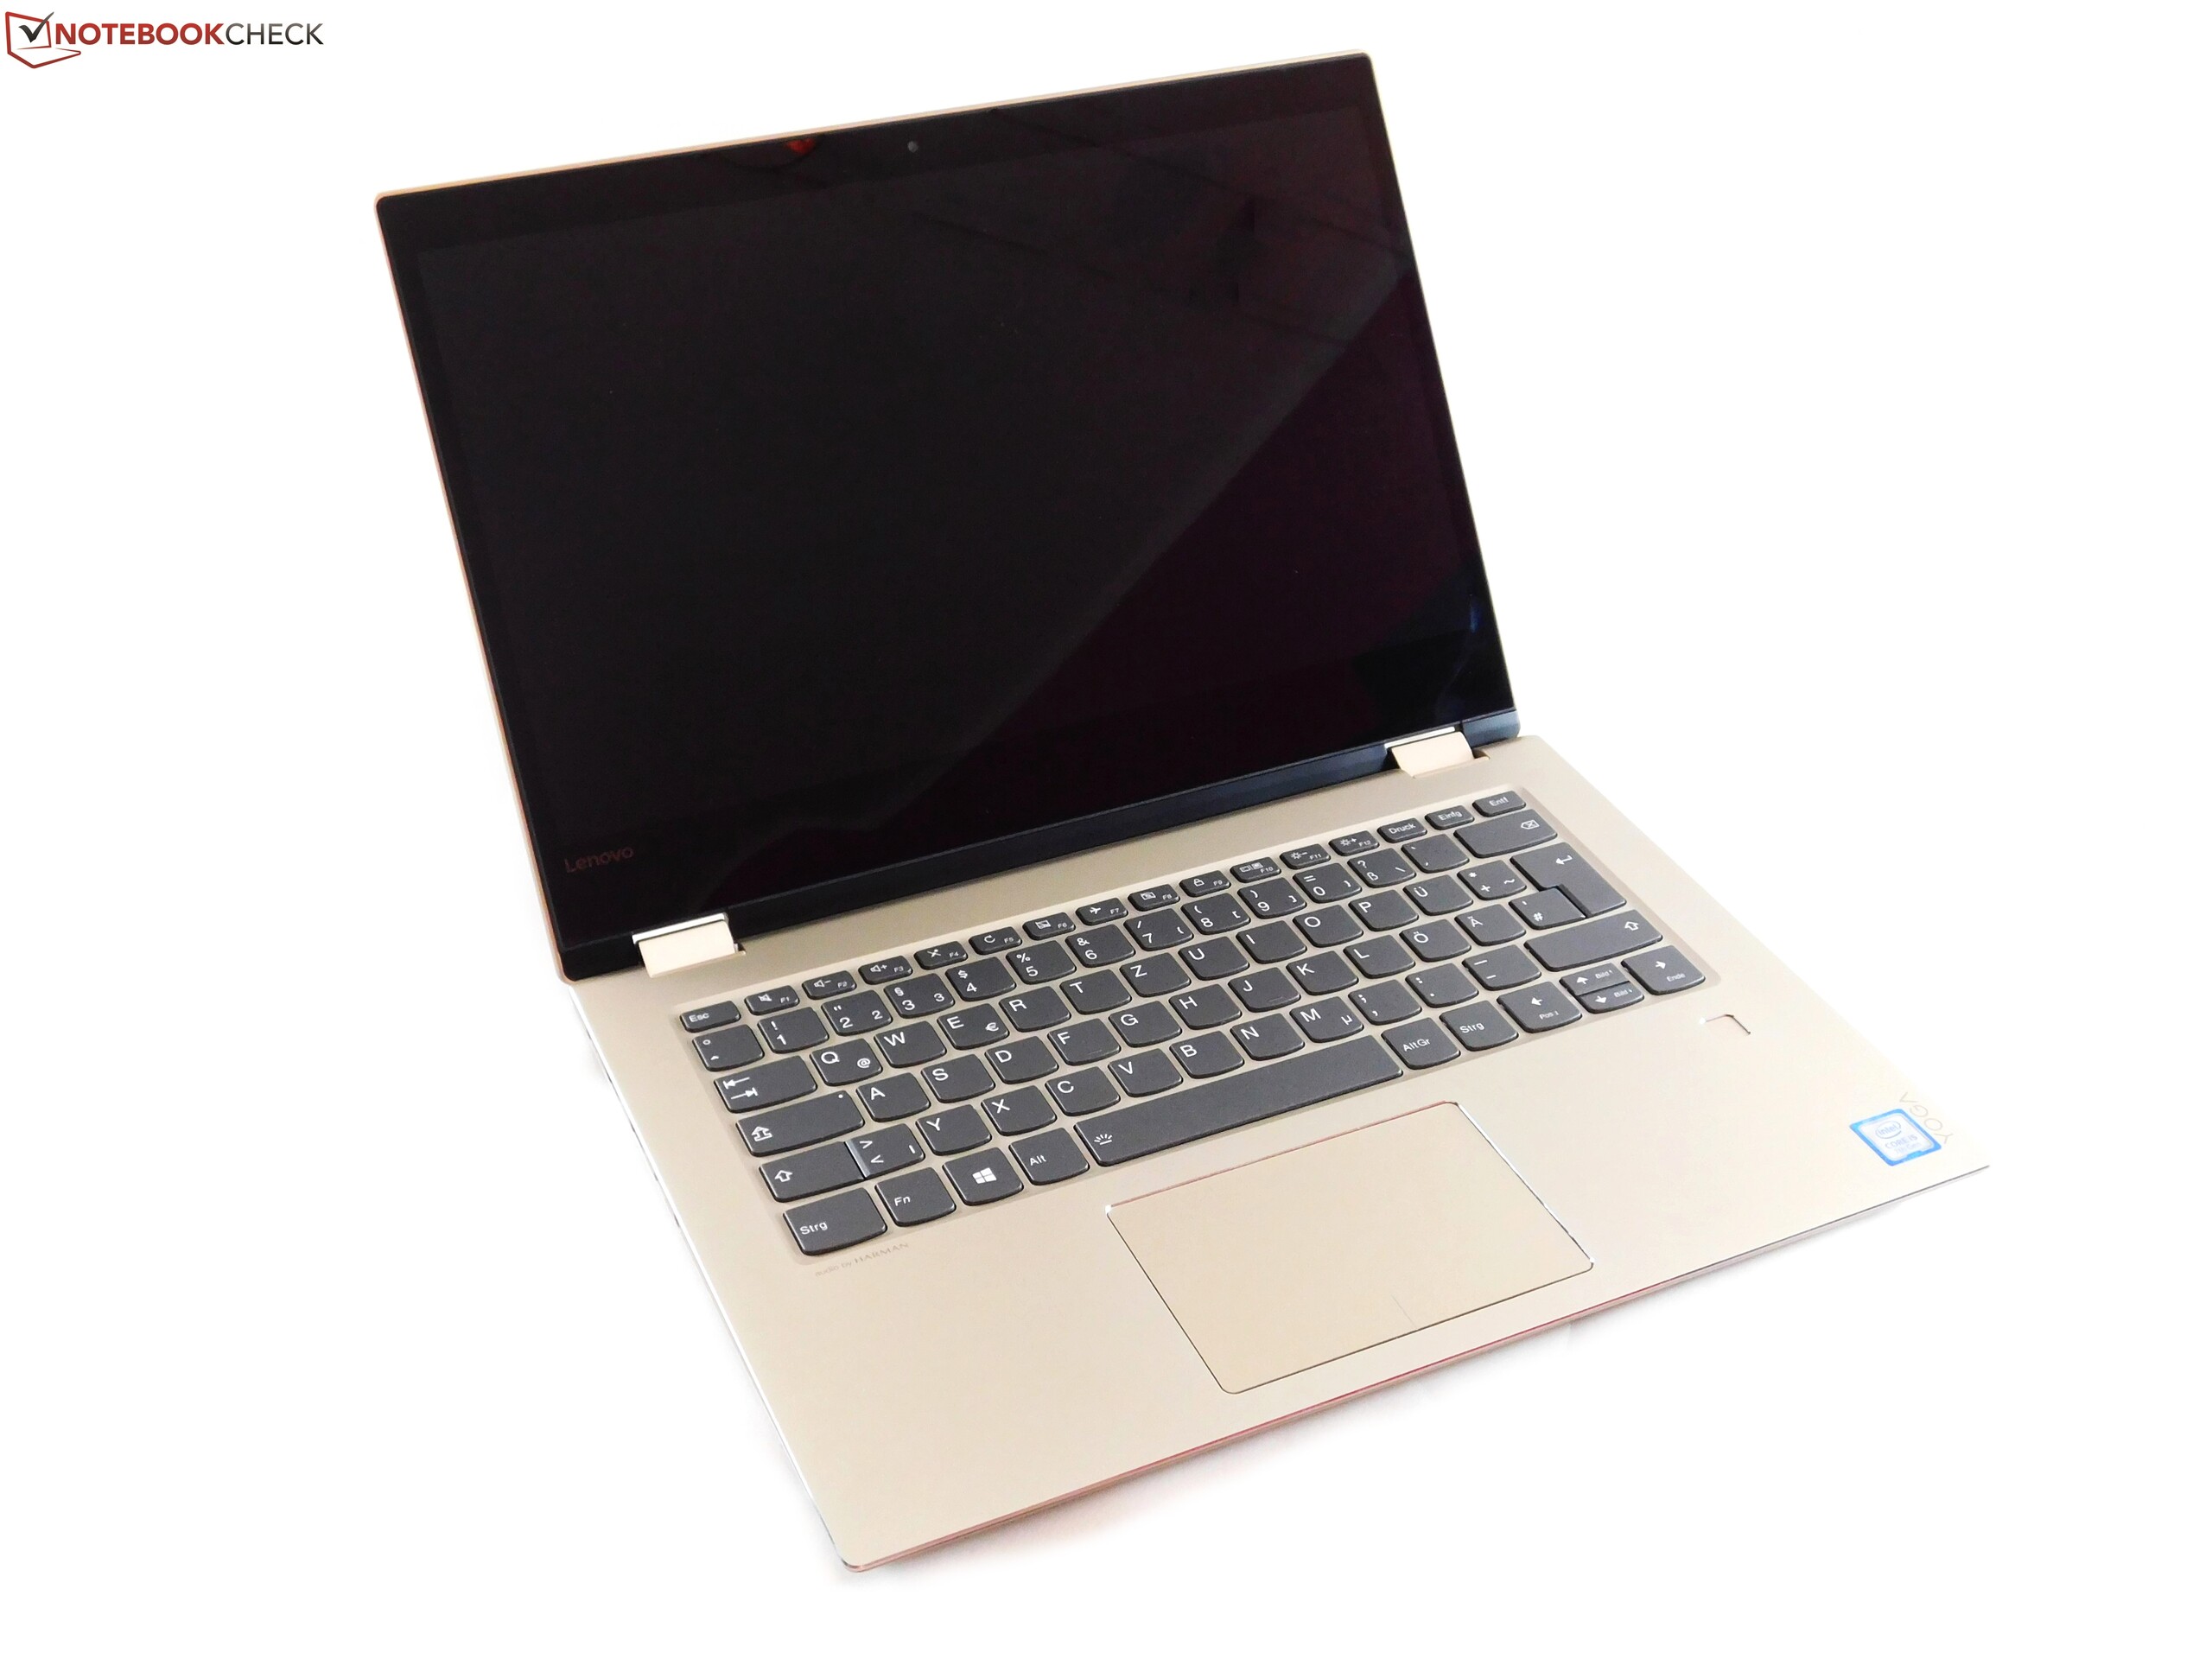
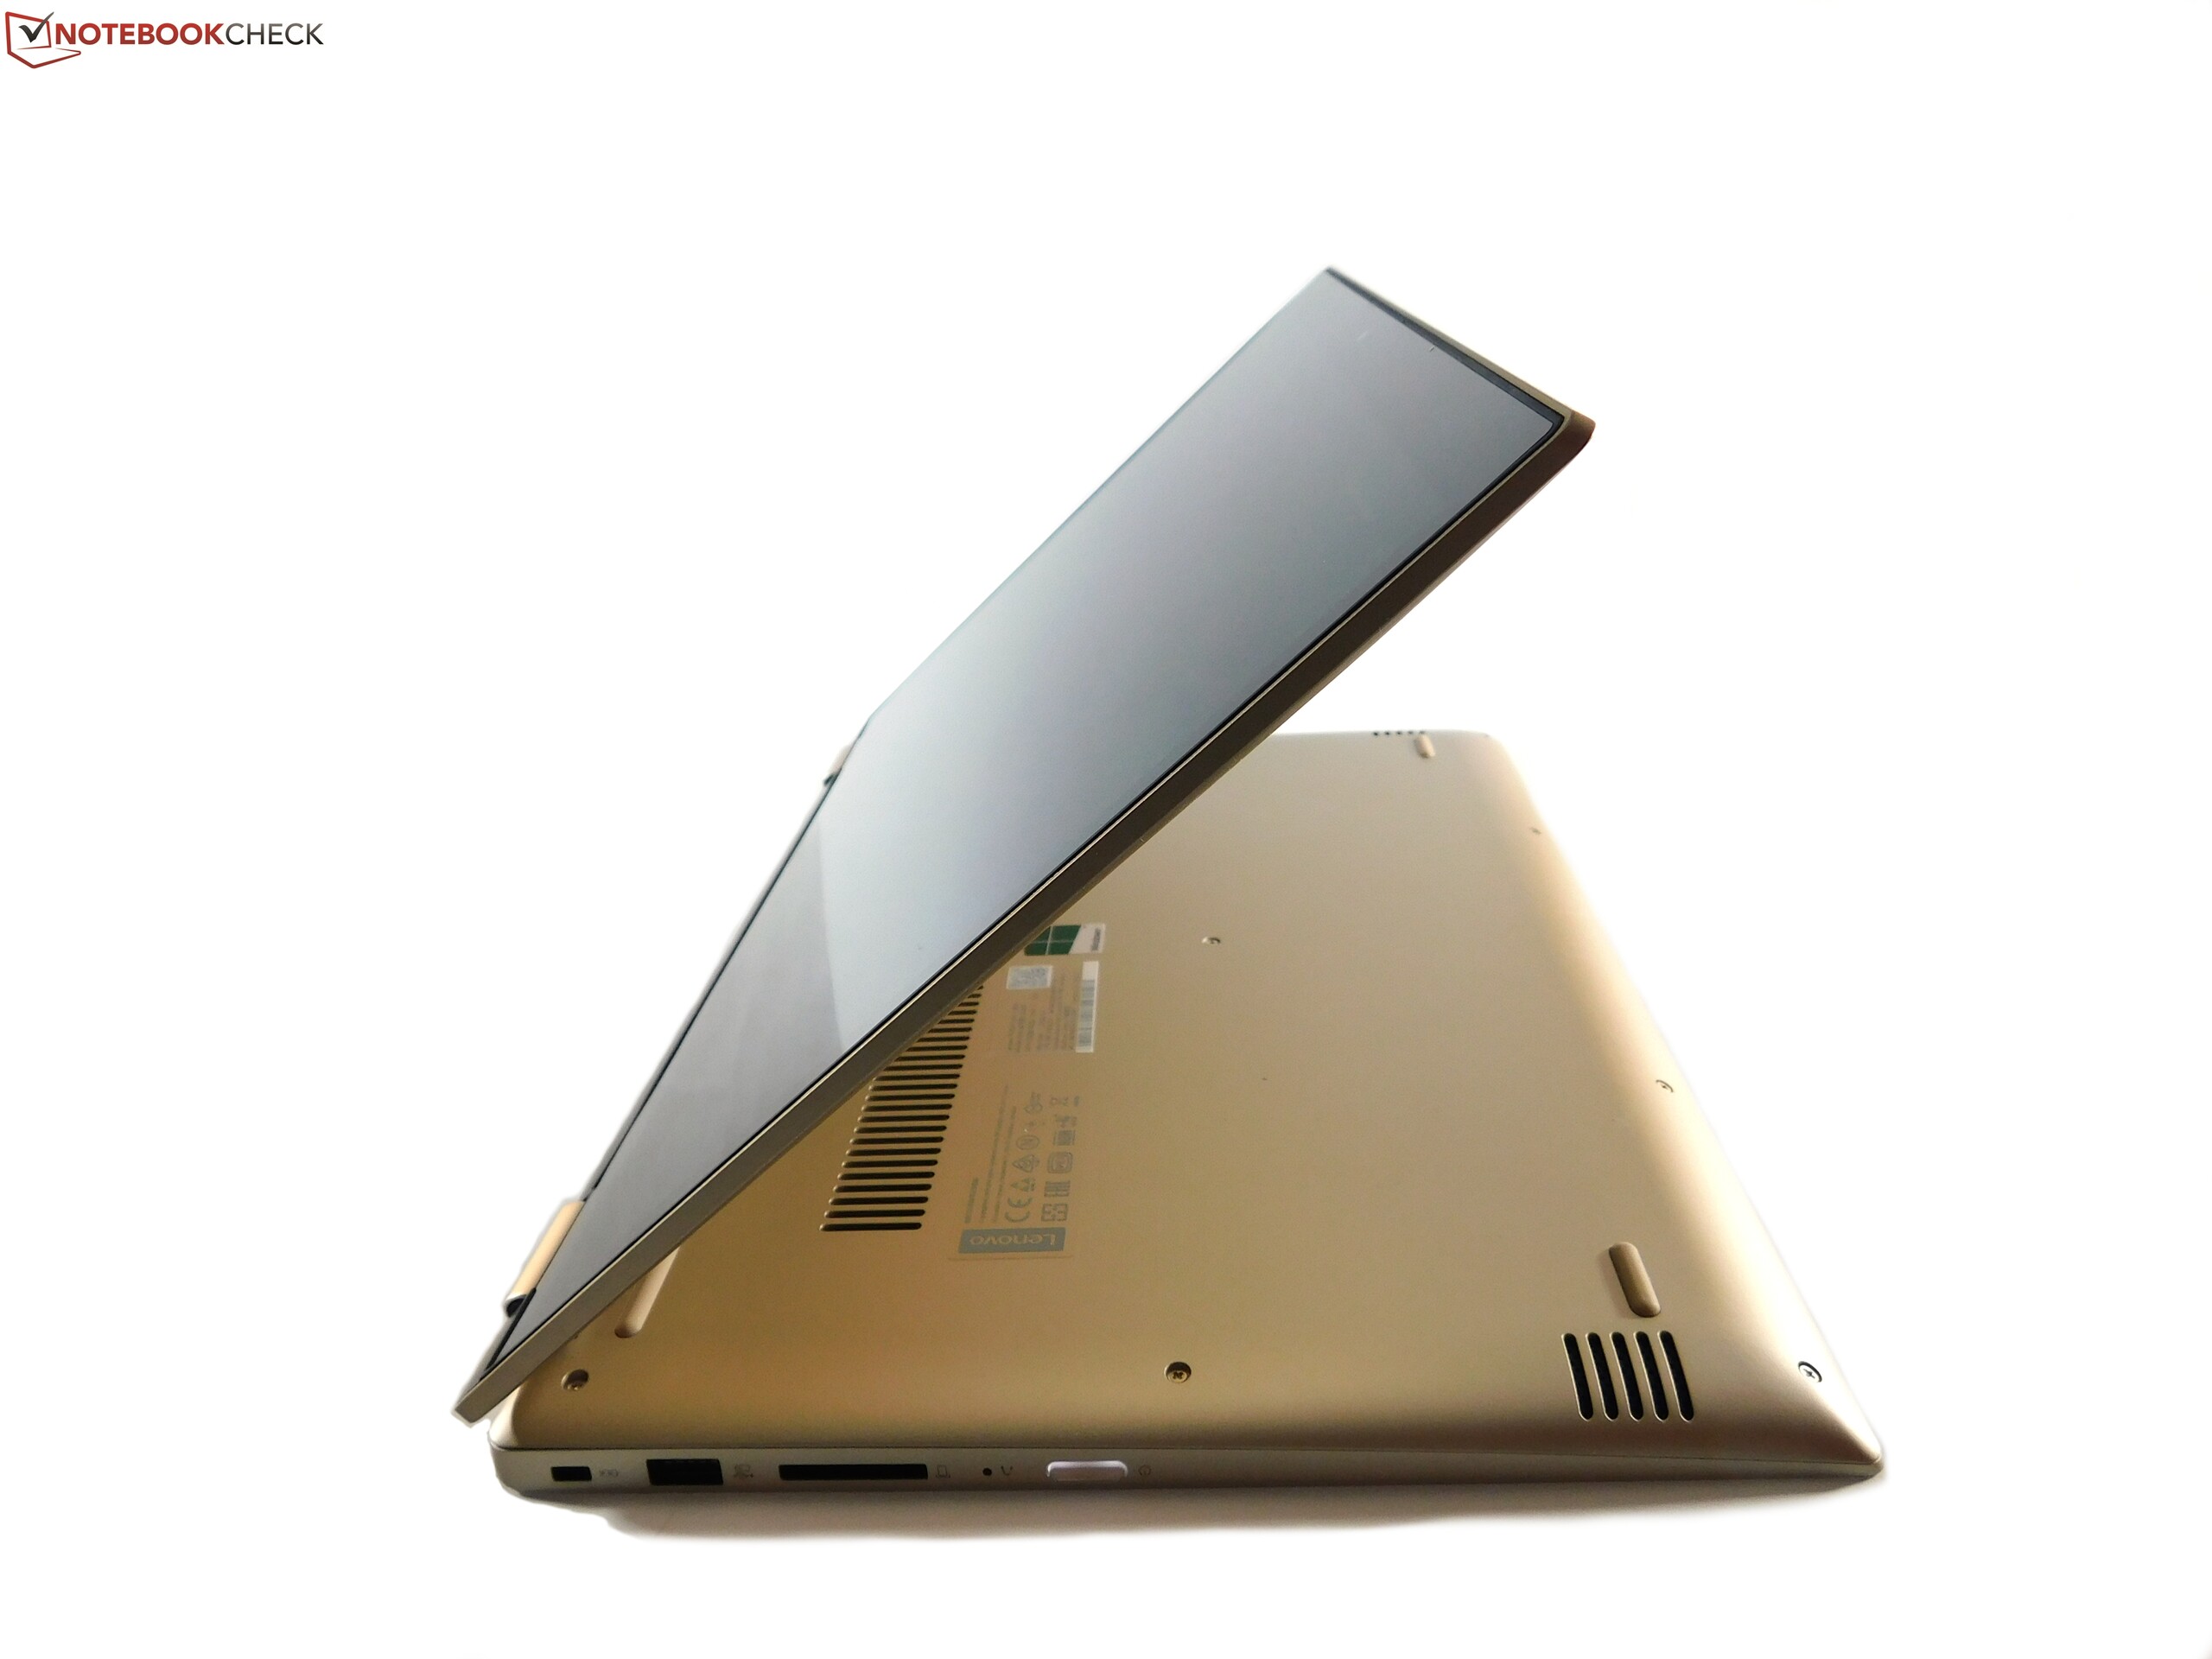
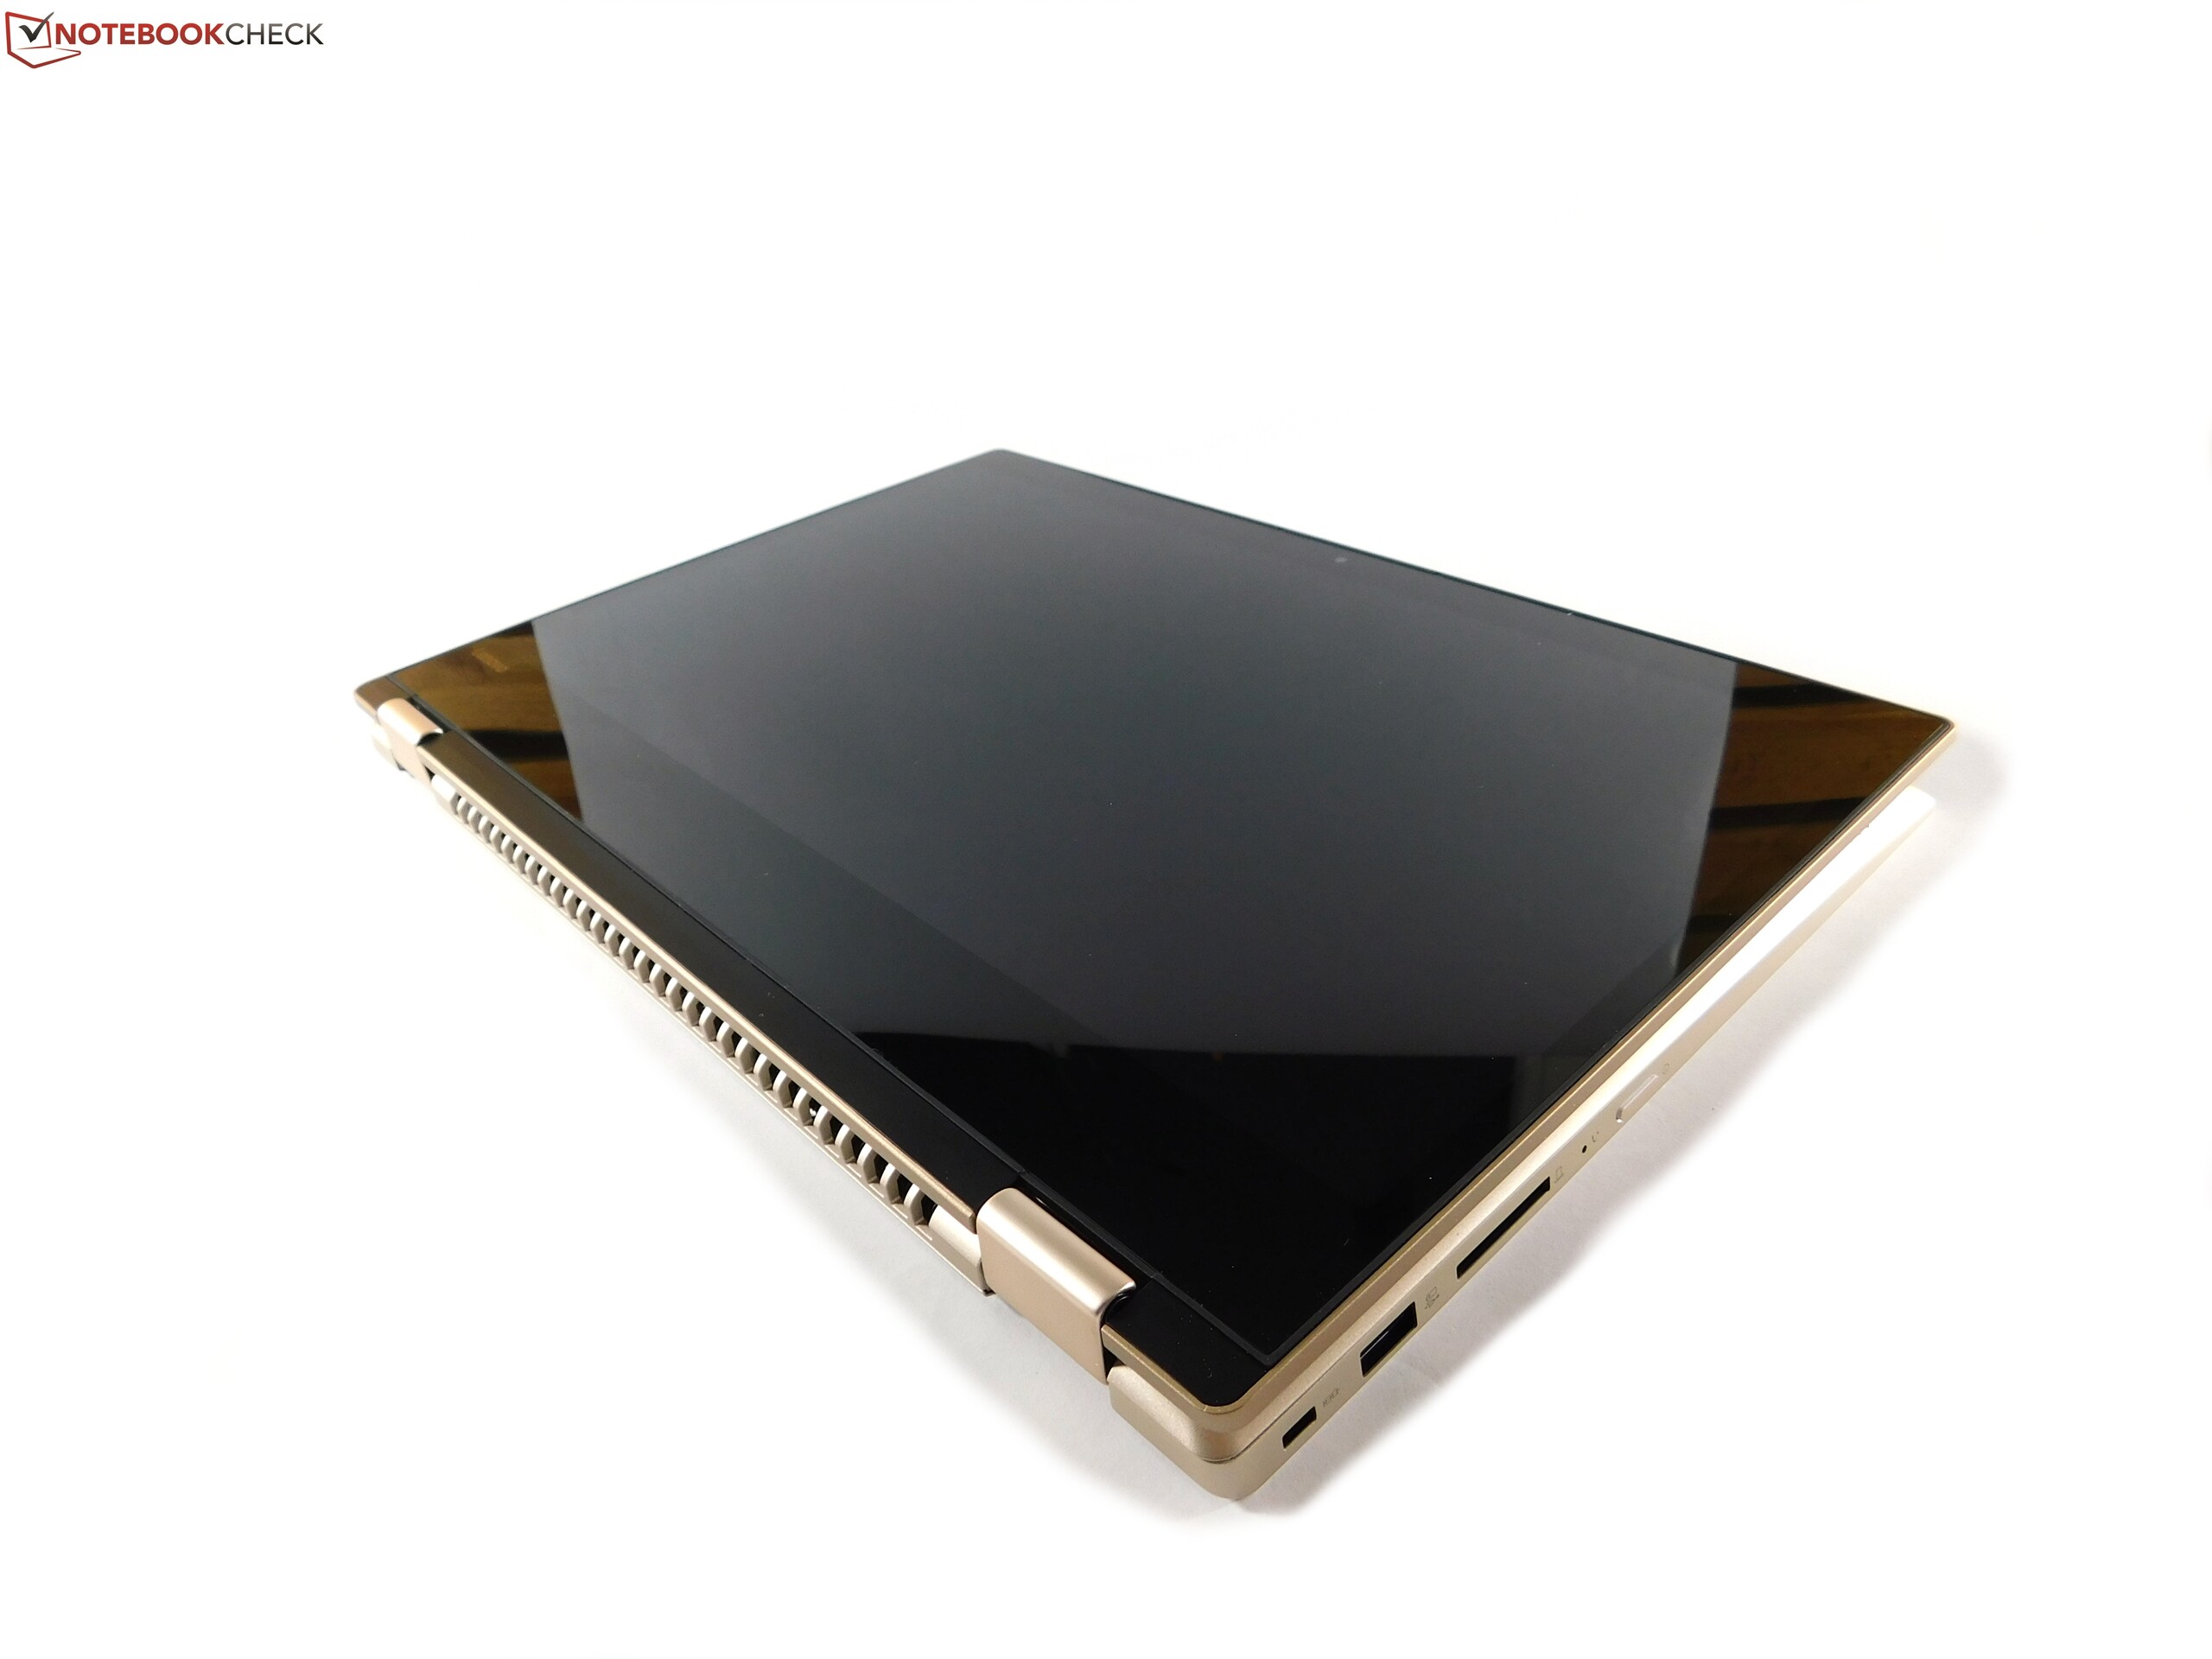
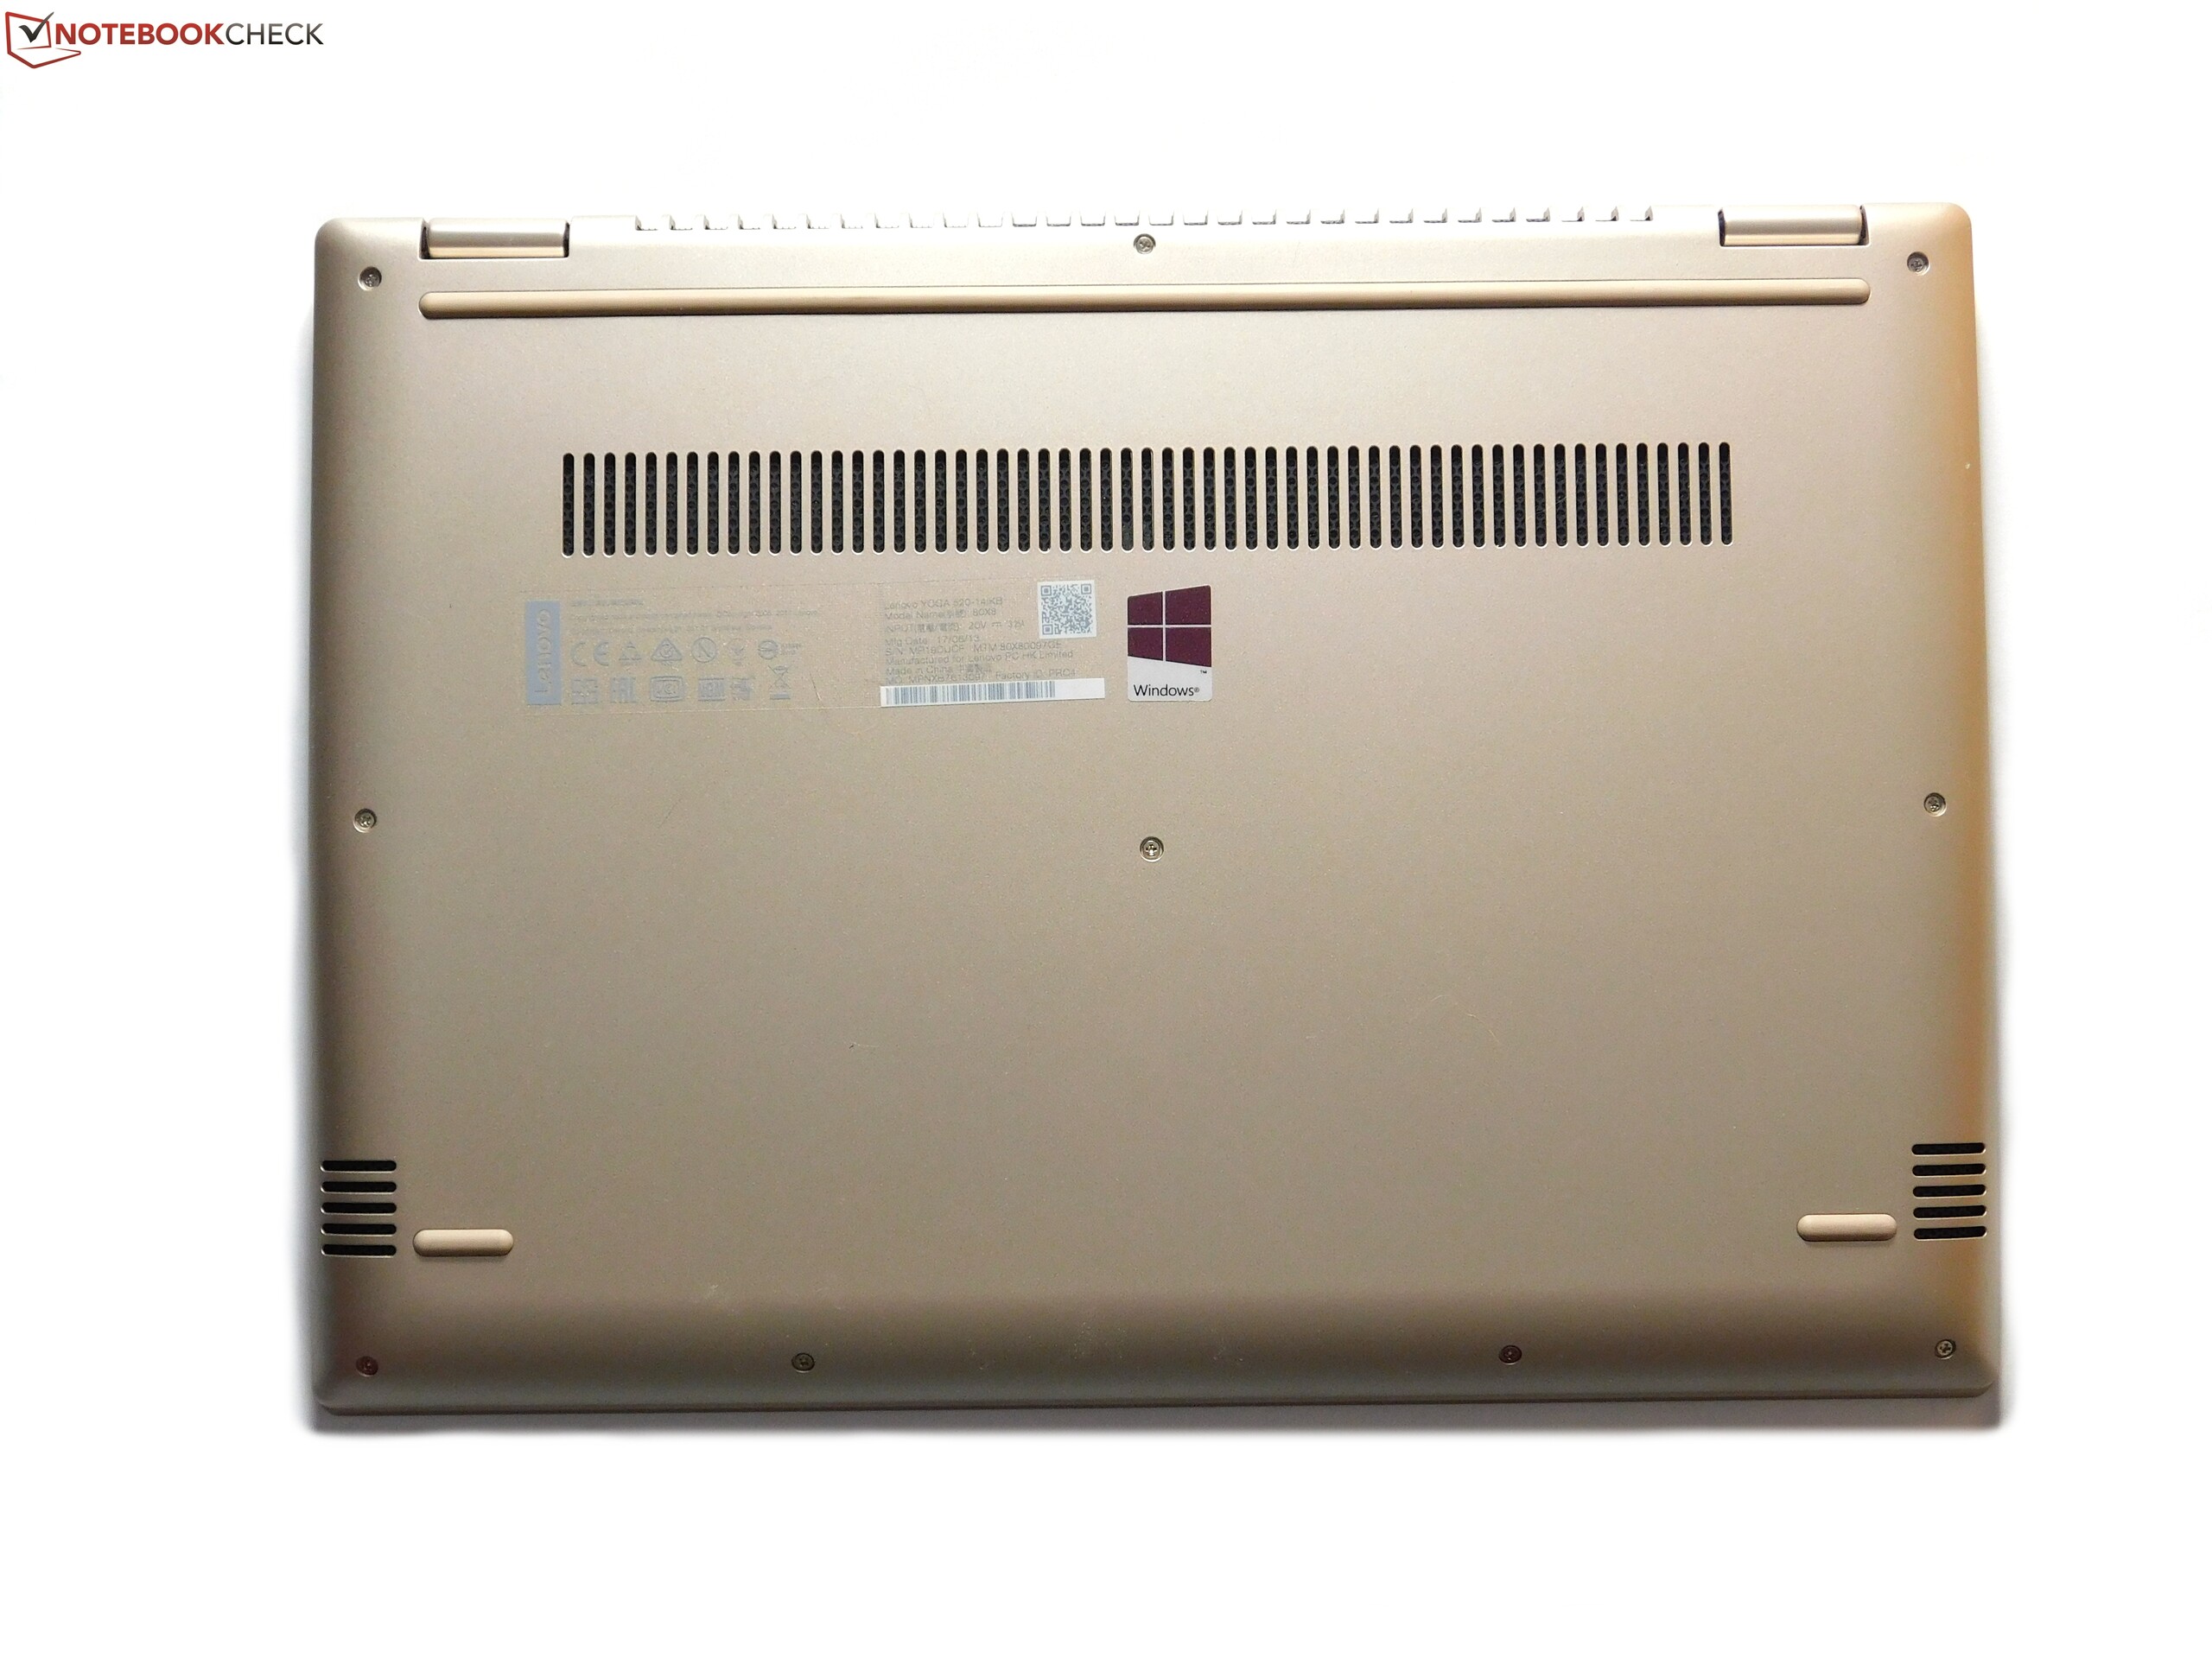
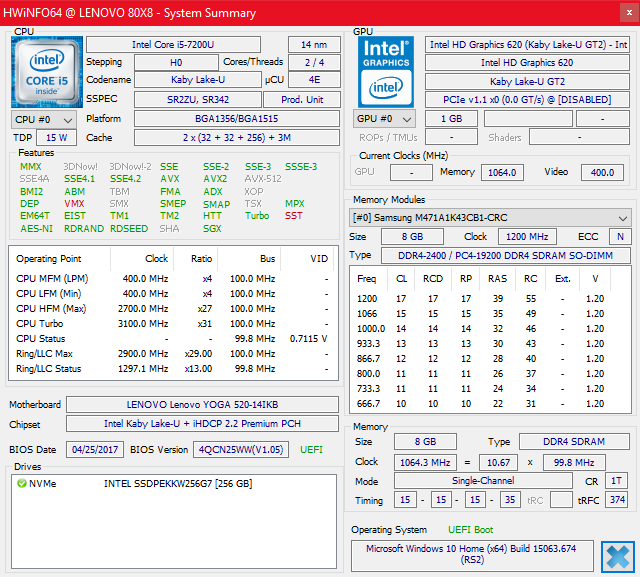
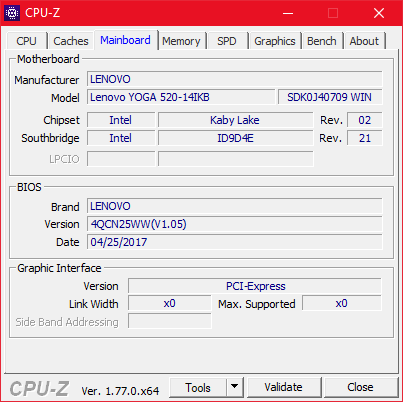
Já mencionamos na seção sobre a carcaça, que o Yoga 520-14IKB é muito parecido com o IdeaPad 520s-14IKB. Isso não se aplica apenas ao design, mas também ao hardware em geral. O Lenovo Yoga 520-14IKB é quase a versão conversível do IdeaPad.
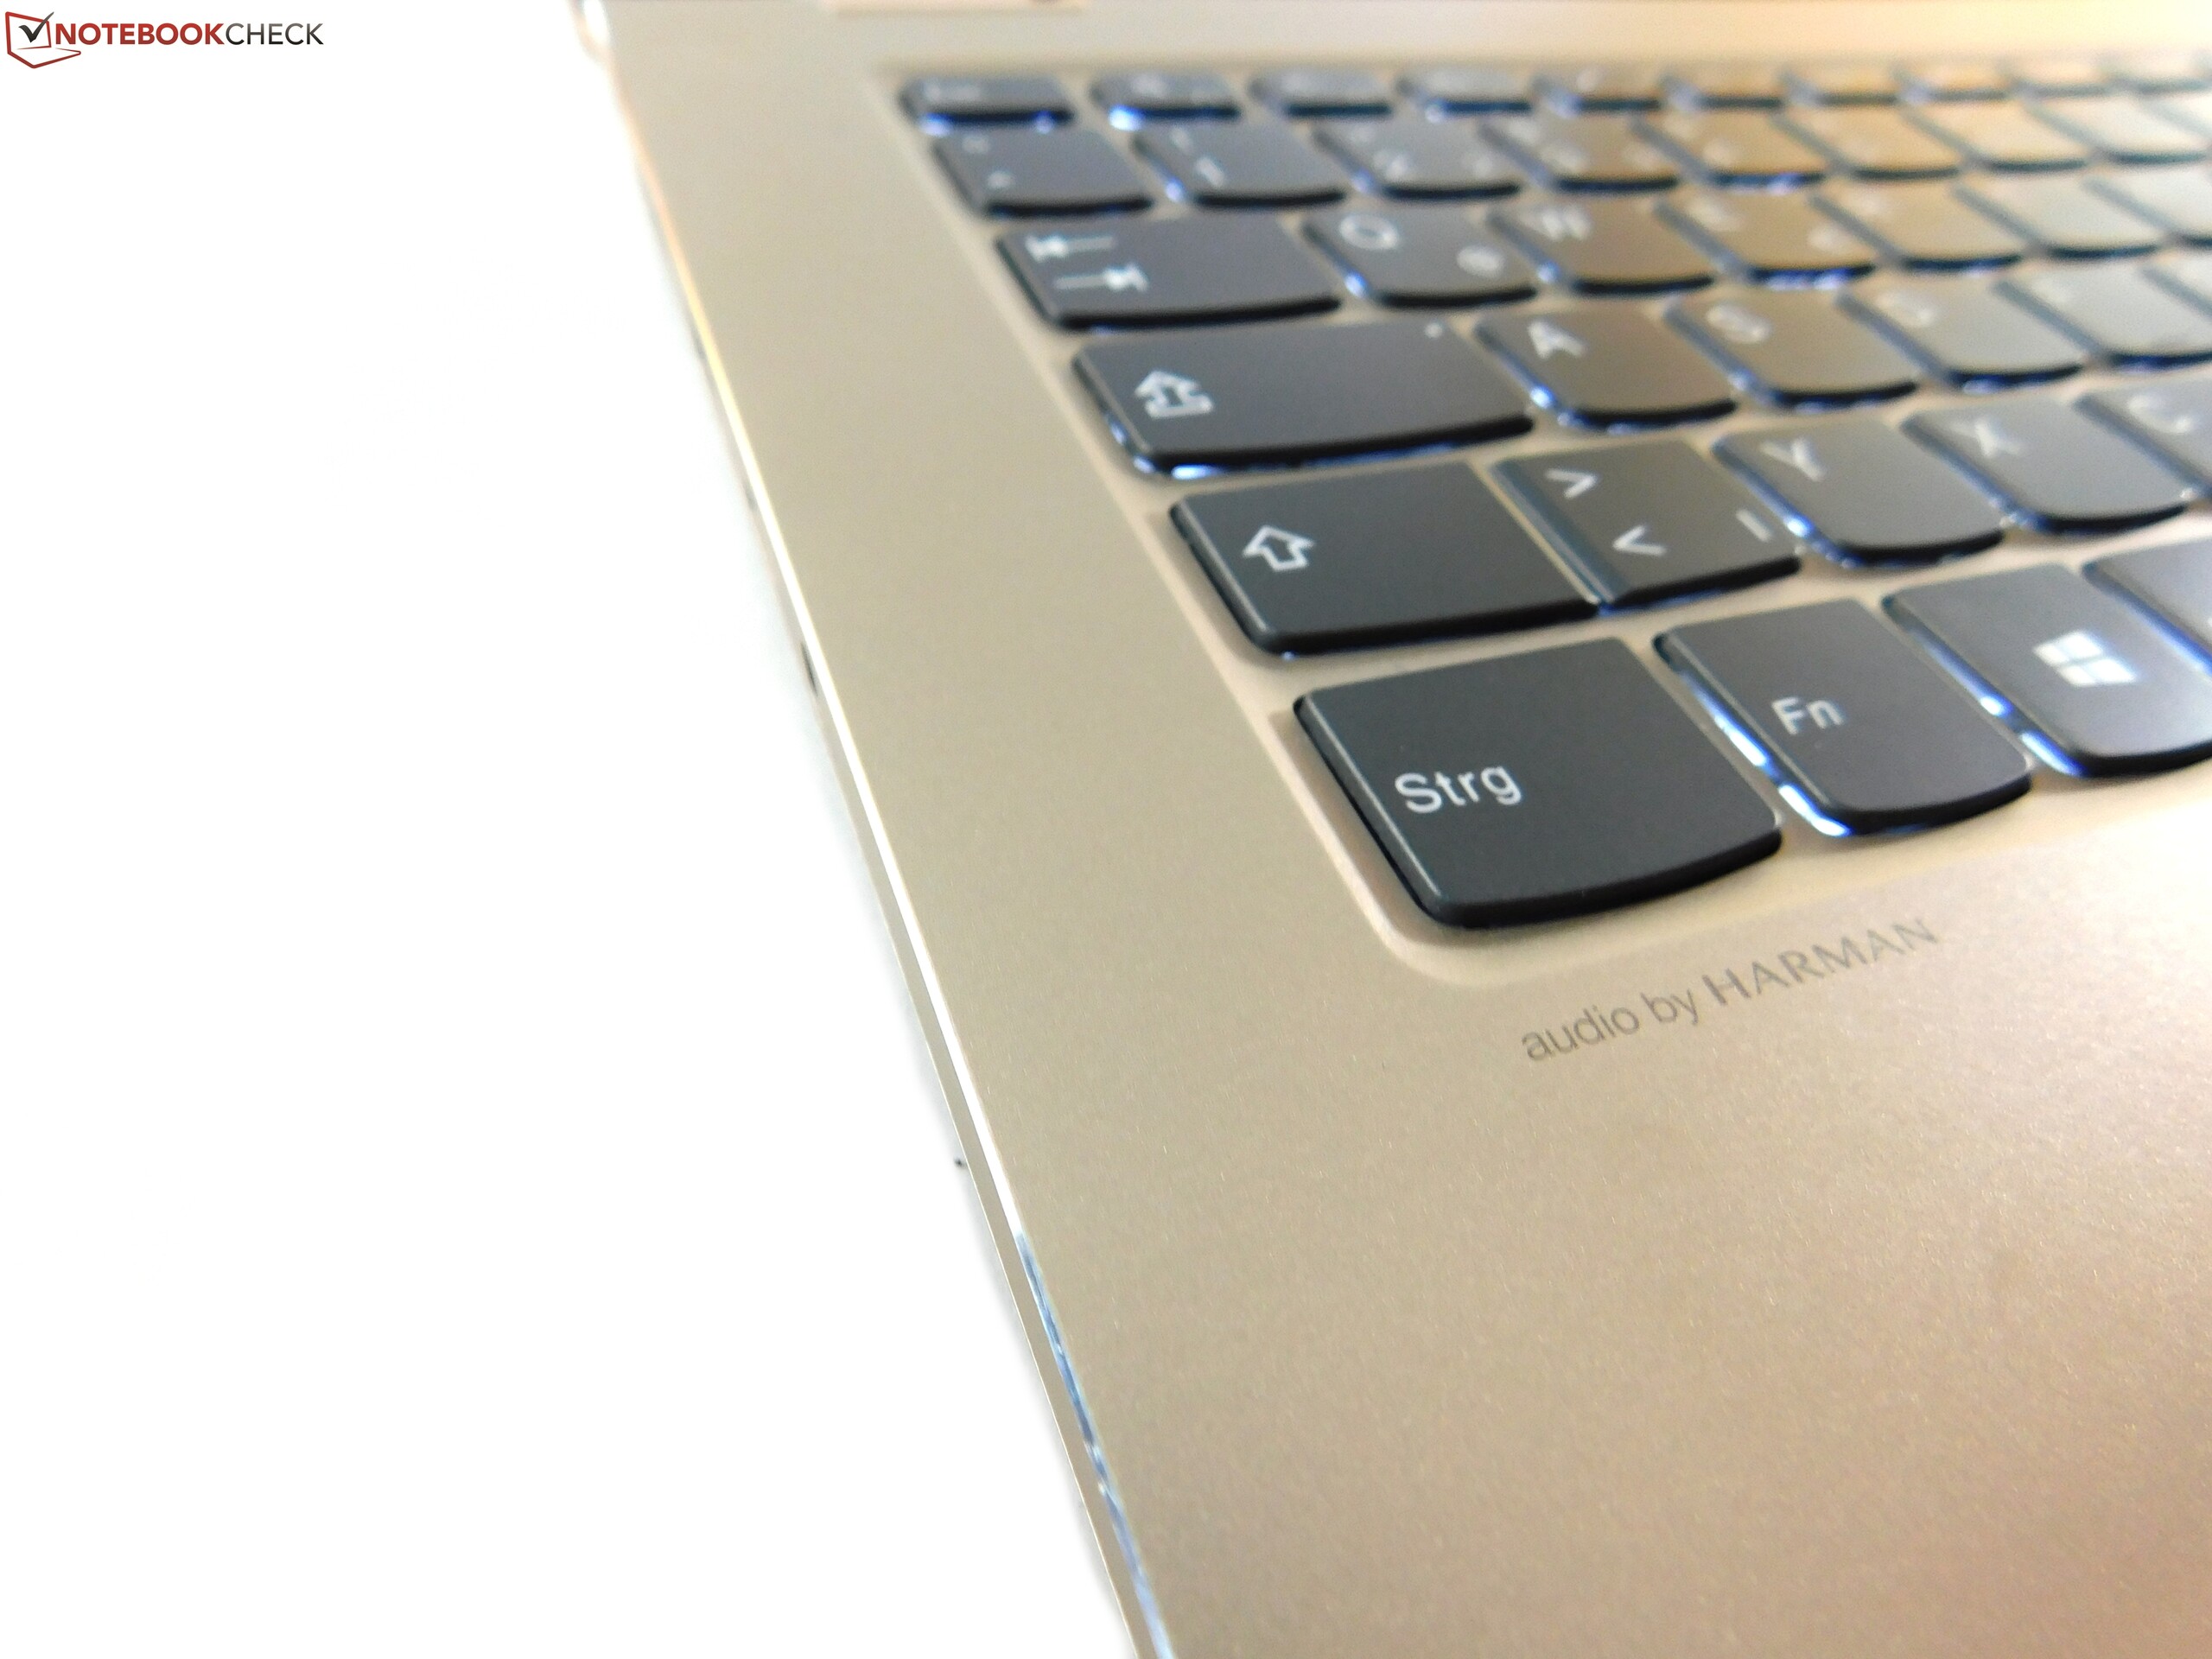
Portanto, a lista de pros e contras também são muito similares. Assim como no IdeaPad, a carcaça, teclado, e touchpad estão em um bom nível. Embora dispositivos mais caros possam até mesmo ser significativamente melhores aqui, até certo ponto, considerando o preço, você não pode pedir muito mais do Yoga, que não possui fraquezas reais nessas categorias. O mesmo também pode ser dito sobre a emissão de ruído e a temperatura. O Yoga 520-14IKB permanece sempre frio e silencioso. Além disso, graças a uma bateria maior, sua duração foi significantemente melhorada em comparação com o predecessor.
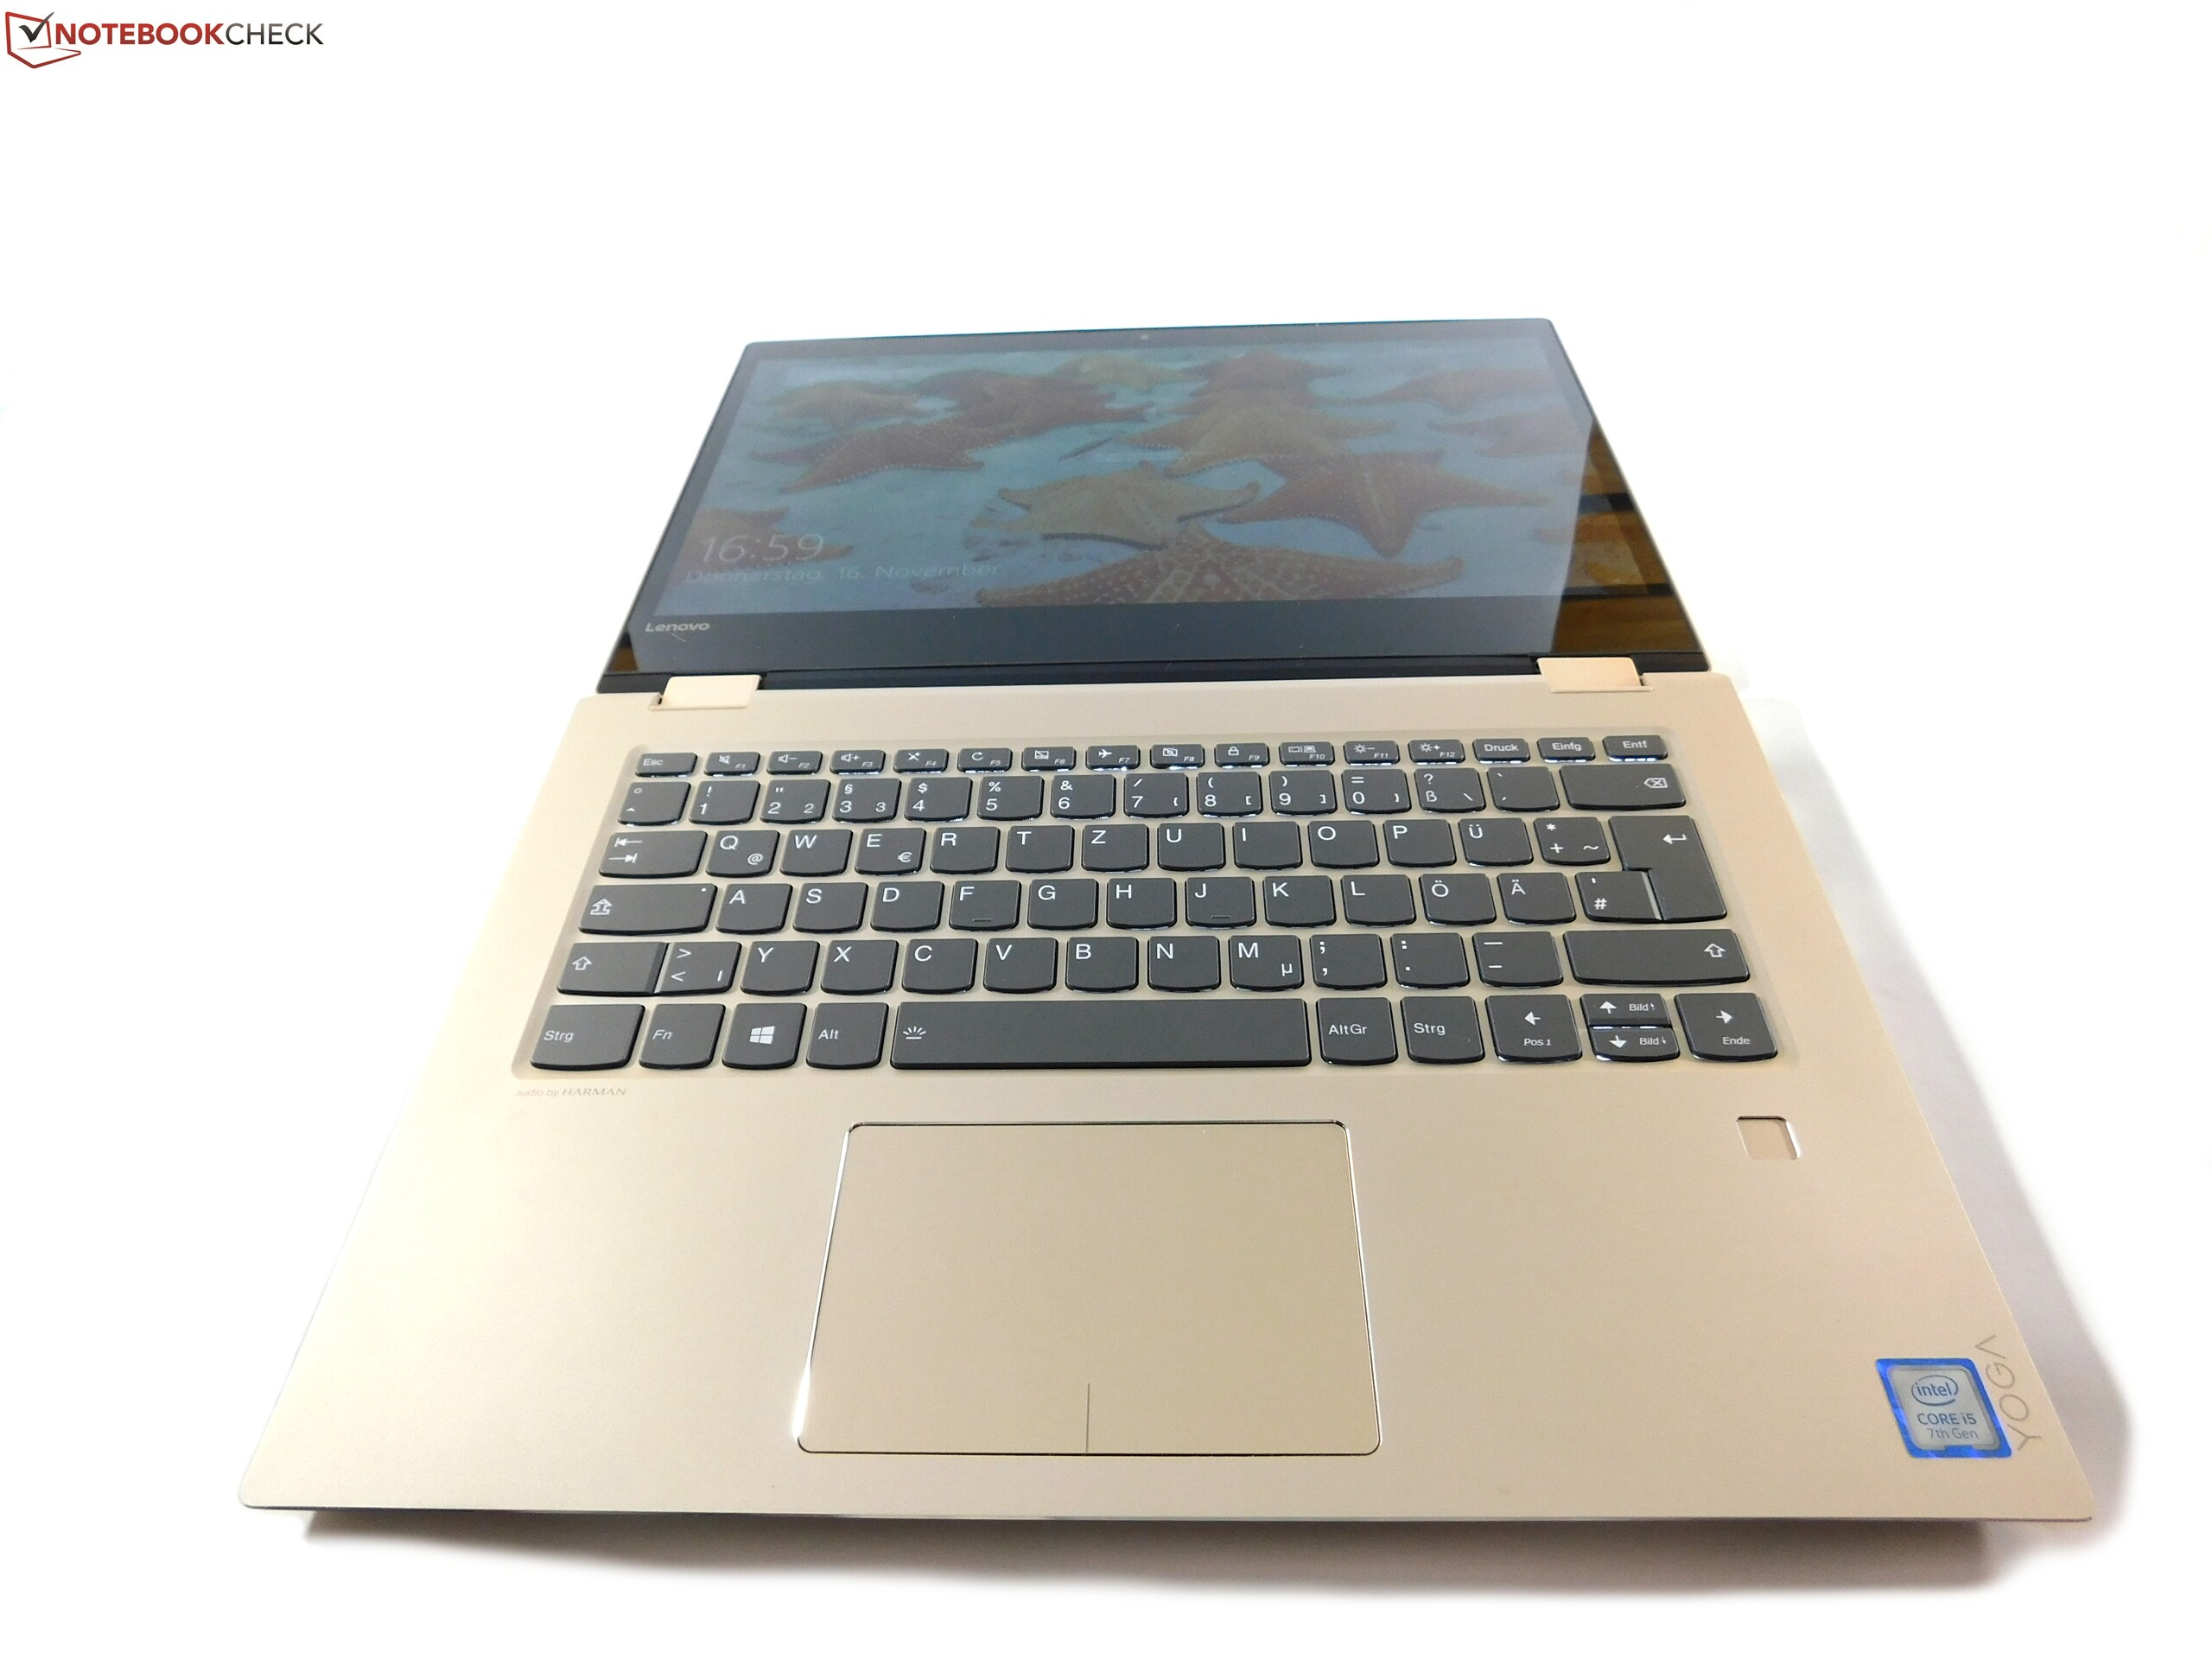
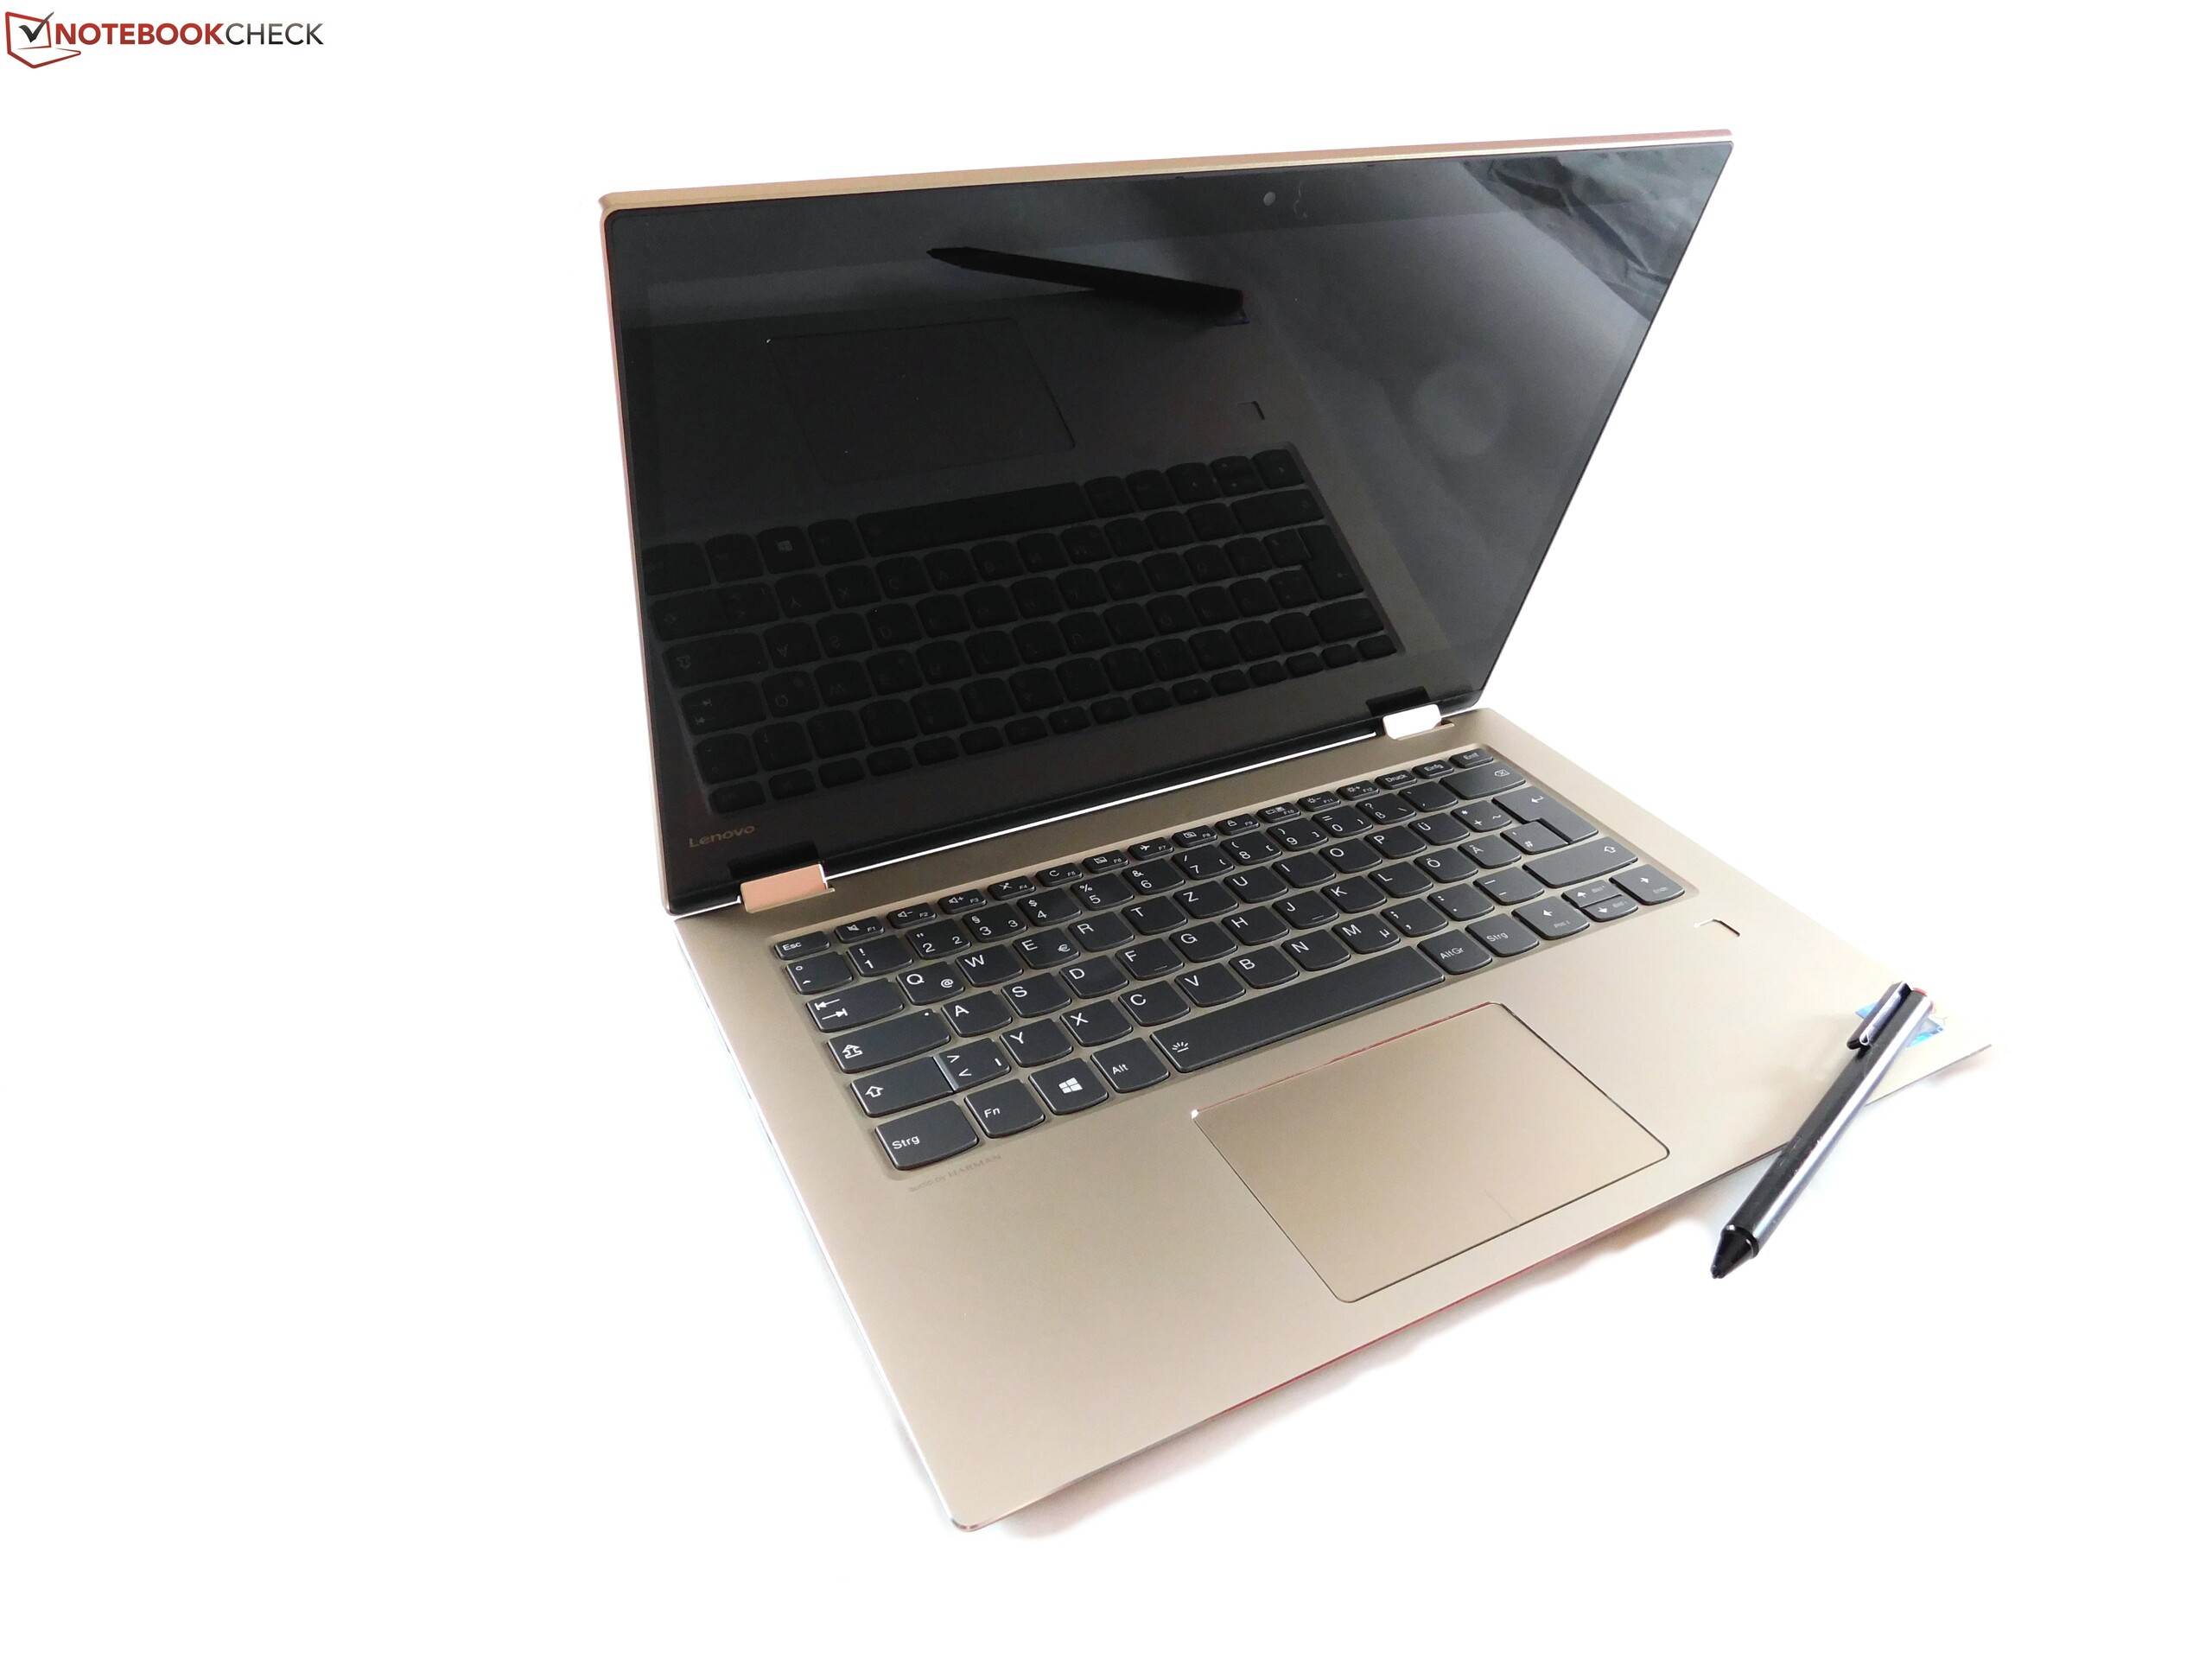
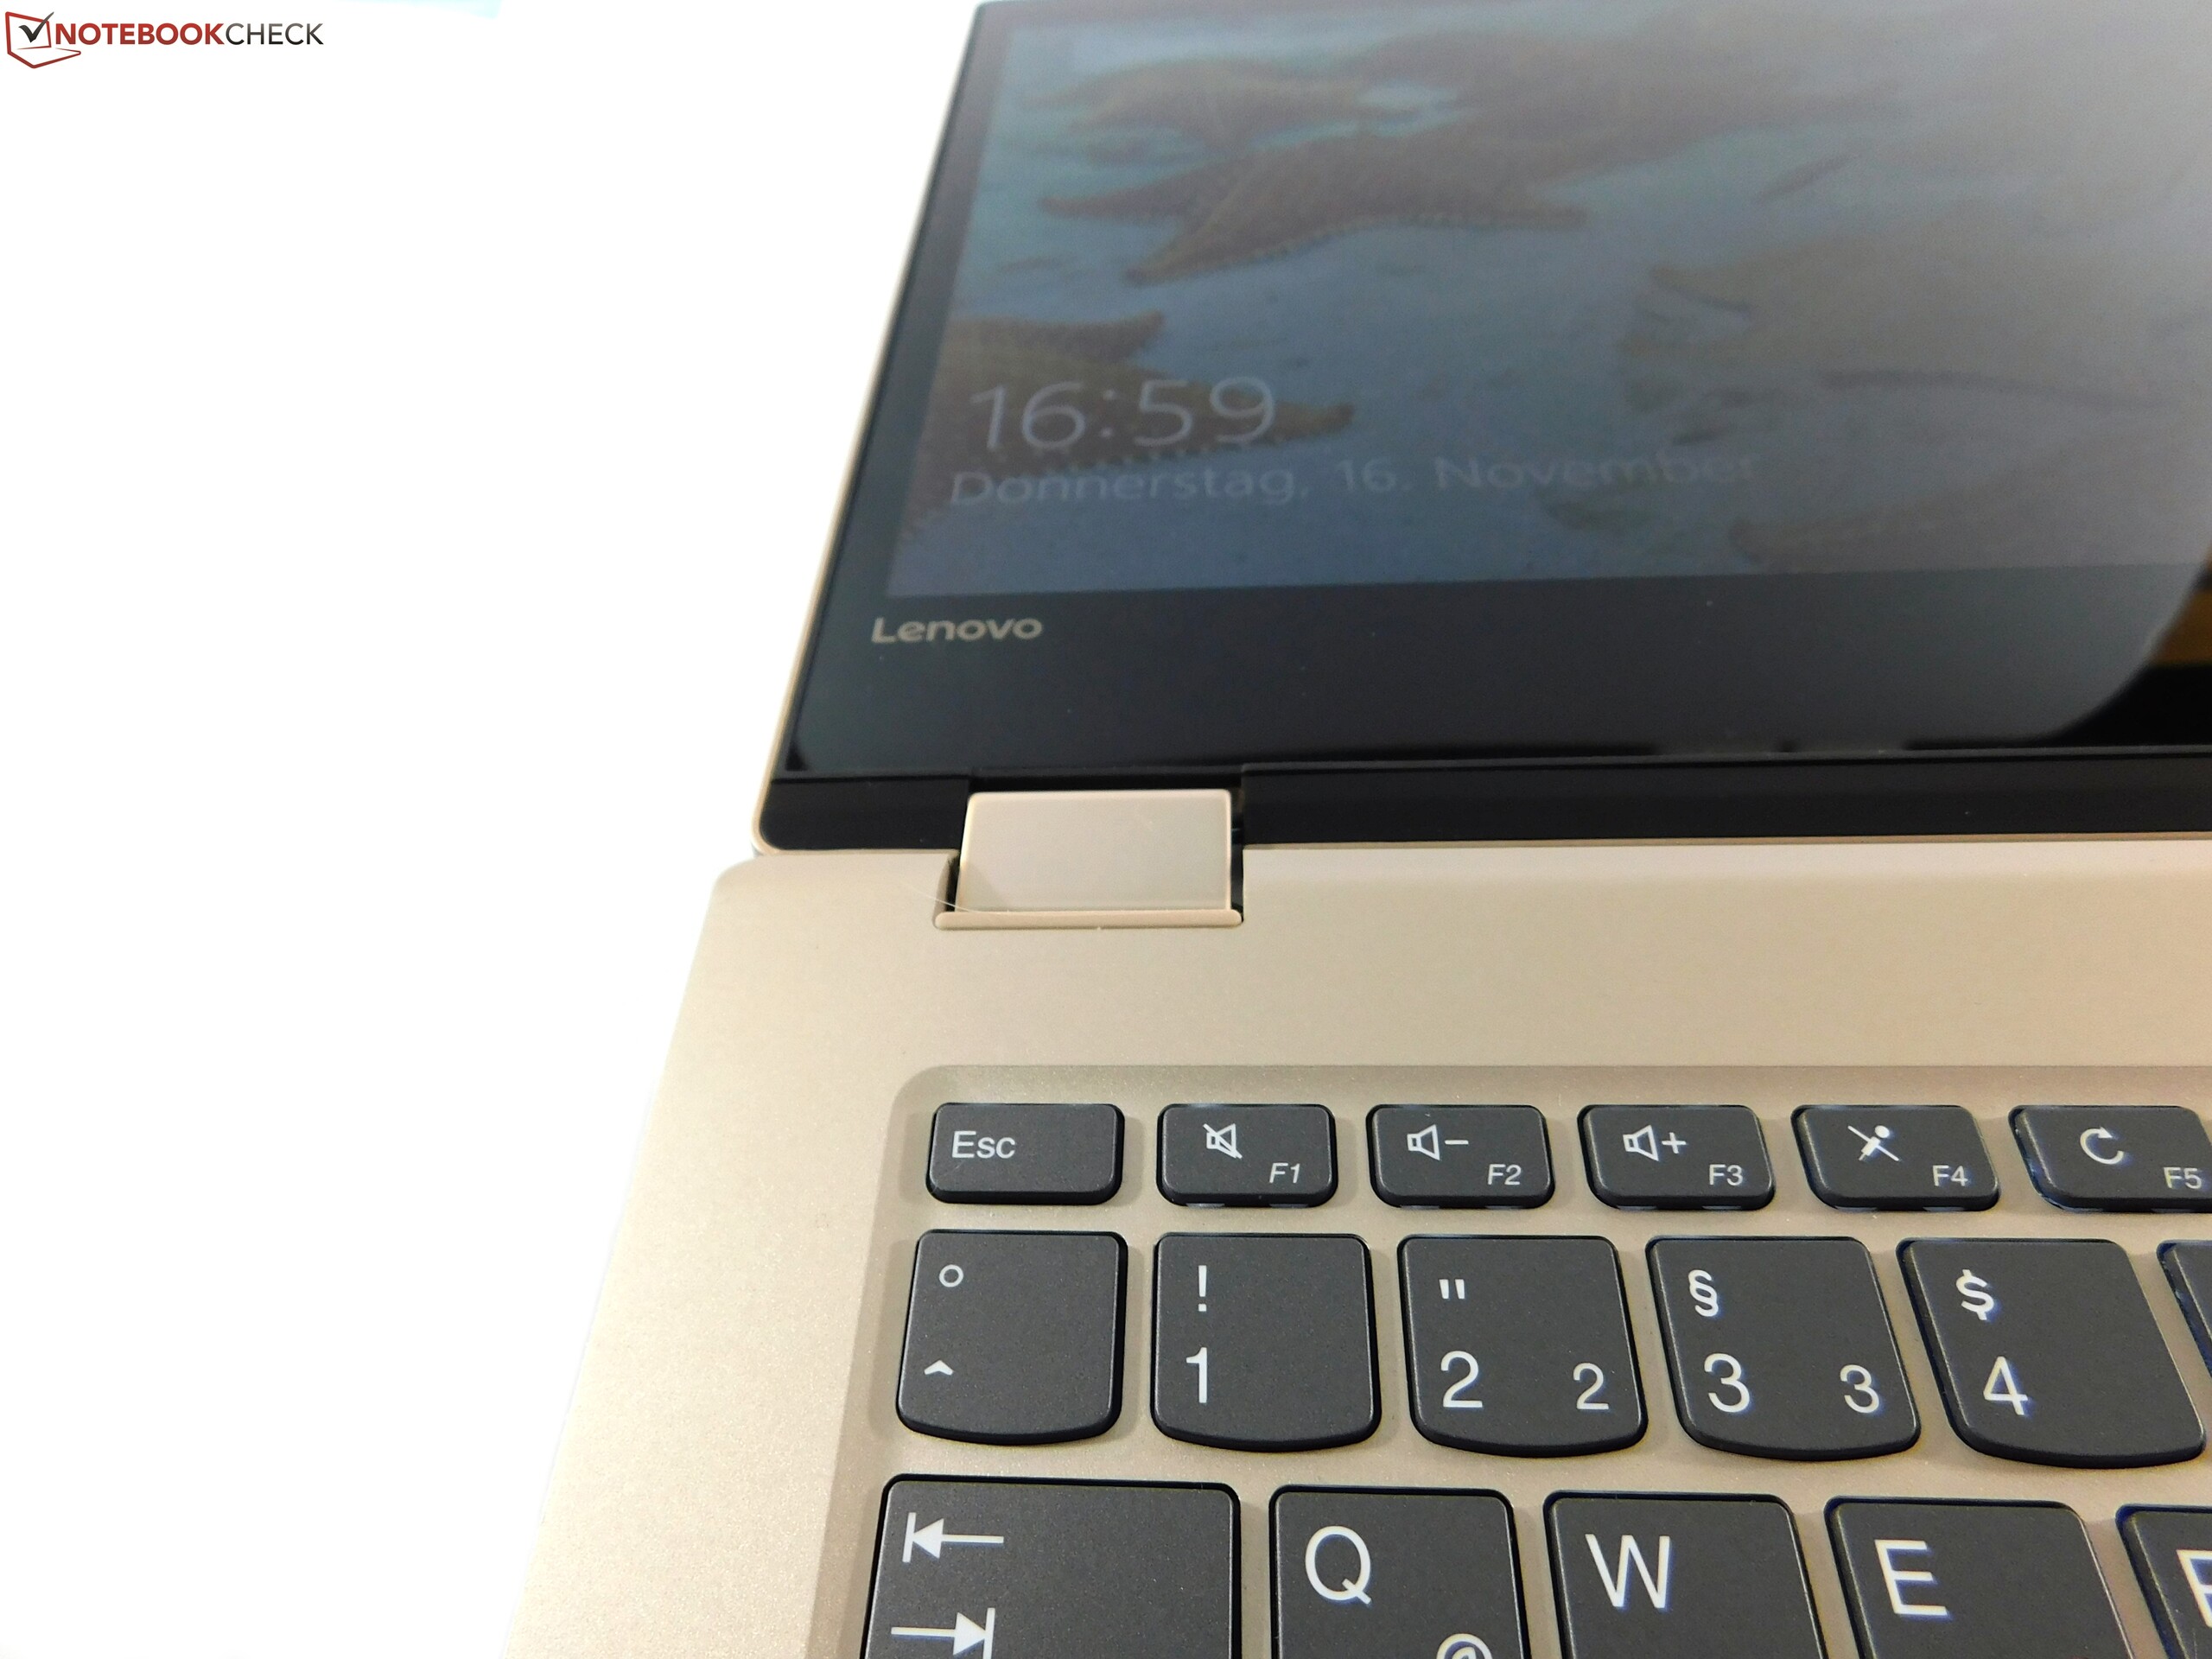
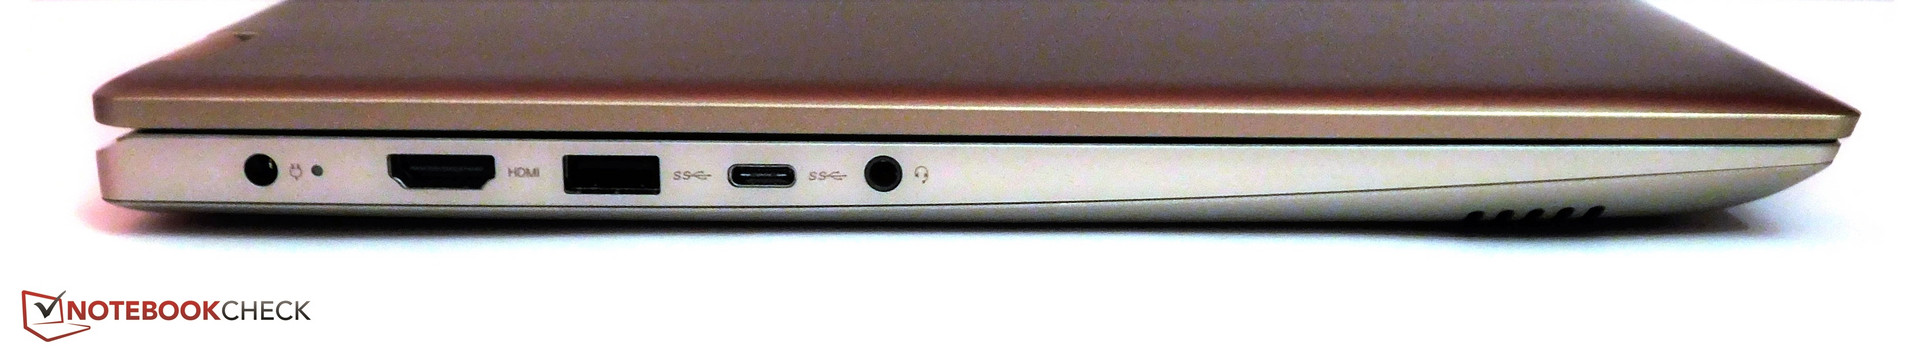
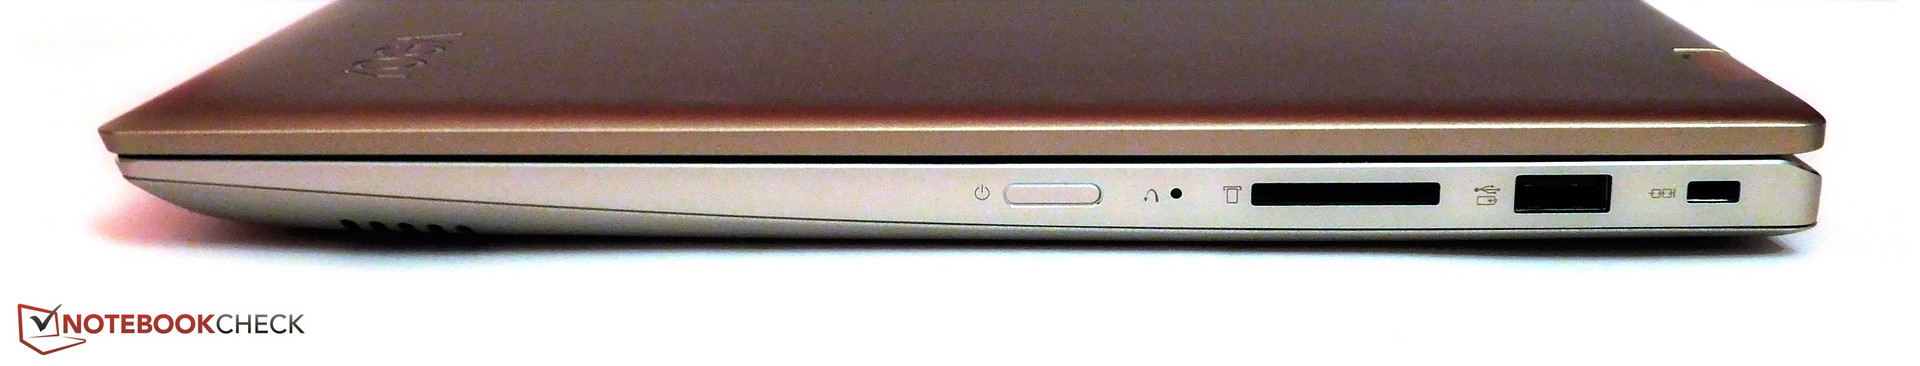
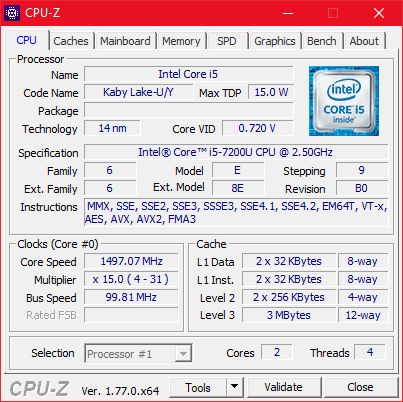
Encontramos a primeira diferença em comparação com o IdeaPad 520s-14IKB na temperatura. Enquanto o IdeaPad esquenta um pouco mais (também devido ao GPU da Nvidia, é claro), o Yoga 520 permanece sempre frio. Isso também é devido ao seu primeiro ponto negativo forte: o desempenho da CPU é limitado significativamente e permanece longe do possível máximo do Core i5-7200U. Esta limitação de desempenho se deve à limitação do TDP do fabricante de 8 watts para a CPU. Portanto, não é surpreendente que a carcaça quase não esquente dessa maneira. Outro ponto negativo é a tela. Embora ofereça a capacidade táctil e um digitalizador ativo, a qualidade da cor não é boa devido ao espaço de cores limitado. O brilho também é muito baixo para compensar a superfície brilhante em uso externo. Mas ficamos realmente aborrecidos com o efeito de onda estranho que pode ser visto no painel quando olhamos de perto e também pela baixa frequência de PWM. Além dessas fraquezas, como no IdeaPad também sentimos falta de uma conexão USB-C que lida com mais que USB aqui. Além disso, as dobradiças são muito balançantes para nosso gosto. E finalmente, como no IdeaPad 520s-14IKB, temos que reclamar sobre o WLAN 1x1.
As fraquezas da tela e o mau desempenho da CPU combinados com os componentes envelhecidos tornam o Yoga 520-14IKB um conversível que dificilmente pode ser recomendado.
Devido a essas fraquezas, é difícil para nós dar uma recomendação ao Yoga 520-14IKB. Em particular, os pontos fracos da tela e o desempenho da CPU pesam muito. Além disso, está o fato de que o Yoga 520-14IKB está simplesmente ultrapassado, dado que a GPU opcional e a CPU já possuem um sucessor. Portanto, nossa recomendação é para um conversível diferente, ou para aguardar uma atualização do Yoga com o Kaby Lake e oMX150. Talvez as coisas também funcionem melhor em termos de tela e desempenho da CPU.
Lenovo Yoga 520-14IKB 80X80097GE
- 11/17/2017 v6 (old)
Benjamin Herzig