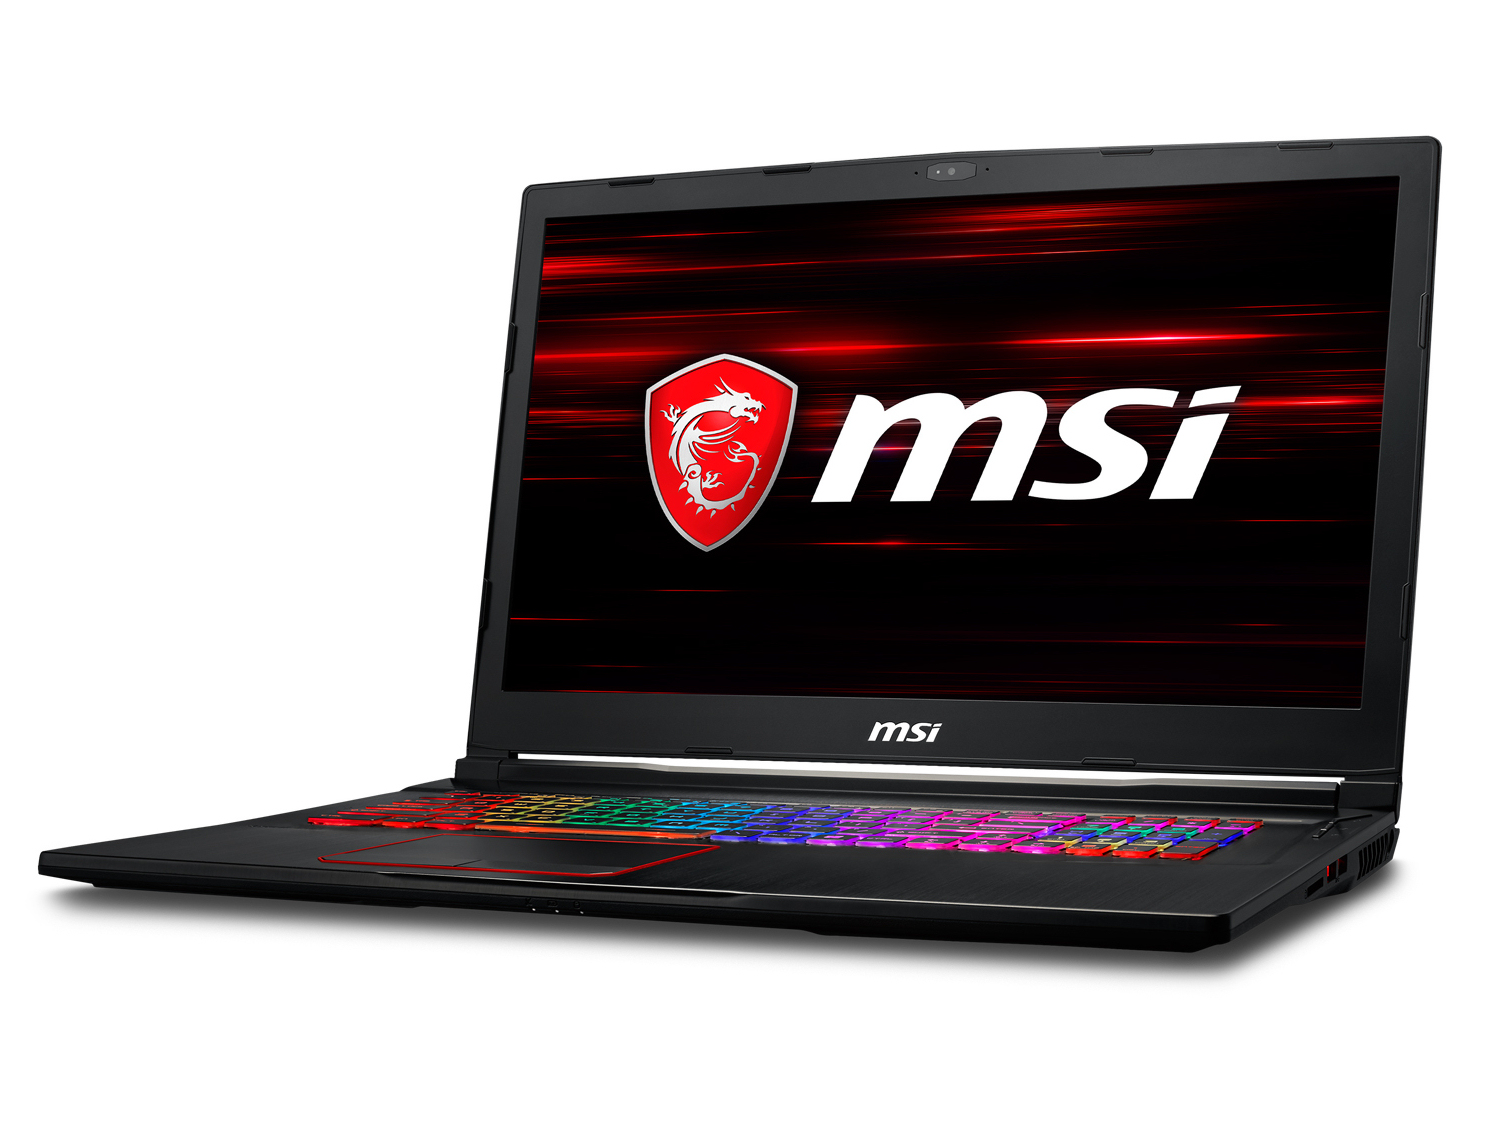
Breve Análise do Portátil MSI GE73 8RF Raider RGB (i7-8750H, GTX 1070, Full-HD)
| SD Card Reader | |
| average JPG Copy Test (av. of 3 runs) | |
| Schenker XMG Pro 17 (Toshiba Exceria Pro SDXC 64 GB UHS-II) | |
| MSI GE73VR 7RF Raider (Toshiba Exceria Pro SDXC 64 GB UHS-II) | |
| Média da turma Gaming (20.9 - 210, n=54, últimos 2 anos) | |
| HP Omen X 17-ap0xx (Toshiba Exceria Pro SDXC 64 GB UHS-II) | |
| MSI GE73 8RF-008 Raider RGB (Toshiba Exceria Pro SDXC 64 GB UHS-II) | |
| maximum AS SSD Seq Read Test (1GB) | |
| Schenker XMG Pro 17 (Toshiba Exceria Pro SDXC 64 GB UHS-II) | |
| MSI GE73VR 7RF Raider (Toshiba Exceria Pro SDXC 64 GB UHS-II) | |
| Média da turma Gaming (25.5 - 261, n=51, últimos 2 anos) | |
| HP Omen X 17-ap0xx (Toshiba Exceria Pro SDXC 64 GB UHS-II) | |
| MSI GE73 8RF-008 Raider RGB (Toshiba Exceria Pro SDXC 64 GB UHS-II) | |
| |||||||||||||||||||||||||
iluminação: 90 %
iluminação com acumulador: 273 cd/m²
Contraste: 1050:1 (Preto: 0.26 cd/m²)
ΔE ColorChecker Calman: 3.52 | ∀{0.5-29.43 Ø4.71}
calibrated: 2.09
ΔE Greyscale Calman: 3.11 | ∀{0.09-98 Ø4.96}
100% sRGB (Argyll 1.6.3 3D)
76% AdobeRGB 1998 (Argyll 1.6.3 3D)
85.8% AdobeRGB 1998 (Argyll 3D)
99.9% sRGB (Argyll 3D)
90.8% Display P3 (Argyll 3D)
Gamma: 2.43
CCT: 6999 K
| MSI GE73 8RF-008 Raider RGB TN WLED, 1920x1080, 17.3" | Acer Predator Helios 500 PH517-51-79BY IPS, 1920x1080, 17.3" | Schenker XMG Pro 17 IPS, 3840x2160, 17.3" | HP Omen X 17-ap0xx IPS, 1920x1080, 17.3" | MSI GE73VR 7RF Raider TN WLED, 1920x1080, 17.3" | |
|---|---|---|---|---|---|
| Display | -21% | 3% | -22% | -0% | |
| Display P3 Coverage (%) | 90.8 | 64.4 -29% | 85.9 -5% | 63.7 -30% | 90.5 0% |
| sRGB Coverage (%) | 99.9 | 91.3 -9% | 99.9 0% | 88.2 -12% | 99.9 0% |
| AdobeRGB 1998 Coverage (%) | 85.8 | 65.6 -24% | 98.9 15% | 64.2 -25% | 84.8 -1% |
| Response Times | 42% | -70% | -95% | -1% | |
| Response Time Grey 50% / Grey 80% * (ms) | 28 ? | 14 ? 50% | 44 ? -57% | 44 ? -57% | 28.8 ? -3% |
| Response Time Black / White * (ms) | 13.6 ? | 9 ? 34% | 24.8 ? -82% | 31.6 ? -132% | 13.4 ? 1% |
| PWM Frequency (Hz) | 25000 ? | 26000 ? | |||
| Screen | -34% | -9% | -2% | 8% | |
| Brightness middle (cd/m²) | 273 | 335 23% | 303 11% | 343 26% | 296 8% |
| Brightness (cd/m²) | 273 | 300 10% | 287 5% | 332 22% | 279 2% |
| Brightness Distribution (%) | 90 | 82 -9% | 83 -8% | 83 -8% | 90 0% |
| Black Level * (cd/m²) | 0.26 | 0.7 -169% | 0.25 4% | 0.35 -35% | 0.21 19% |
| Contrast (:1) | 1050 | 479 -54% | 1212 15% | 980 -7% | 1410 34% |
| Colorchecker dE 2000 * | 3.52 | 4.99 -42% | 4.38 -24% | 3.35 5% | 3.09 12% |
| Colorchecker dE 2000 max. * | 6.34 | 9.32 -47% | 7.42 -17% | 5.62 11% | 5.97 6% |
| Colorchecker dE 2000 calibrated * | 2.09 | 1.93 8% | 2.5 -20% | ||
| Greyscale dE 2000 * | 3.11 | 5.2 -67% | 5.96 -92% | 2.4 23% | 3.06 2% |
| Gamma | 2.43 91% | 2.49 88% | 2.31 95% | 2.35 94% | 2.19 100% |
| CCT | 6999 93% | 7719 84% | 6247 104% | 6495 100% | 7315 89% |
| Color Space (Percent of AdobeRGB 1998) (%) | 76 | 59 -22% | 87 14% | 57 -25% | 75 -1% |
| Color Space (Percent of sRGB) (%) | 100 | 91 -9% | 100 0% | 88 -12% | 100 0% |
| Média Total (Programa/Configurações) | -4% /
-22% | -25% /
-15% | -40% /
-17% | 2% /
5% |
* ... menor é melhor
Cintilação da tela / PWM (modulação por largura de pulso)
| Tela tremeluzindo/PWM detectado | 25000 Hz | ≤ 14 % configuração de brilho | 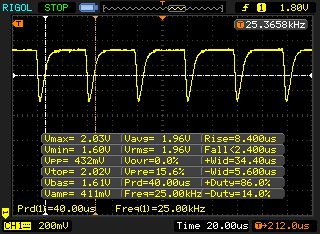 |
A luz de fundo da tela pisca em 25000 Hz (pior caso, por exemplo, utilizando PWM) Cintilação detectada em uma configuração de brilho de 14 % e abaixo. Não deve haver cintilação ou PWM acima desta configuração de brilho. A frequência de 25000 Hz é bastante alta, então a maioria dos usuários sensíveis ao PWM não deve notar nenhuma oscilação. [pwm_comparison] Em comparação: 52 % de todos os dispositivos testados não usam PWM para escurecer a tela. Se PWM foi detectado, uma média de 7754 (mínimo: 5 - máximo: 343500) Hz foi medida. | |||
Exibir tempos de resposta
| ↔ Tempo de resposta preto para branco | ||
|---|---|---|
| 13.6 ms ... ascensão ↗ e queda ↘ combinadas | ↗ 11.8 ms ascensão | 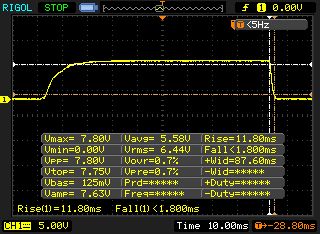 |
| ↘ 1.8 ms queda | ||
| A tela mostra boas taxas de resposta em nossos testes, mas pode ser muito lenta para jogadores competitivos. Em comparação, todos os dispositivos testados variam de 0.1 (mínimo) a 240 (máximo) ms. » 34 % de todos os dispositivos são melhores. Isso significa que o tempo de resposta medido é melhor que a média de todos os dispositivos testados (19.8 ms). | ||
| ↔ Tempo de resposta 50% cinza a 80% cinza | ||
| 28 ms ... ascensão ↗ e queda ↘ combinadas | ↗ 16.4 ms ascensão | 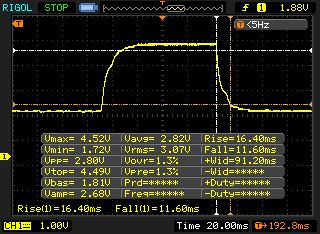 |
| ↘ 11.6 ms queda | ||
| A tela mostra taxas de resposta relativamente lentas em nossos testes e pode ser muito lenta para os jogadores. Em comparação, todos os dispositivos testados variam de 0.165 (mínimo) a 636 (máximo) ms. » 38 % de todos os dispositivos são melhores. Isso significa que o tempo de resposta medido é semelhante à média de todos os dispositivos testados (31 ms). | ||
| Cinebench R10 | |
| Rendering Multiple CPUs 32Bit | |
| Média da turma Gaming (42932 - 102066, n=9, últimos 2 anos) | |
| MSI GE73 8RF-008 Raider RGB | |
| HP Omen X 17-ap0xx | |
| MSI GE73VR 7RF Raider | |
| Rendering Single 32Bit | |
| Média da turma Gaming (7457 - 12575, n=9, últimos 2 anos) | |
| MSI GE73 8RF-008 Raider RGB | |
| HP Omen X 17-ap0xx | |
| MSI GE73VR 7RF Raider | |
| Geekbench 3 | |
| 32 Bit Multi-Core Score | |
| MSI GE73 8RF-008 Raider RGB | |
| 32 Bit Single-Core Score | |
| MSI GE73 8RF-008 Raider RGB | |
| Geekbench 4.0 | |
| 64 Bit Multi-Core Score | |
| Média da turma Gaming (40469 - 76142, n=4, últimos 2 anos) | |
| MSI GE73 8RF-008 Raider RGB | |
| 64 Bit Single-Core Score | |
| Média da turma Gaming (7589 - 9053, n=4, últimos 2 anos) | |
| MSI GE73 8RF-008 Raider RGB | |
| Geekbench 4.4 | |
| 64 Bit Multi-Core Score | |
| Média da turma Gaming (89200 - 101054, n=3, últimos 2 anos) | |
| MSI GE73 8RF-008 Raider RGB | |
| 64 Bit Single-Core Score | |
| Média da turma Gaming (9335 - 9775, n=3, últimos 2 anos) | |
| MSI GE73 8RF-008 Raider RGB | |
| Mozilla Kraken 1.1 - Total | |
| MSI GE73 8RF-008 Raider RGB (Edge 42) | |
| HP Omen X 17-ap0xx (40.15063.674.0) | |
| MSI GE73VR 7RF Raider (EDGE: 40.15063.0.0) | |
| Acer Predator Helios 500 PH517-51-79BY | |
| Média da turma Gaming (391 - 590, n=100, últimos 2 anos) | |
| Octane V2 - Total Score | |
| Média da turma Gaming (93292 - 139447, n=27, últimos 2 anos) | |
| Acer Predator Helios 500 PH517-51-79BY | |
| MSI GE73VR 7RF Raider (EDGE: 40.15063.0.0) | |
| MSI GE73 8RF-008 Raider RGB (Edge 42) | |
| HP Omen X 17-ap0xx (40.15063.674.0) | |
| JetStream 1.1 - 1.1 Total | |
| Média da turma Gaming (549 - 647, n=3, últimos 2 anos) | |
| MSI GE73VR 7RF Raider (EDGE: 40.15063.0.0) | |
| MSI GE73 8RF-008 Raider RGB (Edge 42) | |
| HP Omen X 17-ap0xx (40.15063.674.0) | |
| Acer Predator Helios 500 PH517-51-79BY | |
* ... menor é melhor
| PCMark 8 Home Score Accelerated v2 | 4498 pontos | |
| PCMark 8 Work Score Accelerated v2 | 5342 pontos | |
| PCMark 10 Score | 5465 pontos | |
Ajuda | ||
| PCMark 10 - Score | |
| Média da turma Gaming (5828 - 12414, n=93, últimos 2 anos) | |
| Acer Predator Helios 500 PH517-51-79BY | |
| MSI GE73 8RF-008 Raider RGB | |
| HP Omen X 17-ap0xx | |
| MSI GS73VR 7RG | |
| Schenker XMG Pro 17 | |

| MSI GE73 8RF-008 Raider RGB Toshiba HG6 THNSNJ256G8NY | Acer Predator Helios 500 PH517-51-79BY SK hynix SSD Canvas SC300 HFS256GD9MNE-6200A | Schenker XMG Pro 17 Samsung SSD 960 Evo 500GB m.2 NVMe | HP Omen X 17-ap0xx Samsung PM961 MZVLW256HEHP | MSI GE73VR 7RF Raider Toshiba HG6 THNSNJ256G8NY | |
|---|---|---|---|---|---|
| CrystalDiskMark 5.2 / 6 | 108% | 294% | 237% | 26% | |
| Read Seq Q32T1 (MB/s) | 545 | 1488 173% | 3319 509% | 3450 533% | 540 -1% |
| Write Seq Q32T1 (MB/s) | 283.8 | 948 234% | 1840 548% | 1210 326% | 489.9 73% |
| Read 4K Q32T1 (MB/s) | 207.9 | 304 46% | 561 170% | 535 157% | 313.5 51% |
| Write 4K Q32T1 (MB/s) | 139.8 | 189.6 36% | 481 244% | 444 218% | 189.1 35% |
| Read Seq (MB/s) | 527 | 1087 106% | 1788 239% | 1461 177% | 521 -1% |
| Write Seq (MB/s) | 412.9 | 950 130% | 1656 301% | 1216 195% | 427.6 4% |
| Read 4K (MB/s) | 19.43 | 39.69 104% | 45.55 134% | 46.64 140% | 20.41 5% |
| Write 4K (MB/s) | 58.8 | 79.2 35% | 179.4 205% | 148.8 153% | 83.3 42% |
| 3DMark 06 Standard Score | 35100 pontos | |
| 3DMark 11 Performance | 18568 pontos | |
| 3DMark Ice Storm Standard Score | 97741 pontos | |
| 3DMark Cloud Gate Standard Score | 33305 pontos | |
| 3DMark Fire Strike Score | 15656 pontos | |
| 3DMark Fire Strike Extreme Score | 8048 pontos | |
| 3DMark Time Spy Score | 5773 pontos | |
Ajuda | ||
| 3DMark 11 - 1280x720 Performance GPU | |
| Média da turma Gaming (21841 - 80022, n=104, últimos 2 anos) | |
| HP Omen X 17-ap0xx | |
| MSI GE73VR 7RF Raider | |
| MSI GE73 8RF-008 Raider RGB | |
| Schenker XMG Pro 17 | |
| The Witcher 3 - 1920x1080 Ultra Graphics & Postprocessing (HBAO+) | |
| Média da turma Gaming (104.7 - 240, n=7, últimos 2 anos) | |
| HP Omen X 17-ap0xx | |
| MSI GE73 8RF-008 Raider RGB | |
| Schenker XMG Pro 17 | |
| MSI GE73VR 7RF Raider | |
| Acer Predator Helios 500 PH517-51-79BY | |
| baixo | média | alto | ultra | |
|---|---|---|---|---|
| Tomb Raider (2013) | 442.2 | 390.4 | 352.8 | 207.3 |
| BioShock Infinite (2013) | 284.7 | 246.3 | 231 | 139.6 |
| The Witcher 3 (2015) | 254.6 | 184.7 | 113.8 | 62.9 |
| Assassin´s Creed Origins (2017) | 88 | 77 | 75 | 65 |
| X-Plane 11.11 (2018) | 93 | 79.6 | 68 | |
| Far Cry 5 (2018) | 118 | 93 | 90 | 86 |
Barulho
| Ocioso |
| 32 / 33 / 34 dB |
| HDD |
| 33 dB |
| Carga |
| 41 / 54 dB |
 | ||
30 dB silencioso 40 dB(A) audível 50 dB(A) ruidosamente alto |
||
min: | ||
| MSI GE73 8RF-008 Raider RGB i7-8750H, GeForce GTX 1070 Mobile | Acer Predator Helios 500 PH517-51-79BY i7-8750H, GeForce GTX 1070 Mobile | Schenker XMG Pro 17 i7-7700HQ, GeForce GTX 1070 Mobile | HP Omen X 17-ap0xx i7-7820HK, GeForce GTX 1080 Mobile | MSI GE73VR 7RF Raider i7-7700HQ, GeForce GTX 1070 Mobile | Média da turma Gaming | |
|---|---|---|---|---|---|---|
| Noise | 2% | -4% | 5% | -5% | 10% | |
| desligado / ambiente * (dB) | 30 | 30.4 -1% | 29 3% | 28.3 6% | 30 -0% | 24.1 ? 20% |
| Idle Minimum * (dB) | 32 | 31.2 2% | 32 -0% | 31.5 2% | 33 -3% | 26 ? 19% |
| Idle Average * (dB) | 33 | 35.3 -7% | 33 -0% | 31.6 4% | 34 -3% | 27.4 ? 17% |
| Idle Maximum * (dB) | 34 | 35.3 -4% | 35 -3% | 31.6 7% | 39 -15% | 30.1 ? 11% |
| Load Average * (dB) | 41 | 44.4 -8% | 50 -22% | 36.8 10% | 47 -15% | 43.6 ? -6% |
| Witcher 3 ultra * (dB) | 50 | 41 18% | 52 -4% | 48.2 4% | 49 2% | |
| Load Maximum * (dB) | 54 | 45.2 16% | 56 -4% | 52.1 4% | 54 -0% | 54.2 ? -0% |
* ... menor é melhor
(-) A temperatura máxima no lado superior é 47 °C / 117 F, em comparação com a média de 40.4 °C / 105 F , variando de 21.2 a 68.8 °C para a classe Gaming.
(-) A parte inferior aquece até um máximo de 49 °C / 120 F, em comparação com a média de 43.2 °C / 110 F
(+) Em uso inativo, a temperatura média para o lado superior é 29 °C / 84 F, em comparação com a média do dispositivo de 33.9 °C / ### class_avg_f### F.
(-) Jogando The Witcher 3, a temperatura média para o lado superior é 40.2 °C / 104 F, em comparação com a média do dispositivo de 33.9 °C / ## #class_avg_f### F.
(+) Os apoios para as mãos e o touchpad estão atingindo a temperatura máxima da pele (32 °C / 89.6 F) e, portanto, não estão quentes.
(-) A temperatura média da área do apoio para as mãos de dispositivos semelhantes foi 28.8 °C / 83.8 F (-3.2 °C / -5.8 F).
| MSI GE73 8RF-008 Raider RGB i7-8750H, GeForce GTX 1070 Mobile | Acer Predator Helios 500 PH517-51-79BY i7-8750H, GeForce GTX 1070 Mobile | Schenker XMG Pro 17 i7-7700HQ, GeForce GTX 1070 Mobile | HP Omen X 17-ap0xx i7-7820HK, GeForce GTX 1080 Mobile | MSI GE73VR 7RF Raider i7-7700HQ, GeForce GTX 1070 Mobile | Média da turma Gaming | |
|---|---|---|---|---|---|---|
| Heat | 9% | 4% | 22% | 11% | 2% | |
| Maximum Upper Side * (°C) | 47 | 42.6 9% | 55 -17% | 35.6 24% | 48 -2% | 45.2 ? 4% |
| Maximum Bottom * (°C) | 49 | 37.2 24% | 56 -14% | 39 20% | 49 -0% | 48.1 ? 2% |
| Idle Upper Side * (°C) | 32 | 33.6 -5% | 25 22% | 24.2 24% | 25 22% | 31 ? 3% |
| Idle Bottom * (°C) | 34 | 31 9% | 26 24% | 27.4 19% | 26 24% | 34.2 ? -1% |
* ... menor é melhor
MSI GE73 8RF-008 Raider RGB análise de áudio
(+) | os alto-falantes podem tocar relativamente alto (###valor### dB)
Graves 100 - 315Hz
(±) | graves reduzidos - em média 7% menor que a mediana
(±) | a linearidade dos graves é média (8.1% delta para a frequência anterior)
Médios 400 - 2.000 Hz
(+) | médios equilibrados - apenas 4.8% longe da mediana
(±) | a linearidade dos médios é média (7.1% delta para frequência anterior)
Altos 2 - 16 kHz
(+) | agudos equilibrados - apenas 3.6% longe da mediana
(+) | os máximos são lineares (4.6% delta da frequência anterior)
Geral 100 - 16.000 Hz
(+) | o som geral é linear (10.2% diferença em relação à mediana)
Comparado com a mesma classe
» 5% de todos os dispositivos testados nesta classe foram melhores, 2% semelhantes, 93% piores
» O melhor teve um delta de 6%, a média foi 18%, o pior foi 132%
Comparado com todos os dispositivos testados
» 5% de todos os dispositivos testados foram melhores, 1% semelhantes, 94% piores
» O melhor teve um delta de 4%, a média foi 23%, o pior foi 134%
Acer Predator Helios 500 PH517-51-79BY análise de áudio
(-) | alto-falantes não muito altos (###valor### dB)
Graves 100 - 315Hz
(±) | graves reduzidos - em média 6.5% menor que a mediana
(±) | a linearidade dos graves é média (7.6% delta para a frequência anterior)
Médios 400 - 2.000 Hz
(+) | médios equilibrados - apenas 2.3% longe da mediana
(+) | médios são lineares (5.2% delta para frequência anterior)
Altos 2 - 16 kHz
(+) | agudos equilibrados - apenas 1.9% longe da mediana
(±) | a linearidade dos máximos é média (7.9% delta para frequência anterior)
Geral 100 - 16.000 Hz
(+) | o som geral é linear (11.7% diferença em relação à mediana)
Comparado com a mesma classe
» 11% de todos os dispositivos testados nesta classe foram melhores, 4% semelhantes, 85% piores
» O melhor teve um delta de 6%, a média foi 18%, o pior foi 132%
Comparado com todos os dispositivos testados
» 8% de todos os dispositivos testados foram melhores, 3% semelhantes, 89% piores
» O melhor teve um delta de 4%, a média foi 23%, o pior foi 134%
| desligado | |
| Ocioso | |
| Carga |
|
Key:
min: | |
| MSI GE73 8RF-008 Raider RGB i7-8750H, GeForce GTX 1070 Mobile | Acer Predator Helios 500 PH517-51-79BY i7-8750H, GeForce GTX 1070 Mobile | Schenker XMG Pro 17 i7-7700HQ, GeForce GTX 1070 Mobile | HP Omen X 17-ap0xx i7-7820HK, GeForce GTX 1080 Mobile | MSI GE73VR 7RF Raider i7-7700HQ, GeForce GTX 1070 Mobile | Média da turma Gaming | |
|---|---|---|---|---|---|---|
| Power Consumption | -22% | 5% | -13% | 8% | 0% | |
| Idle Minimum * (Watt) | 15 | 20.4 -36% | 13 13% | 21.6 -44% | 10 33% | 13 ? 13% |
| Idle Average * (Watt) | 20 | 26.5 -33% | 19 5% | 26.4 -32% | 18 10% | 19 ? 5% |
| Idle Maximum * (Watt) | 26 | 37 -42% | 26 -0% | 26.6 -2% | 26 -0% | 24.6 ? 5% |
| Load Average * (Watt) | 97 | 129 -33% | 95 2% | 95.6 1% | 97 -0% | 110.7 ? -14% |
| Witcher 3 ultra * (Watt) | 186 | 186 -0% | 179 4% | 221.7 -19% | 183 2% | |
| Load Maximum * (Watt) | 239 | 216 10% | 220 8% | 199.6 16% | 230 4% | 259 ? -8% |
* ... menor é melhor
| MSI GE73 8RF-008 Raider RGB i7-8750H, GeForce GTX 1070 Mobile, 51 Wh | Acer Predator Helios 500 PH517-51-79BY i7-8750H, GeForce GTX 1070 Mobile, 72 Wh | Schenker XMG Pro 17 i7-7700HQ, GeForce GTX 1070 Mobile, 66 Wh | HP Omen X 17-ap0xx i7-7820HK, GeForce GTX 1080 Mobile, 99 Wh | MSI GE73VR 7RF Raider i7-7700HQ, GeForce GTX 1070 Mobile, 51 Wh | Média da turma Gaming | |
|---|---|---|---|---|---|---|
| Duração da bateria | 42% | 53% | 109% | 10% | 125% | |
| Reader / Idle (h) | 5.1 | 4.2 -18% | 6.6 29% | 5.8 14% | 4.4 -14% | 8.27 ? 62% |
| H.264 (h) | 3.2 | 3.7 16% | 3.4 6% | 8.32 ? 160% | ||
| WiFi v1.3 (h) | 3.1 | 2.9 -6% | 3.6 16% | 5.6 81% | 4 29% | 7.11 ? 129% |
| Load (h) | 0.6 | 1.5 150% | 1.5 150% | 2 233% | 0.7 17% | 1.502 ? 150% |
| Witcher 3 ultra (h) | 1.1 |
Pro
Contra
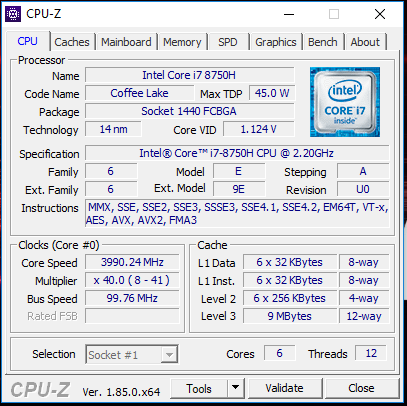
O MSI GE73 8RF-008 tem um processador hexa-core Coffee Lake que possui significativamente mais potência do que a do processador Core i7-7700HQ quad-core antecessor. O aumento no desempenho é significativamente maior no lado multi-thread do que em cenários single-core.
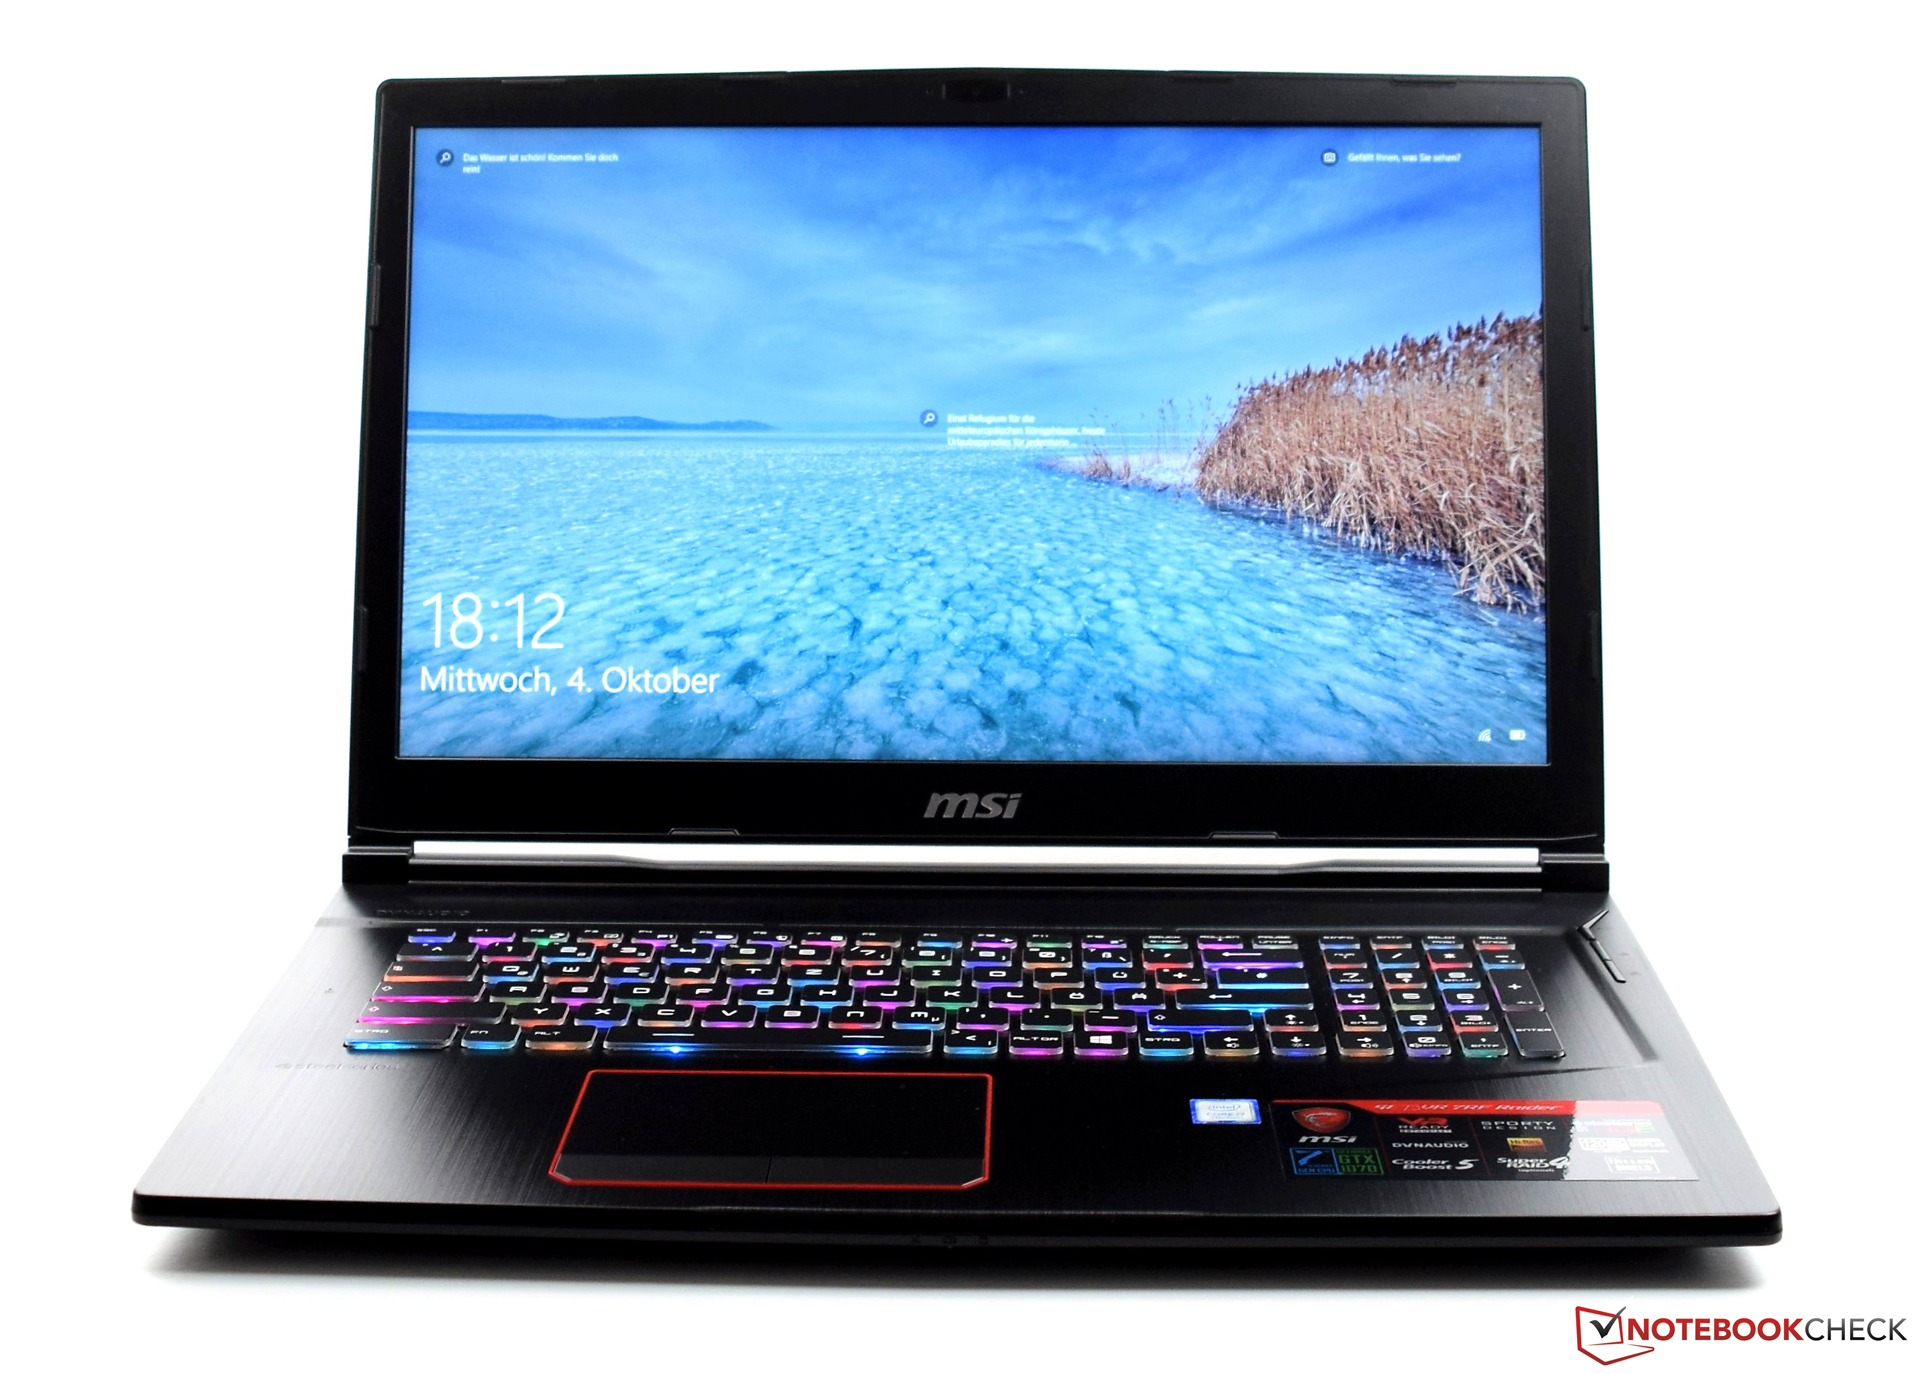
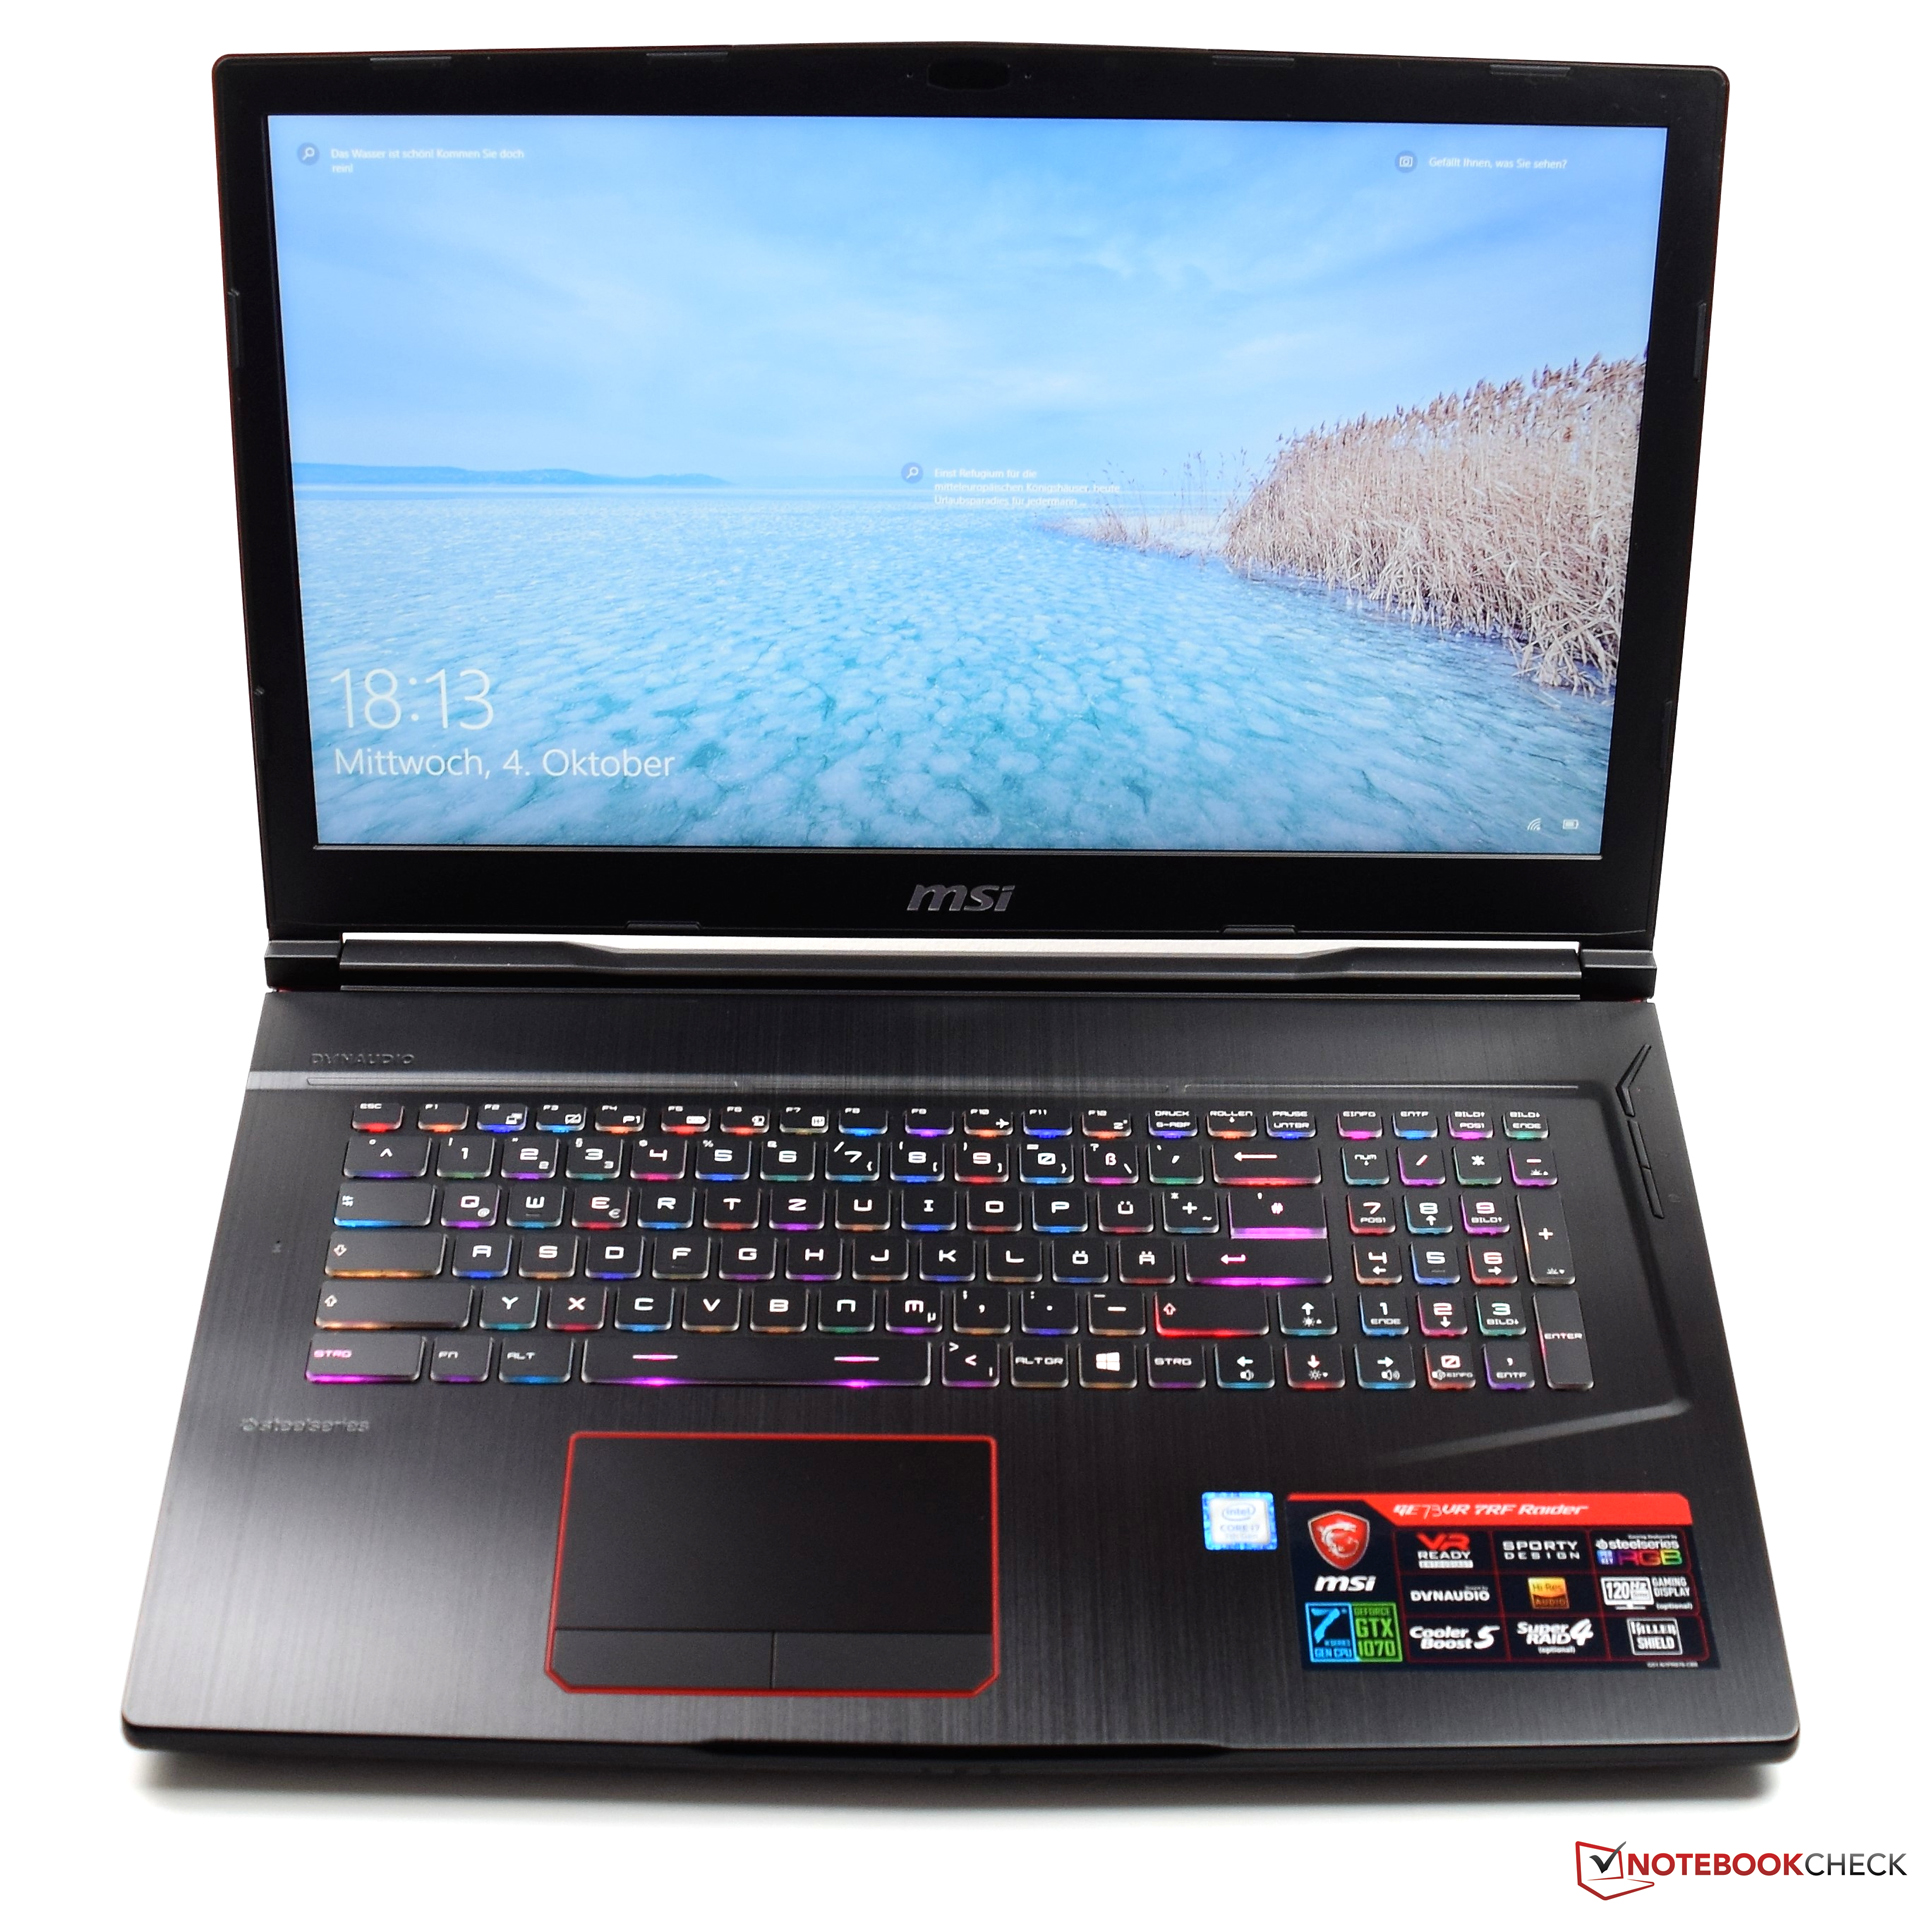
Em combinação com a GeForce GTX 1070, o processador roda fluentemente todos os jogos atuais em resolução Full-HD com detalhes altos a máximos em seu painel de 120-Hz. A tela mate Full HD deleita com uma excelente relação de contraste e tempos de resposta rápidos. No entanto, o brilho máximo poderia ser ainda mais alto. Apesar de não ser uma tela IPS, ela oferece ângulos de visão visivelmente mais amplos do que estamos acostumados com os modelos TN.
Com o GE73 8RF, a MSI oferece um portátil para jogos bem feito. Apesar de seu preço de pouco mais de $2.000, não é desprovido de fraquezas.
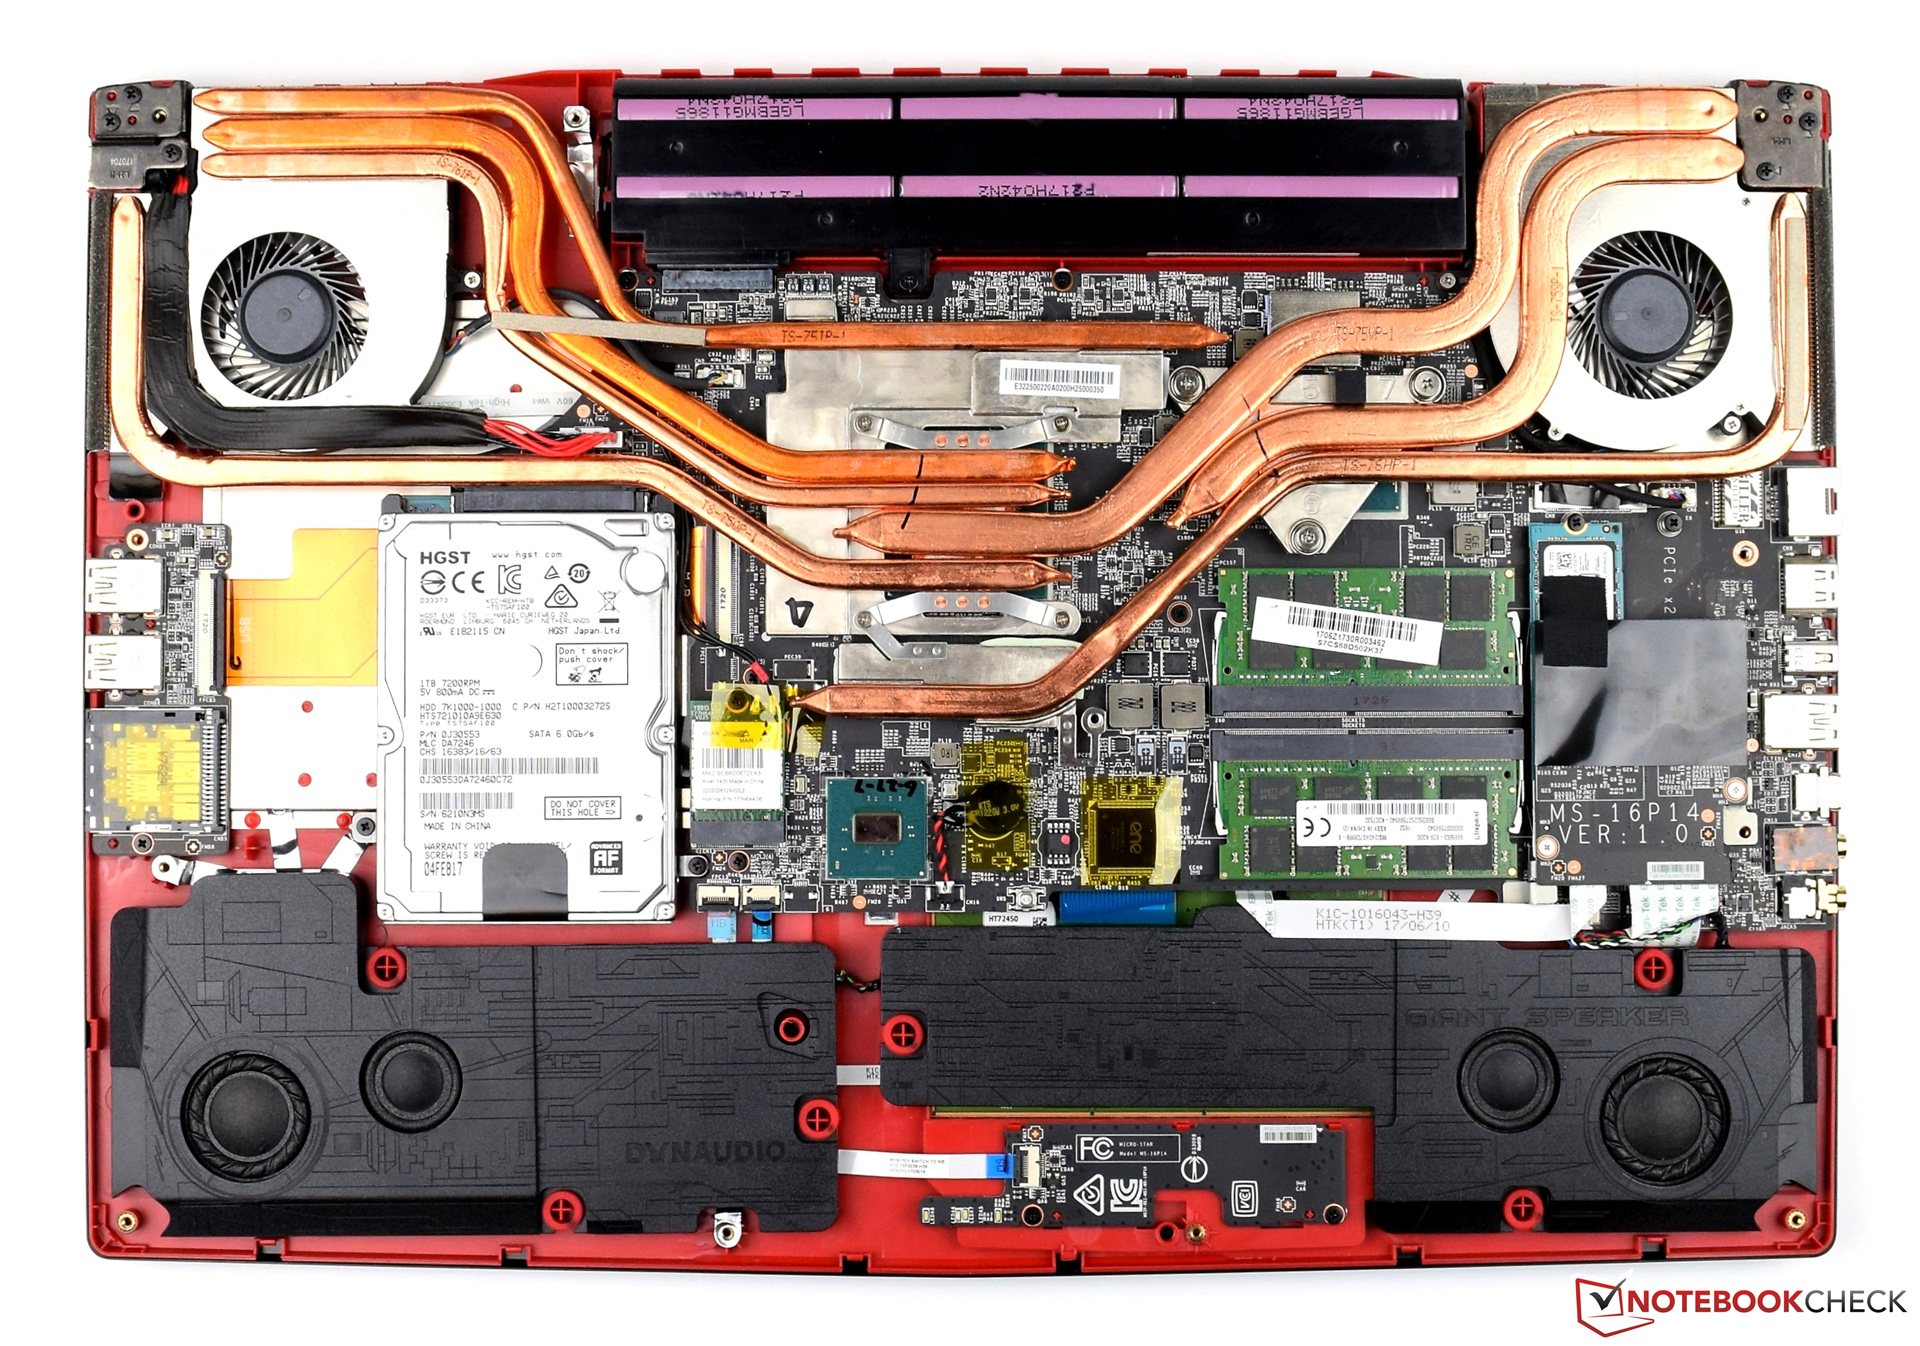
O nível ruído está em um nível normal para um portátil de jogos de sua classe. O exterior do dispositivo não esquenta excessivamente. Um SSD SATA III garante um sistema ágil. No entanto, ainda há espaço para melhorias: Alternativamente, um SSD NVMe muito mais rápido poderia ter sido usado em seu lugar. Na verdade, esperamos que seja um equipamento padrão em um portátil de $2.000, como o GE73.
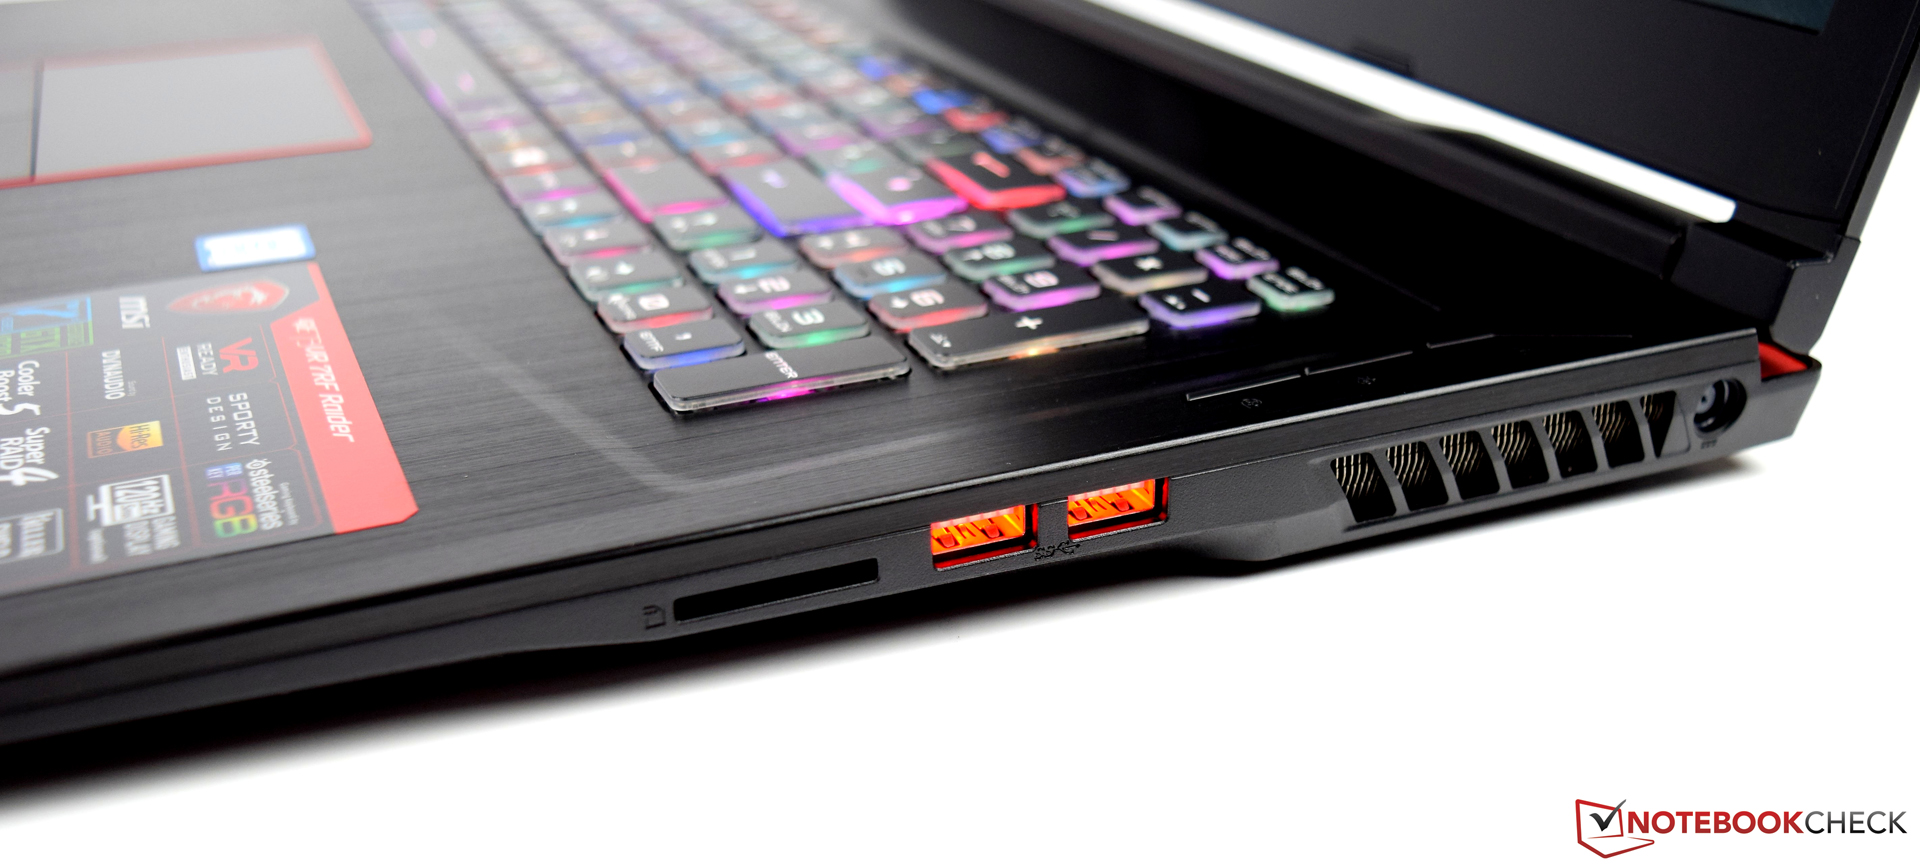
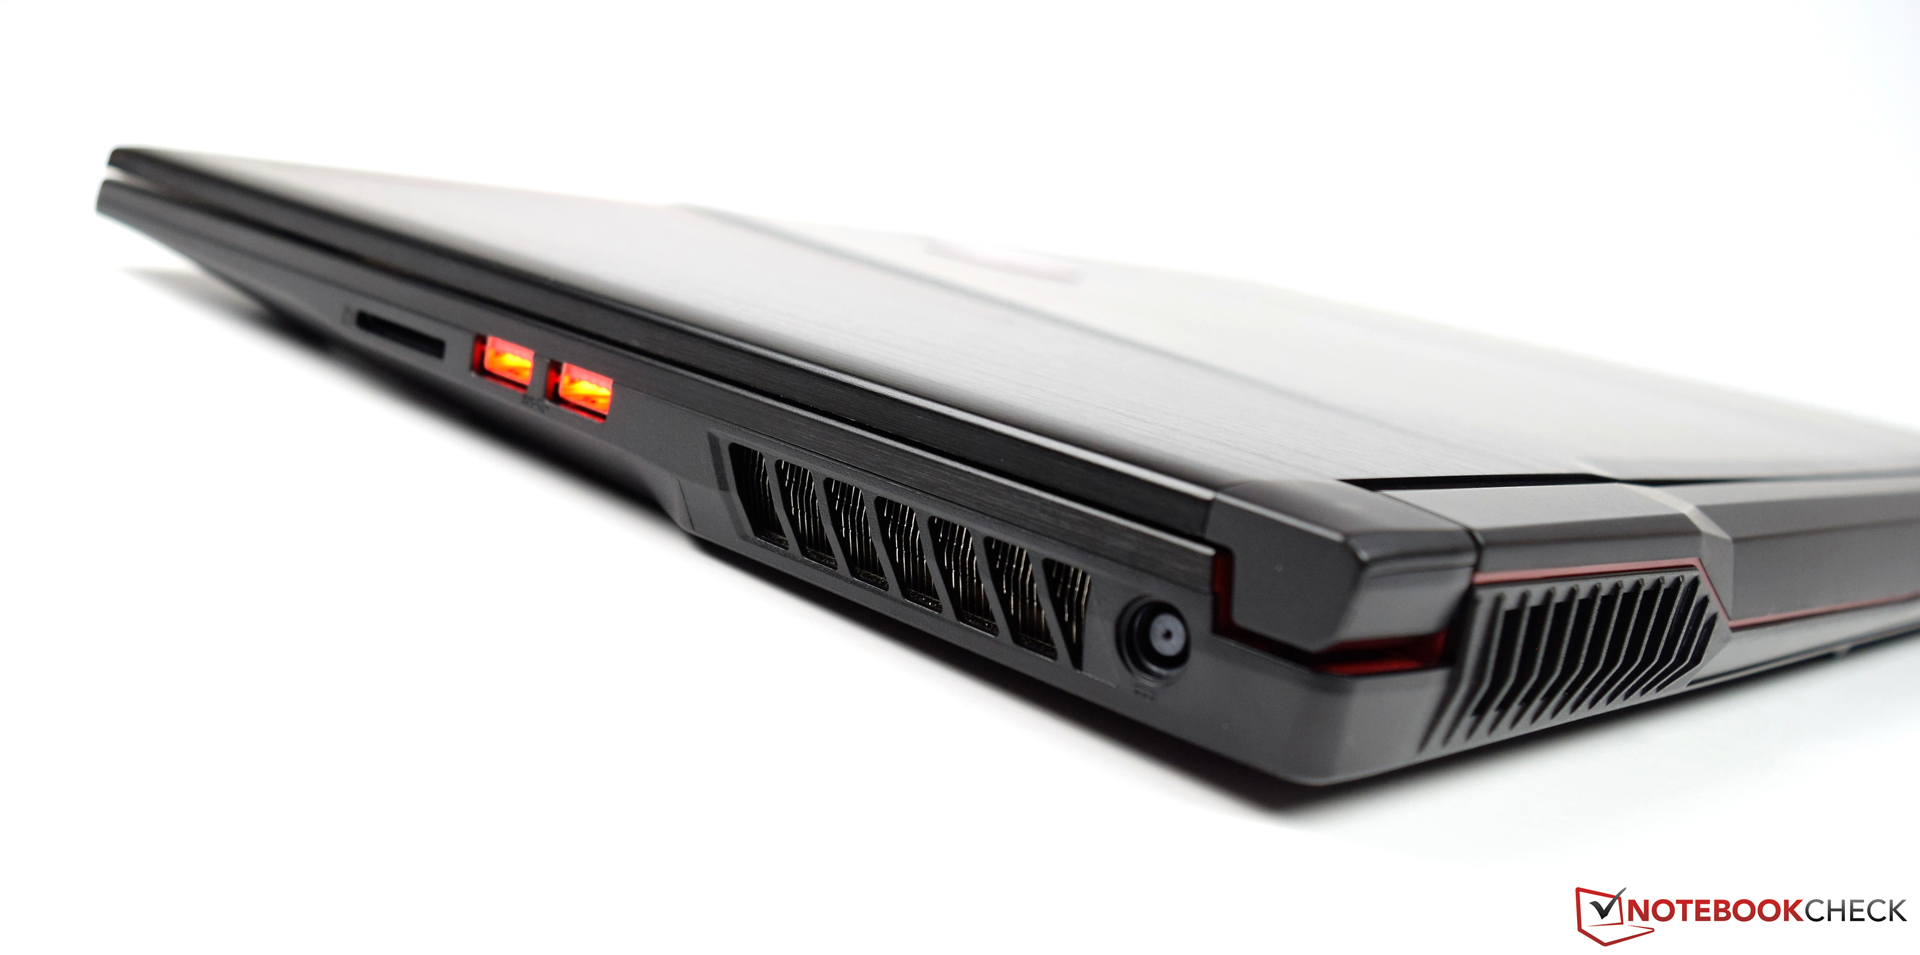
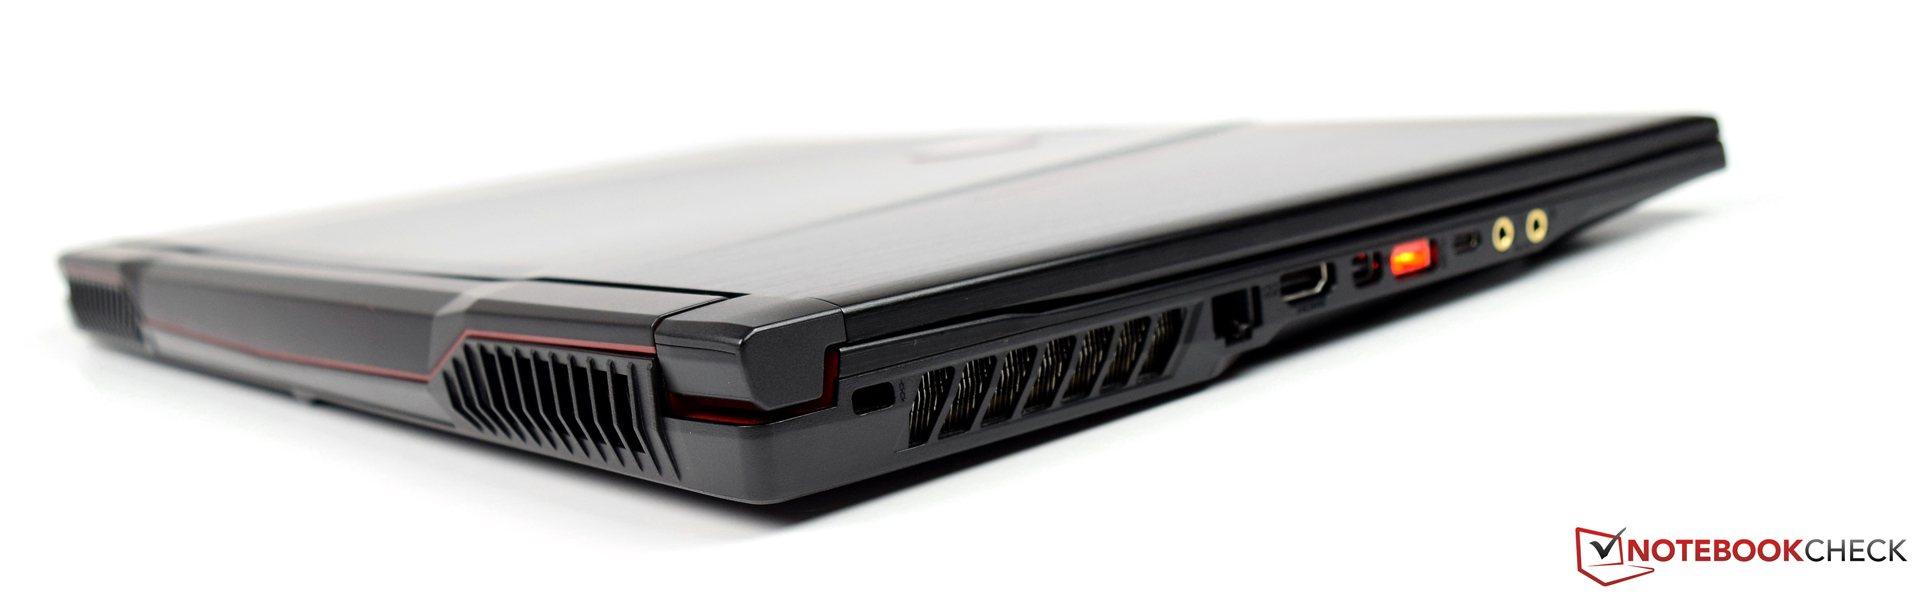
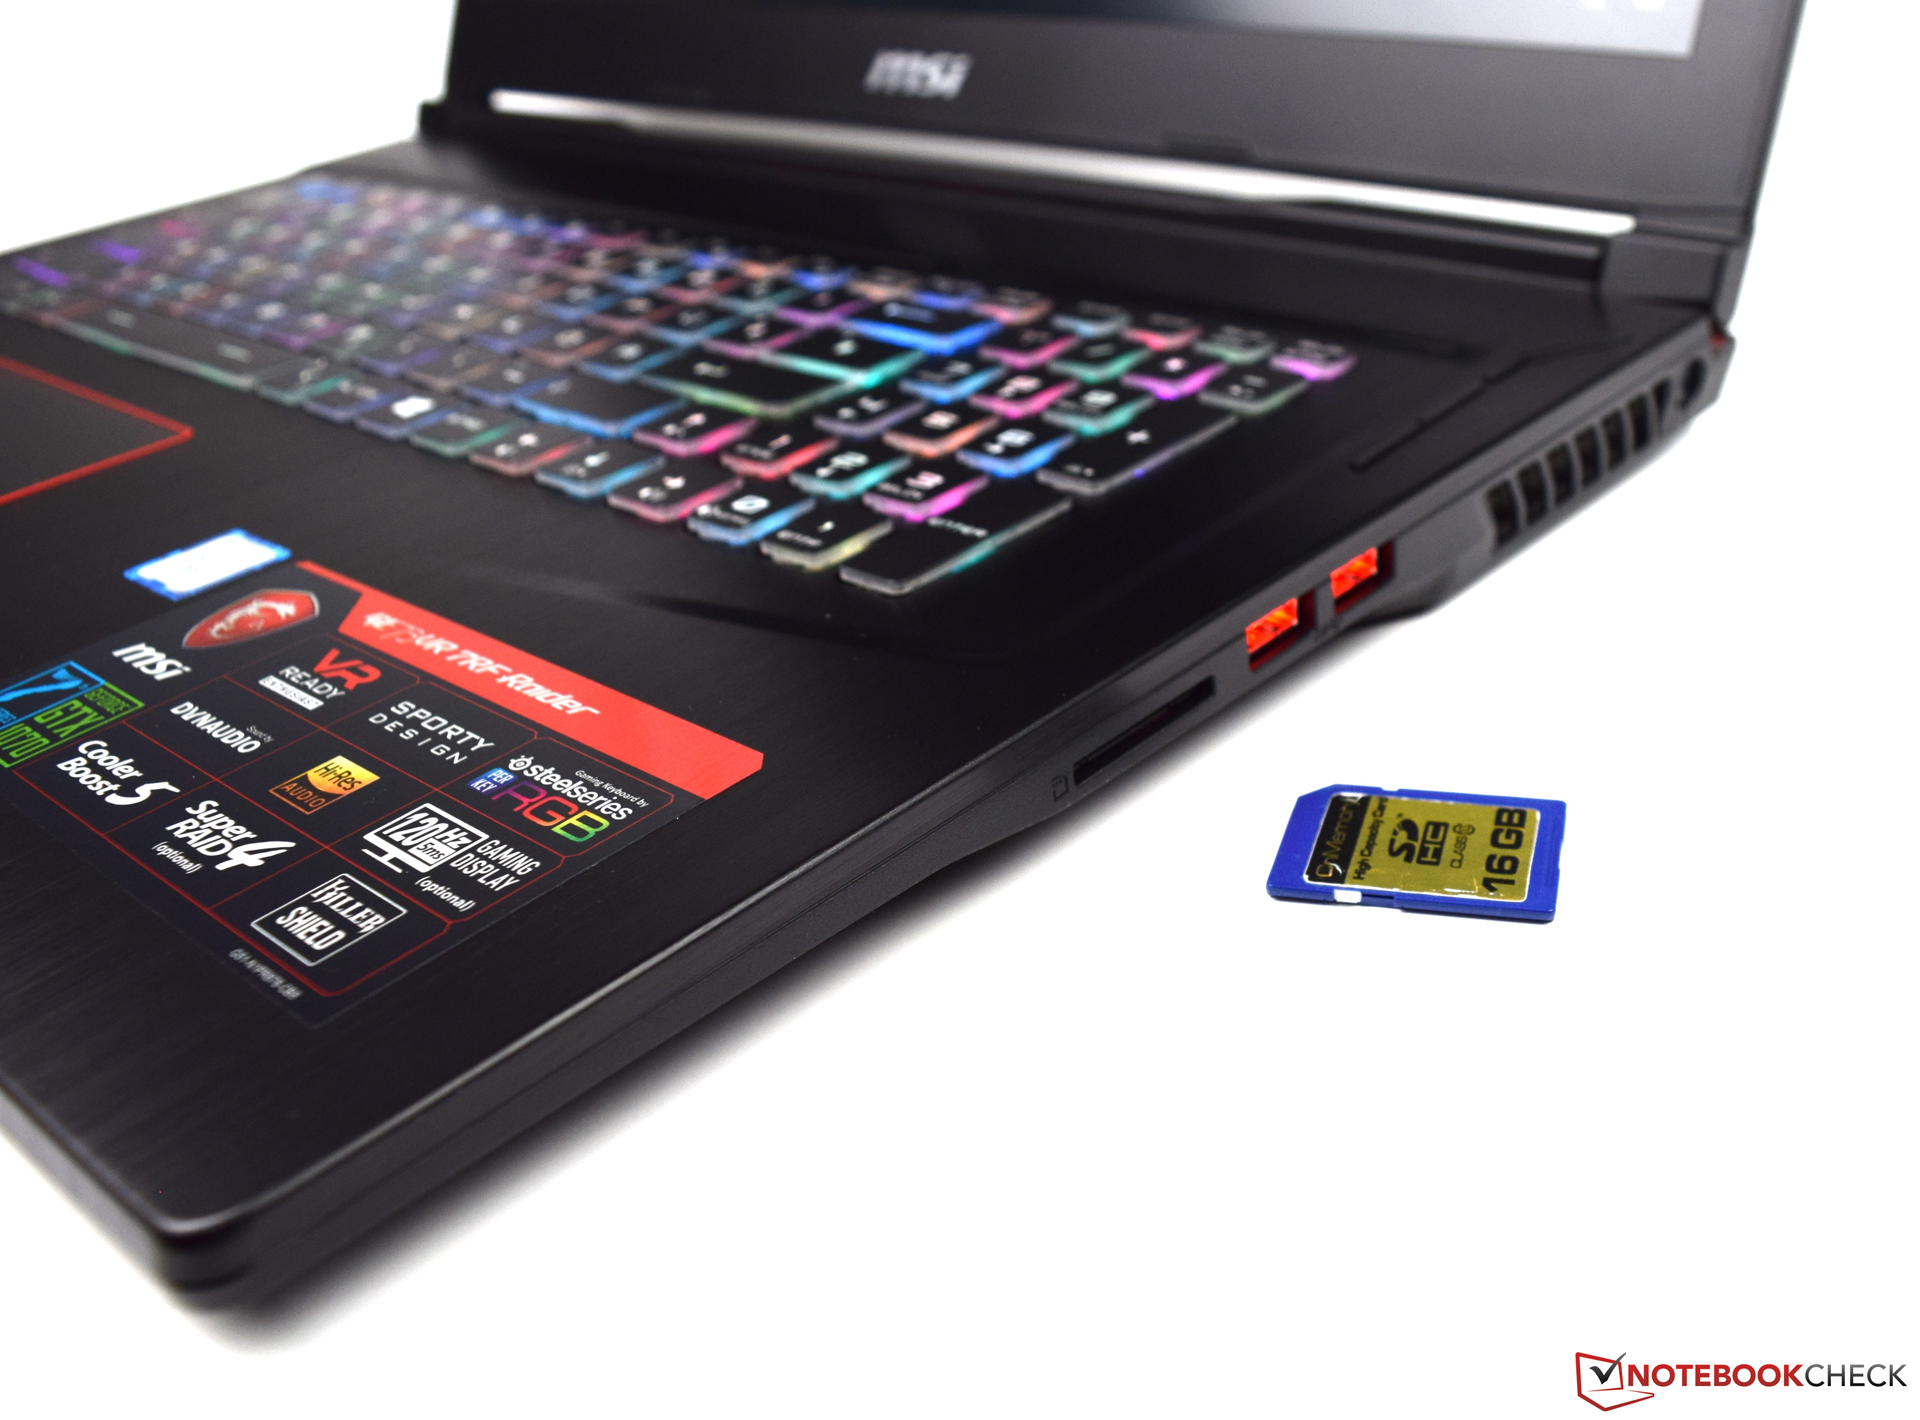
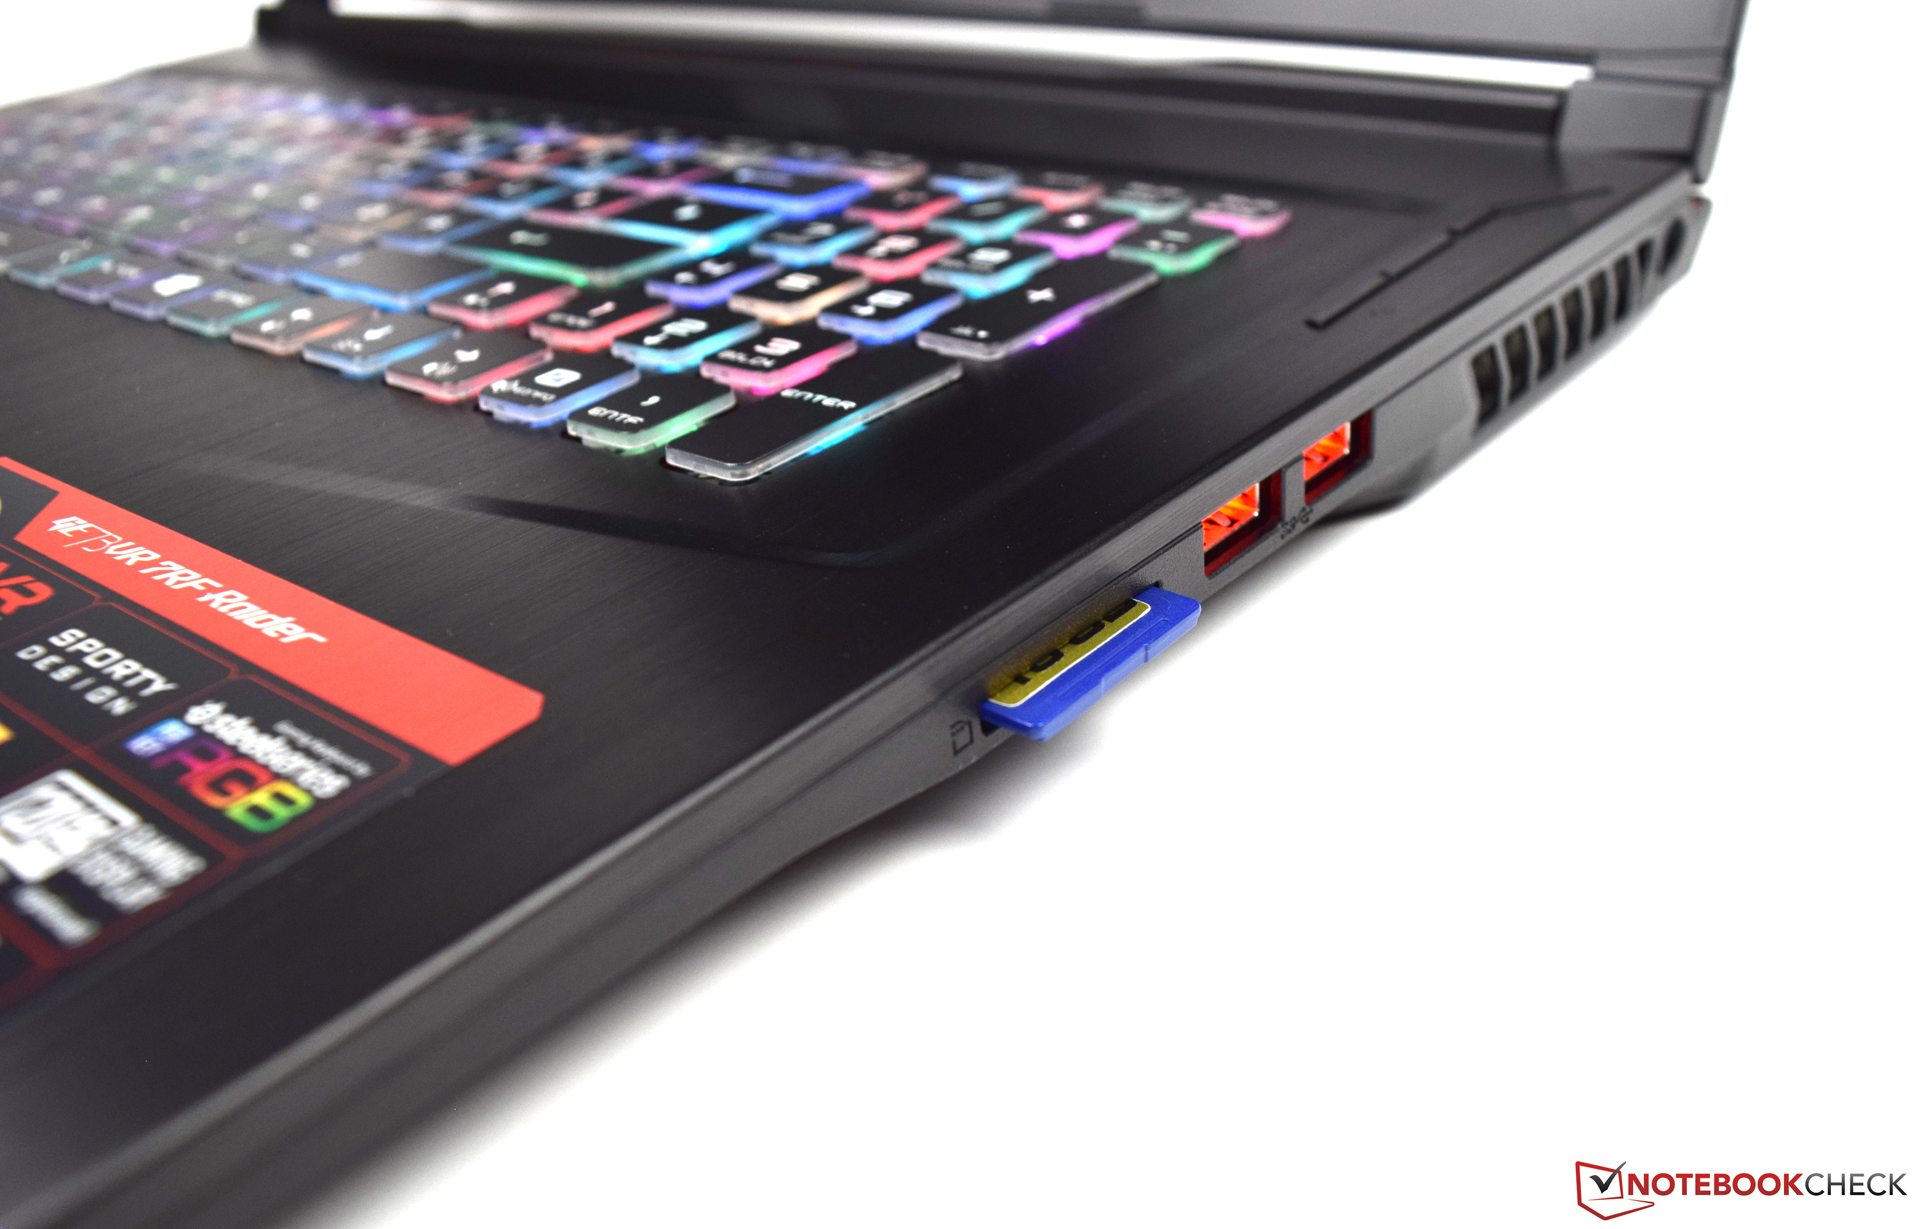
O GE73 8RF tem algumas características distintas em relação ao seu antecessor, o GE73VR 7RF, que não chamam a atenção imediatamente: O GE73 8RF possui alto-falantes mais potentes (3 watts em vez de 2 watts) e uma segunda porta USB 3.1 Gen 2. O leitor de cartões de memória afeta negativamente: ele opera significativamente mais lento que o do predecessor.
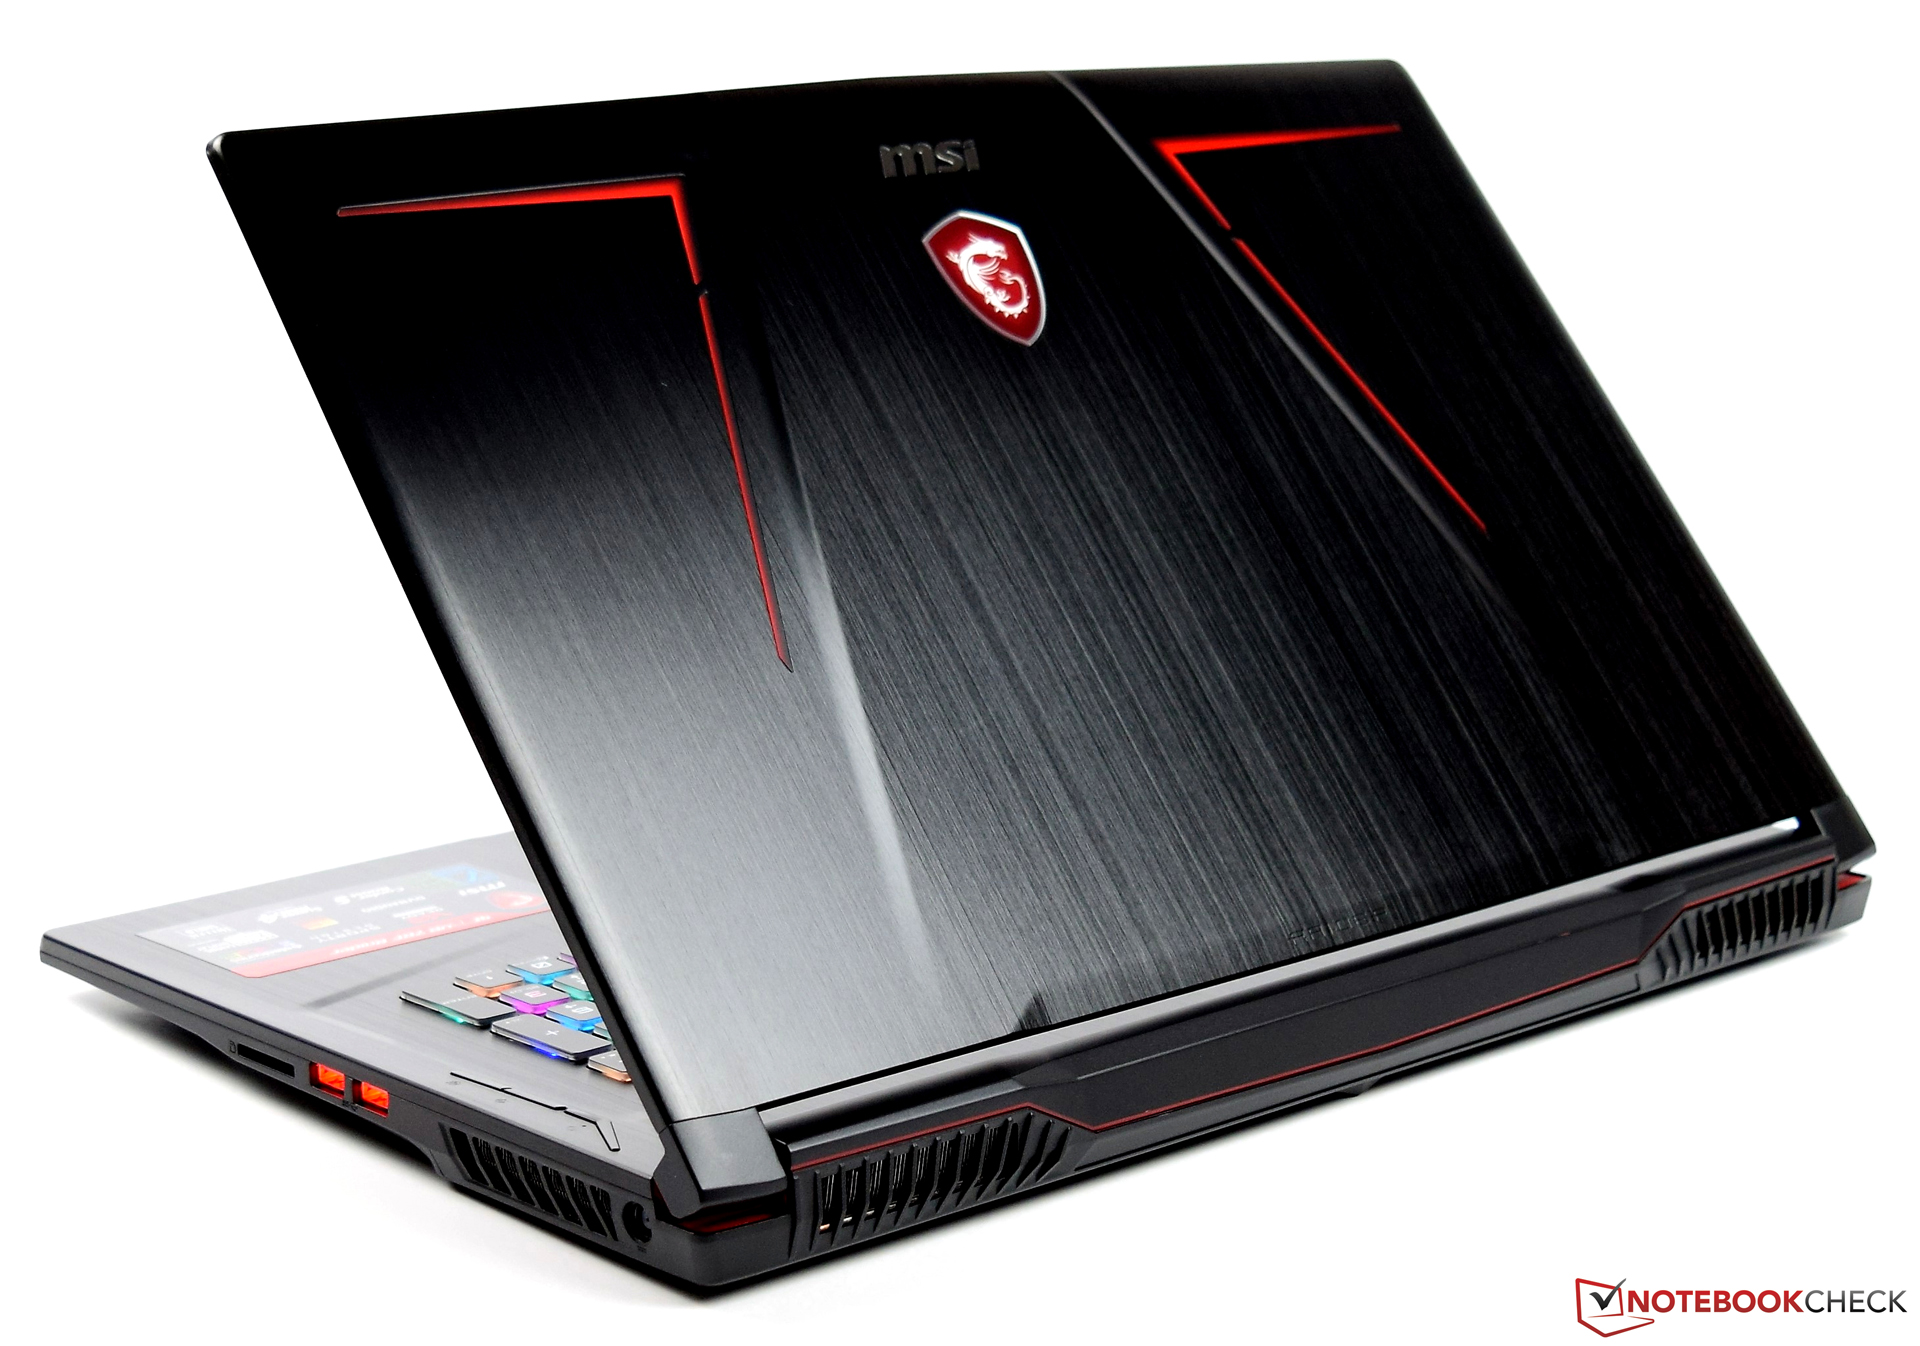
MSI GE73 8RF-008 Raider RGB
- 06/13/2018 v6 (old)
Sascha Mölck