Breve Análise do Portátil Acer Predator Helios 500 (GTX 1070, i7-8750H)
| |||||||||||||||||||||||||
iluminação: 82 %
iluminação com acumulador: 340 cd/m²
Contraste: 479:1 (Preto: 0.7 cd/m²)
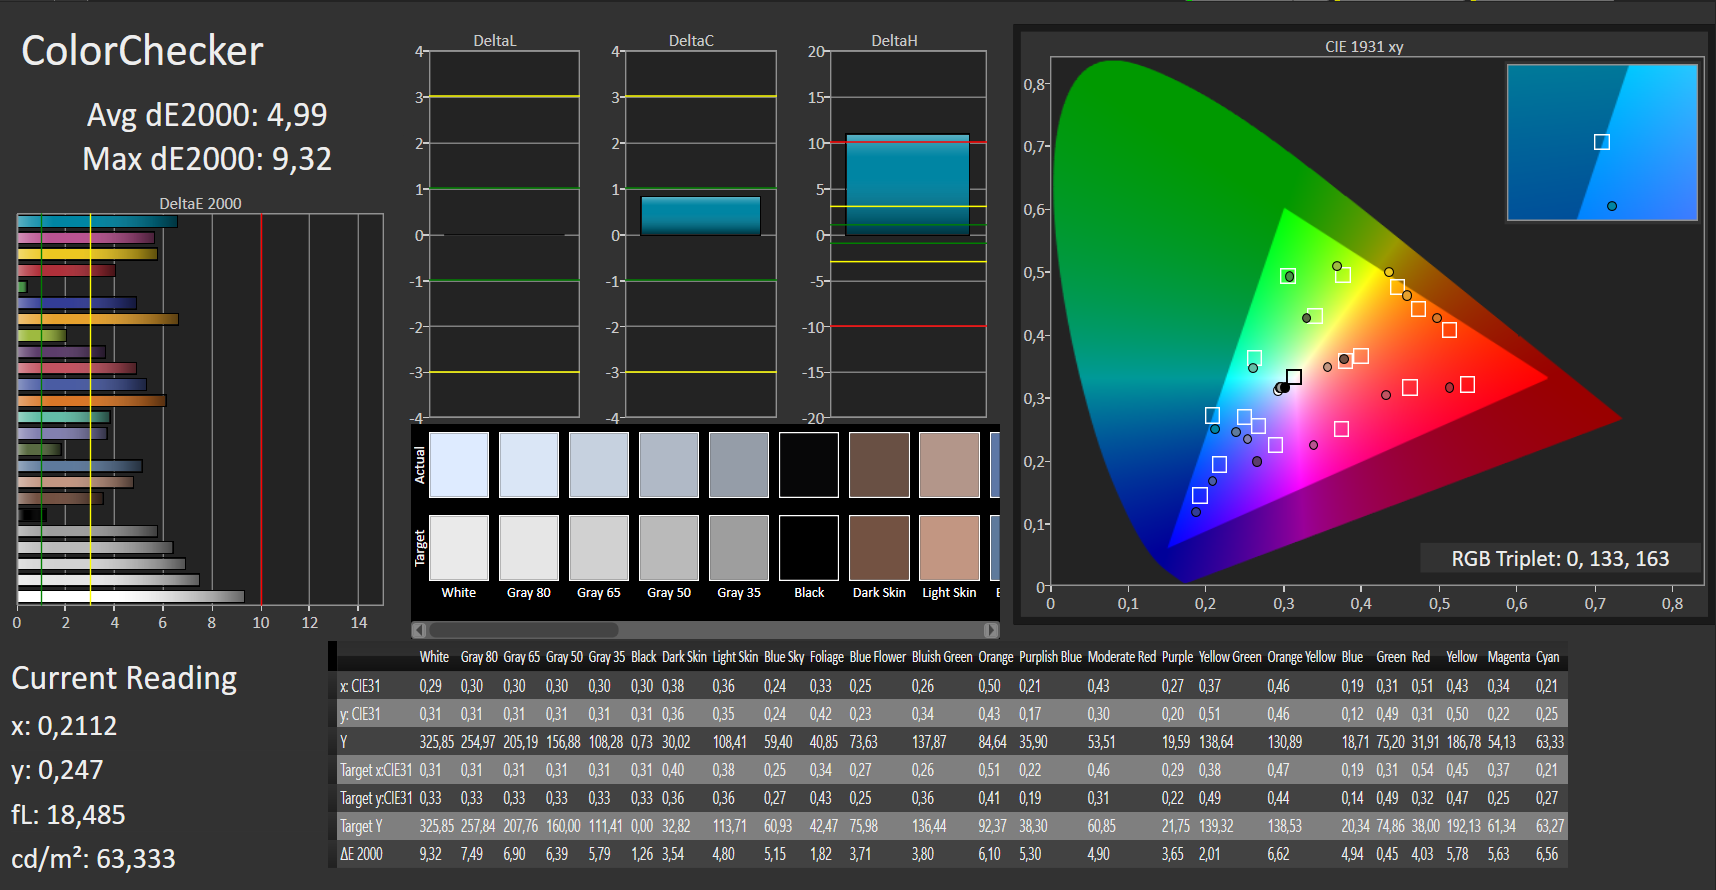
ΔE ColorChecker Calman: 4.99 | ∀{0.5-29.43 Ø4.71}
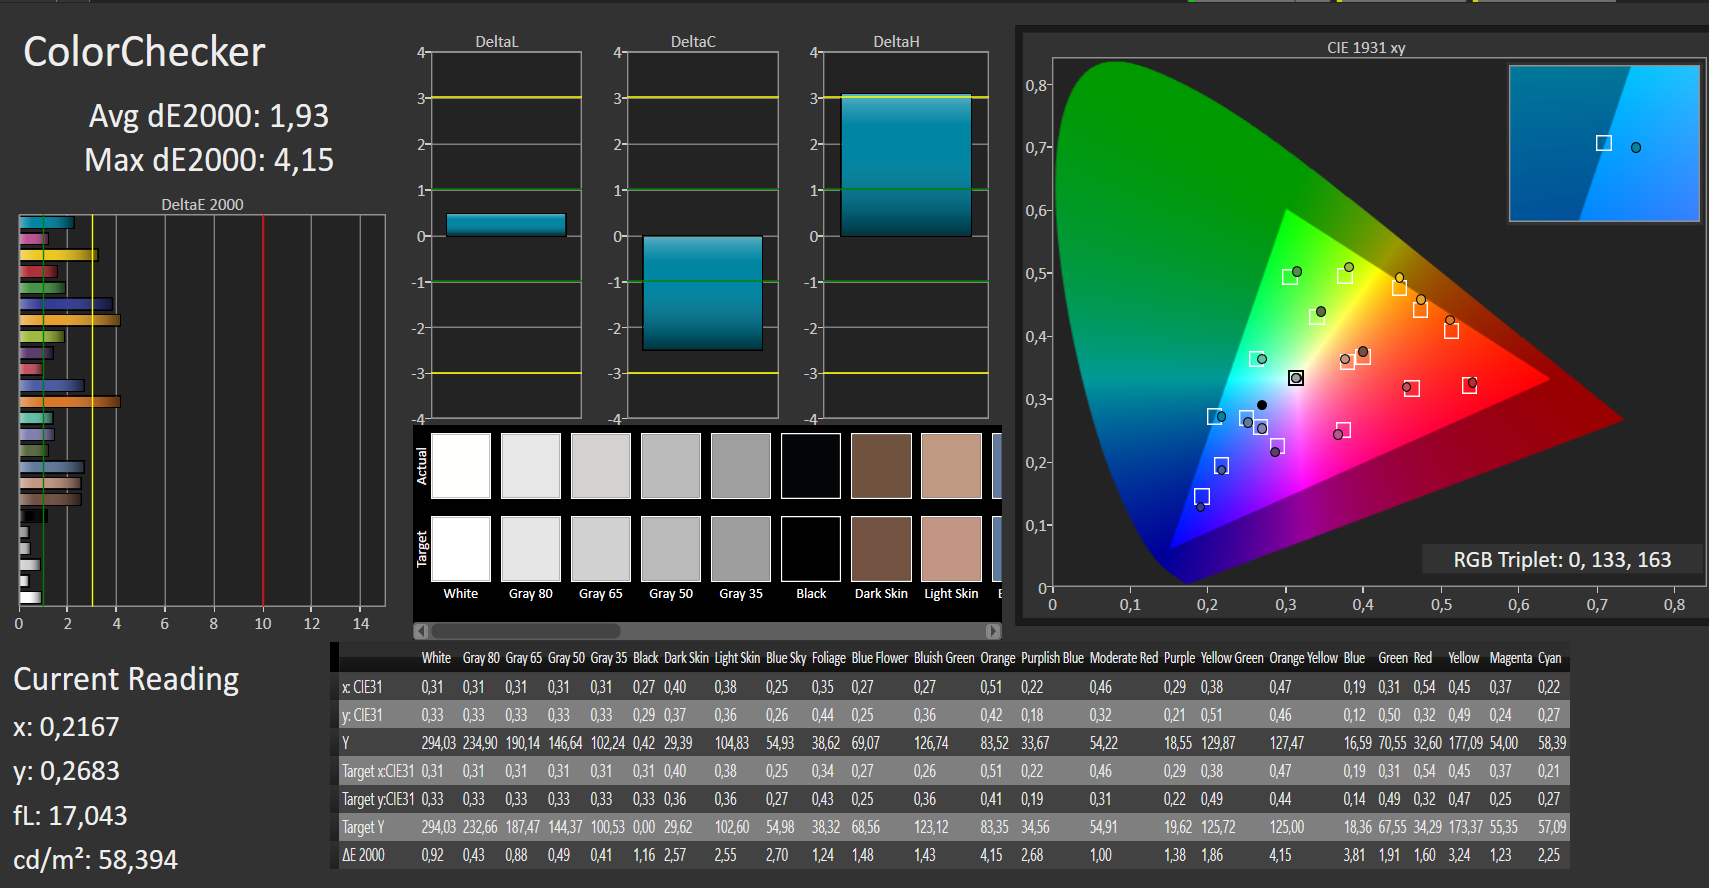
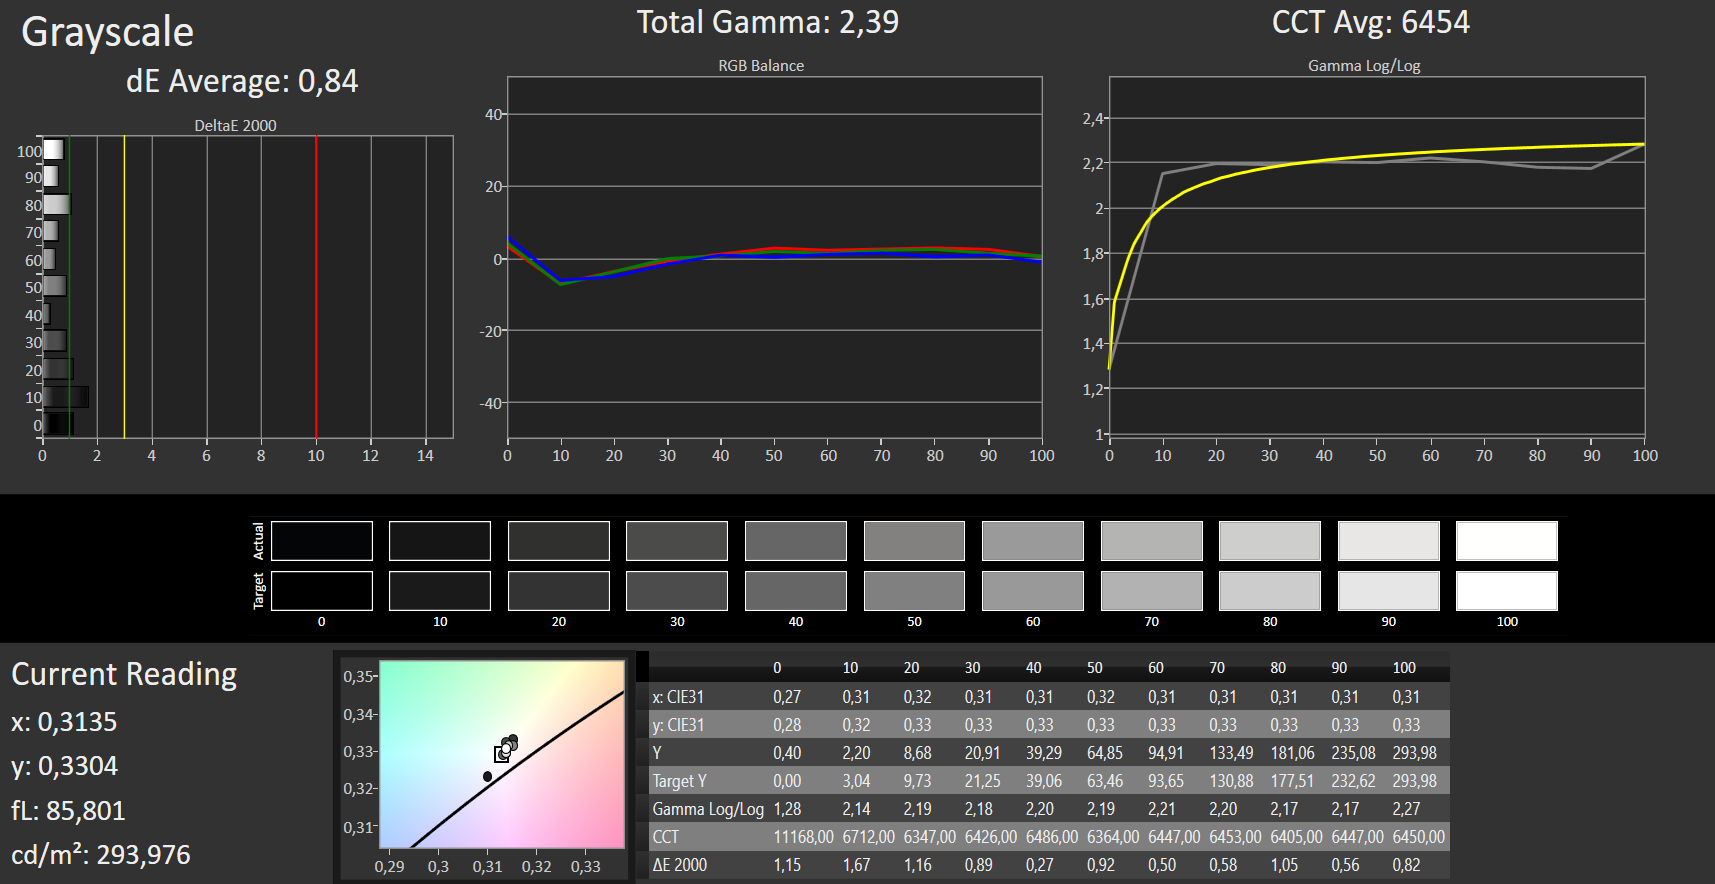
calibrated: 1.93
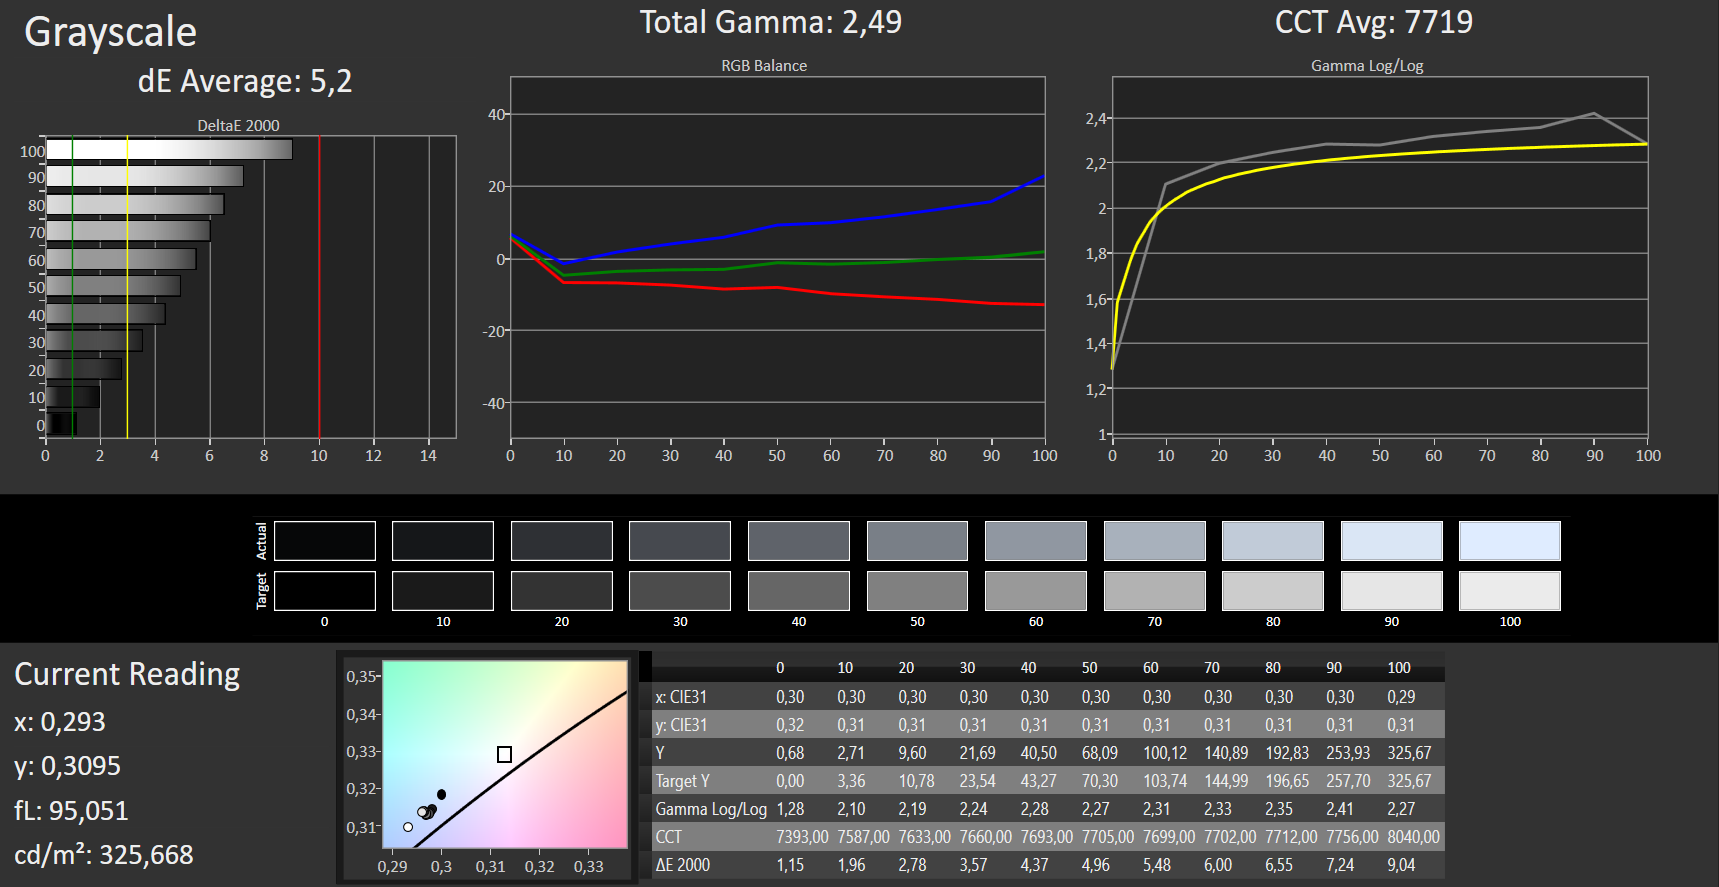
ΔE Greyscale Calman: 5.2 | ∀{0.09-98 Ø4.96}
91% sRGB (Argyll 1.6.3 3D)
59% AdobeRGB 1998 (Argyll 1.6.3 3D)
65.6% AdobeRGB 1998 (Argyll 3D)
91.3% sRGB (Argyll 3D)
64.4% Display P3 (Argyll 3D)
Gamma: 2.49
CCT: 7719 K
| Acer Predator Helios 500 PH517-51-79BY AUO_B173HAN03, , 1920x1080, 17.3" | Asus G703 AUO B173HAN03.0 (AUO309D), , 1920x1080, 17.3" | MSI GT75 8RG-090 Titan CMN N173HHE-G32 (CMN1747), , 1920x1080, 17.3" | HP Omen X 17-ap0xx AU Optronics B173HW01, , 1920x1080, 17.3" | Razer Blade Pro RZ09-0220 ID: AUO169D, Name: AU Optronics B173HAN01.6, , 1920x1080, 17.3" | Acer Predator 17 G9-793-70PJ AU Optronics B173ZAN01.0 (AUO109B), , 3840x2160, 17.3" | |
|---|---|---|---|---|---|---|
| Display | 2% | 27% | -2% | -1% | 31% | |
| Display P3 Coverage (%) | 64.4 | 65.5 2% | 90.9 41% | 63.7 -1% | 64 -1% | 86.4 34% |
| sRGB Coverage (%) | 91.3 | 92.4 1% | 100 10% | 88.2 -3% | 89.7 -2% | 99.9 9% |
| AdobeRGB 1998 Coverage (%) | 65.6 | 66.6 2% | 86.2 31% | 64.2 -2% | 64.9 -1% | 99.1 51% |
| Response Times | -25% | 41% | -233% | -238% | -221% | |
| Response Time Grey 50% / Grey 80% * (ms) | 14 ? | 17.6 ? -26% | 8 ? 43% | 44 ? -214% | 36.8 ? -163% | 50 ? -257% |
| Response Time Black / White * (ms) | 9 ? | 11.2 ? -24% | 5.6 ? 38% | 31.6 ? -251% | 37.2 ? -313% | 25.6 ? -184% |
| PWM Frequency (Hz) | 26000 ? | |||||
| Screen | 18% | 35% | 24% | 27% | 34% | |
| Brightness middle (cd/m²) | 335 | 274 -18% | 240 -28% | 343 2% | 367.4 10% | 343 2% |
| Brightness (cd/m²) | 300 | 268 -11% | 248 -17% | 332 11% | 363 21% | 328 9% |
| Brightness Distribution (%) | 82 | 80 -2% | 83 1% | 83 1% | 86 5% | 84 2% |
| Black Level * (cd/m²) | 0.7 | 0.29 59% | 0.22 69% | 0.35 50% | 0.32 54% | 0.29 59% |
| Contrast (:1) | 479 | 945 97% | 1091 128% | 980 105% | 1148 140% | 1183 147% |
| Colorchecker dE 2000 * | 4.99 | 3.99 20% | 2.14 57% | 3.35 33% | 3.8 24% | 4.01 20% |
| Colorchecker dE 2000 max. * | 9.32 | 7.33 21% | 5.04 46% | 5.62 40% | 10.4 -12% | 6.03 35% |
| Colorchecker dE 2000 calibrated * | 1.93 | 1.79 7% | 1.54 20% | 2.5 -30% | ||
| Greyscale dE 2000 * | 5.2 | 4.14 20% | 1.62 69% | 2.4 54% | 3.5 33% | 4.7 10% |
| Gamma | 2.49 88% | 2.58 85% | 2.28 96% | 2.35 94% | 2.18 101% | 2.4 92% |
| CCT | 7719 84% | 7352 88% | 6846 95% | 6495 100% | 6467 101% | 6451 101% |
| Color Space (Percent of AdobeRGB 1998) (%) | 59 | 60 2% | 77 31% | 57 -3% | 58.1 -2% | 88 49% |
| Color Space (Percent of sRGB) (%) | 91 | 92 1% | 100 10% | 88 -3% | 89.3 -2% | 100 10% |
| Média Total (Programa/Configurações) | -2% /
9% | 34% /
34% | -70% /
-13% | -71% /
-14% | -52% /
-0% |
* ... menor é melhor

Exibir tempos de resposta
| ↔ Tempo de resposta preto para branco | ||
|---|---|---|
| 9 ms ... ascensão ↗ e queda ↘ combinadas | ↗ 5 ms ascensão | 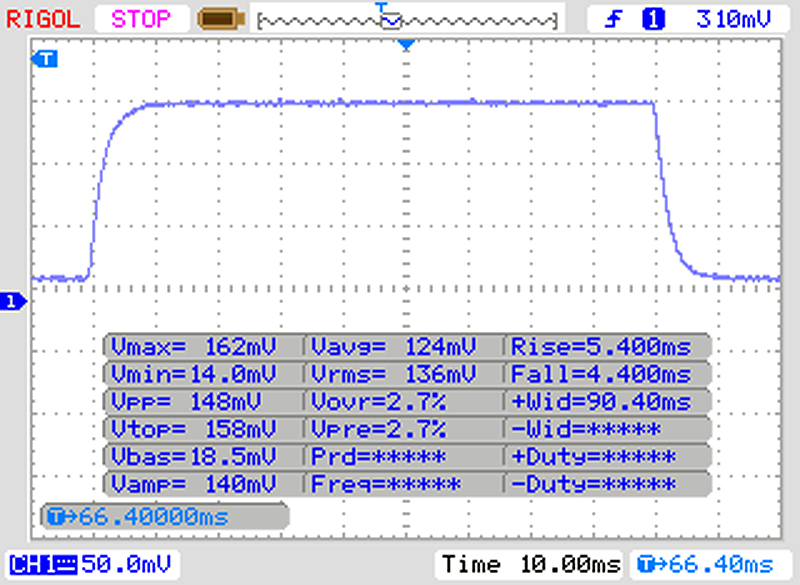 |
| ↘ 4 ms queda | ||
| A tela mostra taxas de resposta rápidas em nossos testes e deve ser adequada para jogos. Em comparação, todos os dispositivos testados variam de 0.1 (mínimo) a 240 (máximo) ms. » 25 % de todos os dispositivos são melhores. Isso significa que o tempo de resposta medido é melhor que a média de todos os dispositivos testados (19.8 ms). | ||
| ↔ Tempo de resposta 50% cinza a 80% cinza | ||
| 14 ms ... ascensão ↗ e queda ↘ combinadas | ↗ 7 ms ascensão | 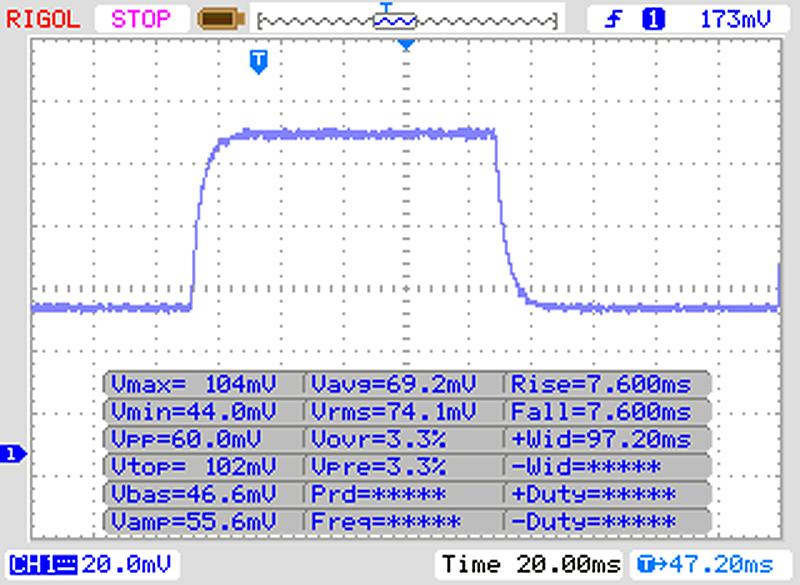 |
| ↘ 7 ms queda | ||
| A tela mostra boas taxas de resposta em nossos testes, mas pode ser muito lenta para jogadores competitivos. Em comparação, todos os dispositivos testados variam de 0.165 (mínimo) a 636 (máximo) ms. » 28 % de todos os dispositivos são melhores. Isso significa que o tempo de resposta medido é melhor que a média de todos os dispositivos testados (31 ms). | ||
Cintilação da tela / PWM (modulação por largura de pulso)
| Tela tremeluzindo / PWM não detectado | 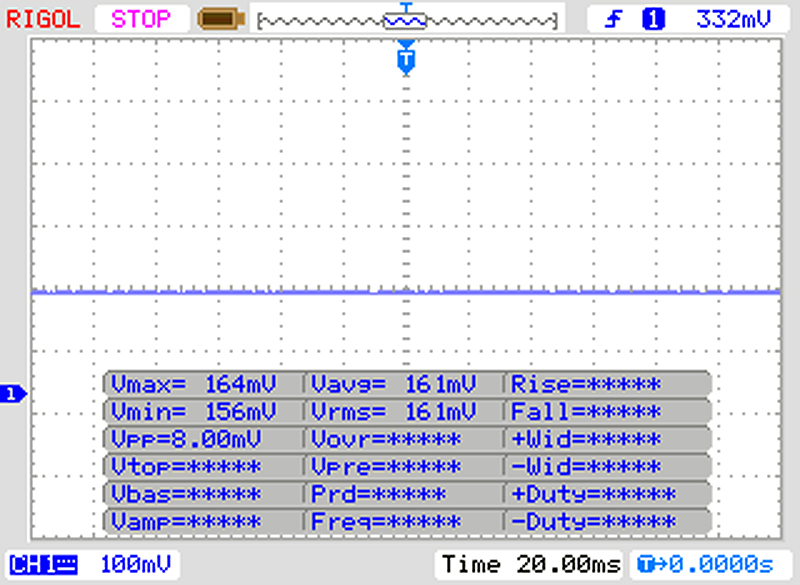 | ||
[pwm_comparison] Em comparação: 52 % de todos os dispositivos testados não usam PWM para escurecer a tela. Se PWM foi detectado, uma média de 7754 (mínimo: 5 - máximo: 343500) Hz foi medida. | |||

| PCMark 8 Home Score Accelerated v2 | 5431 pontos | |
| PCMark 8 Work Score Accelerated v2 | 5872 pontos | |
| PCMark 10 Score | 5589 pontos | |
Ajuda | ||
| Acer Predator Helios 500 PH517-51-79BY SK hynix SSD Canvas SC300 HFS256GD9MNE-6200A | Asus G703 2x Samsung SM961 MZVKW512HMJP NVMe (RAID 0) | MSI GT75 8RG-090 Titan 2x Samsung PM961 MZVLW256HEHP (RAID 0) | HP Omen X 17-ap0xx Samsung PM961 MZVLW256HEHP | Razer Blade Pro RZ09-0220 Samsung SSD PM951 MZVLV256HCHP | Média SK hynix SSD Canvas SC300 HFS256GD9MNE-6200A | |
|---|---|---|---|---|---|---|
| CrystalDiskMark 5.2 / 6 | 157% | 96% | 67% | 17% | 0% | |
| Write 4K (MB/s) | 79.2 | 160.7 103% | 111.8 41% | 148.8 88% | 155.1 96% | 79.2 ? 0% |
| Read 4K (MB/s) | 39.69 | 54.8 38% | 42.09 6% | 46.64 18% | 44.22 11% | 39.7 ? 0% |
| Write Seq (MB/s) | 950 | 2738 188% | 2288 141% | 1216 28% | 311.2 -67% | 950 ? 0% |
| Read Seq (MB/s) | 1087 | 3346 208% | 3321 206% | 1461 34% | 1247 15% | 1087 ? 0% |
| Write 4K Q32T1 (MB/s) | 189.6 | 612 223% | 308.3 63% | 444 134% | 310.3 64% | 189.6 ? 0% |
| Read 4K Q32T1 (MB/s) | 304 | 709 133% | 364.9 20% | 535 76% | 551 81% | 304 ? 0% |
| Write Seq Q32T1 (MB/s) | 948 | 3082 225% | 2440 157% | 1210 28% | 311.5 -67% | 948 ? 0% |
| Read Seq Q32T1 (MB/s) | 1488 | 3505 136% | 3485 134% | 3450 132% | 1560 5% | 1488 ? 0% |

| 3DMark Fire Strike Score | 15019 pontos | |
| 3DMark Time Spy Score | 5741 pontos | |
Ajuda | ||
| Dirt Rally - 1920x1080 Ultra Preset AA:4x MS | |
| Acer Predator Helios 500 PH517-51-79BY | |
| Média NVIDIA GeForce GTX 1070 Mobile (84.7 - 119, n=3) | |
| The Witcher 3 - 1920x1080 Ultra Graphics & Postprocessing (HBAO+) | |
| Média da turma Gaming (104.7 - 240, n=7, últimos 2 anos) | |
| Asus G703 | |
| MSI GT75 8RG-090 Titan | |
| HP Omen X 17-ap0xx | |
| Acer Predator 17 G9-793-70PJ | |
| Média NVIDIA GeForce GTX 1070 Mobile (48.2 - 68.4, n=41) | |
| Acer Predator Helios 500 PH517-51-79BY | |
| Razer Blade Pro RZ09-0220 | |
| Fallout 4 - 1920x1080 Ultra Preset AA:T AF:16x | |
| HP Omen X 17-ap0xx | |
| Acer Predator Helios 500 PH517-51-79BY | |
| Média NVIDIA GeForce GTX 1070 Mobile (95.4 - 122, n=9) | |
| Razer Blade Pro RZ09-0220 | |
| Rise of the Tomb Raider - 1920x1080 Very High Preset AA:FX AF:16x | |
| HP Omen X 17-ap0xx | |
| Média NVIDIA GeForce GTX 1070 Mobile (79.1 - 102.5, n=25) | |
| Acer Predator Helios 500 PH517-51-79BY | |
| Razer Blade Pro RZ09-0220 | |
| Resident Evil 7 - 1920x1080 Very High / On AA:FXAA+T | |
| HP Omen X 17-ap0xx | |
| Acer Predator Helios 500 PH517-51-79BY | |
| Média NVIDIA GeForce GTX 1070 Mobile (130 - 162.3, n=6) | |
| Playerunknown's Battlegrounds (PUBG) - 1920x1080 Ultra Preset | |
| Acer Predator Helios 500 PH517-51-79BY | |
| HP Omen X 17-ap0xx | |
| Média NVIDIA GeForce GTX 1070 Mobile (70 - 95, n=5) | |
| F1 2017 - 1920x1080 Ultra High Preset AA:T AF:16x | |
| HP Omen X 17-ap0xx | |
| Acer Predator Helios 500 PH517-51-79BY | |
| Média NVIDIA GeForce GTX 1070 Mobile (88 - 102, n=5) | |
| Razer Blade Pro RZ09-0220 | |
| Call of Duty WWII - 1920x1080 Extra / On AA:Filmic T2X SM | |
| Asus G703 | |
| Média NVIDIA GeForce GTX 1070 Mobile (95 - 122, n=6) | |
| Acer Predator Helios 500 PH517-51-79BY | |
| Star Wars Battlefront 2 - 1920x1080 Ultra Preset | |
| Asus G703 | |
| MSI GT75 8RG-090 Titan | |
| Média NVIDIA GeForce GTX 1070 Mobile (90.7 - 104, n=5) | |
| Acer Predator Helios 500 PH517-51-79BY | |
| Kingdom Come: Deliverance - 1920x1080 Ultra High Preset | |
| Acer Predator Helios 500 PH517-51-79BY | |
| Asus G703 | |
| Média NVIDIA GeForce GTX 1070 Mobile (54.2 - 82, n=5) | |
| baixo | média | alto | ultra | |
|---|---|---|---|---|
| Dirt Rally (2015) | 119 | |||
| The Witcher 3 (2015) | 110 | 57 | ||
| Fallout 4 (2015) | 133 | 122 | ||
| Rise of the Tomb Raider (2016) | 108 | 90 | ||
| Battlefield 1 (2016) | 127 | 118 | ||
| Resident Evil 7 (2017) | 163 | 147 | ||
| Playerunknown's Battlegrounds (PUBG) (2017) | 131 | 95 | ||
| F1 2017 (2017) | 140 | 97 | ||
| Call of Duty WWII (2017) | 130 | 95 | ||
| Star Wars Battlefront 2 (2017) | 113 | 92 | ||
| Kingdom Come: Deliverance (2018) | 59 | 82 |
Barulho
| Ocioso |
| 31.2 / 35.3 / 35.3 dB |
| HDD |
| 31 dB |
| Carga |
| 44.4 / 45.2 dB |
 | ||
30 dB silencioso 40 dB(A) audível 50 dB(A) ruidosamente alto |
||
min: | ||
(±) A temperatura máxima no lado superior é 42.6 °C / 109 F, em comparação com a média de 40.4 °C / 105 F , variando de 21.2 a 68.8 °C para a classe Gaming.
(+) A parte inferior aquece até um máximo de 37.2 °C / 99 F, em comparação com a média de 43.2 °C / 110 F
(+) Em uso inativo, a temperatura média para o lado superior é 30.1 °C / 86 F, em comparação com a média do dispositivo de 33.9 °C / ### class_avg_f### F.
(±) Jogando The Witcher 3, a temperatura média para o lado superior é 37.8 °C / 100 F, em comparação com a média do dispositivo de 33.9 °C / ## #class_avg_f### F.
(+) Os apoios para as mãos e o touchpad são mais frios que a temperatura da pele, com um máximo de 31 °C / 87.8 F e, portanto, são frios ao toque.
(-) A temperatura média da área do apoio para as mãos de dispositivos semelhantes foi 28.8 °C / 83.8 F (-2.2 °C / -4 F).
Acer Predator Helios 500 PH517-51-79BY análise de áudio
(-) | alto-falantes não muito altos (###valor### dB)
Graves 100 - 315Hz
(±) | graves reduzidos - em média 6.5% menor que a mediana
(±) | a linearidade dos graves é média (7.6% delta para a frequência anterior)
Médios 400 - 2.000 Hz
(+) | médios equilibrados - apenas 2.3% longe da mediana
(+) | médios são lineares (5.2% delta para frequência anterior)
Altos 2 - 16 kHz
(+) | agudos equilibrados - apenas 1.9% longe da mediana
(±) | a linearidade dos máximos é média (7.9% delta para frequência anterior)
Geral 100 - 16.000 Hz
(+) | o som geral é linear (11.7% diferença em relação à mediana)
Comparado com a mesma classe
» 11% de todos os dispositivos testados nesta classe foram melhores, 4% semelhantes, 85% piores
» O melhor teve um delta de 6%, a média foi 18%, o pior foi 132%
Comparado com todos os dispositivos testados
» 8% de todos os dispositivos testados foram melhores, 3% semelhantes, 89% piores
» O melhor teve um delta de 4%, a média foi 23%, o pior foi 134%
HP Omen X 17-ap0xx análise de áudio
(-) | alto-falantes não muito altos (###valor### dB)
Graves 100 - 315Hz
(-) | quase nenhum baixo - em média 18.1% menor que a mediana
(±) | a linearidade dos graves é média (9.9% delta para a frequência anterior)
Médios 400 - 2.000 Hz
(+) | médios equilibrados - apenas 3.4% longe da mediana
(+) | médios são lineares (6.3% delta para frequência anterior)
Altos 2 - 16 kHz
(+) | agudos equilibrados - apenas 2.3% longe da mediana
(±) | a linearidade dos máximos é média (9.8% delta para frequência anterior)
Geral 100 - 16.000 Hz
(±) | a linearidade do som geral é média (22.3% diferença em relação à mediana)
Comparado com a mesma classe
» 80% de todos os dispositivos testados nesta classe foram melhores, 6% semelhantes, 14% piores
» O melhor teve um delta de 6%, a média foi 18%, o pior foi 132%
Comparado com todos os dispositivos testados
» 65% de todos os dispositivos testados foram melhores, 6% semelhantes, 29% piores
» O melhor teve um delta de 4%, a média foi 23%, o pior foi 134%
Acer Predator 17 G9-793-70PJ análise de áudio
(+) | os alto-falantes podem tocar relativamente alto (###valor### dB)
Graves 100 - 315Hz
(±) | graves reduzidos - em média 5.5% menor que a mediana
(±) | a linearidade dos graves é média (8% delta para a frequência anterior)
Médios 400 - 2.000 Hz
(+) | médios equilibrados - apenas 2.9% longe da mediana
(+) | médios são lineares (3.5% delta para frequência anterior)
Altos 2 - 16 kHz
(±) | máximos reduzidos - em média 5.2% menor que a mediana
(+) | os máximos são lineares (6.2% delta da frequência anterior)
Geral 100 - 16.000 Hz
(+) | o som geral é linear (10.3% diferença em relação à mediana)
Comparado com a mesma classe
» 6% de todos os dispositivos testados nesta classe foram melhores, 2% semelhantes, 93% piores
» O melhor teve um delta de 6%, a média foi 18%, o pior foi 132%
Comparado com todos os dispositivos testados
» 5% de todos os dispositivos testados foram melhores, 1% semelhantes, 94% piores
» O melhor teve um delta de 4%, a média foi 23%, o pior foi 134%
| desligado | |
| Ocioso | |
| Carga |
|
Key:
min: | |
| Acer Predator Helios 500 PH517-51-79BY i7-8750H, GeForce GTX 1070 Mobile, SK hynix SSD Canvas SC300 HFS256GD9MNE-6200A, IPS, 1920x1080, 17.3" | Acer Predator Helios 300 i7-7700HQ, GeForce GTX 1060 Mobile, Intel SSD 600p SSDPEKKW512G7, AH-IPS, WLED, 1920x1080, 17.3" | Asus G703 i7-7820HK, GeForce GTX 1080 Mobile, 2x Samsung SM961 MZVKW512HMJP NVMe (RAID 0), IPS, 1920x1080, 17.3" | MSI GT75 8RG-090 Titan i9-8950HK, GeForce GTX 1080 Mobile, 2x Samsung PM961 MZVLW256HEHP (RAID 0), TN, 1920x1080, 17.3" | HP Omen X 17-ap0xx i7-7820HK, GeForce GTX 1080 Mobile, Samsung PM961 MZVLW256HEHP, IPS, 1920x1080, 17.3" | Razer Blade Pro RZ09-0220 i7-7700HQ, GeForce GTX 1060 Mobile, Samsung SSD PM951 MZVLV256HCHP, IPS, 1920x1080, 17.3" | Acer Predator 17 G9-793-70PJ i7-7700HQ, GeForce GTX 1070 Mobile, Toshiba NVMe THNSN5512GPU7, IPS, 3840x2160, 17.3" | Média NVIDIA GeForce GTX 1070 Mobile | Média da turma Gaming | |
|---|---|---|---|---|---|---|---|---|---|
| Power Consumption | 43% | -22% | -37% | 6% | 42% | -3% | 4% | 18% | |
| Idle Minimum * (Watt) | 20.4 | 7 66% | 26 -27% | 31 -52% | 21.6 -6% | 10.6 48% | 23 -13% | 21 ? -3% | 13 ? 36% |
| Idle Average * (Watt) | 26.5 | 13 51% | 30 -13% | 35 -32% | 26.4 -0% | 16 40% | 33 -25% | 26.4 ? -0% | 19 ? 28% |
| Idle Maximum * (Watt) | 37 | 20 46% | 37 -0% | 45 -22% | 26.6 28% | 16.4 56% | 40 -8% | 31.8 ? 14% | 24.6 ? 34% |
| Load Average * (Watt) | 129 | 81 37% | 123 5% | 130 -1% | 95.6 26% | 75.9 41% | 94 27% | 117.7 ? 9% | 110.7 ? 14% |
| Witcher 3 ultra * (Watt) | 186 | 127 32% | 257 -38% | 268 -44% | 221.7 -19% | 111.2 40% | 177 5% | ||
| Load Maximum * (Watt) | 216 | 162 25% | 341 -58% | 374 -73% | 199.6 8% | 163.8 24% | 228 -6% | 219 ? -1% | 259 ? -20% |
* ... menor é melhor
| Battery Runtime | |||
| Resolução | Configurações | Valor | |
| 1920x1080 | Witcher 3 ultra 150cd | 66 min | |
| WiFi Websurfing | 174 min | ||
| Acer Predator Helios 500 PH517-51-79BY i7-8750H, GeForce GTX 1070 Mobile, 72 Wh | Acer Predator Helios 300 i7-7700HQ, GeForce GTX 1060 Mobile, 48 Wh | Asus G703 i7-7820HK, GeForce GTX 1080 Mobile, 71 Wh | MSI GT75 8RG-090 Titan i9-8950HK, GeForce GTX 1080 Mobile, 75 Wh | HP Omen X 17-ap0xx i7-7820HK, GeForce GTX 1080 Mobile, 99 Wh | Razer Blade Pro RZ09-0220 i7-7700HQ, GeForce GTX 1060 Mobile, 70 Wh | Acer Predator 17 G9-793-70PJ i7-7700HQ, GeForce GTX 1070 Mobile, 88 Wh | Média da turma Gaming | |
|---|---|---|---|---|---|---|---|---|
| Duração da bateria | 55% | -25% | -19% | 55% | 102% | 18% | 81% | |
| Reader / Idle (h) | 4.2 | 10.2 143% | 3.3 -21% | 3.8 -10% | 5.8 38% | 12 186% | 5.4 29% | 8.27 ? 97% |
| WiFi v1.3 (h) | 2.9 | 4.7 62% | 2.5 -14% | 5.6 93% | 7 141% | 3.6 24% | 7.11 ? 145% | |
| Witcher 3 ultra (h) | 1.1 | |||||||
| Load (h) | 1.5 | 0.9 -40% | 0.9 -40% | 1.1 -27% | 2 33% | 1.2 -20% | 1.5 0% | 1.502 ? 0% |
| H.264 (h) | 4.7 | 2.4 | 2.9 | 8.32 ? |
Pro
Contra
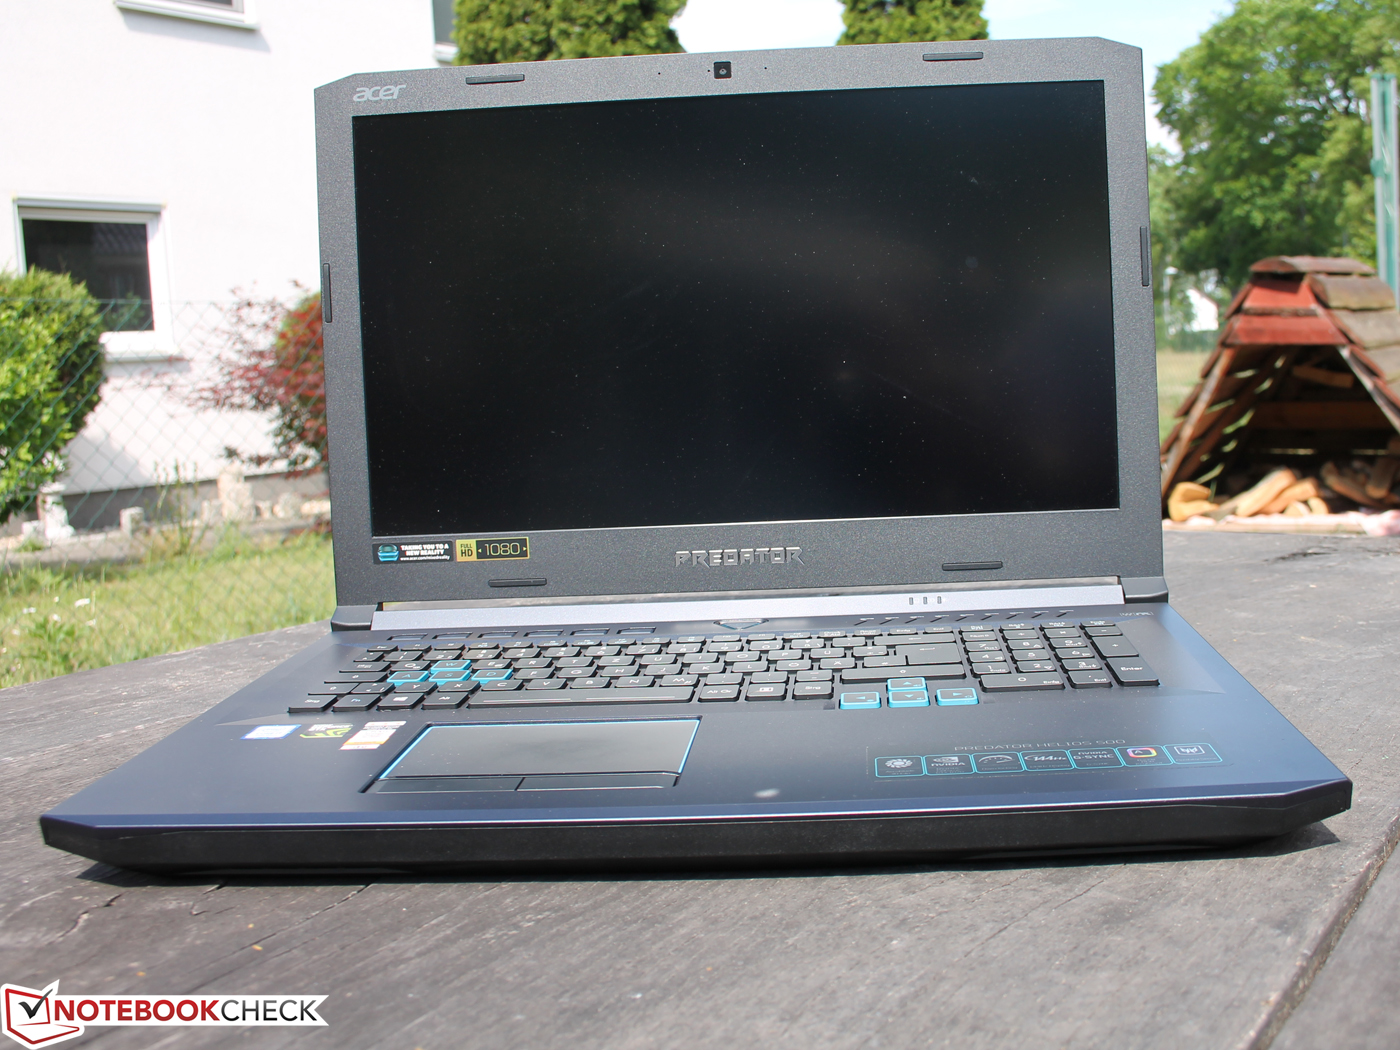
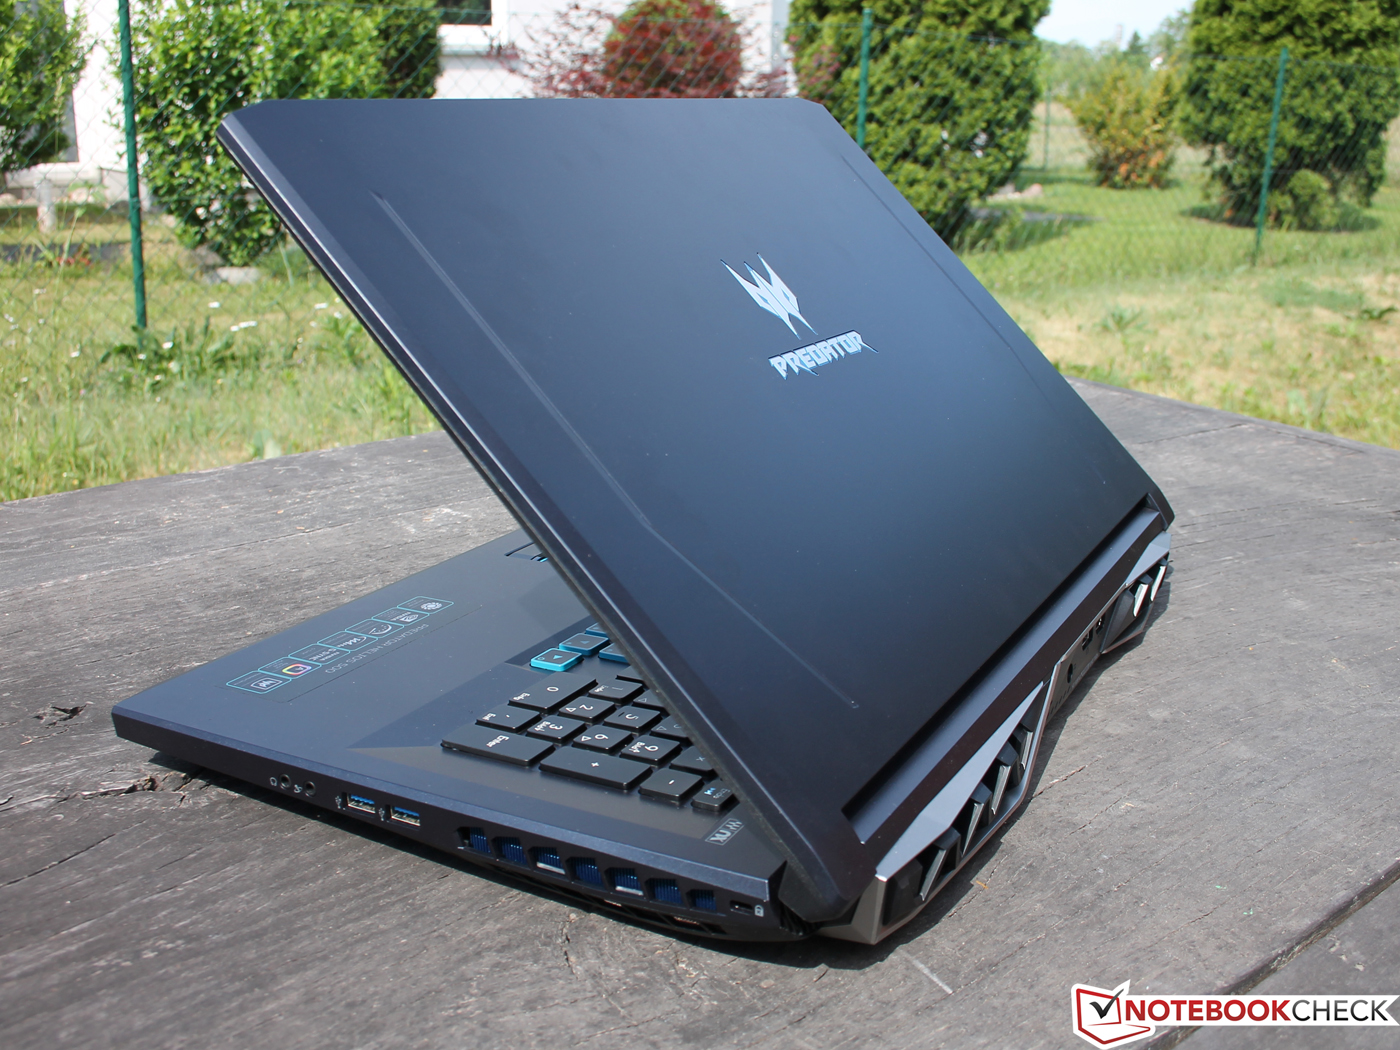
Com o seu Predator Helios 500, a Acer mais uma vez criou uma poderosa usina energética para jogos, com mais vantagens do que desvantagens quando se trata de jogos. No entanto, até mesmo esta máquina de jogos de 17 polegadas está longe de ser perfeita e, portanto, exige uma análise detalhada.
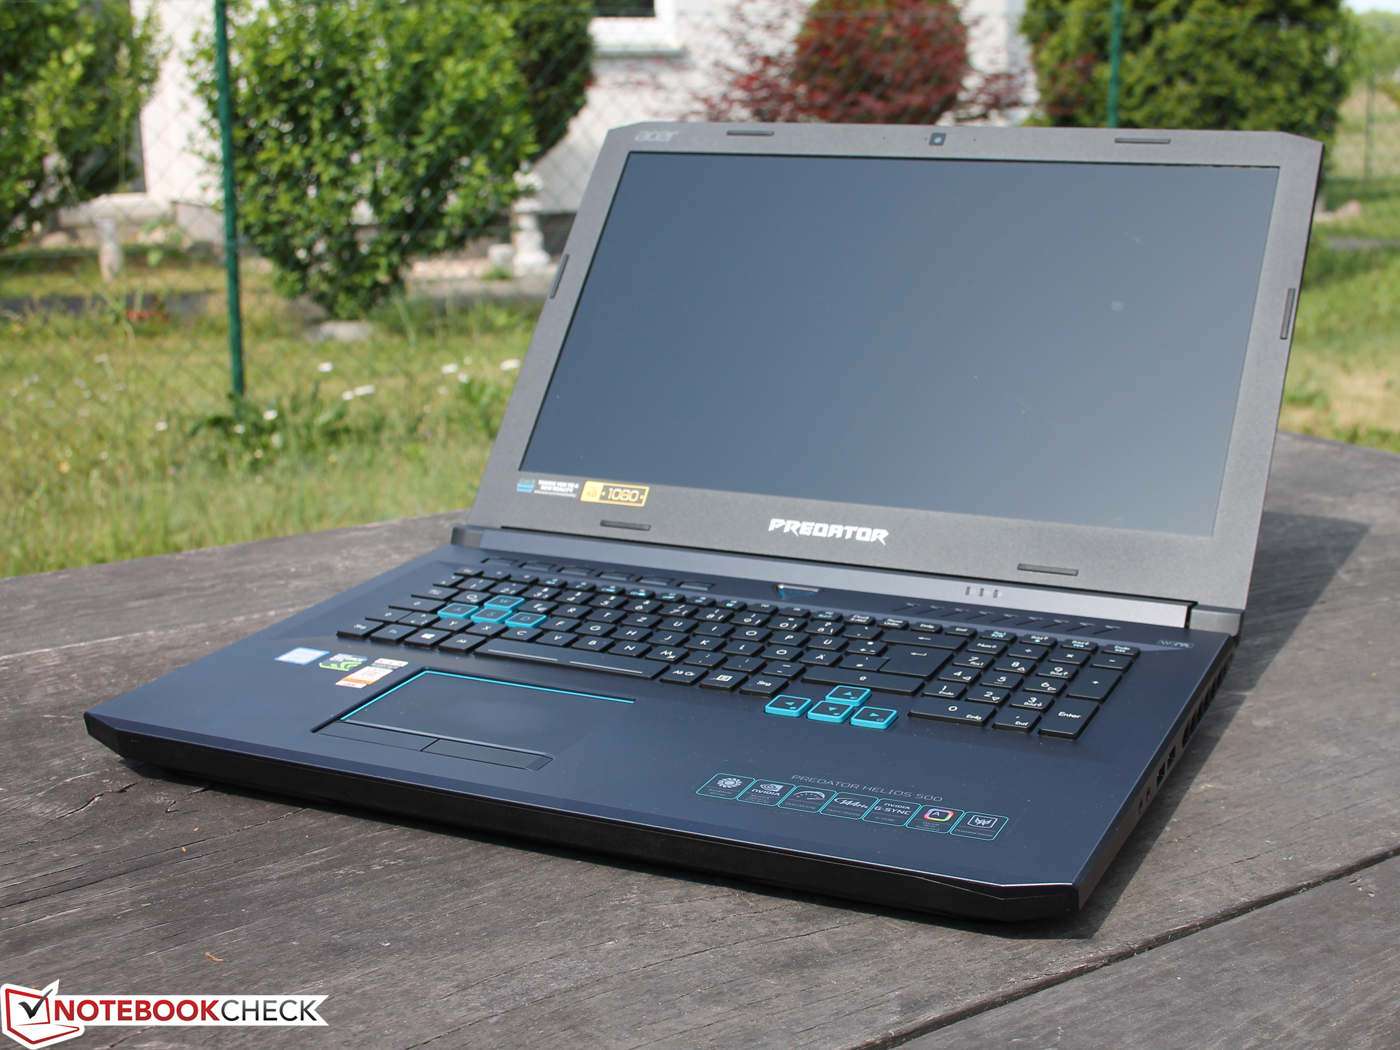
A tela, por exemplo, tem jogo escrito por toda parte. 144 Hz e tempos de resposta incrivelmente rápidos são uma grande vantagem. A precisão da cor foi excelente uma vez que o monitor passou pelo nosso processo de calibração manual. No entanto, não cobriu sRGB completamente e sua taxa de contraste de apenas 500: 1 foi muito baixa. Assim, os pretos pareciam bastante acinzentados para o observador.
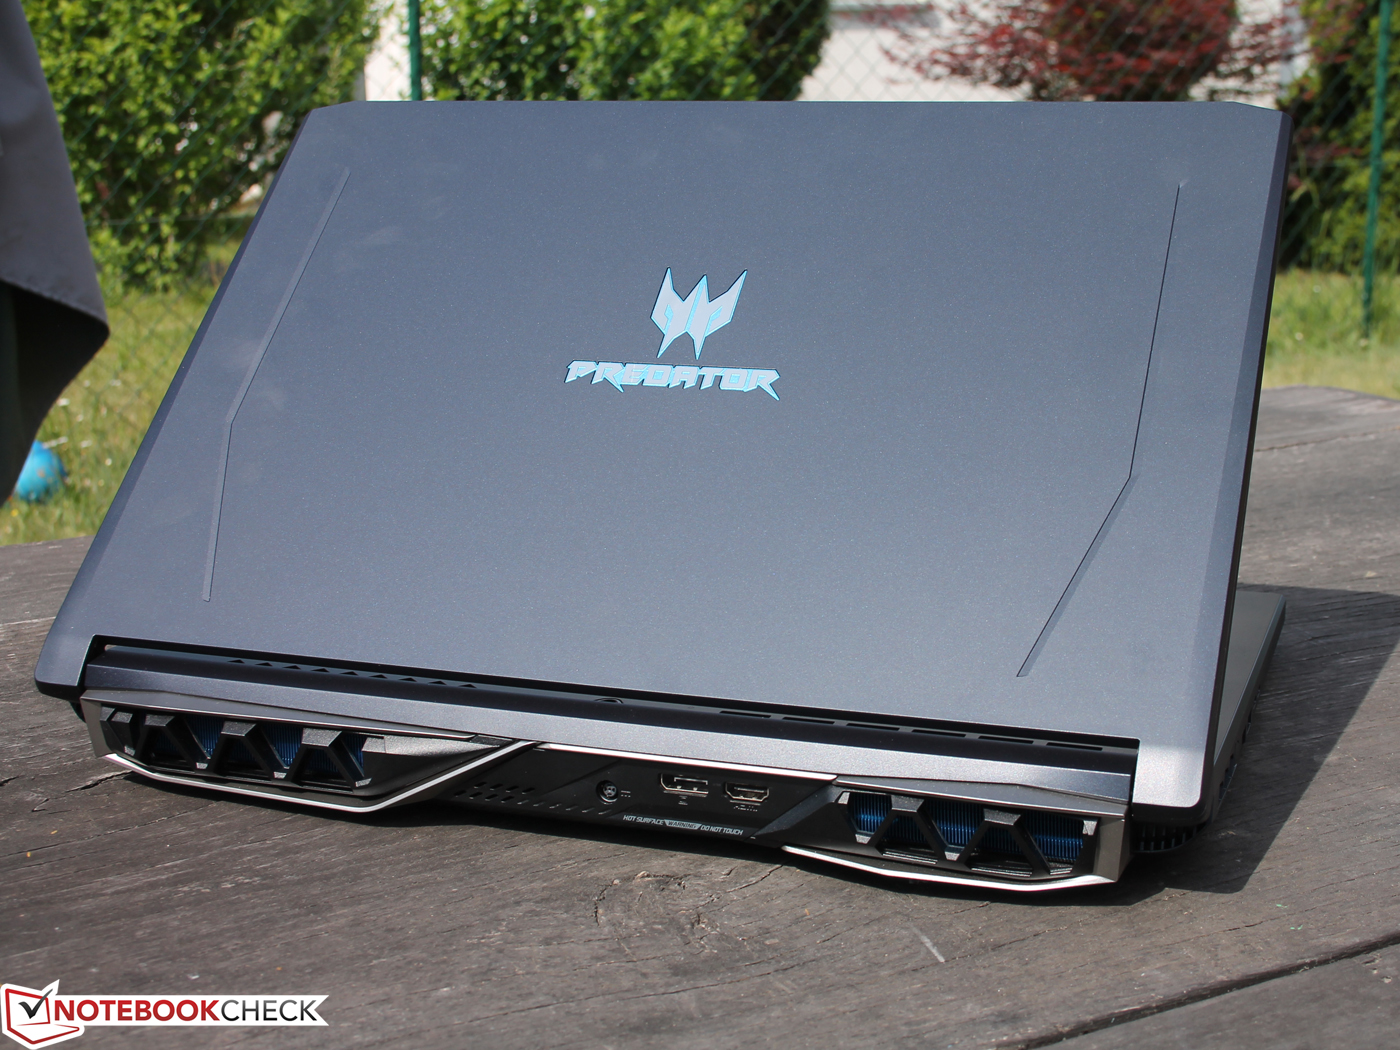
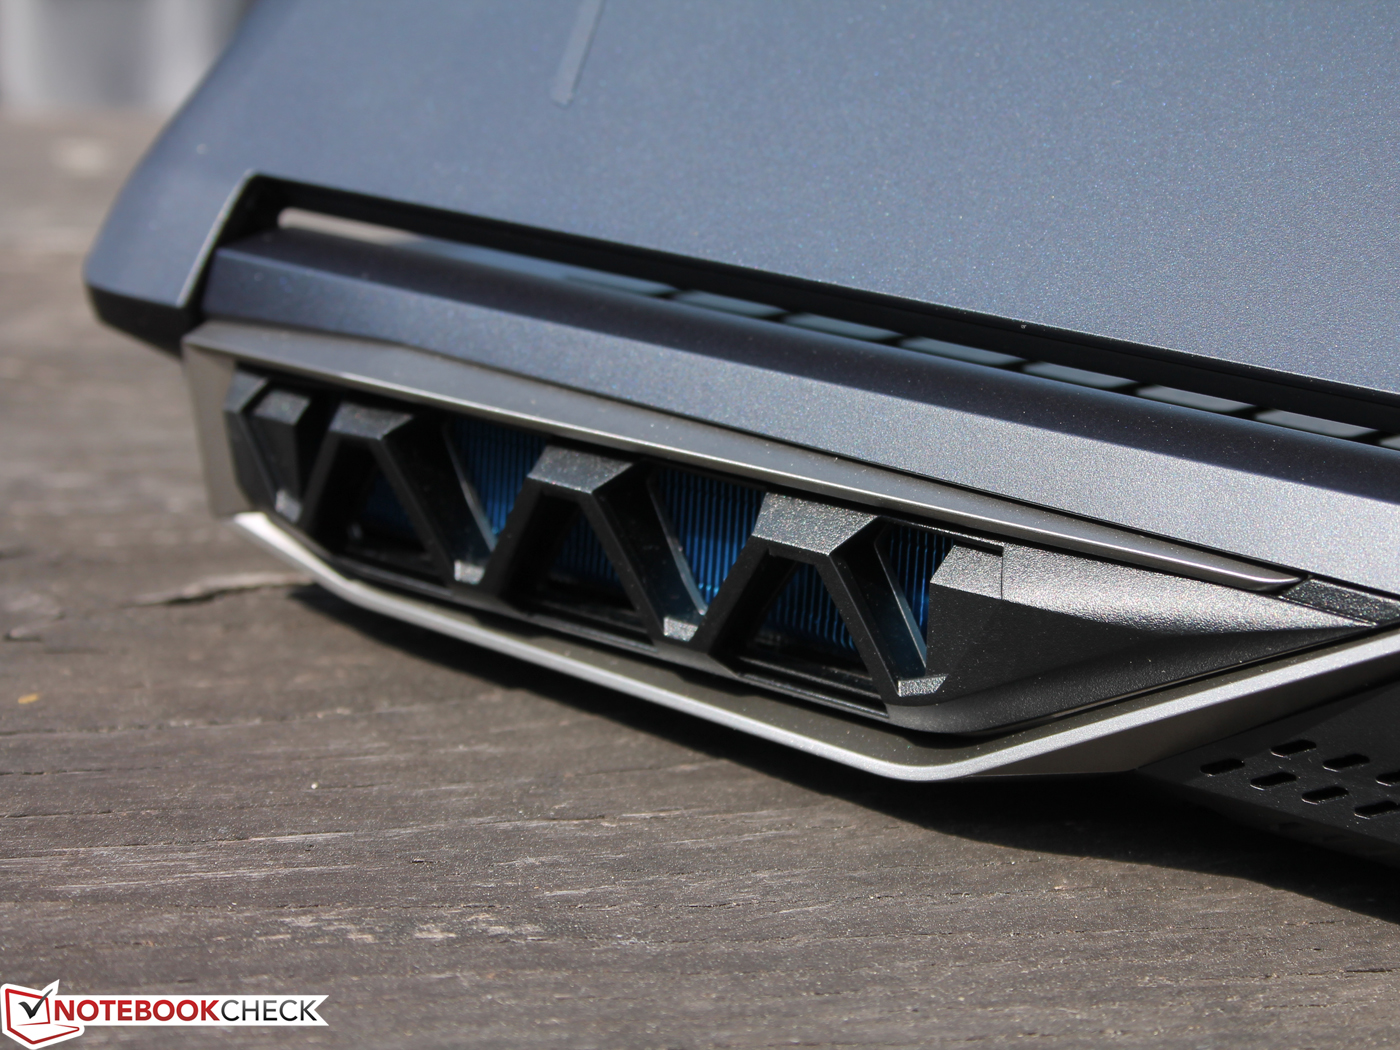
As emissões globais foram mais do que aceitáveis, considerando o nível de desempenho do dispositivo. Os usuários ainda podem escolher se querem ou não um melhor desempenho de resfriamento (Cool Boost) e uma GPU com um ligeiro overclock (GPU turbo). Com o controle automático do ventilador ativado, o dispositivo era silencioso o suficiente para se integrar perfeitamente à maioria dos ambientes de escritório, e os ventiladores até desligavam completamente de vez em quando.
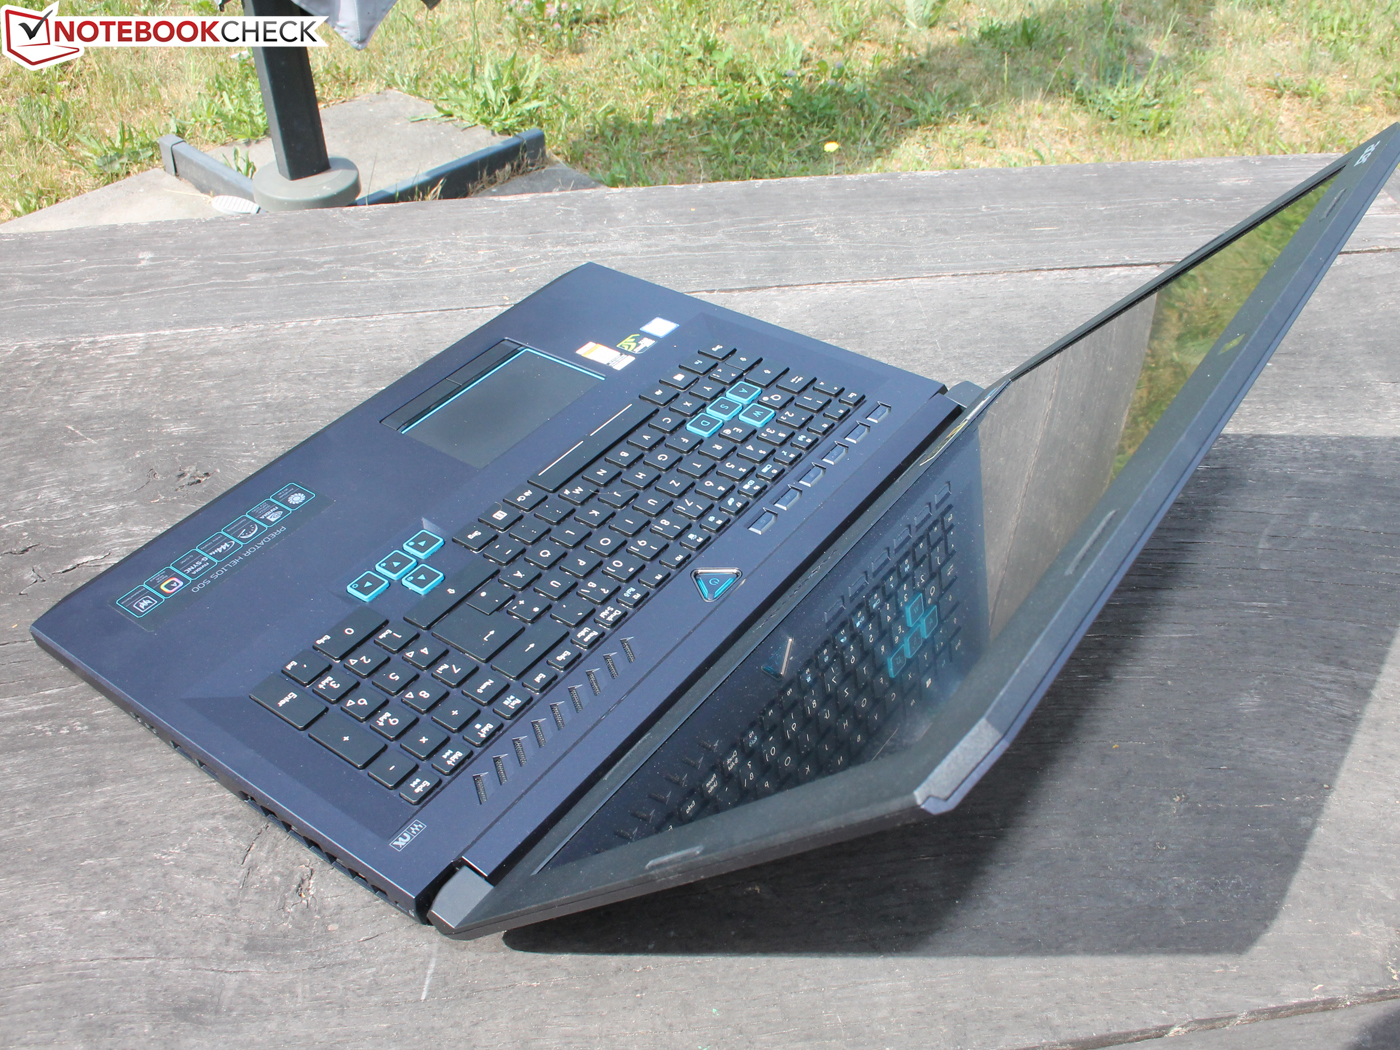
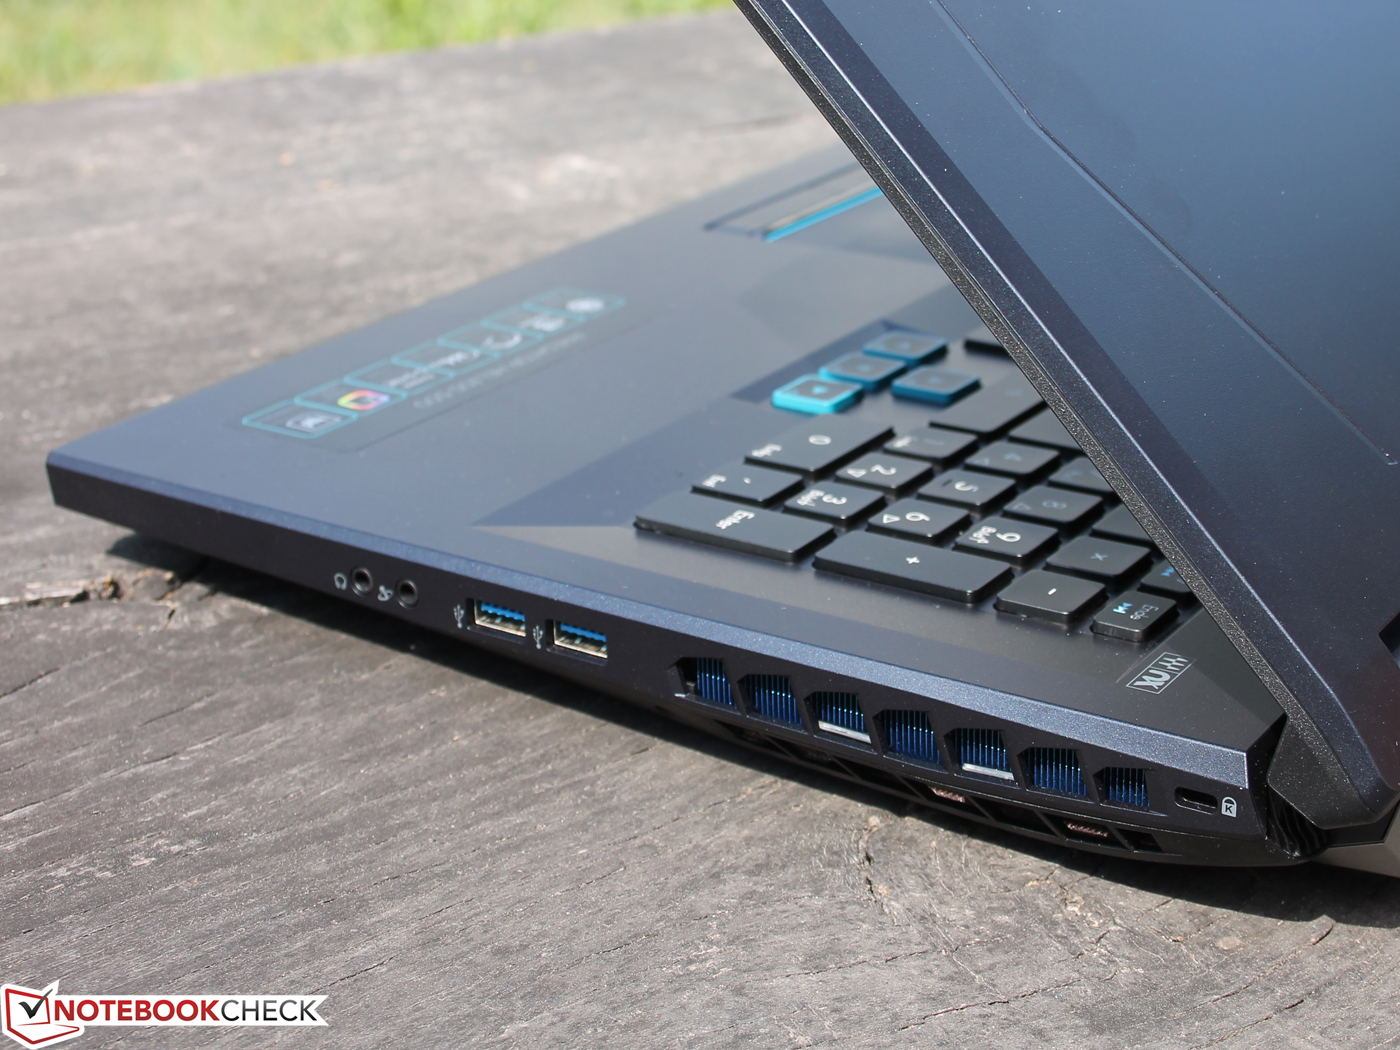
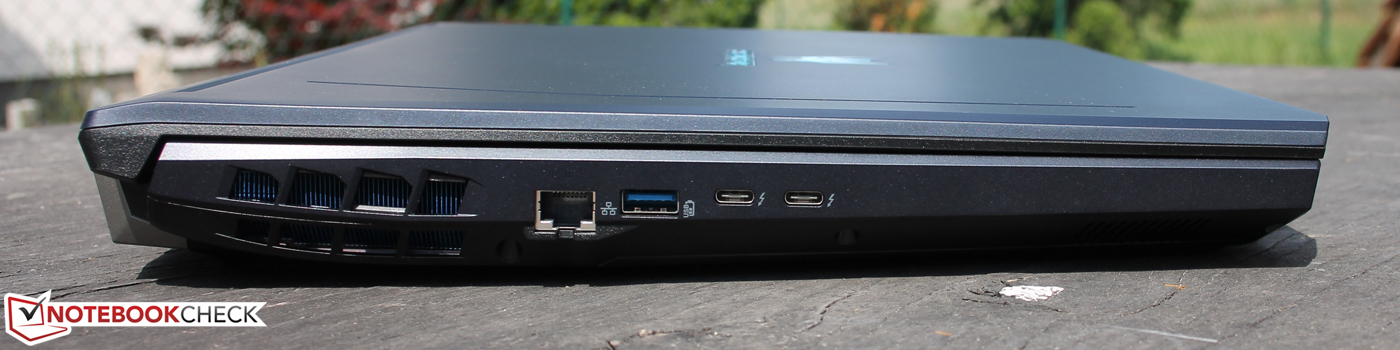
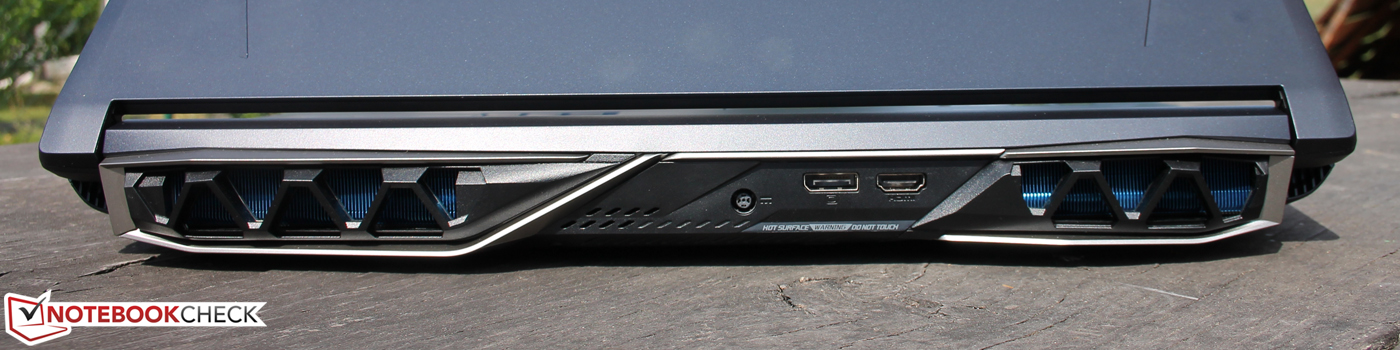
A qualidade de construção não era perfeita, mas a carcaça de plástico era rígida o suficiente. Particularmente gostamos das duas portas Thunderbolt 3, mas lamentamos a perda do leitor de cartões SD.
A manutenção é fácil e a capacidade de atualização é excelente. Entre outros, os usuários podem atualizar RAM (até 64 GB) e armazenamento (2x M.2 SSD RAID, HD de 2,5 polegadas). Infelizmente, o suporte M.2 é limitado a SATA e não inclui o protocolo NVMe mais rápido.
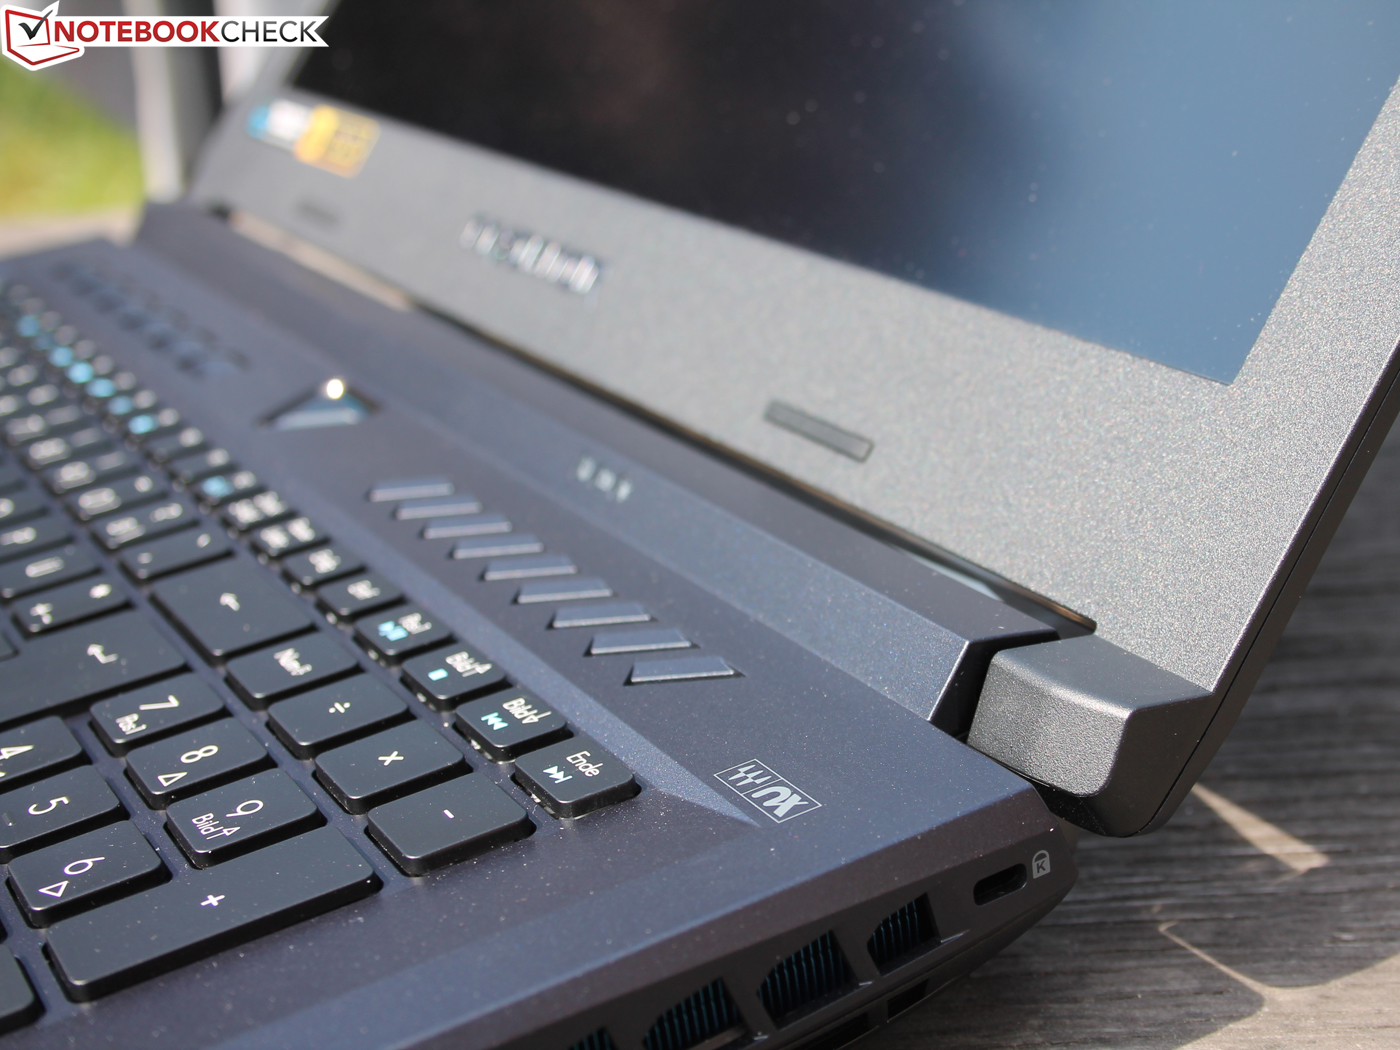
O sistema de som foi excelente, mas não tão brilhante quanto o do seu irmão maior, o Predator 17. Os dispositivos de entrada com luz de fundo foram muito bons, e o peso geral foi bastante baixo, considerando o nível de desempenho do portátil.
No lado negativo, o consumo de energia no modo ocioso do portátil foi muito alto e a duração da bateria foi bastante pobre. Nem a webcam nem o microfone eram adequados para um portátil tão caro e teria sido mais apropriado para um portátil de $400.
Se por algum motivo você achar que esses handicaps são demais para aceitar ou se o preço está muito alto, então o Acer Predator Helios 300, que começa com pouco mais de $1.000 (GTX 1050 Ti) ou $1.300 (GTX 1060), pode valer a pena dar uma olhada mais de perto. Pelo menos podemos garantir que este portátil em particular foi muito mais eficiente em termos energéticos do que a unidade de teste de hoje.
Também vamos rever o outro SKUs Helios 500, o modelo topo de gama equipado com o Core i9-8950HK da Intel (2,9 - 4,8 GHz), em breve.
Acer Predator Helios 500 PH517-51-79BY
- 05/29/2018 v6 (old)
Sebastian Jentsch
Price comparison
