Breve Análise do Portátil Schenker XMG Ultra 17 (i9-9900K, GTX 1080, UHD) Clevo P775TM1-G
| SD Card Reader | |
| average JPG Copy Test (av. of 3 runs) | |
| Asus Chimera G703GI (Toshiba Exceria Pro SDXC 64 GB UHS-II) | |
| Aorus X7 DT v8 (Toshiba Exceria Pro SDXC 64 GB UHS-II) | |
| Schenker XMG Ultra 17 Coffee Lake Refresh (Toshiba Exceria Pro SDXC 64 GB UHS-II) | |
| Schenker XMG Ultra 17 (Toshiba Exceria Pro SDXC 64 GB UHS-II) | |
| Média da turma Gaming (20.9 - 210, n=55, últimos 2 anos) | |
| maximum AS SSD Seq Read Test (1GB) | |
| Asus Chimera G703GI (Toshiba Exceria Pro SDXC 64 GB UHS-II) | |
| Aorus X7 DT v8 (Toshiba Exceria Pro SDXC 64 GB UHS-II) | |
| Schenker XMG Ultra 17 (Toshiba Exceria Pro SDXC 64 GB UHS-II) | |
| Schenker XMG Ultra 17 Coffee Lake Refresh (Toshiba Exceria Pro SDXC 64 GB UHS-II) | |
| Média da turma Gaming (25.5 - 261, n=52, últimos 2 anos) | |
| Networking | |
| iperf3 transmit AX12 | |
| Asus Chimera G703GI | |
| Schenker XMG Ultra 17 Coffee Lake Refresh | |
| Aorus X7 DT v8 | |
| Schenker XMG Ultra 17 | |
| iperf3 receive AX12 | |
| Schenker XMG Ultra 17 | |
| Schenker XMG Ultra 17 Coffee Lake Refresh | |
| Asus Chimera G703GI | |
| Aorus X7 DT v8 | |
| |||||||||||||||||||||||||
iluminação: 87 %
iluminação com acumulador: 349 cd/m²
Contraste: 851:1 (Preto: 0.41 cd/m²)
ΔE ColorChecker Calman: 4.04 | ∀{0.5-29.43 Ø4.73}
calibrated: 0.93
ΔE Greyscale Calman: 4.19 | ∀{0.09-98 Ø4.97}
100% sRGB (Argyll 1.6.3 3D)
87% AdobeRGB 1998 (Argyll 1.6.3 3D)
98.9% AdobeRGB 1998 (Argyll 3D)
99.9% sRGB (Argyll 3D)
85.8% Display P3 (Argyll 3D)
Gamma: 2.44
CCT: 6411 K
| Schenker XMG Ultra 17 Coffee Lake Refresh AU Optronics B173ZAN (AUO109B), IPS, 3840x2160 | Schenker XMG Ultra 17 AU Optronics B173ZAN01.0 (AUO109B), IPS, 3840x2160 | Asus Chimera G703GI B173HAN03.2 (AUO329D), IPS, 1920x1080 | Aorus X7 DT v8 AU Optronics B173HAN03.0 (AUO309D), IPS, 1920x1080 | |
|---|---|---|---|---|
| Display | 0% | -21% | -22% | |
| Display P3 Coverage (%) | 85.8 | 86.4 1% | 65.8 -23% | 65.3 -24% |
| sRGB Coverage (%) | 99.9 | 100 0% | 92.6 -7% | 91.2 -9% |
| AdobeRGB 1998 Coverage (%) | 98.9 | 99.1 0% | 67 -32% | 66.3 -33% |
| Response Times | -9% | 68% | 51% | |
| Response Time Grey 50% / Grey 80% * (ms) | 41.2 ? | 44 ? -7% | 6.4 ? 84% | 18 ? 56% |
| Response Time Black / White * (ms) | 22.4 ? | 24.8 ? -11% | 10.8 ? 52% | 12 ? 46% |
| PWM Frequency (Hz) | ||||
| Screen | 6% | -2% | 16% | |
| Brightness middle (cd/m²) | 349 | 332 -5% | 285 -18% | 297 -15% |
| Brightness (cd/m²) | 339 | 313 -8% | 275 -19% | 281 -17% |
| Brightness Distribution (%) | 87 | 88 1% | 82 -6% | 84 -3% |
| Black Level * (cd/m²) | 0.41 | 0.28 32% | 0.22 46% | 0.23 44% |
| Contrast (:1) | 851 | 1186 39% | 1295 52% | 1291 52% |
| Colorchecker dE 2000 * | 4.04 | 3.86 4% | 3.18 21% | 2.19 46% |
| Colorchecker dE 2000 max. * | 6.01 | 5.88 2% | 5.99 -0% | 4.81 20% |
| Colorchecker dE 2000 calibrated * | 0.93 | 1.73 -86% | ||
| Greyscale dE 2000 * | 4.19 | 4.33 -3% | 2.93 30% | 1.31 69% |
| Gamma | 2.44 90% | 2.41 91% | 2.45 90% | 2.42 91% |
| CCT | 6411 101% | 6595 99% | 7165 91% | 6464 101% |
| Color Space (Percent of AdobeRGB 1998) (%) | 87 | 88 1% | 60 -31% | 59 -32% |
| Color Space (Percent of sRGB) (%) | 100 | 100 0% | 93 -7% | 91 -9% |
| Média Total (Programa/Configurações) | -1% /
3% | 15% /
4% | 15% /
13% |
* ... menor é melhor
Exibir tempos de resposta
| ↔ Tempo de resposta preto para branco | ||
|---|---|---|
| 22.4 ms ... ascensão ↗ e queda ↘ combinadas | ↗ 10 ms ascensão | 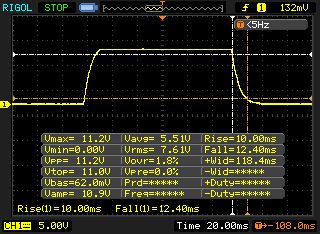 |
| ↘ 12.4 ms queda | ||
| A tela mostra boas taxas de resposta em nossos testes, mas pode ser muito lenta para jogadores competitivos. Em comparação, todos os dispositivos testados variam de 0.1 (mínimo) a 240 (máximo) ms. » 50 % de todos os dispositivos são melhores. Isso significa que o tempo de resposta medido é pior que a média de todos os dispositivos testados (19.9 ms). | ||
| ↔ Tempo de resposta 50% cinza a 80% cinza | ||
| 41.2 ms ... ascensão ↗ e queda ↘ combinadas | ↗ 20.8 ms ascensão | 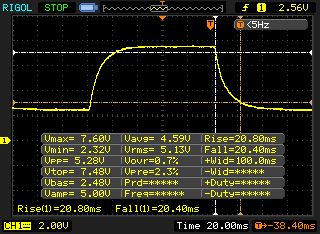 |
| ↘ 20.4 ms queda | ||
| A tela mostra taxas de resposta lentas em nossos testes e será insatisfatória para os jogadores. Em comparação, todos os dispositivos testados variam de 0.165 (mínimo) a 636 (máximo) ms. » 66 % de todos os dispositivos são melhores. Isso significa que o tempo de resposta medido é pior que a média de todos os dispositivos testados (31.1 ms). | ||
Cintilação da tela / PWM (modulação por largura de pulso)
| Tela tremeluzindo / PWM não detectado | 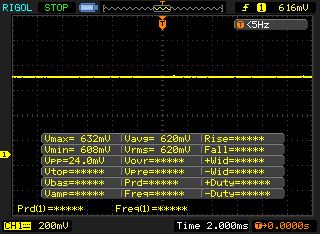 | ||
[pwm_comparison] Em comparação: 52 % de todos os dispositivos testados não usam PWM para escurecer a tela. Se PWM foi detectado, uma média de 7798 (mínimo: 5 - máximo: 343500) Hz foi medida. | |||
| PCMark 10 - Score | |
| Média da turma Gaming (5828 - 11574, n=96, últimos 2 anos) | |
| Schenker XMG Ultra 17 Coffee Lake Refresh | |
| Asus Chimera G703GI | |
| Schenker XMG Ultra 17 | |
| Aorus X7 DT v8 | |
| PCMark 8 | |
| Home Score Accelerated v2 | |
| Asus Chimera G703GI | |
| Aorus X7 DT v8 | |
| Média da turma Gaming (n=1últimos 2 anos) | |
| Schenker XMG Ultra 17 Coffee Lake Refresh | |
| Schenker XMG Ultra 17 | |
| Work Score Accelerated v2 | |
| Asus Chimera G703GI | |
| Schenker XMG Ultra 17 Coffee Lake Refresh | |
| Schenker XMG Ultra 17 | |
| Média da turma Gaming (n=1últimos 2 anos) | |
| PCMark 8 Home Score Accelerated v2 | 5243 pontos | |
| PCMark 8 Work Score Accelerated v2 | 5123 pontos | |
| PCMark 10 Score | 6959 pontos | |
Ajuda | ||
| Schenker XMG Ultra 17 Coffee Lake Refresh Samsung SSD 970 Pro 1TB | Schenker XMG Ultra 17 Samsung SSD 960 Evo 500GB m.2 NVMe | Asus Chimera G703GI 2x Intel 760p 512 GB + 1x Samsung SM961 512 GB (RAID) | Aorus X7 DT v8 Toshiba NVMe THNSN5512GPU7 | |
|---|---|---|---|---|
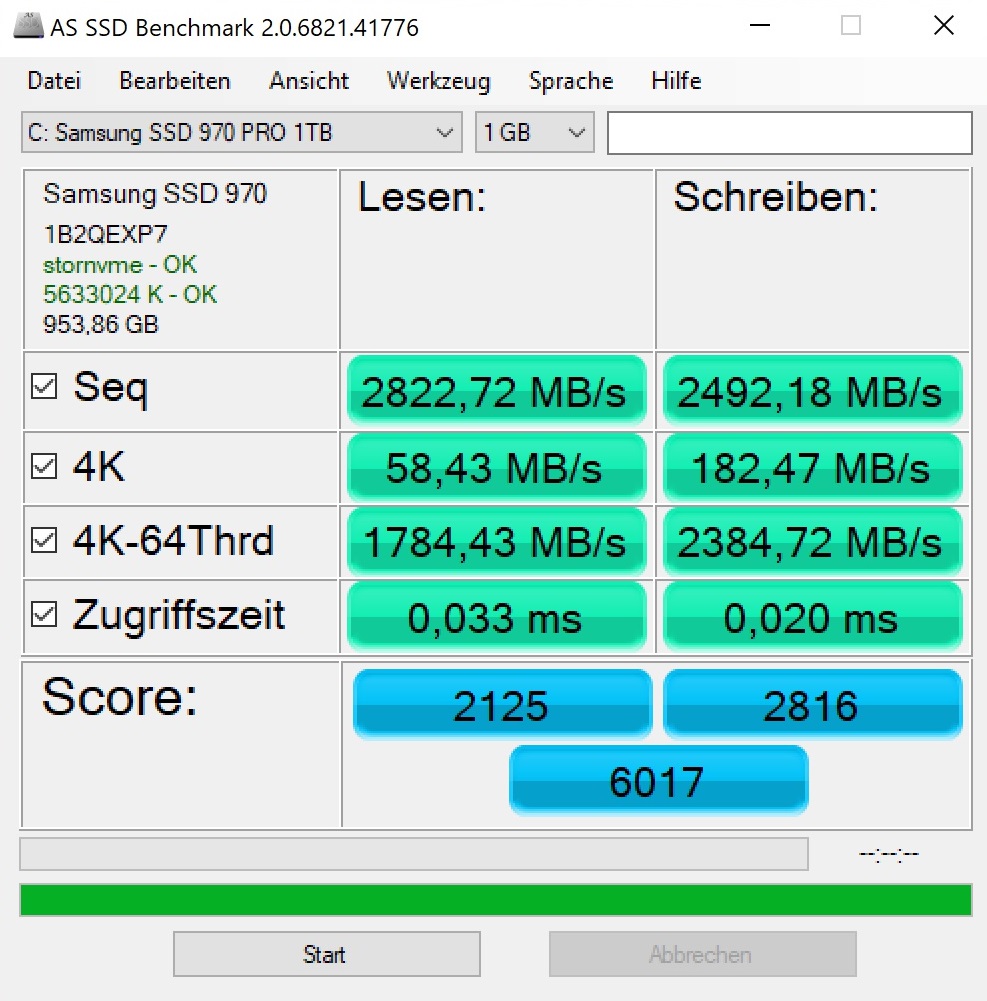
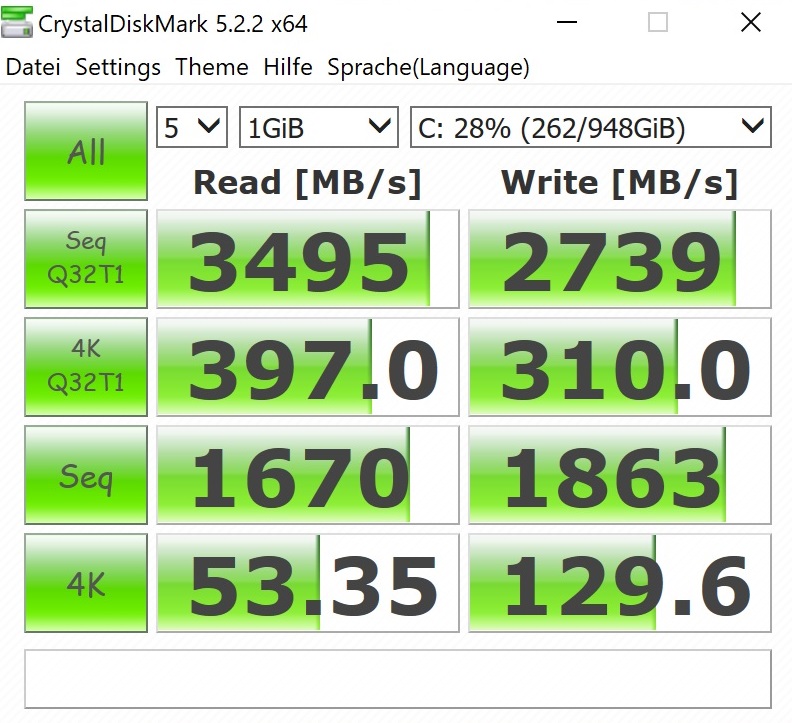
| AS SSD | -26% | 8% | -50% | |
| Seq Read (MB/s) | 2823 | 2533 -10% | 4886 73% | 2182 -23% |
| Seq Write (MB/s) | 2492 | 1771 -29% | 4110 65% | 1342 -46% |
| 4K Read (MB/s) | 58.4 | 43.65 -25% | 57.4 -2% | 23.28 -60% |
| 4K Write (MB/s) | 182.5 | 139.5 -24% | 141.3 -23% | 89.9 -51% |
| Score Read (Points) | 2125 | 1716 -19% | 1999 -6% | 1058 -50% |
| Score Write (Points) | 2816 | 1615 -43% | 1855 -34% | 981 -65% |
| Score Total (Points) | 6017 | 4173 -31% | 4843 -20% | 2539 -58% |

| 3DMark | |
| 1920x1080 Fire Strike Graphics | |
| Média da turma Gaming (12242 - 62849, n=121, últimos 2 anos) | |
| Asus Chimera G703GI | |
| Schenker XMG Ultra 17 | |
| Schenker XMG Ultra 17 Coffee Lake Refresh | |
| Aorus X7 DT v8 | |
| 2560x1440 Time Spy Graphics | |
| Média da turma Gaming (5012 - 26212, n=120, últimos 2 anos) | |
| Schenker XMG Ultra 17 | |
| Schenker XMG Ultra 17 Coffee Lake Refresh | |
| 3DMark 11 - 1280x720 Performance GPU | |
| Média da turma Gaming (21841 - 80022, n=109, últimos 2 anos) | |
| Asus Chimera G703GI | |
| Schenker XMG Ultra 17 | |
| Schenker XMG Ultra 17 Coffee Lake Refresh | |
| Aorus X7 DT v8 | |
| 3DMark 06 Standard Score | 35252 pontos | |
| 3DMark 11 Performance | 24503 pontos | |
| 3DMark Ice Storm Standard Score | 175460 pontos | |
| 3DMark Cloud Gate Standard Score | 51972 pontos | |
| 3DMark Fire Strike Score | 19041 pontos | |
| 3DMark Time Spy Score | 7260 pontos | |
Ajuda | ||
| The Witcher 3 - 1920x1080 Ultra Graphics & Postprocessing (HBAO+) | |
| Média da turma Gaming (95 - 240, n=8, últimos 2 anos) | |
| Asus Chimera G703GI | |
| Schenker XMG Ultra 17 | |
| Aorus X7 DT v8 | |
| Schenker XMG Ultra 17 Coffee Lake Refresh | |
| baixo | média | alto | ultra | 4K | |
|---|---|---|---|---|---|
| The Witcher 3 (2015) | 61.7 | 44.4 | |||
| The Crew 2 (2018) | 59.9 | 40.8 | |||
| Monster Hunter World (2018) | 83.6 | 25.8 | |||
| F1 2018 (2018) | 108 | 53 | |||
| Shadow of the Tomb Raider (2018) | 87 | 29 | |||
| FIFA 19 (2018) | 276 | 167 | |||
| Forza Horizon 4 (2018) | 105 | 60 | |||
| Assassin´s Creed Odyssey (2018) | 60 | 31 | |||
| Call of Duty Black Ops 4 (2018) | 121 | 39.1 |
Barulho
| Ocioso |
| 33 / 35 / 43 dB |
| Carga |
| 43 / 59 dB |
 | ||
30 dB silencioso 40 dB(A) audível 50 dB(A) ruidosamente alto |
||
min: | ||
| Schenker XMG Ultra 17 Coffee Lake Refresh i9-9900K, GeForce GTX 1080 Mobile | Schenker XMG Ultra 17 i7-8700, GeForce GTX 1080 Mobile | Asus Chimera G703GI i9-8950HK, GeForce GTX 1080 Mobile | Aorus X7 DT v8 i7-8850H, GeForce GTX 1080 Mobile | Média da turma Gaming | |
|---|---|---|---|---|---|
| Noise | -0% | 1% | 1% | 17% | |
| desligado / ambiente * (dB) | 30 | 30 -0% | 29 3% | 29 3% | 24.1 ? 20% |
| Idle Minimum * (dB) | 33 | 34 -3% | 30 9% | 35 -6% | 25.8 ? 22% |
| Idle Average * (dB) | 35 | 35 -0% | 34 3% | 36 -3% | 27.5 ? 21% |
| Idle Maximum * (dB) | 43 | 40 7% | 42 2% | 41 5% | 30 ? 30% |
| Load Average * (dB) | 43 | 45 -5% | 53 -23% | 43 -0% | 43.1 ? -0% |
| Witcher 3 ultra * (dB) | 53 | 52 2% | 51 4% | 53 -0% | |
| Load Maximum * (dB) | 59 | 60 -2% | 53 10% | 54 8% | 54 ? 8% |
* ... menor é melhor
(±) A temperatura máxima no lado superior é 44 °C / 111 F, em comparação com a média de 40.4 °C / 105 F , variando de 21.2 a 68.8 °C para a classe Gaming.
(±) A parte inferior aquece até um máximo de 45 °C / 113 F, em comparação com a média de 43.2 °C / 110 F
(+) Em uso inativo, a temperatura média para o lado superior é 29.1 °C / 84 F, em comparação com a média do dispositivo de 33.9 °C / ### class_avg_f### F.
(±) Jogando The Witcher 3, a temperatura média para o lado superior é 32.4 °C / 90 F, em comparação com a média do dispositivo de 33.9 °C / ## #class_avg_f### F.
(+) Os apoios para as mãos e o touchpad estão atingindo a temperatura máxima da pele (35 °C / 95 F) e, portanto, não estão quentes.
(-) A temperatura média da área do apoio para as mãos de dispositivos semelhantes foi 28.8 °C / 83.8 F (-6.2 °C / -11.2 F).
| Schenker XMG Ultra 17 Coffee Lake Refresh i9-9900K, GeForce GTX 1080 Mobile | Schenker XMG Ultra 17 i7-8700, GeForce GTX 1080 Mobile | Asus Chimera G703GI i9-8950HK, GeForce GTX 1080 Mobile | Aorus X7 DT v8 i7-8850H, GeForce GTX 1080 Mobile | Média da turma Gaming | |
|---|---|---|---|---|---|
| Heat | 0% | -6% | -6% | -3% | |
| Maximum Upper Side * (°C) | 44 | 41 7% | 50 -14% | 51 -16% | 45.2 ? -3% |
| Maximum Bottom * (°C) | 45 | 48 -7% | 50 -11% | 63 -40% | 48.2 ? -7% |
| Idle Upper Side * (°C) | 32 | 30 6% | 32 -0% | 27 16% | 31.1 ? 3% |
| Idle Bottom * (°C) | 33 | 35 -6% | 33 -0% | 28 15% | 34.3 ? -4% |
* ... menor é melhor
Schenker XMG Ultra 17 Coffee Lake Refresh análise de áudio
(±) | o volume do alto-falante é médio, mas bom (###valor### dB)
Graves 100 - 315Hz
(±) | graves reduzidos - em média 5.4% menor que a mediana
(±) | a linearidade dos graves é média (13% delta para a frequência anterior)
Médios 400 - 2.000 Hz
(±) | médios mais altos - em média 7.1% maior que a mediana
(±) | a linearidade dos médios é média (8% delta para frequência anterior)
Altos 2 - 16 kHz
(+) | agudos equilibrados - apenas 1.9% longe da mediana
(+) | os máximos são lineares (3.2% delta da frequência anterior)
Geral 100 - 16.000 Hz
(+) | o som geral é linear (13.2% diferença em relação à mediana)
Comparado com a mesma classe
» 19% de todos os dispositivos testados nesta classe foram melhores, 4% semelhantes, 77% piores
» O melhor teve um delta de 6%, a média foi 18%, o pior foi 132%
Comparado com todos os dispositivos testados
» 13% de todos os dispositivos testados foram melhores, 3% semelhantes, 84% piores
» O melhor teve um delta de 4%, a média foi 24%, o pior foi 134%
Asus Chimera G703GI análise de áudio
(+) | os alto-falantes podem tocar relativamente alto (###valor### dB)
Graves 100 - 315Hz
(±) | graves reduzidos - em média 8.9% menor que a mediana
(+) | o baixo é linear (6.4% delta para a frequência anterior)
Médios 400 - 2.000 Hz
(+) | médios equilibrados - apenas 3.1% longe da mediana
(+) | médios são lineares (2.4% delta para frequência anterior)
Altos 2 - 16 kHz
(+) | agudos equilibrados - apenas 4.4% longe da mediana
(+) | os máximos são lineares (3.2% delta da frequência anterior)
Geral 100 - 16.000 Hz
(+) | o som geral é linear (11.8% diferença em relação à mediana)
Comparado com a mesma classe
» 11% de todos os dispositivos testados nesta classe foram melhores, 4% semelhantes, 85% piores
» O melhor teve um delta de 6%, a média foi 18%, o pior foi 132%
Comparado com todos os dispositivos testados
» 8% de todos os dispositivos testados foram melhores, 3% semelhantes, 89% piores
» O melhor teve um delta de 4%, a média foi 24%, o pior foi 134%
| desligado | |
| Ocioso | |
| Carga |
|
Key:
min: | |
| Schenker XMG Ultra 17 Coffee Lake Refresh i9-9900K, GeForce GTX 1080 Mobile | Schenker XMG Ultra 17 i7-8700, GeForce GTX 1080 Mobile | Asus Chimera G703GI i9-8950HK, GeForce GTX 1080 Mobile | Aorus X7 DT v8 i7-8850H, GeForce GTX 1080 Mobile | Média da turma Gaming | |
|---|---|---|---|---|---|
| Power Consumption | -8% | -18% | 2% | 32% | |
| Idle Minimum * (Watt) | 33 | 32 3% | 29 12% | 23 30% | 13.3 ? 60% |
| Idle Average * (Watt) | 42 | 38 10% | 37 12% | 33 21% | 19 ? 55% |
| Idle Maximum * (Watt) | 49 | 45 8% | 46 6% | 37 24% | 24.5 ? 50% |
| Load Average * (Watt) | 93 | 96 -3% | 156 -68% | 115 -24% | 108.1 ? -16% |
| Witcher 3 ultra * (Watt) | 156 | 237 -52% | 252 -62% | 225 -44% | |
| Load Maximum * (Watt) | 293 | 331 -13% | 314 -7% | 281 4% | 254 ? 13% |
* ... menor é melhor
| Schenker XMG Ultra 17 Coffee Lake Refresh i9-9900K, GeForce GTX 1080 Mobile, 82 Wh | Schenker XMG Ultra 17 i7-8700, GeForce GTX 1080 Mobile, 82 Wh | Asus Chimera G703GI i9-8950HK, GeForce GTX 1080 Mobile, 71 Wh | Aorus X7 DT v8 i7-8850H, GeForce GTX 1080 Mobile, 94.24 Wh | Média da turma Gaming | |
|---|---|---|---|---|---|
| Duração da bateria | 6% | -4% | 59% | 164% | |
| Reader / Idle (h) | 2.9 | 2.7 -7% | 2.8 -3% | 4.9 69% | 8.71 ? 200% |
| WiFi v1.3 (h) | 1.9 | 2.4 26% | 2.2 16% | 3.8 100% | 7.01 ? 269% |
| Load (h) | 1.2 | 1.2 0% | 0.9 -25% | 1.3 8% | 1.47 ? 23% |
| H.264 (h) | 2.5 | 8.26 ? |
Pro
Contra
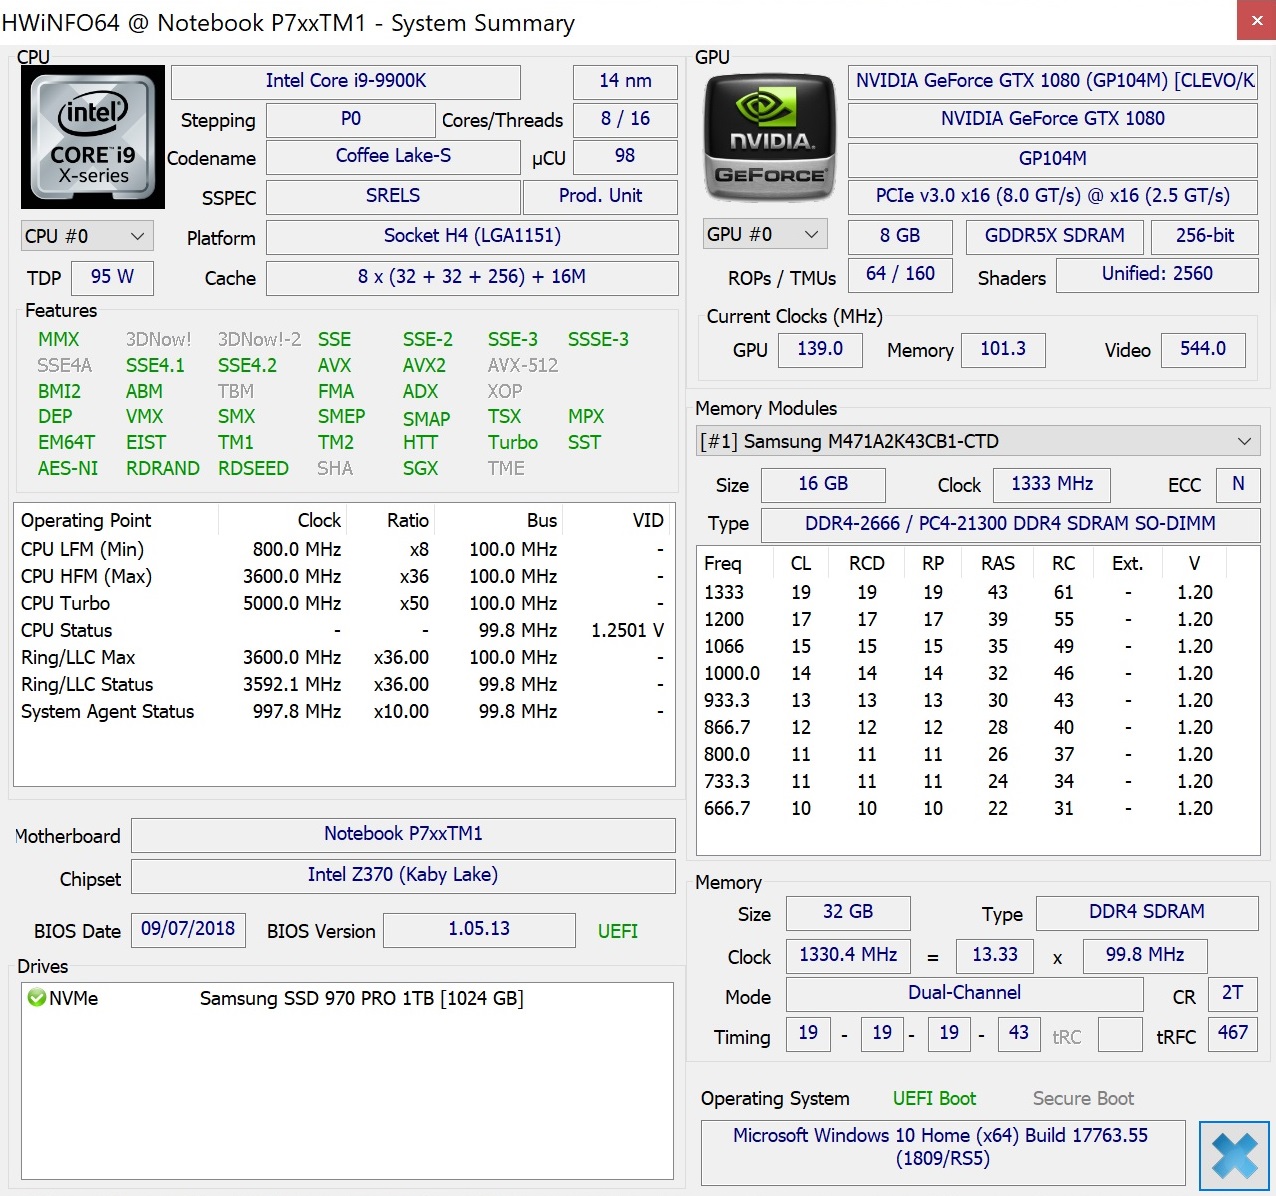
Um desempenho impressionante que vale a pena apenas para poucos usuários - é assim que você pode resumir o Core i9-9900K em uma frase.
Enquanto oito núcleos e dezesseis threads podem trazer uma grande vantagem em alguns cenários de uso específicos, os gamers podem relaxar e continuar confiando em um portátil quad ou hexa-core (com Hyper-theading).
O portátil em si deixa uma boa impressão. No entanto, como é habitual na gama alta absoluta, você é confrontado com um alto nível de ruído e baixa mobilidade (palavras-chave: dimensões, peso e duração da bateria).
Além dessas fraquezas, o dispositivo de 17 polegadas não merece muitas outras queixas. Além do equipamento de conexão e das opções de configuração e atualização, os dispositivos de entrada e som também conseguem nos convencer em grande parte.
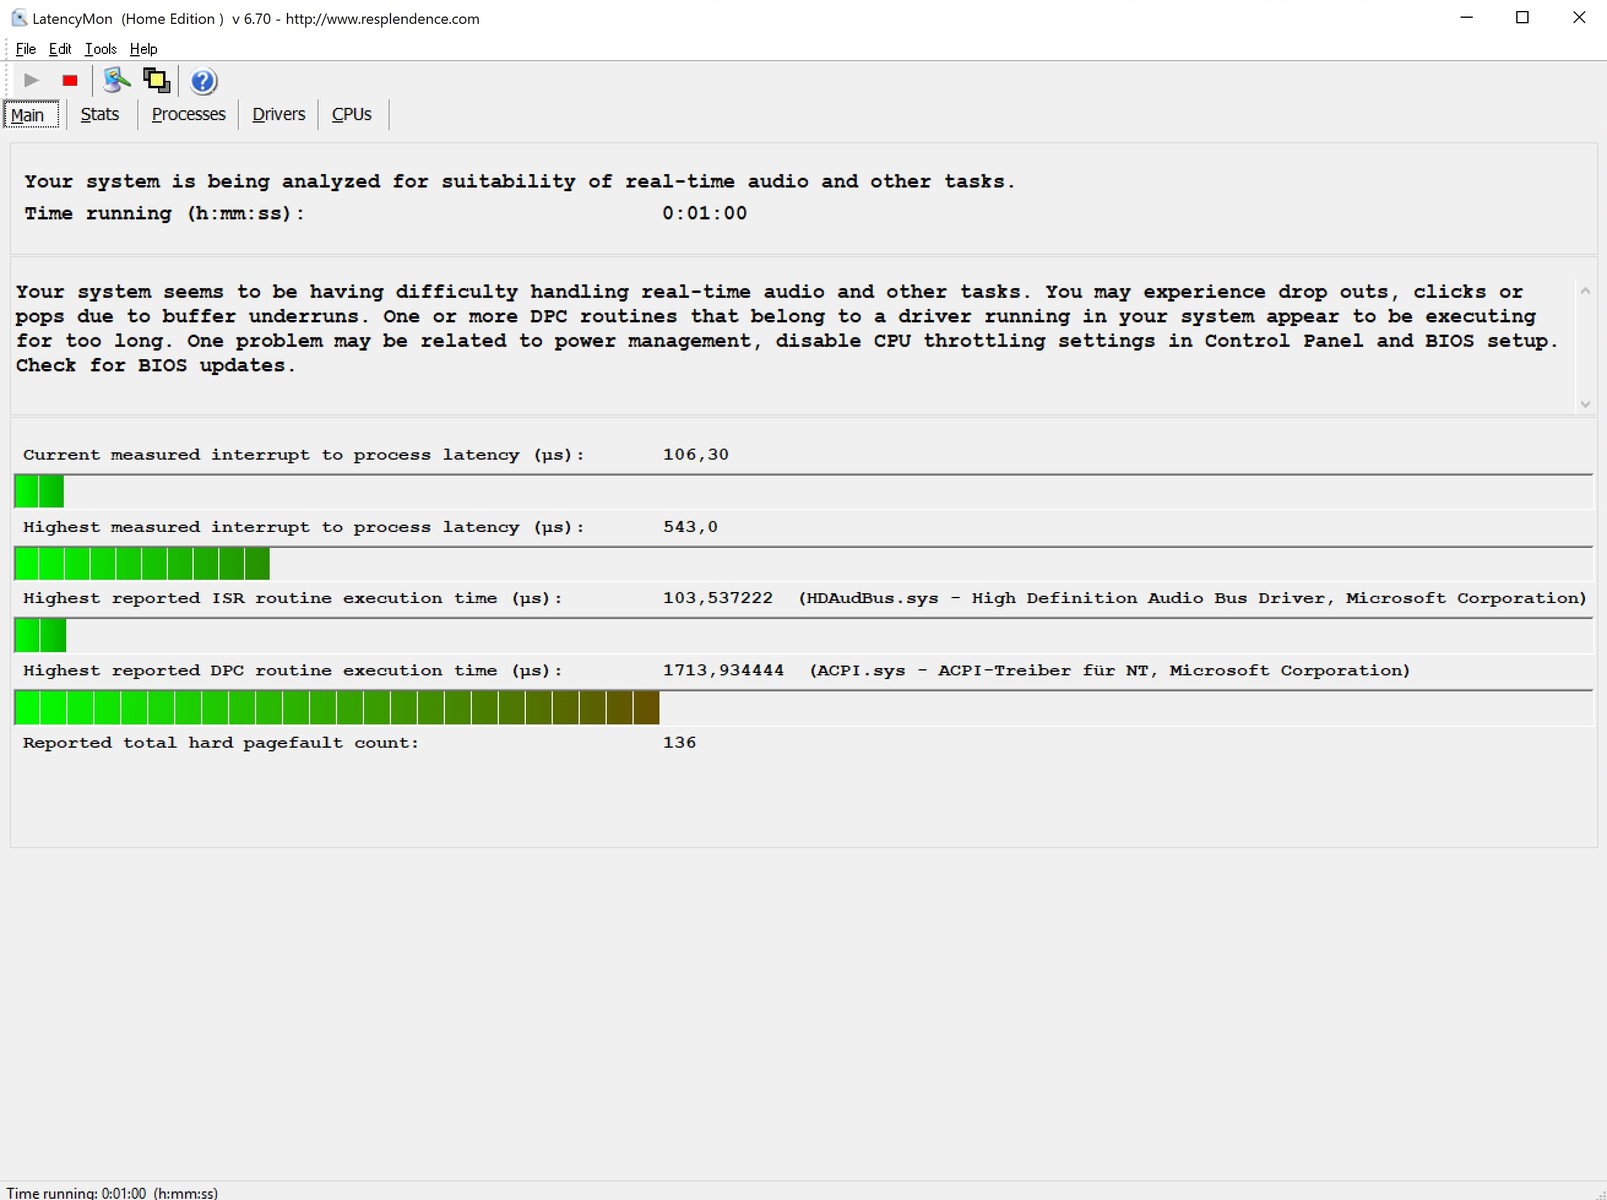
O Clevo Barebone P775TM1-G é baseado em um substituto de desktop real que poderia facilmente se enfrentar a uma torre de PC bem equipada. No entanto, o fabricante ainda deve cuidar dos problemas de velocidade acima mencionados que podem estar relacionados ao software em vez de ao hardware.
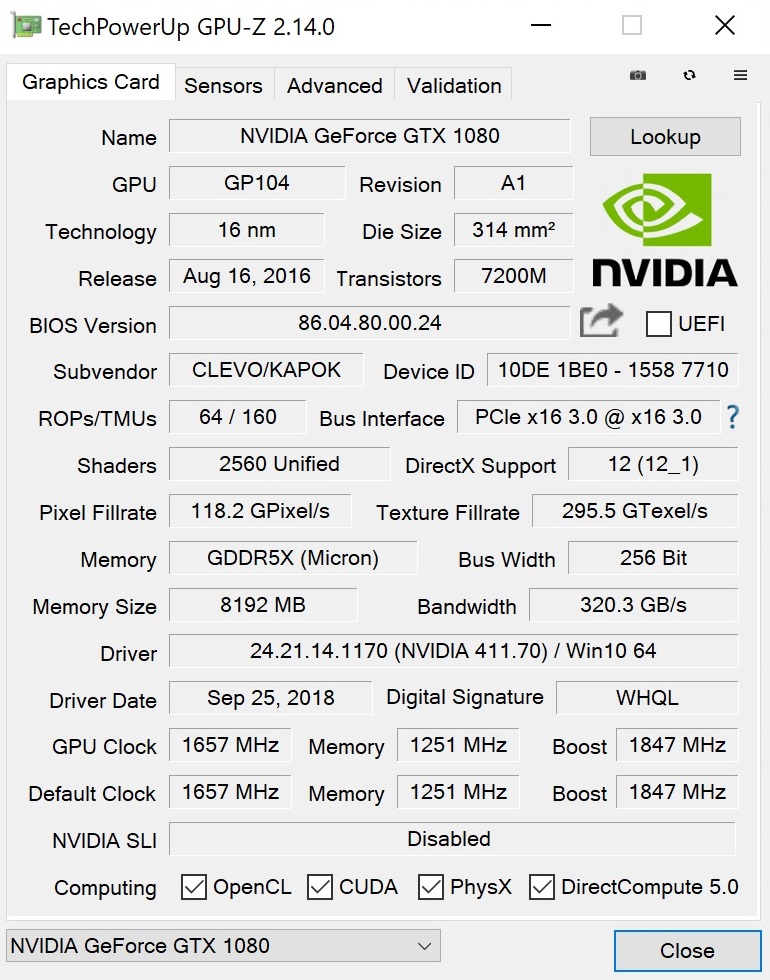
Schenker XMG Ultra 17 Coffee Lake Refresh
- 10/30/2018 v6 (old)
Florian Glaser
Price comparison