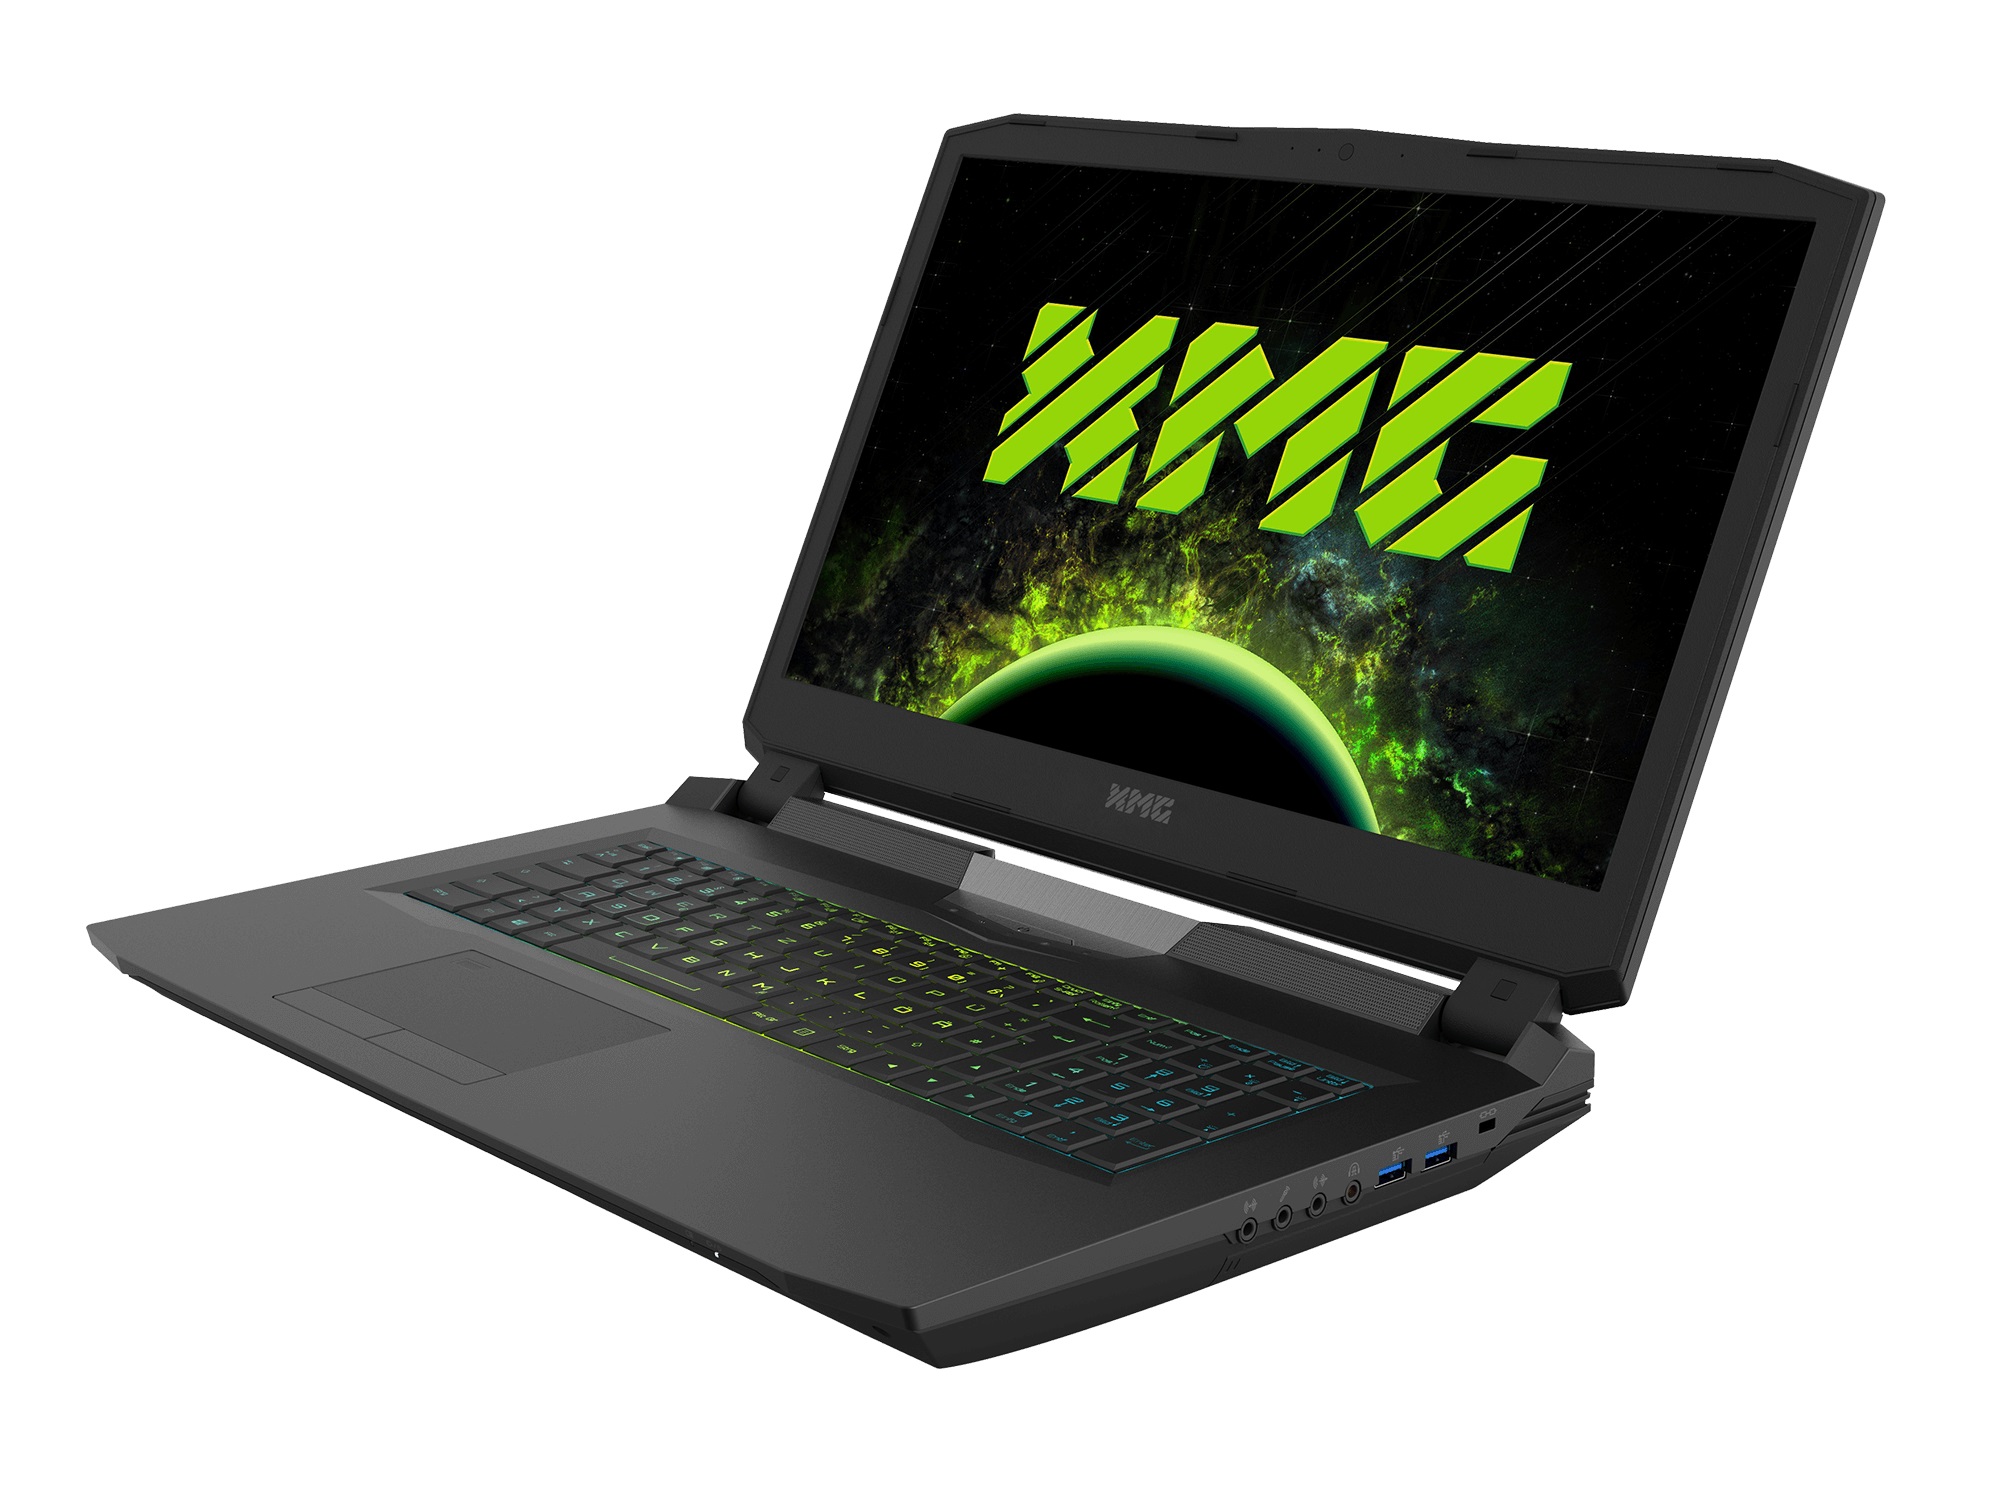
Breve Análise do Portátil Schenker XMG Ultra 17 (Clevo P775TM1-G)
| SD Card Reader | |
| average JPG Copy Test (av. of 3 runs) | |
| Guru Mars K (Toshiba Exceria Pro SDXC 64 GB UHS-II) | |
| Schenker XMG Ultra 17 (Toshiba Exceria Pro SDXC 64 GB UHS-II) | |
| Média da turma Gaming (20.9 - 210, n=55, últimos 2 anos) | |
| MSI GT75VR 7RF-012 Titan Pro (Toshiba Exceria Pro SDXC 64 GB UHS-II) | |
| Acer Predator 17 X GX-792-76DL (Toshiba Exceria Pro SDXC 64 GB UHS-II) | |
| maximum AS SSD Seq Read Test (1GB) | |
| Schenker XMG Ultra 17 (Toshiba Exceria Pro SDXC 64 GB UHS-II) | |
| Guru Mars K (Toshiba Exceria Pro SDXC 64 GB UHS-II) | |
| Média da turma Gaming (25.5 - 261, n=52, últimos 2 anos) | |
| Acer Predator 17 X GX-792-76DL (Toshiba Exceria Pro SDXC 64 GB UHS-II) | |
| MSI GT75VR 7RF-012 Titan Pro (Toshiba Exceria Pro SDXC 64 GB UHS-II) | |
| |||||||||||||||||||||||||
iluminação: 88 %
iluminação com acumulador: 332 cd/m²
Contraste: 1186:1 (Preto: 0.28 cd/m²)
ΔE ColorChecker Calman: 3.86 | ∀{0.5-29.43 Ø4.73}
ΔE Greyscale Calman: 4.33 | ∀{0.09-98 Ø4.97}
100% sRGB (Argyll 1.6.3 3D)
88% AdobeRGB 1998 (Argyll 1.6.3 3D)
99.1% AdobeRGB 1998 (Argyll 3D)
100% sRGB (Argyll 3D)
86.4% Display P3 (Argyll 3D)
Gamma: 2.41
CCT: 6595 K
| Schenker XMG Ultra 17 AU Optronics B173ZAN01.0 (AUO109B), IPS, 3840x2160 | Guru Mars K LGD046E, IPS, 1920x1080 | Acer Predator 17 X GX-792-76DL LP173WF4-SPF5 (LGD056D), IPS, 1920x1080 | MSI GT75VR 7RF-012 Titan Pro CMN N173HHE-G32 (CMN1747), TN LED, 1920x1080 | Alienware 17 R4 TN LED, 2560x1440 | |
|---|---|---|---|---|---|
| Display | -25% | -26% | -2% | -28% | |
| Display P3 Coverage (%) | 86.4 | 67.3 -22% | 66 -24% | 90.3 5% | 61.2 -29% |
| sRGB Coverage (%) | 100 | 85.1 -15% | 83.7 -16% | 99.6 0% | 82.9 -17% |
| AdobeRGB 1998 Coverage (%) | 99.1 | 62.3 -37% | 61.2 -38% | 86.8 -12% | 60.5 -39% |
| Response Times | 5% | -8% | 74% | 40% | |
| Response Time Grey 50% / Grey 80% * (ms) | 44 ? | 37.6 ? 15% | 45 ? -2% | 11.6 ? 74% | 30 ? 32% |
| Response Time Black / White * (ms) | 24.8 ? | 26.4 ? -6% | 28 ? -13% | 6.8 ? 73% | 12.8 ? 48% |
| PWM Frequency (Hz) | 133.3 ? | 25000 ? | |||
| Screen | -7% | -10% | 13% | -31% | |
| Brightness middle (cd/m²) | 332 | 343 3% | 380 14% | 274 -17% | 402.3 21% |
| Brightness (cd/m²) | 313 | 330 5% | 362 16% | 262 -16% | 372 19% |
| Brightness Distribution (%) | 88 | 91 3% | 91 3% | 87 -1% | 86 -2% |
| Black Level * (cd/m²) | 0.28 | 0.32 -14% | 0.37 -32% | 0.26 7% | 0.62 -121% |
| Contrast (:1) | 1186 | 1072 -10% | 1027 -13% | 1054 -11% | 649 -45% |
| Colorchecker dE 2000 * | 3.86 | 3.61 6% | 4.12 -7% | 1.36 65% | 5.6 -45% |
| Colorchecker dE 2000 max. * | 5.88 | 8.16 -39% | 8.19 -39% | 4.1 30% | 9.8 -67% |
| Greyscale dE 2000 * | 4.33 | 3.03 30% | 3.95 9% | 0.64 85% | 4.7 -9% |
| Gamma | 2.41 91% | 2.41 91% | 2.47 89% | 2.19 100% | 2.14 103% |
| CCT | 6595 99% | 6568 99% | 6539 99% | 6551 99% | 7519 86% |
| Color Space (Percent of AdobeRGB 1998) (%) | 88 | 56 -36% | 55 -37% | 77 -12% | 53.7 -39% |
| Color Space (Percent of sRGB) (%) | 100 | 85 -15% | 84 -16% | 100 0% | 82.2 -18% |
| Média Total (Programa/Configurações) | -9% /
-9% | -15% /
-13% | 28% /
18% | -6% /
-21% |
* ... menor é melhor
Exibir tempos de resposta
| ↔ Tempo de resposta preto para branco | ||
|---|---|---|
| 24.8 ms ... ascensão ↗ e queda ↘ combinadas | ↗ 11.6 ms ascensão |  |
| ↘ 13.2 ms queda | ||
| A tela mostra boas taxas de resposta em nossos testes, mas pode ser muito lenta para jogadores competitivos. Em comparação, todos os dispositivos testados variam de 0.1 (mínimo) a 240 (máximo) ms. » 58 % de todos os dispositivos são melhores. Isso significa que o tempo de resposta medido é pior que a média de todos os dispositivos testados (19.9 ms). | ||
| ↔ Tempo de resposta 50% cinza a 80% cinza | ||
| 44 ms ... ascensão ↗ e queda ↘ combinadas | ↗ 22.8 ms ascensão | 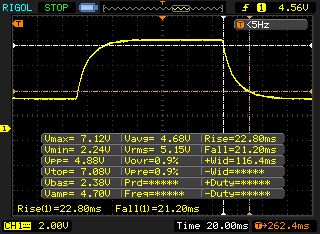 |
| ↘ 21.2 ms queda | ||
| A tela mostra taxas de resposta lentas em nossos testes e será insatisfatória para os jogadores. Em comparação, todos os dispositivos testados variam de 0.165 (mínimo) a 636 (máximo) ms. » 73 % de todos os dispositivos são melhores. Isso significa que o tempo de resposta medido é pior que a média de todos os dispositivos testados (31.1 ms). | ||
Cintilação da tela / PWM (modulação por largura de pulso)
| Tela tremeluzindo / PWM não detectado | 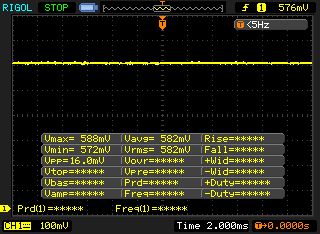 | ||
[pwm_comparison] Em comparação: 52 % de todos os dispositivos testados não usam PWM para escurecer a tela. Se PWM foi detectado, uma média de 7798 (mínimo: 5 - máximo: 343500) Hz foi medida. | |||
| PCMark 10 - Score | |
| Média da turma Gaming (5828 - 11574, n=96, últimos 2 anos) | |
| Schenker XMG Ultra 17 | |
| Média Intel Core i7-8700, NVIDIA GeForce GTX 1080 Mobile (n=1) | |
| Guru Mars K | |
| MSI GT75VR 7RF-012 Titan Pro | |
| PCMark 8 Home Score Accelerated v2 | 4865 pontos | |
| PCMark 8 Work Score Accelerated v2 | 4849 pontos | |
| PCMark 10 Score | 5976 pontos | |
Ajuda | ||
| Schenker XMG Ultra 17 Samsung SSD 960 Evo 500GB m.2 NVMe | Guru Mars K Samsung SSD 960 Evo 500GB m.2 NVMe | Acer Predator 17 X GX-792-76DL Toshiba NVMe THNSN5512GPU7 | MSI GT75VR 7RF-012 Titan Pro 2x Samsung SM961 MZVPW256HEGL NVMe (RAID 0) | Alienware 17 R4 SK Hynix PC300 NVMe 512 GB | Média Samsung SSD 960 Evo 500GB m.2 NVMe | |
|---|---|---|---|---|---|---|
| AS SSD | -23% | 1% | -39% | -3% | ||
| Seq Read (MB/s) | 2533 | 2261 -11% | 3137 24% | 1752 -31% | 2433 ? -4% | |
| Seq Write (MB/s) | 1771 | 1338 -24% | 2352 33% | 735 -58% | 1647 ? -7% | |
| 4K Read (MB/s) | 43.65 | 39.52 -9% | 50.1 15% | 35.61 -18% | 45.5 ? 4% | |
| 4K Write (MB/s) | 139.5 | 133.8 -4% | 128.8 -8% | 113.4 -19% | 142.4 ? 2% | |
| Score Read (Points) | 1716 | 1118 -35% | 1412 -18% | 831 -52% | 1645 ? -4% | |
| Score Write (Points) | 1615 | 930 -42% | 1289 -20% | 858 -47% | 1518 ? -6% | |
| Score Total (Points) | 4173 | 2581 -38% | 3392 -19% | 2072 -50% | 3968 ? -5% |

| 3DMark 06 Standard Score | 30222 pontos | |
| 3DMark 11 Performance | 22034 pontos | |
| 3DMark Cloud Gate Standard Score | 37952 pontos | |
| 3DMark Fire Strike Score | 17997 pontos | |
| 3DMark Time Spy Score | 6942 pontos | |
Ajuda | ||
| The Witcher 3 | |
| 3840x2160 High Graphics & Postprocessing (Nvidia HairWorks Off) | |
| Média da turma Gaming (114 - 169.8, n=3, últimos 2 anos) | |
| Guru Mars K | |
| MSI GT75VR 7RF-012 Titan Pro | |
| Schenker XMG Ultra 17 | |
| Média NVIDIA GeForce GTX 1080 Mobile (44.4 - 55.8, n=11) | |
| Acer Predator 17 X GX-792-76DL | |
| 1920x1080 Ultra Graphics & Postprocessing (HBAO+) | |
| Média da turma Gaming (95 - 240, n=8, últimos 2 anos) | |
| Alienware 17 R4 | |
| MSI GT75VR 7RF-012 Titan Pro | |
| Guru Mars K | |
| Schenker XMG Ultra 17 | |
| Média NVIDIA GeForce GTX 1080 Mobile (61.7 - 78.1, n=23) | |
| Acer Predator 17 X GX-792-76DL | |
| baixo | média | alto | ultra | 4K | |
|---|---|---|---|---|---|
| The Witcher 3 (2015) | 142 | 75.6 | 51.3 | ||
| FIFA 18 (2017) | 289 | 286 | 249 | ||
| Wolfenstein II: The New Colossus (2017) | 136 | 127 | 52.1 | ||
| Assassin´s Creed Origins (2017) | 86 | 76 | 39 | ||
| Call of Duty WWII (2017) | 160 | 131 | 63.2 | ||
| Need for Speed Payback (2017) | 137 | 131 | 48.9 | ||
| Star Wars Battlefront 2 (2017) | 137 | 115 | 39.6 | ||
| Fortnite (2018) | 194 | 141 | 41.4 | ||
| Final Fantasy XV Benchmark (2018) | 74.4 | 31.8 | |||
| Kingdom Come: Deliverance (2018) | 104 | 76.8 | 25.8 |
Barulho
| Ocioso |
| 34 / 35 / 40 dB |
| Carga |
| 45 / 60 dB |
 | ||
30 dB silencioso 40 dB(A) audível 50 dB(A) ruidosamente alto |
||
min: | ||
| Schenker XMG Ultra 17 GeForce GTX 1080 Mobile, i7-8700 | Guru Mars K GeForce GTX 1080 Mobile, i7-7700 | Acer Predator 17 X GX-792-76DL GeForce GTX 1080 Mobile, i7-7820HK | MSI GT75VR 7RF-012 Titan Pro GeForce GTX 1080 Mobile, i7-7820HK | Alienware 17 R4 GeForce GTX 1080 Mobile, i7-7820HK | |
|---|---|---|---|---|---|
| Noise | 0% | 6% | 0% | 2% | |
| desligado / ambiente * (dB) | 30 | 29 3% | 30 -0% | 30 -0% | 28.2 6% |
| Idle Minimum * (dB) | 34 | 36 -6% | 33 3% | 33 3% | 35.6 -5% |
| Idle Average * (dB) | 35 | 37 -6% | 35 -0% | 34 3% | 35.6 -2% |
| Idle Maximum * (dB) | 40 | 40 -0% | 37 7% | 38 5% | 35.7 11% |
| Load Average * (dB) | 45 | 45 -0% | 40 11% | 44 2% | 50.2 -12% |
| Witcher 3 ultra * (dB) | 52 | 50 4% | 56 -8% | 50.2 3% | |
| Load Maximum * (dB) | 60 | 55 8% | 50 17% | 62 -3% | 50.2 16% |
* ... menor é melhor
(±) A temperatura máxima no lado superior é 41 °C / 106 F, em comparação com a média de 40.4 °C / 105 F , variando de 21.2 a 68.8 °C para a classe Gaming.
(-) A parte inferior aquece até um máximo de 48 °C / 118 F, em comparação com a média de 43.2 °C / 110 F
(+) Em uso inativo, a temperatura média para o lado superior é 27.8 °C / 82 F, em comparação com a média do dispositivo de 33.9 °C / ### class_avg_f### F.
(±) Jogando The Witcher 3, a temperatura média para o lado superior é 35.2 °C / 95 F, em comparação com a média do dispositivo de 33.9 °C / ## #class_avg_f### F.
(+) Os apoios para as mãos e o touchpad são mais frios que a temperatura da pele, com um máximo de 30 °C / 86 F e, portanto, são frios ao toque.
(±) A temperatura média da área do apoio para as mãos de dispositivos semelhantes foi 28.8 °C / 83.8 F (-1.2 °C / -2.2 F).
| Schenker XMG Ultra 17 GeForce GTX 1080 Mobile, i7-8700 | Guru Mars K GeForce GTX 1080 Mobile, i7-7700 | Acer Predator 17 X GX-792-76DL GeForce GTX 1080 Mobile, i7-7820HK | MSI GT75VR 7RF-012 Titan Pro GeForce GTX 1080 Mobile, i7-7820HK | Alienware 17 R4 GeForce GTX 1080 Mobile, i7-7820HK | |
|---|---|---|---|---|---|
| Heat | -1% | 0% | -11% | -5% | |
| Maximum Upper Side * (°C) | 41 | 46 -12% | 44.2 -8% | 46 -12% | 49.6 -21% |
| Maximum Bottom * (°C) | 48 | 46 4% | 43 10% | 57 -19% | 56 -17% |
| Idle Upper Side * (°C) | 30 | 32 -7% | 32.4 -8% | 34 -13% | 29.6 1% |
| Idle Bottom * (°C) | 35 | 31 11% | 32.8 6% | 35 -0% | 29.2 17% |
* ... menor é melhor
Schenker XMG Ultra 17 análise de áudio
(±) | o volume do alto-falante é médio, mas bom (###valor### dB)
Graves 100 - 315Hz
(+) | bons graves - apenas 4.1% longe da mediana
(±) | a linearidade dos graves é média (12.2% delta para a frequência anterior)
Médios 400 - 2.000 Hz
(±) | médios mais altos - em média 5.5% maior que a mediana
(+) | médios são lineares (6.5% delta para frequência anterior)
Altos 2 - 16 kHz
(+) | agudos equilibrados - apenas 1.4% longe da mediana
(+) | os máximos são lineares (2% delta da frequência anterior)
Geral 100 - 16.000 Hz
(+) | o som geral é linear (11% diferença em relação à mediana)
Comparado com a mesma classe
» 7% de todos os dispositivos testados nesta classe foram melhores, 3% semelhantes, 89% piores
» O melhor teve um delta de 6%, a média foi 18%, o pior foi 132%
Comparado com todos os dispositivos testados
» 6% de todos os dispositivos testados foram melhores, 2% semelhantes, 92% piores
» O melhor teve um delta de 4%, a média foi 24%, o pior foi 134%
Acer Predator 17 X GX-792-76DL análise de áudio
(+) | os alto-falantes podem tocar relativamente alto (###valor### dB)
Graves 100 - 315Hz
(±) | graves reduzidos - em média 9.6% menor que a mediana
(±) | a linearidade dos graves é média (9.3% delta para a frequência anterior)
Médios 400 - 2.000 Hz
(+) | médios equilibrados - apenas 2.6% longe da mediana
(+) | médios são lineares (4.9% delta para frequência anterior)
Altos 2 - 16 kHz
(+) | agudos equilibrados - apenas 3.9% longe da mediana
(+) | os máximos são lineares (6.7% delta da frequência anterior)
Geral 100 - 16.000 Hz
(+) | o som geral é linear (11.1% diferença em relação à mediana)
Comparado com a mesma classe
» 8% de todos os dispositivos testados nesta classe foram melhores, 3% semelhantes, 89% piores
» O melhor teve um delta de 6%, a média foi 18%, o pior foi 132%
Comparado com todos os dispositivos testados
» 7% de todos os dispositivos testados foram melhores, 2% semelhantes, 92% piores
» O melhor teve um delta de 4%, a média foi 24%, o pior foi 134%
| desligado | |
| Ocioso | |
| Carga |
|
Key:
min: | |
| Schenker XMG Ultra 17 GeForce GTX 1080 Mobile, i7-8700 | Guru Mars K GeForce GTX 1080 Mobile, i7-7700 | Acer Predator 17 X GX-792-76DL GeForce GTX 1080 Mobile, i7-7820HK | MSI GT75VR 7RF-012 Titan Pro GeForce GTX 1080 Mobile, i7-7820HK | Alienware 17 R4 GeForce GTX 1080 Mobile, i7-7820HK | |
|---|---|---|---|---|---|
| Power Consumption | -3% | 12% | -7% | 2% | |
| Idle Minimum * (Watt) | 32 | 31 3% | 27 16% | 34 -6% | 37.5 -17% |
| Idle Average * (Watt) | 38 | 37 3% | 32 16% | 41 -8% | 37.6 1% |
| Idle Maximum * (Watt) | 45 | 44 2% | 41 9% | 50 -11% | 37.6 16% |
| Load Average * (Watt) | 96 | 116 -21% | 102 -6% | 106 -10% | 122.4 -28% |
| Witcher 3 ultra * (Watt) | 237 | 259 -9% | 257 -8% | 180.3 24% | |
| Load Maximum * (Watt) | 331 | 312 6% | 248 25% | 320 3% | 277.4 16% |
* ... menor é melhor
| Schenker XMG Ultra 17 GeForce GTX 1080 Mobile, i7-8700, 82 Wh | Guru Mars K GeForce GTX 1080 Mobile, i7-7700, 82 Wh | Acer Predator 17 X GX-792-76DL GeForce GTX 1080 Mobile, i7-7820HK, 88.8 Wh | MSI GT75VR 7RF-012 Titan Pro GeForce GTX 1080 Mobile, i7-7820HK, 75 Wh | Alienware 17 R4 GeForce GTX 1080 Mobile, i7-7820HK, 99 Wh | Média da turma Gaming | |
|---|---|---|---|---|---|---|
| Duração da bateria | 25% | 57% | 1% | 32% | 167% | |
| Reader / Idle (h) | 2.7 | 3.3 22% | 5.2 93% | 3 11% | 4.6 70% | 8.71 ? 223% |
| H.264 (h) | 2.5 | 2.6 4% | 3.4 36% | 2.5 0% | 8.26 ? 230% | |
| WiFi v1.3 (h) | 2.4 | 4.2 75% | 2.4 0% | 3 25% | 7.01 ? 192% | |
| Load (h) | 1.2 | 1.8 50% | 1.5 25% | 1.1 -8% | 1.2 0% | 1.47 ? 23% |
Pro
Contra
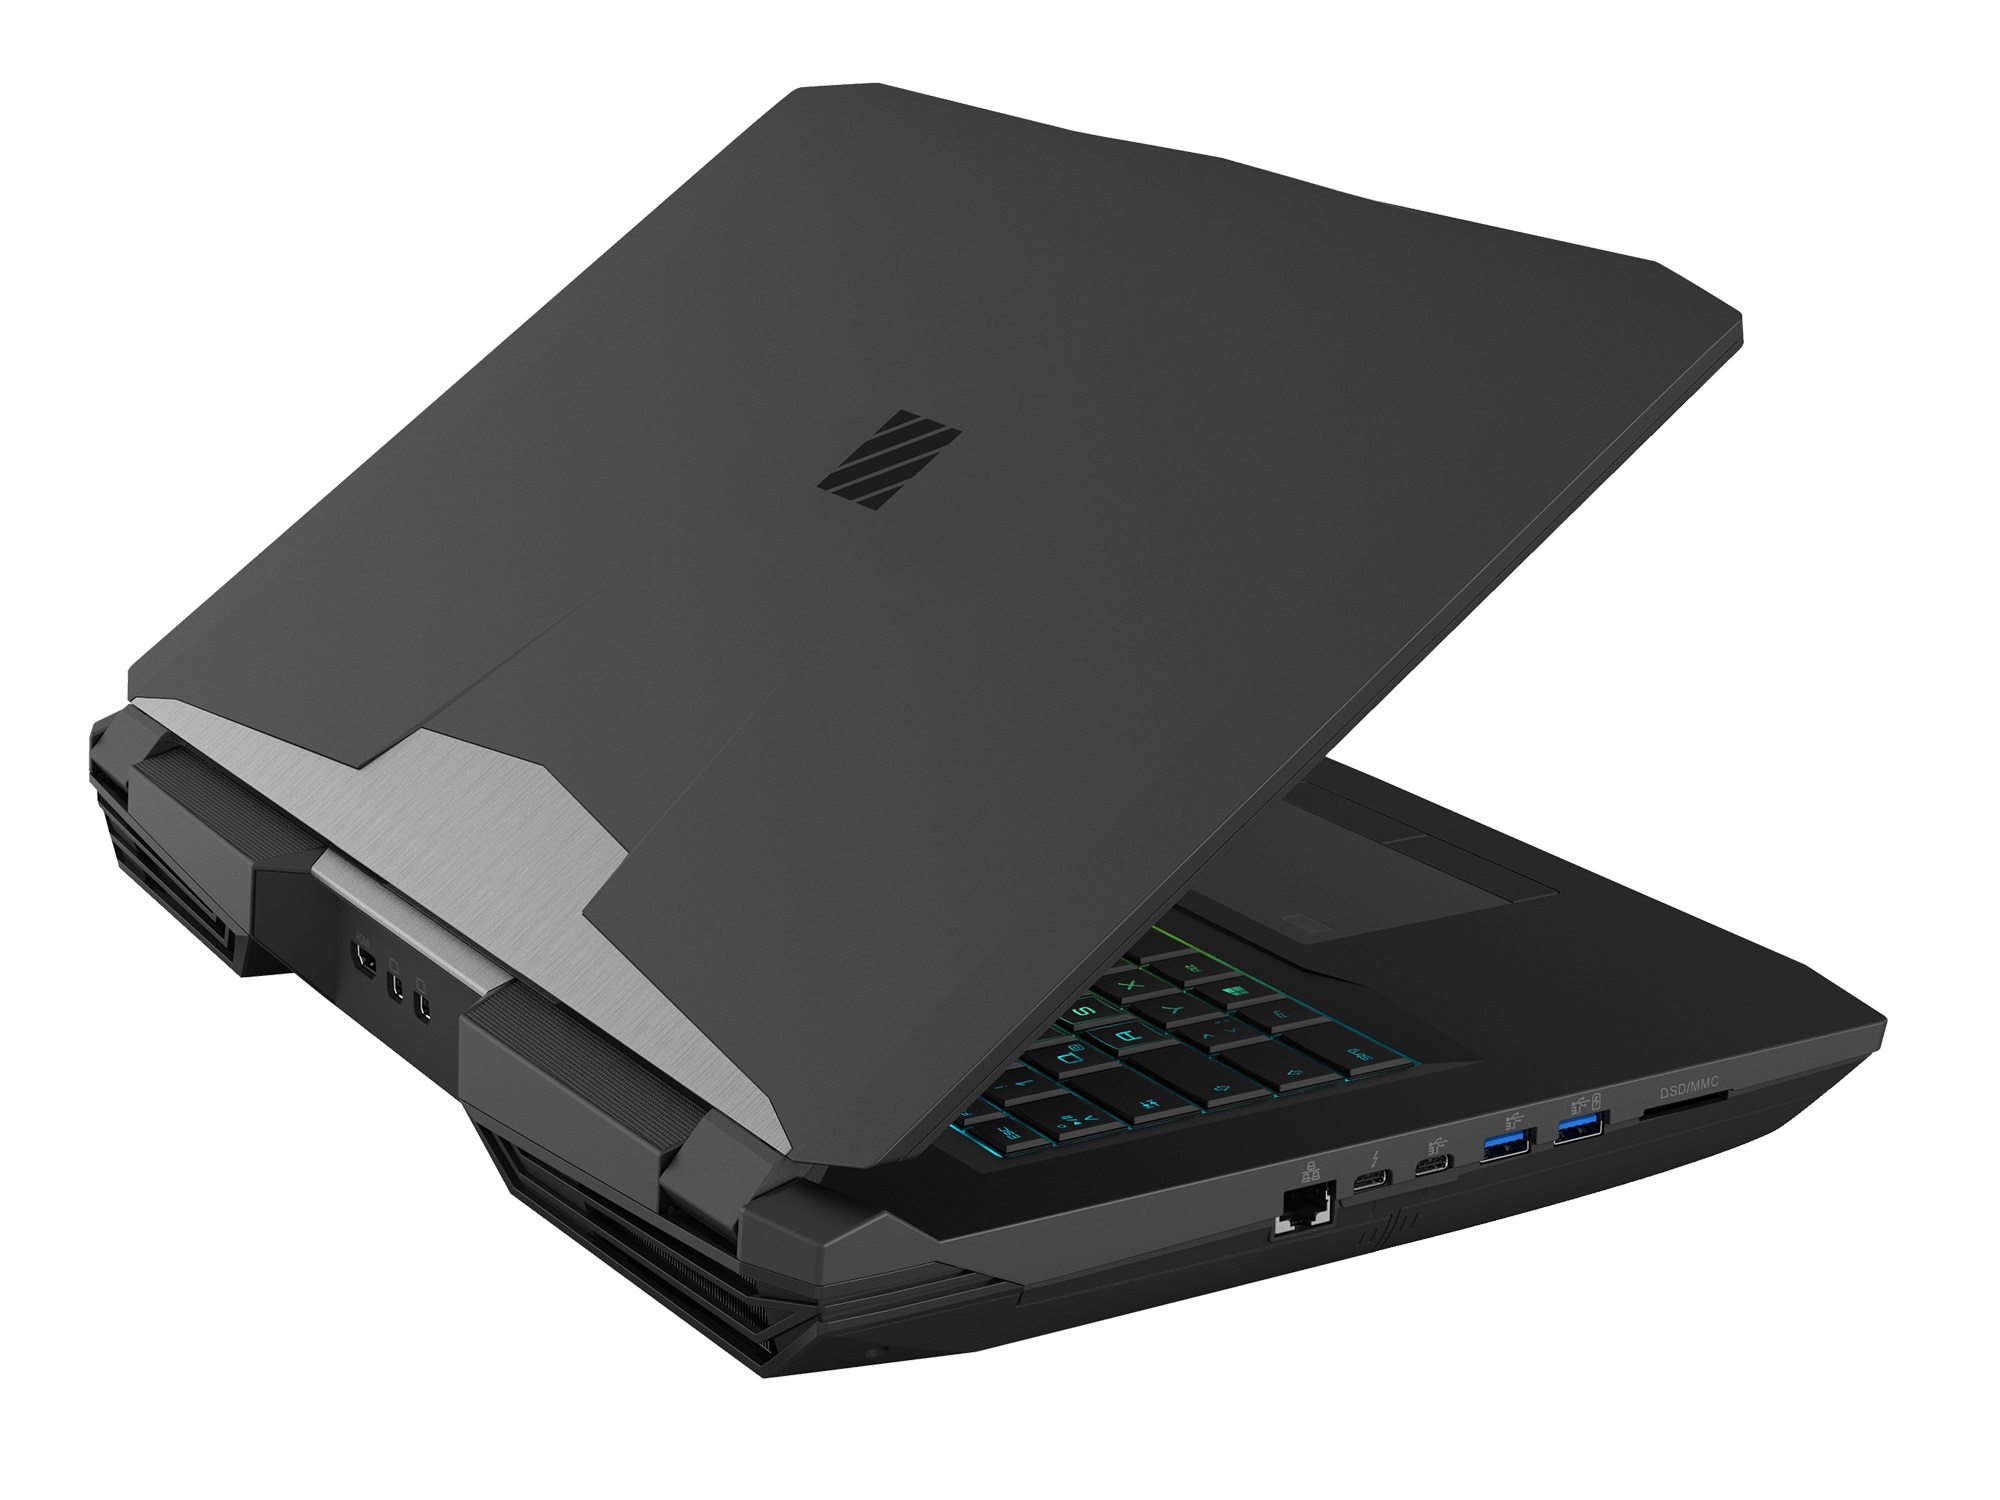
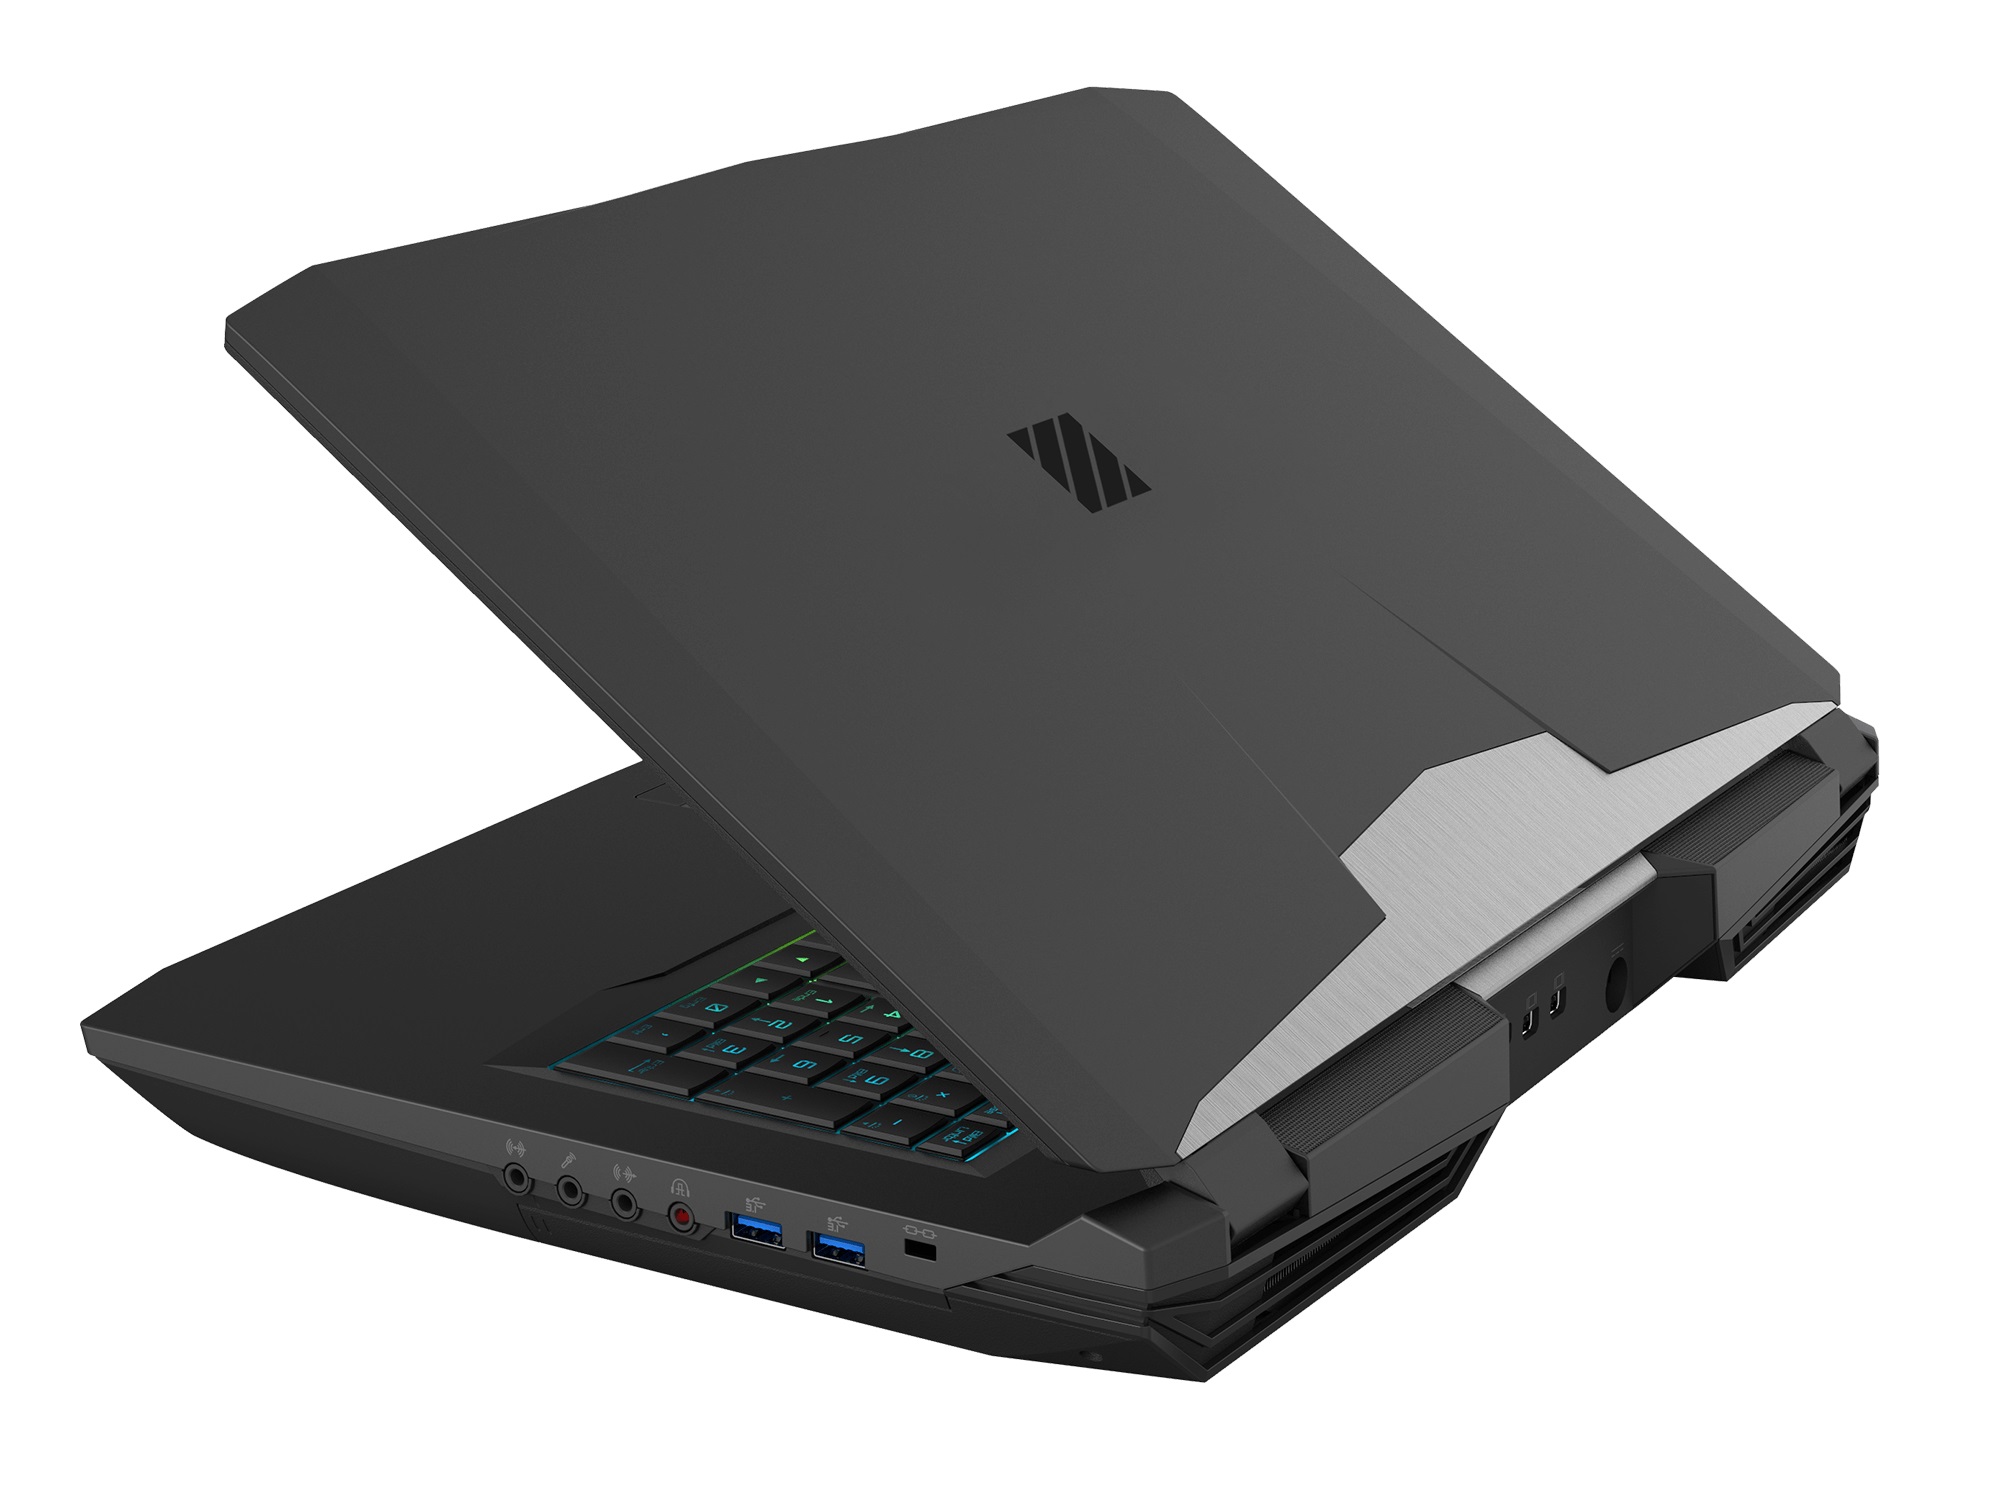
O XMG Ultra 17 foi projetado para gamers exigentes que não querem (mais) um pc de torre, mas com a capacidade de atualização e conectividade de um desktop clássico. Este é o tipo de comprador que a Schenker Technologies tenta atrair com este gigante de 17 polegadas.
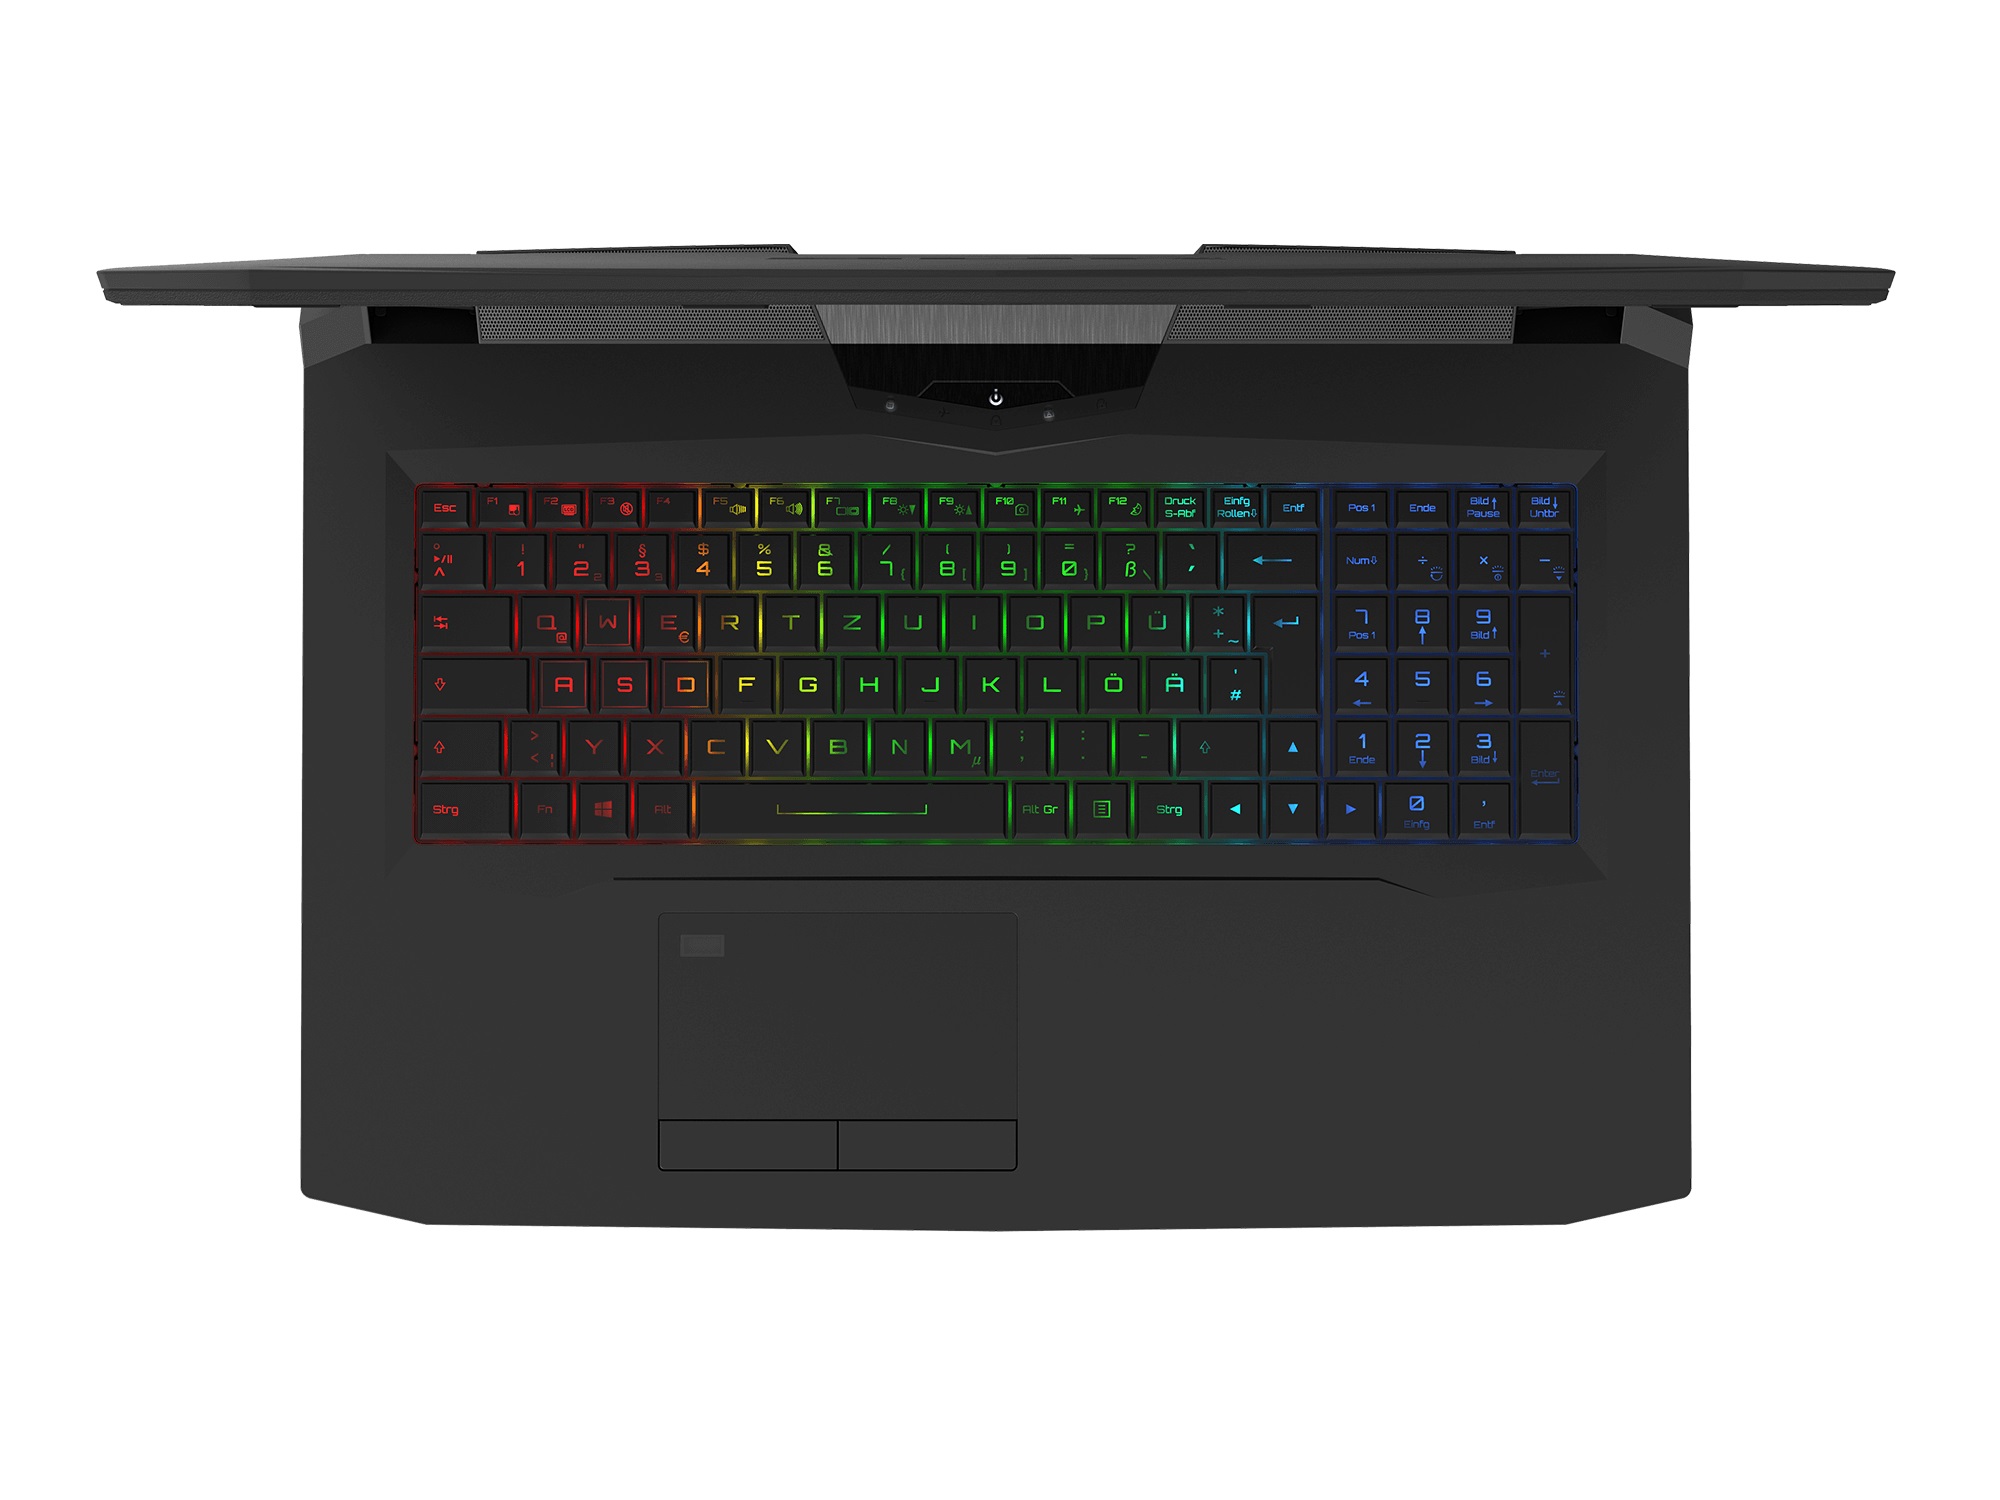
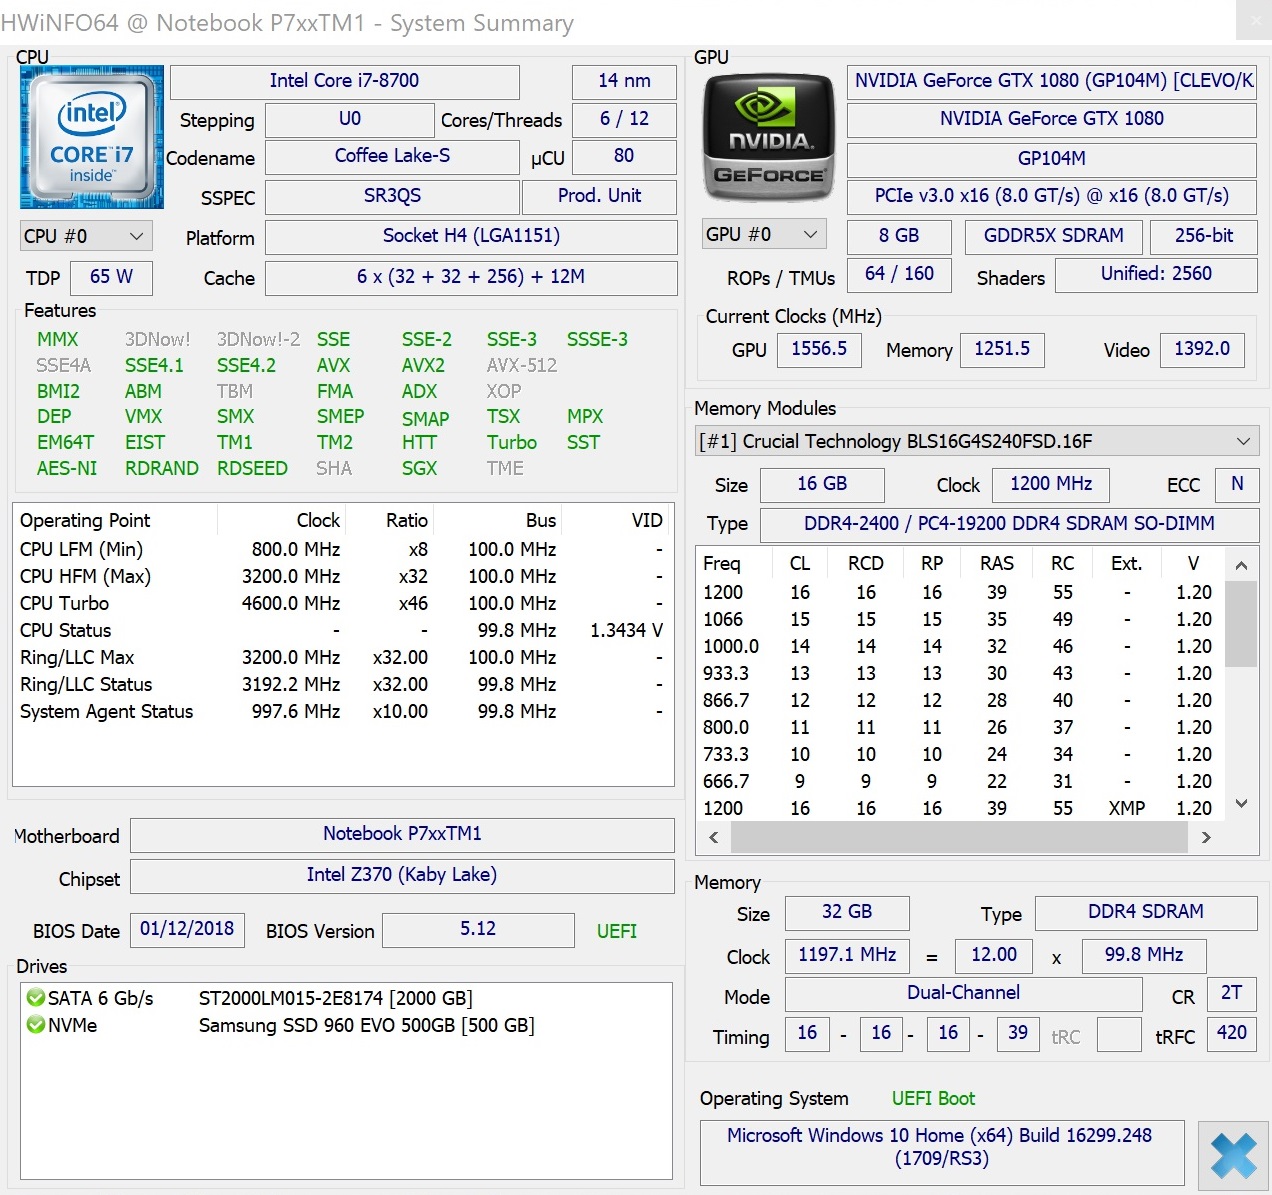
No lado positivo, junto com os excelentes dispositivos de entrada, a tela UHD excepcional com suporte para G-Sync, cuja representação de cores é a melhor em sala de aula. O desempenho também é excelente: A CPU Coffee Lake da Intel e a GPU Pascal da Nvidia garantem alto desempenho, embora os jogos de hoje raramente se beneficiem de seis núcleos, se o processador suportar SMT.
Poderiam ser feitas melhorias no controlador do ventilador, dado que está longe de ser perfeito. Uma duração decente da bateria também não deve ser esperada.
Schenker XMG Ultra 17
- 02/23/2018 v6 (old)
Florian Glaser
Price comparison