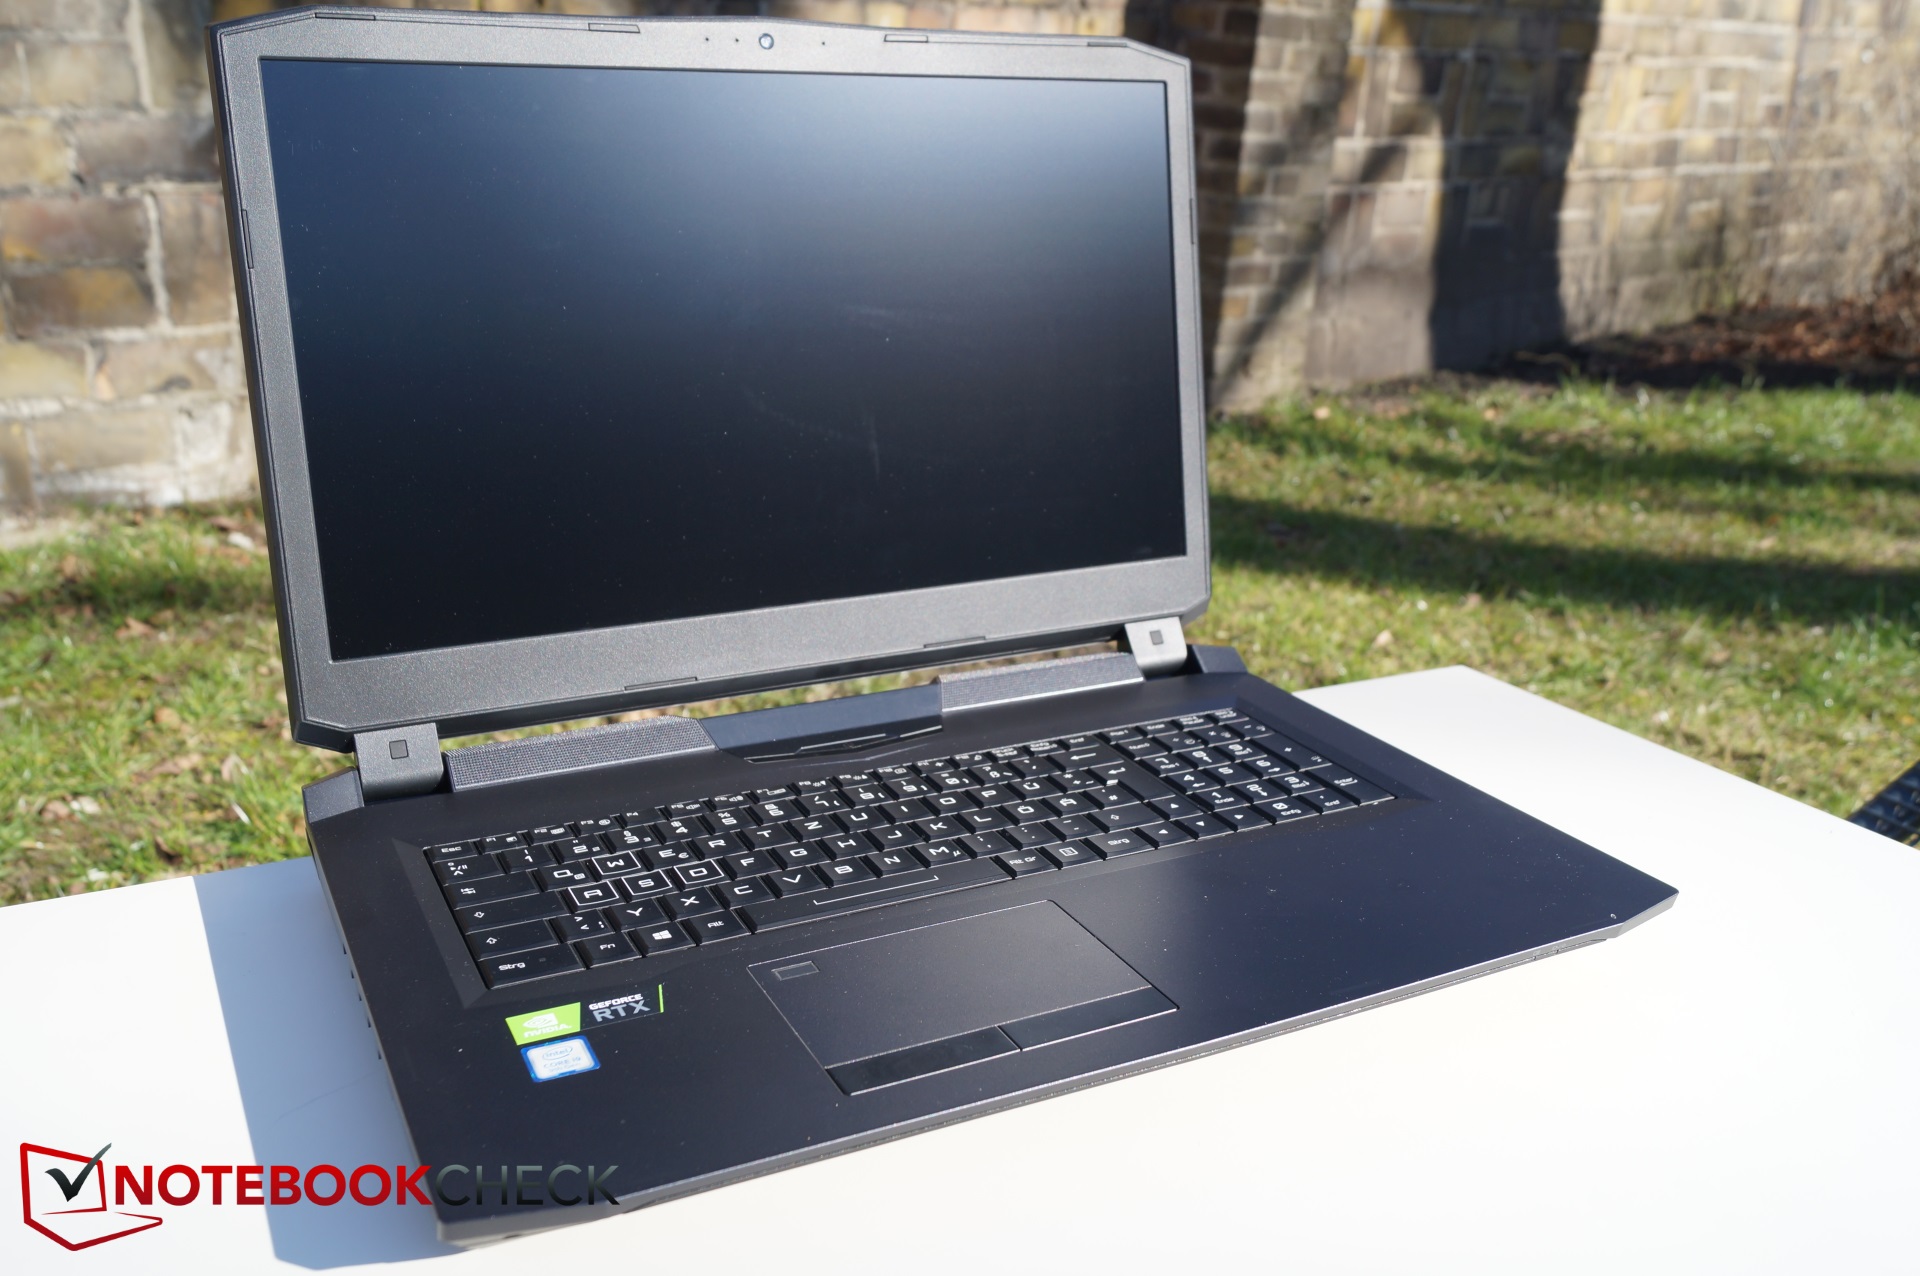
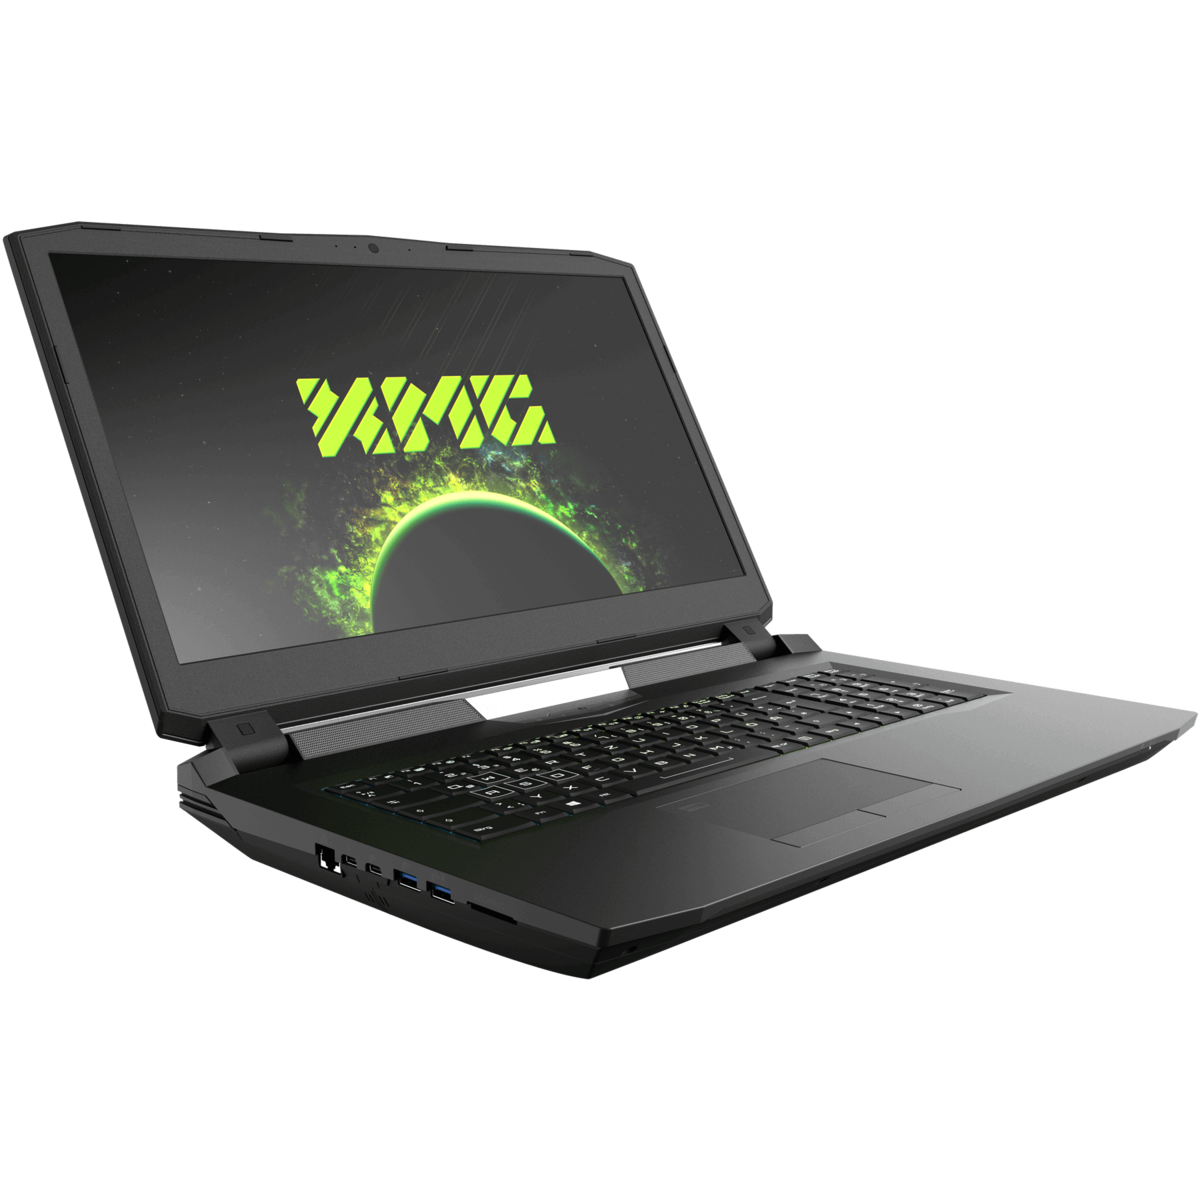
Breve Análise do Portátil Schenker XMG Ultra 17 (Core i9-9900K, RTX 2080) Clevo P775TM1-G
| SD Card Reader | |
| average JPG Copy Test (av. of 3 runs) | |
| Schenker XMG Ultra 17 Coffee Lake Refresh (Toshiba Exceria Pro SDXC 64 GB UHS-II) | |
| Schenker XMG Ultra 17 Turing (Toshiba Exceria Pro SDXC 64 GB UHS-II) | |
| Asus ROG G703GX (Toshiba Exceria Pro SDXC 64 GB UHS-II) | |
| Média da turma Gaming (20.9 - 210, n=55, últimos 2 anos) | |
| maximum AS SSD Seq Read Test (1GB) | |
| Asus ROG G703GX (Toshiba Exceria Pro SDXC 64 GB UHS-II) | |
| Schenker XMG Ultra 17 Turing (Toshiba Exceria Pro SDXC 64 GB UHS-II) | |
| Schenker XMG Ultra 17 Coffee Lake Refresh (Toshiba Exceria Pro SDXC 64 GB UHS-II) | |
| Média da turma Gaming (25.5 - 261, n=52, últimos 2 anos) | |
| |||||||||||||||||||||||||
iluminação: 82 %
iluminação com acumulador: 343 cd/m²
Contraste: 1106:1 (Preto: 0.31 cd/m²)
ΔE ColorChecker Calman: 5.03 | ∀{0.5-29.43 Ø4.73}
calibrated: 0.86
ΔE Greyscale Calman: 6.29 | ∀{0.09-98 Ø4.97}
100% sRGB (Argyll 1.6.3 3D)
88% AdobeRGB 1998 (Argyll 1.6.3 3D)
99.1% AdobeRGB 1998 (Argyll 3D)
100% sRGB (Argyll 3D)
86.3% Display P3 (Argyll 3D)
Gamma: 2.38
CCT: 6389 K
| Schenker XMG Ultra 17 Turing AU Optronics B173ZAN01.0 (AUO109B), IPS, 3840x2160, 17.3" | Asus ROG G703GX AU Optronics B173HAN03.2 (AUO329D), IPS, 1920x1080, 17.3" | Schenker XMG Ultra 17 Coffee Lake Refresh AU Optronics B173ZAN (AUO109B), IPS, 3840x2160, 17.3" | Acer Predator Triton 500 AU Optronics B156HAN08.2 (AUO82ED), IPS, 1920x1080, 15.6" | Razer Blade 15 RTX 2070 Max-Q LG Philips LGD05C0, IPS, 1920x1080, 15.6" | |
|---|---|---|---|---|---|
| Display | -22% | -0% | -22% | -21% | |
| Display P3 Coverage (%) | 86.3 | 64.1 -26% | 85.8 -1% | 64.2 -26% | 65.3 -24% |
| sRGB Coverage (%) | 100 | 93.3 -7% | 99.9 0% | 92.6 -7% | 94.9 -5% |
| AdobeRGB 1998 Coverage (%) | 99.1 | 65.6 -34% | 98.9 0% | 65.7 -34% | 66.3 -33% |
| Response Times | 70% | -2% | 65% | 53% | |
| Response Time Grey 50% / Grey 80% * (ms) | 41.6 ? | 7.2 ? 83% | 41.2 ? 1% | 8 ? 81% | 16.8 ? 60% |
| Response Time Black / White * (ms) | 21.6 ? | 9.6 ? 56% | 22.4 ? -4% | 11.2 ? 48% | 11.6 ? 46% |
| PWM Frequency (Hz) | |||||
| Screen | -10% | 2% | -13% | -5% | |
| Brightness middle (cd/m²) | 343 | 296 -14% | 349 2% | 304 -11% | 314.7 -8% |
| Brightness (cd/m²) | 328 | 279 -15% | 339 3% | 299 -9% | 312 -5% |
| Brightness Distribution (%) | 82 | 85 4% | 87 6% | 89 9% | 90 10% |
| Black Level * (cd/m²) | 0.31 | 0.25 19% | 0.41 -32% | 0.27 13% | 0.38 -23% |
| Contrast (:1) | 1106 | 1184 7% | 851 -23% | 1126 2% | 828 -25% |
| Colorchecker dE 2000 * | 5.03 | 4.77 5% | 4.04 20% | 4.66 7% | 2.56 49% |
| Colorchecker dE 2000 max. * | 7.91 | 9.08 -15% | 6.01 24% | 9.65 -22% | 4.89 38% |
| Colorchecker dE 2000 calibrated * | 0.86 | 1.46 -70% | 0.93 -8% | 1.72 -100% | 1.71 -99% |
| Greyscale dE 2000 * | 6.29 | 5.83 7% | 4.19 33% | 5.53 12% | 3.4 46% |
| Gamma | 2.38 92% | 2.47 89% | 2.44 90% | 2.5 88% | 2.3 96% |
| CCT | 6389 102% | 8076 80% | 6411 101% | 8028 81% | 6435 101% |
| Color Space (Percent of AdobeRGB 1998) (%) | 88 | 60 -32% | 87 -1% | 60 -32% | 60.7 -31% |
| Color Space (Percent of sRGB) (%) | 100 | 93 -7% | 100 0% | 93 -7% | 94.6 -5% |
| Média Total (Programa/Configurações) | 13% /
-2% | 0% /
1% | 10% /
-5% | 9% /
-1% |
* ... menor é melhor
Exibir tempos de resposta
| ↔ Tempo de resposta preto para branco | ||
|---|---|---|
| 21.6 ms ... ascensão ↗ e queda ↘ combinadas | ↗ 9.6 ms ascensão | 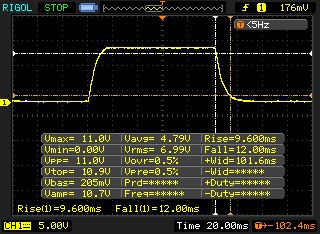 |
| ↘ 12 ms queda | ||
| A tela mostra boas taxas de resposta em nossos testes, mas pode ser muito lenta para jogadores competitivos. Em comparação, todos os dispositivos testados variam de 0.1 (mínimo) a 240 (máximo) ms. » 48 % de todos os dispositivos são melhores. Isso significa que o tempo de resposta medido é semelhante à média de todos os dispositivos testados (19.9 ms). | ||
| ↔ Tempo de resposta 50% cinza a 80% cinza | ||
| 41.6 ms ... ascensão ↗ e queda ↘ combinadas | ↗ 20.4 ms ascensão | 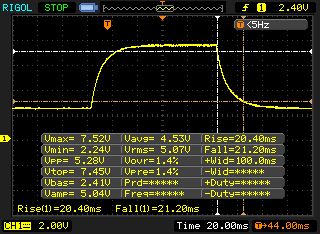 |
| ↘ 21.2 ms queda | ||
| A tela mostra taxas de resposta lentas em nossos testes e será insatisfatória para os jogadores. Em comparação, todos os dispositivos testados variam de 0.165 (mínimo) a 636 (máximo) ms. » 67 % de todos os dispositivos são melhores. Isso significa que o tempo de resposta medido é pior que a média de todos os dispositivos testados (31.1 ms). | ||
Cintilação da tela / PWM (modulação por largura de pulso)
| Tela tremeluzindo / PWM não detectado | 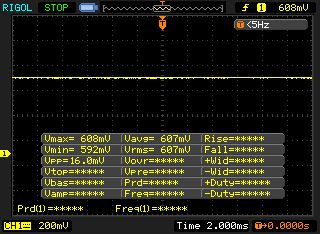 | ||
[pwm_comparison] Em comparação: 52 % de todos os dispositivos testados não usam PWM para escurecer a tela. Se PWM foi detectado, uma média de 7798 (mínimo: 5 - máximo: 343500) Hz foi medida. | |||
| Cinebench R10 | |
| Rendering Single CPUs 64Bit | |
| Média da turma Gaming (17067 - 17085, n=2, últimos 2 anos) | |
| Schenker XMG Ultra 17 Turing | |
| Rendering Multiple CPUs 64Bit | |
| Média da turma Gaming (14159 - 144628, n=2, últimos 2 anos) | |
| Schenker XMG Ultra 17 Turing | |
| PCMark 8 Home Score Accelerated v2 | 4692 pontos | |
| PCMark 8 Work Score Accelerated v2 | 5079 pontos | |
| PCMark 10 Score | 7050 pontos | |
Ajuda | ||
| Schenker XMG Ultra 17 Turing Samsung SSD 970 EVO Plus 500GB | Asus ROG G703GX Samsung SSD PM981 MZVLB512HAJQ | Schenker XMG Ultra 17 Coffee Lake Refresh Samsung SSD 970 Pro 1TB | Acer Predator Triton 500 2x WDC PC SN720 SDAPNTW-256G-1014 (RAID 0) | Razer Blade 15 RTX 2070 Max-Q Samsung SSD PM981 MZVLB512HAJQ | |
|---|---|---|---|---|---|
| CrystalDiskMark 5.2 / 6 | -25% | -16% | -15% | -31% | |
| Write 4K (MB/s) | 183.2 | 90.4 -51% | 129.6 -29% | 93.6 -49% | 93.9 -49% |
| Read 4K (MB/s) | 52.4 | 39.19 -25% | 53.3 2% | 38.82 -26% | 40.56 -23% |
| Write Seq (MB/s) | 1790 | 1863 4% | 1863 4% | 2455 37% | 1468 -18% |
| Read Seq (MB/s) | 1743 | 2100 20% | 1670 -4% | 2107 21% | 1540 -12% |
| Write 4K Q32T1 (MB/s) | 550 | 260.2 -53% | 310 -44% | 298.7 -46% | 293.5 -47% |
| Read 4K Q32T1 (MB/s) | 648 | 297 -54% | 397 -39% | 338.7 -48% | 346 -47% |
| Write Seq Q32T1 (MB/s) | 3236 | 1870 -42% | 2739 -15% | 2902 -10% | 1941 -40% |
| Read Seq Q32T1 (MB/s) | 3538 | 3471 -2% | 3495 -1% | 3536 0% | 3266 -8% |

| 3DMark 11 Performance | 26926 pontos | |
| 3DMark Cloud Gate Standard Score | 52716 pontos | |
| 3DMark Fire Strike Score | 20760 pontos | |
Ajuda | ||
| The Witcher 3 | |
| 1920x1080 High Graphics & Postprocessing (Nvidia HairWorks Off) | |
| Média da turma Gaming (181 - 341, n=3, últimos 2 anos) | |
| Asus ROG G703GX | |
| Acer Predator Triton 500 | |
| Schenker XMG Ultra 17 Turing | |
| Razer Blade 15 RTX 2070 Max-Q | |
| 1920x1080 Ultra Graphics & Postprocessing (HBAO+) | |
| Média da turma Gaming (95 - 240, n=8, últimos 2 anos) | |
| Asus ROG G703GX | |
| Schenker XMG Ultra 17 Turing | |
| Acer Predator Triton 500 | |
| Razer Blade 15 RTX 2070 Max-Q | |
| Schenker XMG Ultra 17 Coffee Lake Refresh | |
| Rise of the Tomb Raider | |
| 1920x1080 Very High Preset AA:FX AF:16x | |
| Schenker XMG Ultra 17 Turing | |
| Razer Blade 15 RTX 2070 Max-Q | |
| 1920x1080 High Preset AA:FX AF:4x | |
| Schenker XMG Ultra 17 Turing | |
| Razer Blade 15 RTX 2070 Max-Q | |
| Doom | |
| 1920x1080 Ultra Preset AA:SM | |
| Schenker XMG Ultra 17 Turing | |
| 1920x1080 High Preset AA:FX | |
| Schenker XMG Ultra 17 Turing | |
| baixo | média | alto | ultra | 4K | |
|---|---|---|---|---|---|
| The Witcher 3 (2015) | 335.4 | 266.8 | 135.6 | 94.5 | 55.8 |
| Rise of the Tomb Raider (2016) | 275.8 | 207.8 | 168.2 | 144.3 | 64.4 |
| Doom (2016) | 176.8 | 171.2 | 161.3 | 159.7 | 91.8 |
Barulho
| Ocioso |
| 30 / 33 / 35 dB |
| Carga |
| 44 / 58 dB |
 | ||
30 dB silencioso 40 dB(A) audível 50 dB(A) ruidosamente alto |
||
min: | ||
| Schenker XMG Ultra 17 Turing GeForce RTX 2080 Mobile, i9-9900K | Asus ROG G703GX GeForce RTX 2080 Mobile, i7-8750H | Schenker XMG Ultra 17 Coffee Lake Refresh GeForce GTX 1080 Mobile, i9-9900K | Acer Predator Triton 500 GeForce RTX 2080 Max-Q, i7-8750H | Razer Blade 15 RTX 2070 Max-Q GeForce RTX 2070 Max-Q, i7-8750H | |
|---|---|---|---|---|---|
| Noise | -1% | -5% | 6% | 14% | |
| desligado / ambiente * (dB) | 30 | 30 -0% | 30 -0% | 29 3% | 28.8 4% |
| Idle Minimum * (dB) | 30 | 30 -0% | 33 -10% | 30 -0% | 28.8 4% |
| Idle Average * (dB) | 33 | 35 -6% | 35 -6% | 32 3% | 28.8 13% |
| Idle Maximum * (dB) | 35 | 41 -17% | 43 -23% | 34 3% | 29.4 16% |
| Load Average * (dB) | 44 | 44 -0% | 43 2% | 44 -0% | 35.7 19% |
| Witcher 3 ultra * (dB) | 55 | 51 7% | 53 4% | 46 16% | 42.5 23% |
| Load Maximum * (dB) | 58 | 52 10% | 59 -2% | 47 19% | 45 22% |
* ... menor é melhor
| Schenker XMG Ultra 17 Turing GeForce RTX 2080 Mobile, i9-9900K | Asus ROG G703GX GeForce RTX 2080 Mobile, i7-8750H | Schenker XMG Ultra 17 Coffee Lake Refresh GeForce GTX 1080 Mobile, i9-9900K | Acer Predator Triton 500 GeForce RTX 2080 Max-Q, i7-8750H | Razer Blade 15 RTX 2070 Max-Q GeForce RTX 2070 Max-Q, i7-8750H | |
|---|---|---|---|---|---|
| Heat | -1% | 3% | -8% | 7% | |
| Maximum Upper Side * (°C) | 45 | 50 -11% | 44 2% | 49 -9% | 49 -9% |
| Maximum Bottom * (°C) | 45 | 50 -11% | 45 -0% | 58 -29% | 49 -9% |
| Idle Upper Side * (°C) | 36 | 30 17% | 32 11% | 33 8% | 25.4 29% |
| Idle Bottom * (°C) | 33 | 33 -0% | 33 -0% | 33 -0% | 27.2 18% |
* ... menor é melhor
(±) A temperatura máxima no lado superior é 45 °C / 113 F, em comparação com a média de 40.4 °C / 105 F , variando de 21.2 a 68.8 °C para a classe Gaming.
(±) A parte inferior aquece até um máximo de 45 °C / 113 F, em comparação com a média de 43.2 °C / 110 F
(+) Em uso inativo, a temperatura média para o lado superior é 31.1 °C / 88 F, em comparação com a média do dispositivo de 33.9 °C / ### class_avg_f### F.
(±) Jogando The Witcher 3, a temperatura média para o lado superior é 34.9 °C / 95 F, em comparação com a média do dispositivo de 33.9 °C / ## #class_avg_f### F.
(+) Os apoios para as mãos e o touchpad são mais frios que a temperatura da pele, com um máximo de 31 °C / 87.8 F e, portanto, são frios ao toque.
(-) A temperatura média da área do apoio para as mãos de dispositivos semelhantes foi 28.8 °C / 83.8 F (-2.2 °C / -4 F).
Schenker XMG Ultra 17 Turing análise de áudio
(±) | o volume do alto-falante é médio, mas bom (###valor### dB)
Graves 100 - 315Hz
(±) | graves reduzidos - em média 7.1% menor que a mediana
(±) | a linearidade dos graves é média (11.6% delta para a frequência anterior)
Médios 400 - 2.000 Hz
(±) | médios mais altos - em média 5% maior que a mediana
(+) | médios são lineares (6.3% delta para frequência anterior)
Altos 2 - 16 kHz
(+) | agudos equilibrados - apenas 2.6% longe da mediana
(+) | os máximos são lineares (3.3% delta da frequência anterior)
Geral 100 - 16.000 Hz
(+) | o som geral é linear (13.6% diferença em relação à mediana)
Comparado com a mesma classe
» 20% de todos os dispositivos testados nesta classe foram melhores, 7% semelhantes, 73% piores
» O melhor teve um delta de 6%, a média foi 18%, o pior foi 132%
Comparado com todos os dispositivos testados
» 15% de todos os dispositivos testados foram melhores, 4% semelhantes, 82% piores
» O melhor teve um delta de 4%, a média foi 24%, o pior foi 134%
Schenker XMG Ultra 17 Coffee Lake Refresh análise de áudio
(±) | o volume do alto-falante é médio, mas bom (###valor### dB)
Graves 100 - 315Hz
(±) | graves reduzidos - em média 5.4% menor que a mediana
(±) | a linearidade dos graves é média (13% delta para a frequência anterior)
Médios 400 - 2.000 Hz
(±) | médios mais altos - em média 7.1% maior que a mediana
(±) | a linearidade dos médios é média (8% delta para frequência anterior)
Altos 2 - 16 kHz
(+) | agudos equilibrados - apenas 1.9% longe da mediana
(+) | os máximos são lineares (3.2% delta da frequência anterior)
Geral 100 - 16.000 Hz
(+) | o som geral é linear (13.2% diferença em relação à mediana)
Comparado com a mesma classe
» 19% de todos os dispositivos testados nesta classe foram melhores, 4% semelhantes, 77% piores
» O melhor teve um delta de 6%, a média foi 18%, o pior foi 132%
Comparado com todos os dispositivos testados
» 13% de todos os dispositivos testados foram melhores, 3% semelhantes, 84% piores
» O melhor teve um delta de 4%, a média foi 24%, o pior foi 134%
| desligado | |
| Ocioso | |
| Carga |
|
Key:
min: | |
| Schenker XMG Ultra 17 Turing i9-9900K, GeForce RTX 2080 Mobile | Asus ROG G703GX i7-8750H, GeForce RTX 2080 Mobile | Schenker XMG Ultra 17 Coffee Lake Refresh i9-9900K, GeForce GTX 1080 Mobile | Acer Predator Triton 500 i7-8750H, GeForce RTX 2080 Max-Q | Razer Blade 15 RTX 2070 Max-Q i7-8750H, GeForce RTX 2070 Max-Q | Média da turma Gaming | |
|---|---|---|---|---|---|---|
| Power Consumption | 27% | 19% | 45% | 54% | 43% | |
| Idle Minimum * (Watt) | 39 | 5 87% | 33 15% | 16 59% | 10.4 73% | 13.3 ? 66% |
| Idle Average * (Watt) | 45 | 24 47% | 42 7% | 22 51% | 14.6 68% | 19 ? 58% |
| Idle Maximum * (Watt) | 55 | 42 24% | 49 11% | 32 42% | 16.3 70% | 24.5 ? 55% |
| Load Average * (Watt) | 122 | 112 8% | 93 24% | 89 27% | 88.5 27% | 108.1 ? 11% |
| Witcher 3 ultra * (Watt) | 259 | 284 -10% | 156 40% | 147 43% | 155.4 40% | |
| Load Maximum * (Watt) | 346 | 320 8% | 293 15% | 173 50% | 182.4 47% | 254 ? 27% |
* ... menor é melhor
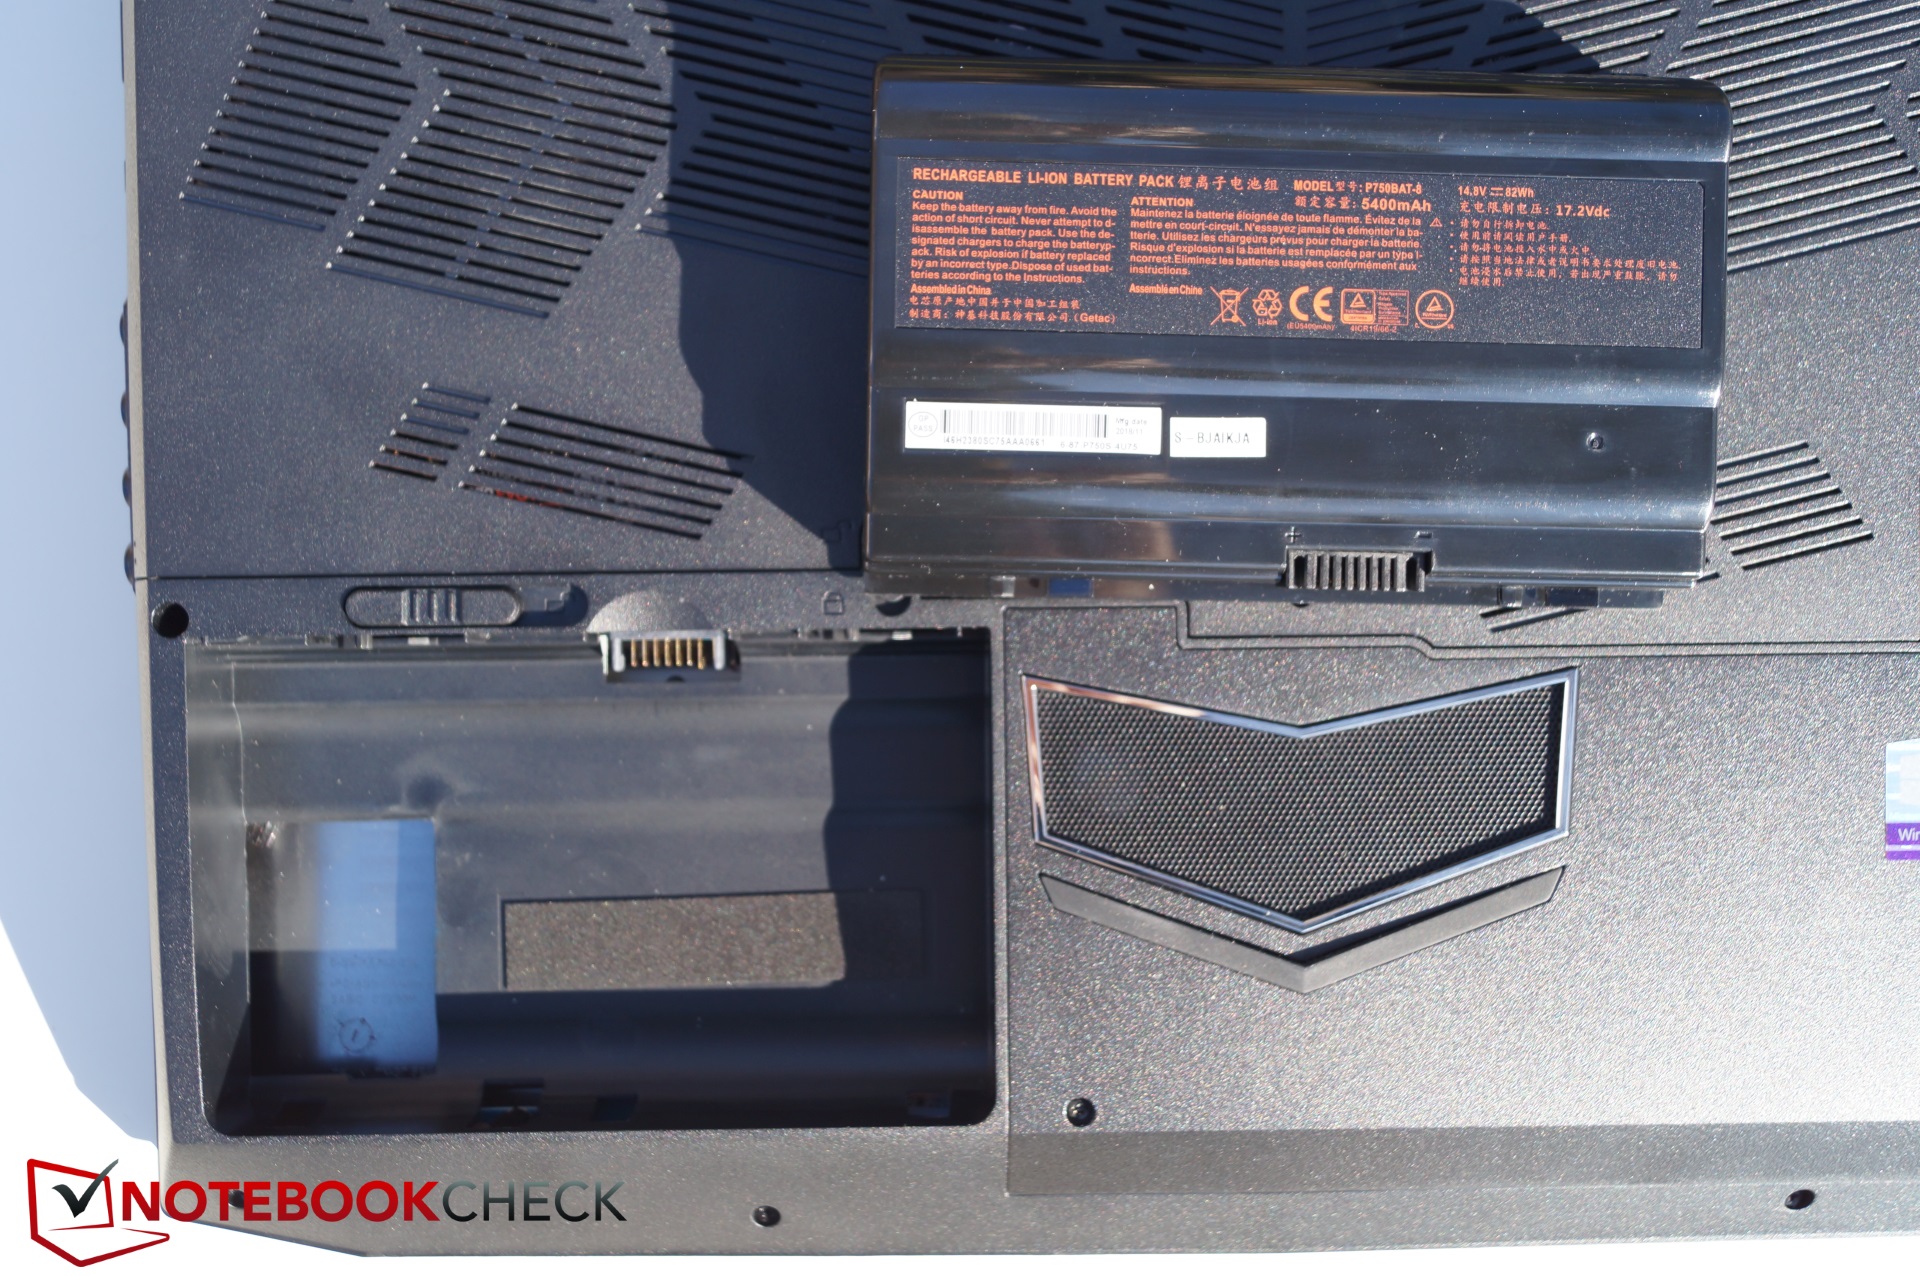
| Schenker XMG Ultra 17 Turing i9-9900K, GeForce RTX 2080 Mobile, 82 Wh | Asus ROG G703GX i7-8750H, GeForce RTX 2080 Mobile, 96 Wh | Schenker XMG Ultra 17 Coffee Lake Refresh i9-9900K, GeForce GTX 1080 Mobile, 82 Wh | Acer Predator Triton 500 i7-8750H, GeForce RTX 2080 Max-Q, 82 Wh | Razer Blade 15 RTX 2070 Max-Q i7-8750H, GeForce RTX 2070 Max-Q, 80 Wh | Média da turma Gaming | |
|---|---|---|---|---|---|---|
| Duração da bateria | 59% | -1% | 55% | 175% | 177% | |
| Reader / Idle (h) | 2.8 | 5 79% | 2.9 4% | 5.6 100% | 11.4 307% | 8.71 ? 211% |
| H.264 (h) | 2.3 | 3.8 65% | 8.26 ? 259% | |||
| WiFi v1.3 (h) | 2.3 | 4 74% | 1.9 -17% | 3.2 39% | 6.5 183% | 7.01 ? 205% |
| Load (h) | 1.1 | 1.3 18% | 1.2 9% | 1.4 27% | 1.5 36% | 1.47 ? 34% |
Pro
Contra
O Schenker XMG Ultra 17 é uma excelente opção para quem procura uma alternativa para um PC de desktop para jogos. Nossa unidade de análise está repleta dos componentes mais potentes do mercado, enquanto a CPU com soquete deixa espaço para atualizações que poucos outros portáteis oferecem atualmente.
No entanto, teríamos esperado mais de um dispositivo tão caro. Nossa unidade de teste se afoga demais para nosso gosto, quando opera com bateria; apesar de apreciarmos que poucas pessoas deixariam o Ultra 17 desconectado de qualquer maneira, por causa de sua curta duração de bateria.
O Schenker XMG Ultra 17 é uma atualização valiosa sobre o seu antecessor e oferece desempenho de jogos de primeira classe. No entanto, ao nosso parecer ele decepciona com seus ventiladores barulhentos, seu preço exorbitante e seu afogamento pesado com a bateria.
A Schenker deve consertar o problema do trackpad, já que é quase inutilizável ao jogar, devido às frequentes quedas de conexão. Os alto-falantes também estão abaixo do esperado, assim como os tempos de reação da tela. Além disso, enquanto nossa unidade de análise gerencia bem suas temperaturas, ela faz isso com ventiladores barulhentos, intrusivamente e muitas vezes desnecessariamente altos.
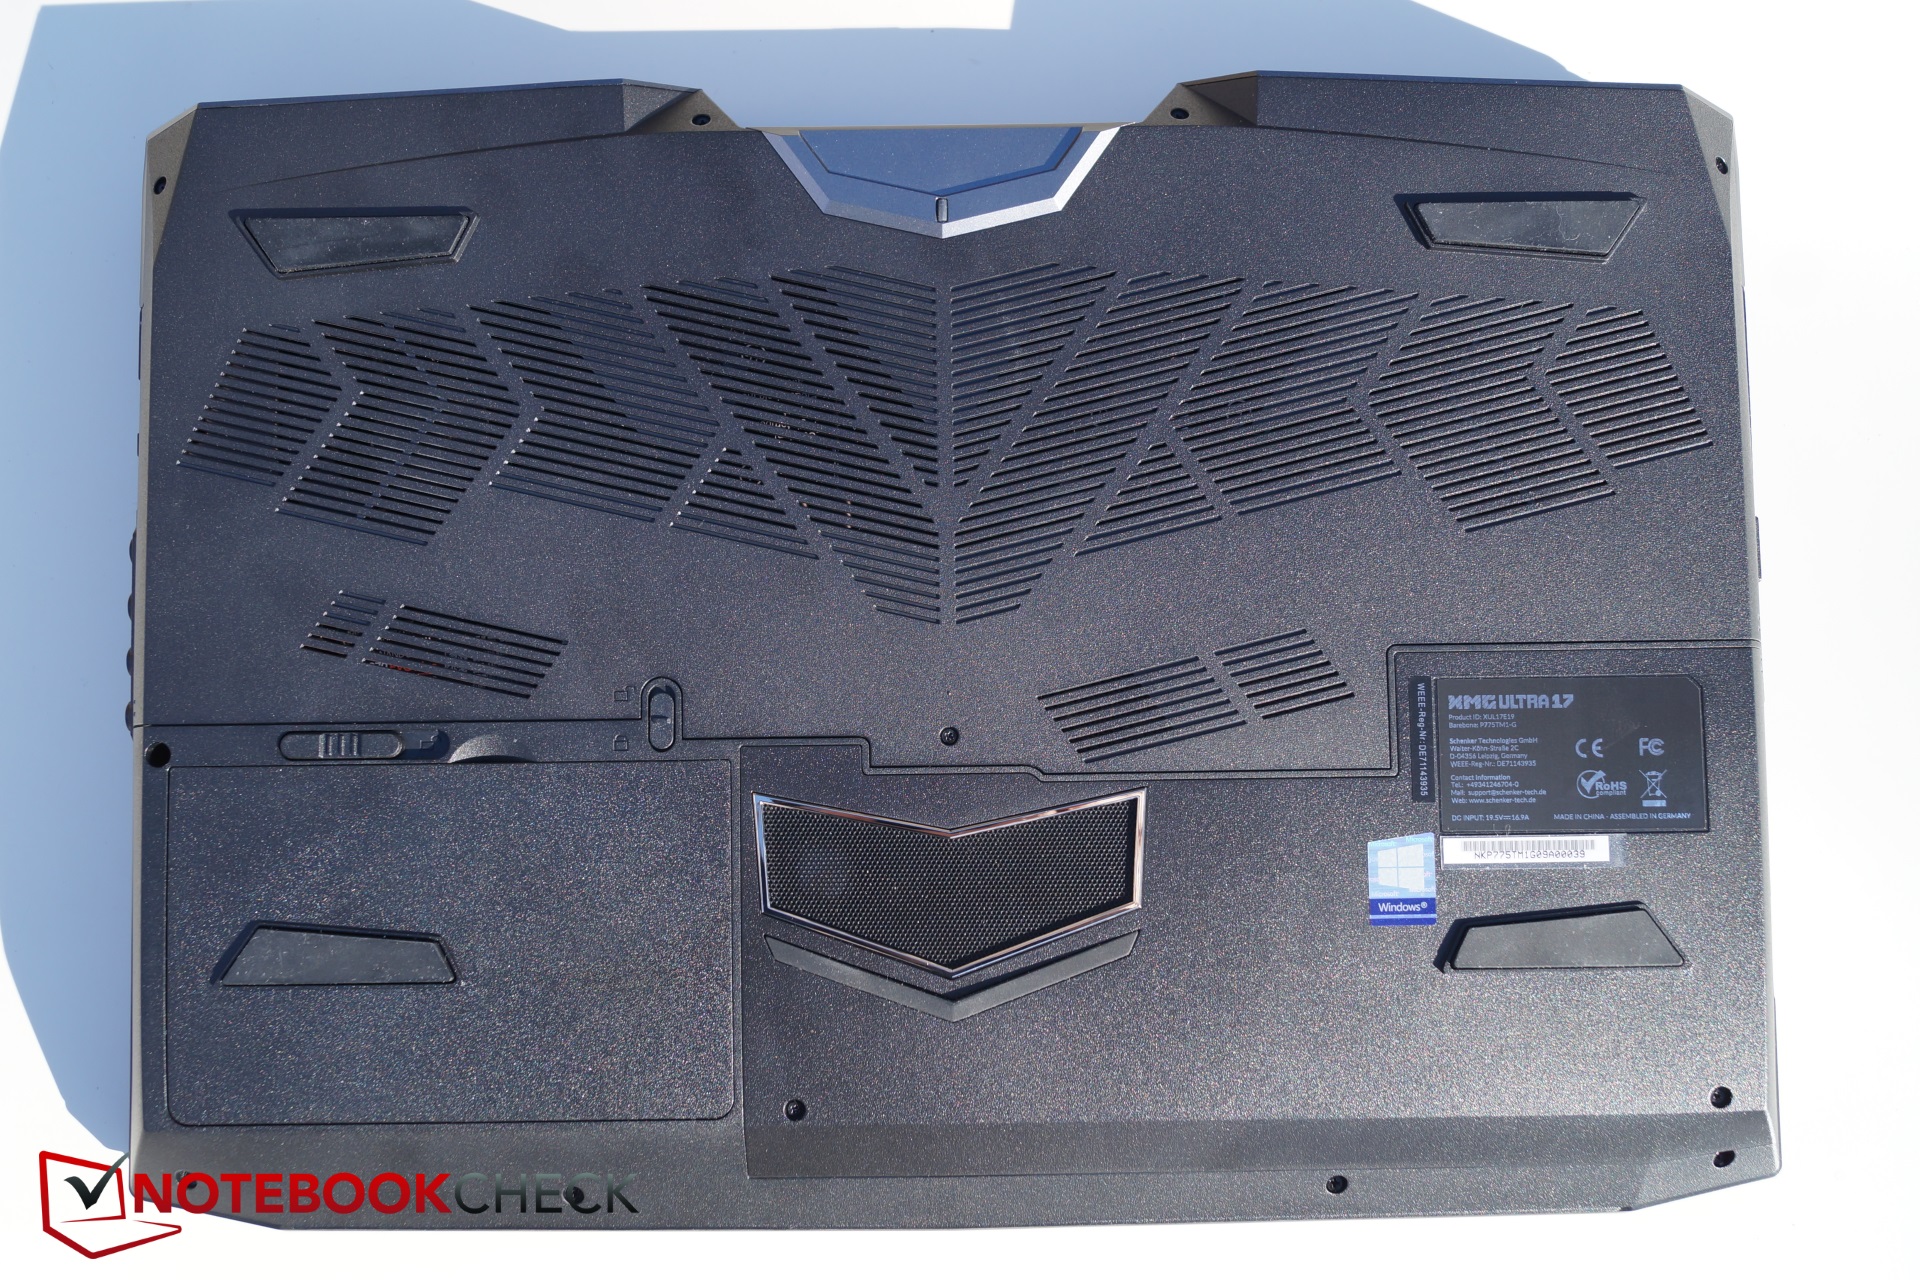
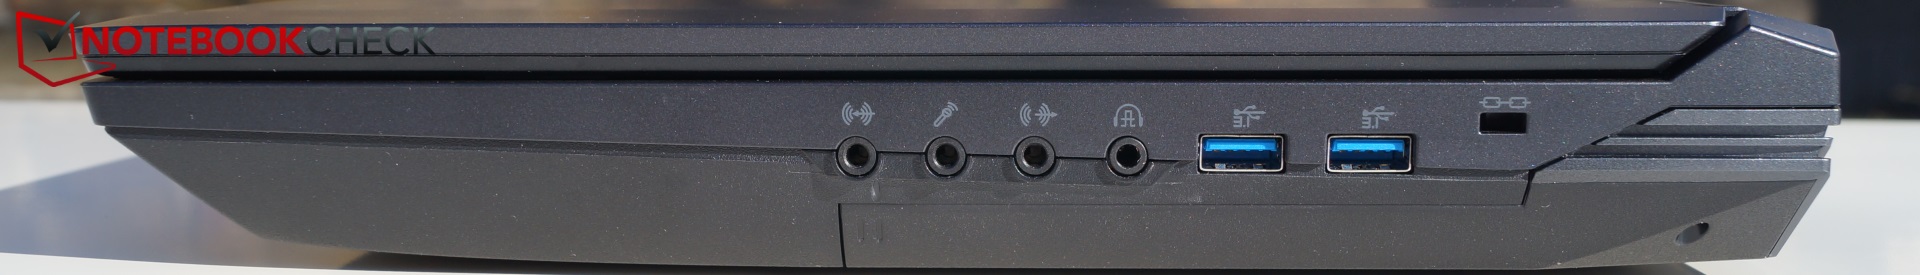
Dito isso, o Ultra 17 oferece excelente desempenho em jogos, inúmeras portas, opções de manutenção excepcionais, um teclado decente e uma tela 4K impressionante. Resumindo, a Schenker acertou em cheio com o seu novo Ultra 17, mas perdeu as nossas melhores notas por causa de algumas falhas frustrantes.
Schenker XMG Ultra 17 Turing
- 05/14/2020 v7 (old)
Christian Hintze
Price comparison
