Breve Análise do Smartphone Fairphone 2

| Networking | |
| iperf3 transmit AX12 | |
| Samsung Galaxy S7 | |
| Fairphone 2 | |
| Huawei P9 | |
| iperf3 receive AX12 | |
| Samsung Galaxy S7 | |
| Huawei P9 | |
| Fairphone 2 | |


| |||||||||||||||||||||||||
iluminação: 92 %
iluminação com acumulador: 476 cd/m²
Contraste: 1253:1 (Preto: 0.38 cd/m²)
ΔE ColorChecker Calman: 4.5 | ∀{0.5-29.43 Ø4.73}
ΔE Greyscale Calman: 4.2 | ∀{0.09-98 Ø4.97}
Gamma: 2.54
CCT: 7296 K
| Fairphone 2 IPS, 1920x1080, 5" | Sony Xperia XA IPS, 1280x720, 5" | Huawei P9 IPS-NEO, JDI, 1920x1080, 5.2" | Samsung Galaxy A5 2016 Super AMOLED, 1920x1080, 5.2" | Samsung Galaxy S7 SAMOLED, 2560x1440, 5.1" | |
|---|---|---|---|---|---|
| Screen | -30% | 9% | 23% | 23% | |
| Brightness middle (cd/m²) | 476 | 518 9% | 582 22% | 378 -21% | 350 -26% |
| Brightness (cd/m²) | 468 | 475 1% | 563 20% | 380 -19% | 351 -25% |
| Brightness Distribution (%) | 92 | 81 -12% | 91 -1% | 91 -1% | 98 7% |
| Black Level * (cd/m²) | 0.38 | 0.61 -61% | 0.38 -0% | ||
| Contrast (:1) | 1253 | 849 -32% | 1532 22% | ||
| Colorchecker dE 2000 * | 4.5 | 6.8 -51% | 4.4 2% | 1.95 57% | 2.04 55% |
| Colorchecker dE 2000 max. * | 9.2 | 11.4 -24% | 7.4 20% | 3.09 66% | 3.25 65% |
| Greyscale dE 2000 * | 4.2 | 7 -67% | 4.8 -14% | 1.86 56% | 1.63 61% |
| Gamma | 2.54 87% | 2.35 94% | 2.2 100% | 2.13 103% | 2.07 106% |
| CCT | 7296 89% | 8151 80% | 6175 105% | 6376 102% | 6391 102% |
| Color Space (Percent of AdobeRGB 1998) (%) | 77.78 | 86.86 | |||
| Color Space (Percent of sRGB) (%) | 99.44 | 99.35 |
* ... menor é melhor
Cintilação da tela / PWM (modulação por largura de pulso)
| Tela tremeluzindo/PWM detectado | 266 Hz | ≤ 100 % configuração de brilho | 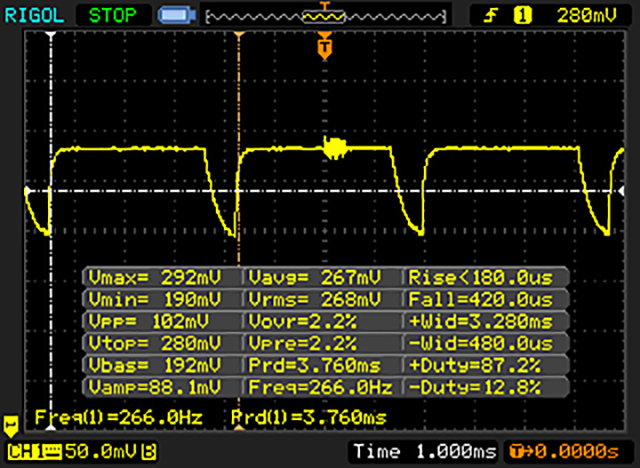 |
A luz de fundo da tela pisca em 266 Hz (pior caso, por exemplo, utilizando PWM) Cintilação detectada em uma configuração de brilho de 100 % e abaixo. Não deve haver cintilação ou PWM acima desta configuração de brilho. A frequência de 266 Hz é relativamente alta, portanto, a maioria dos usuários sensíveis ao PWM não deve notar nenhuma oscilação. No entanto, há relatos de que alguns usuários ainda são sensíveis ao PWM em 500 Hz e acima, portanto, esteja atento. [pwm_comparison] Em comparação: 52 % de todos os dispositivos testados não usam PWM para escurecer a tela. Se PWM foi detectado, uma média de 7798 (mínimo: 5 - máximo: 343500) Hz foi medida. | |||
Exibir tempos de resposta
| ↔ Tempo de resposta preto para branco | ||
|---|---|---|
| 27 ms ... ascensão ↗ e queda ↘ combinadas | ↗ 10 ms ascensão | 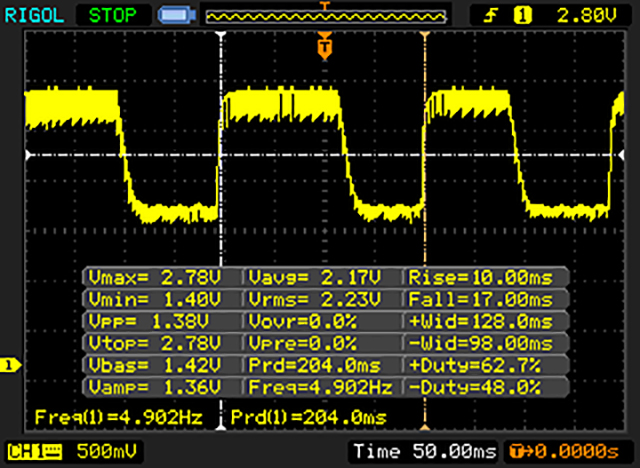 |
| ↘ 17 ms queda | ||
| A tela mostra taxas de resposta relativamente lentas em nossos testes e pode ser muito lenta para os jogadores. Em comparação, todos os dispositivos testados variam de 0.1 (mínimo) a 240 (máximo) ms. » 67 % de todos os dispositivos são melhores. Isso significa que o tempo de resposta medido é pior que a média de todos os dispositivos testados (19.9 ms). | ||
| ↔ Tempo de resposta 50% cinza a 80% cinza | ||
| 51 ms ... ascensão ↗ e queda ↘ combinadas | ↗ 26 ms ascensão | 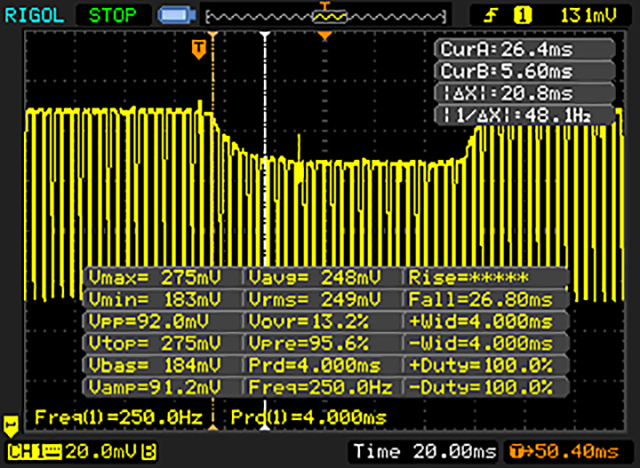 |
| ↘ 25 ms queda | ||
| A tela mostra taxas de resposta lentas em nossos testes e será insatisfatória para os jogadores. Em comparação, todos os dispositivos testados variam de 0.165 (mínimo) a 636 (máximo) ms. » 87 % de todos os dispositivos são melhores. Isso significa que o tempo de resposta medido é pior que a média de todos os dispositivos testados (31.1 ms). | ||
| AnTuTu v6 - Total Score (classificar por valor) | |
| Fairphone 2 | |
| Sony Xperia XA | |
| Huawei P9 | |
| Samsung Galaxy A5 2016 | |
| Samsung Galaxy S7 | |
| Geekbench 4.0 | |
| 64 Bit Single-Core Score (classificar por valor) | |
| Fairphone 2 | |
| Huawei P9 | |
| 64 Bit Multi-Core Score (classificar por valor) | |
| Fairphone 2 | |
| Huawei P9 | |
| GFXBench (DX / GLBenchmark) 2.7 | |
| T-Rex Onscreen (classificar por valor) | |
| Fairphone 2 | |
| Sony Xperia XA | |
| Huawei P9 | |
| Samsung Galaxy A5 2016 | |
| Samsung Galaxy S7 | |
| 1920x1080 T-Rex Offscreen (classificar por valor) | |
| Fairphone 2 | |
| Sony Xperia XA | |
| Huawei P9 | |
| Samsung Galaxy A5 2016 | |
| Samsung Galaxy S7 | |
| GFXBench 3.0 | |
| on screen Manhattan Onscreen OGL (classificar por valor) | |
| Fairphone 2 | |
| Sony Xperia XA | |
| Huawei P9 | |
| Samsung Galaxy A5 2016 | |
| Samsung Galaxy S7 | |
| 1920x1080 1080p Manhattan Offscreen (classificar por valor) | |
| Fairphone 2 | |
| Sony Xperia XA | |
| Huawei P9 | |
| Samsung Galaxy A5 2016 | |
| Samsung Galaxy S7 | |
| GFXBench 3.1 | |
| on screen Manhattan ES 3.1 Onscreen (classificar por valor) | |
| Sony Xperia XA | |
| Huawei P9 | |
| Samsung Galaxy S7 | |
| 1920x1080 Manhattan ES 3.1 Offscreen (classificar por valor) | |
| Sony Xperia XA | |
| Huawei P9 | |
| Samsung Galaxy S7 | |
| PCMark for Android - Work performance score (classificar por valor) | |
| Fairphone 2 | |
| Sony Xperia XA | |
| Huawei P9 | |
| Samsung Galaxy A5 2016 | |
| Samsung Galaxy S7 | |
| Octane V2 - Total Score (classificar por valor) | |
| Fairphone 2 | |
| Sony Xperia XA | |
| Huawei P9 | |
| Samsung Galaxy A5 2016 | |
| Samsung Galaxy S7 | |
| Mozilla Kraken 1.1 - Total (classificar por valor) | |
| Fairphone 2 | |
| Sony Xperia XA | |
| Huawei P9 | |
| Samsung Galaxy A5 2016 | |
| Samsung Galaxy S7 | |
| WebXPRT 2015 - Overall (classificar por valor) | |
| Fairphone 2 | |
| Sony Xperia XA | |
| Huawei P9 | |
| Samsung Galaxy A5 2016 | |
| Samsung Galaxy S7 | |
| JetStream 1.1 - 1.1 Total (classificar por valor) | |
| Fairphone 2 | |
| Sony Xperia XA | |
| Huawei P9 | |
| Samsung Galaxy A5 2016 | |
| Samsung Galaxy S7 | |
* ... menor é melhor
| Fairphone 2 | Sony Xperia XA | Huawei P9 | Samsung Galaxy A5 2016 | Samsung Galaxy S7 | |
|---|---|---|---|---|---|
| AndroBench 3-5 | 66% | 193% | 50% | 217% | |
| Sequential Read 256KB (MB/s) | 202.4 | 240.4 19% | 281.3 39% | 209.4 3% | 483.8 139% |
| Sequential Write 256KB (MB/s) | 104.1 | 68.6 -34% | 72.2 -31% | 60.4 -42% | 145.7 40% |
| Random Read 4KB (MB/s) | 10.77 | 22.05 105% | 39 262% | 22.9 113% | 85.9 698% |
| Random Write 4KB (MB/s) | 5.01 | 10.6 112% | 47.45 847% | 11.2 124% | 16.01 220% |
| Sequential Read 256KB SDCard (MB/s) | 39.33 | 72.9 85% | 55 40% | 72.3 84% | |
| Sequential Write 256KB SDCard (MB/s) | 24.08 | 50.7 111% | 24.83 3% | 53.6 123% |
(±) A temperatura máxima no lado superior é 40.3 °C / 105 F, em comparação com a média de 35.3 °C / 96 F , variando de 21.9 a 247 °C para a classe Smartphone.
(-) A parte inferior aquece até um máximo de 45.9 °C / 115 F, em comparação com a média de 34 °C / 93 F
(±) Em uso inativo, a temperatura média para o lado superior é 37.6 °C / 100 F, em comparação com a média do dispositivo de 32.9 °C / ### class_avg_f### F.
Fairphone 2 análise de áudio
(+) | os alto-falantes podem tocar relativamente alto (###valor### dB)
Graves 100 - 315Hz
(-) | quase nenhum baixo - em média 35.4% menor que a mediana
(±) | a linearidade dos graves é média (8% delta para a frequência anterior)
Médios 400 - 2.000 Hz
(+) | médios equilibrados - apenas 4.9% longe da mediana
(+) | médios são lineares (5.2% delta para frequência anterior)
Altos 2 - 16 kHz
(+) | agudos equilibrados - apenas 4% longe da mediana
(+) | os máximos são lineares (3.6% delta da frequência anterior)
Geral 100 - 16.000 Hz
(±) | a linearidade do som geral é média (21.4% diferença em relação à mediana)
Comparado com a mesma classe
» 42% de todos os dispositivos testados nesta classe foram melhores, 8% semelhantes, 50% piores
» O melhor teve um delta de 11%, a média foi 34%, o pior foi 134%
Comparado com todos os dispositivos testados
» 60% de todos os dispositivos testados foram melhores, 7% semelhantes, 33% piores
» O melhor teve um delta de 4%, a média foi 24%, o pior foi 134%
Sony Xperia XA análise de áudio
(+) | os alto-falantes podem tocar relativamente alto (###valor### dB)
Graves 100 - 315Hz
(-) | quase nenhum baixo - em média 24.9% menor que a mediana
(±) | a linearidade dos graves é média (7.9% delta para a frequência anterior)
Médios 400 - 2.000 Hz
(±) | médios mais altos - em média 5.3% maior que a mediana
(±) | a linearidade dos médios é média (9.3% delta para frequência anterior)
Altos 2 - 16 kHz
(±) | máximos mais altos - em média 10.7% maior que a mediana
(±) | a linearidade dos máximos é média (7% delta para frequência anterior)
Geral 100 - 16.000 Hz
(±) | a linearidade do som geral é média (29.3% diferença em relação à mediana)
Comparado com a mesma classe
» 77% de todos os dispositivos testados nesta classe foram melhores, 4% semelhantes, 19% piores
» O melhor teve um delta de 11%, a média foi 34%, o pior foi 134%
Comparado com todos os dispositivos testados
» 87% de todos os dispositivos testados foram melhores, 3% semelhantes, 10% piores
» O melhor teve um delta de 4%, a média foi 24%, o pior foi 134%
Samsung Galaxy A5 2016 análise de áudio
(+) | os alto-falantes podem tocar relativamente alto (###valor### dB)
Graves 100 - 315Hz
(-) | quase nenhum baixo - em média 33.7% menor que a mediana
(±) | a linearidade dos graves é média (11.1% delta para a frequência anterior)
Médios 400 - 2.000 Hz
(+) | médios equilibrados - apenas 4.2% longe da mediana
(+) | médios são lineares (5.4% delta para frequência anterior)
Altos 2 - 16 kHz
(+) | agudos equilibrados - apenas 4.7% longe da mediana
(±) | a linearidade dos máximos é média (8.4% delta para frequência anterior)
Geral 100 - 16.000 Hz
(±) | a linearidade do som geral é média (22.1% diferença em relação à mediana)
Comparado com a mesma classe
» 46% de todos os dispositivos testados nesta classe foram melhores, 7% semelhantes, 46% piores
» O melhor teve um delta de 11%, a média foi 34%, o pior foi 134%
Comparado com todos os dispositivos testados
» 64% de todos os dispositivos testados foram melhores, 6% semelhantes, 30% piores
» O melhor teve um delta de 4%, a média foi 24%, o pior foi 134%
| desligado | |
| Ocioso | |
| Carga |
|
Key:
min: | |
| Fairphone 2 2420 mAh | Sony Xperia XA 2300 mAh | Huawei P9 3000 mAh | Samsung Galaxy A5 2016 2900 mAh | Samsung Galaxy S7 3000 mAh | |
|---|---|---|---|---|---|
| Power Consumption | 10% | -8% | 4% | 14% | |
| Idle Minimum * (Watt) | 0.64 | 0.72 -13% | 0.77 -20% | 0.96 -50% | 0.68 -6% |
| Idle Average * (Watt) | 1.61 | 1.5 7% | 2.36 -47% | 1.64 -2% | 1.02 37% |
| Idle Maximum * (Watt) | 1.77 | 1.57 11% | 2.37 -34% | 1.71 3% | 1.14 36% |
| Load Average * (Watt) | 5.02 | 3.48 31% | 3.09 38% | 2.98 41% | 4.73 6% |
| Load Maximum * (Watt) | 6.98 | 6.04 13% | 5.35 23% | 5.08 27% | 7.16 -3% |
* ... menor é melhor
| Fairphone 2 2420 mAh | Sony Xperia XA 2300 mAh | Huawei P9 3000 mAh | Samsung Galaxy A5 2016 2900 mAh | Samsung Galaxy S7 3000 mAh | |
|---|---|---|---|---|---|
| Duração da bateria | 20% | 81% | 170% | 114% | |
| Reader / Idle (h) | 9.9 | 12.9 30% | 25.2 155% | 38.7 291% | 30.2 205% |
| H.264 (h) | 5.7 | 7.7 35% | 9.5 67% | 11.2 96% | 14.9 161% |
| WiFi v1.3 (h) | 5.4 | 5.9 9% | 9.5 76% | 10.4 93% | 7.6 41% |
| Load (h) | 2.7 | 2.8 4% | 3.4 26% | 8.1 200% | 4 48% |
Pro
Contra
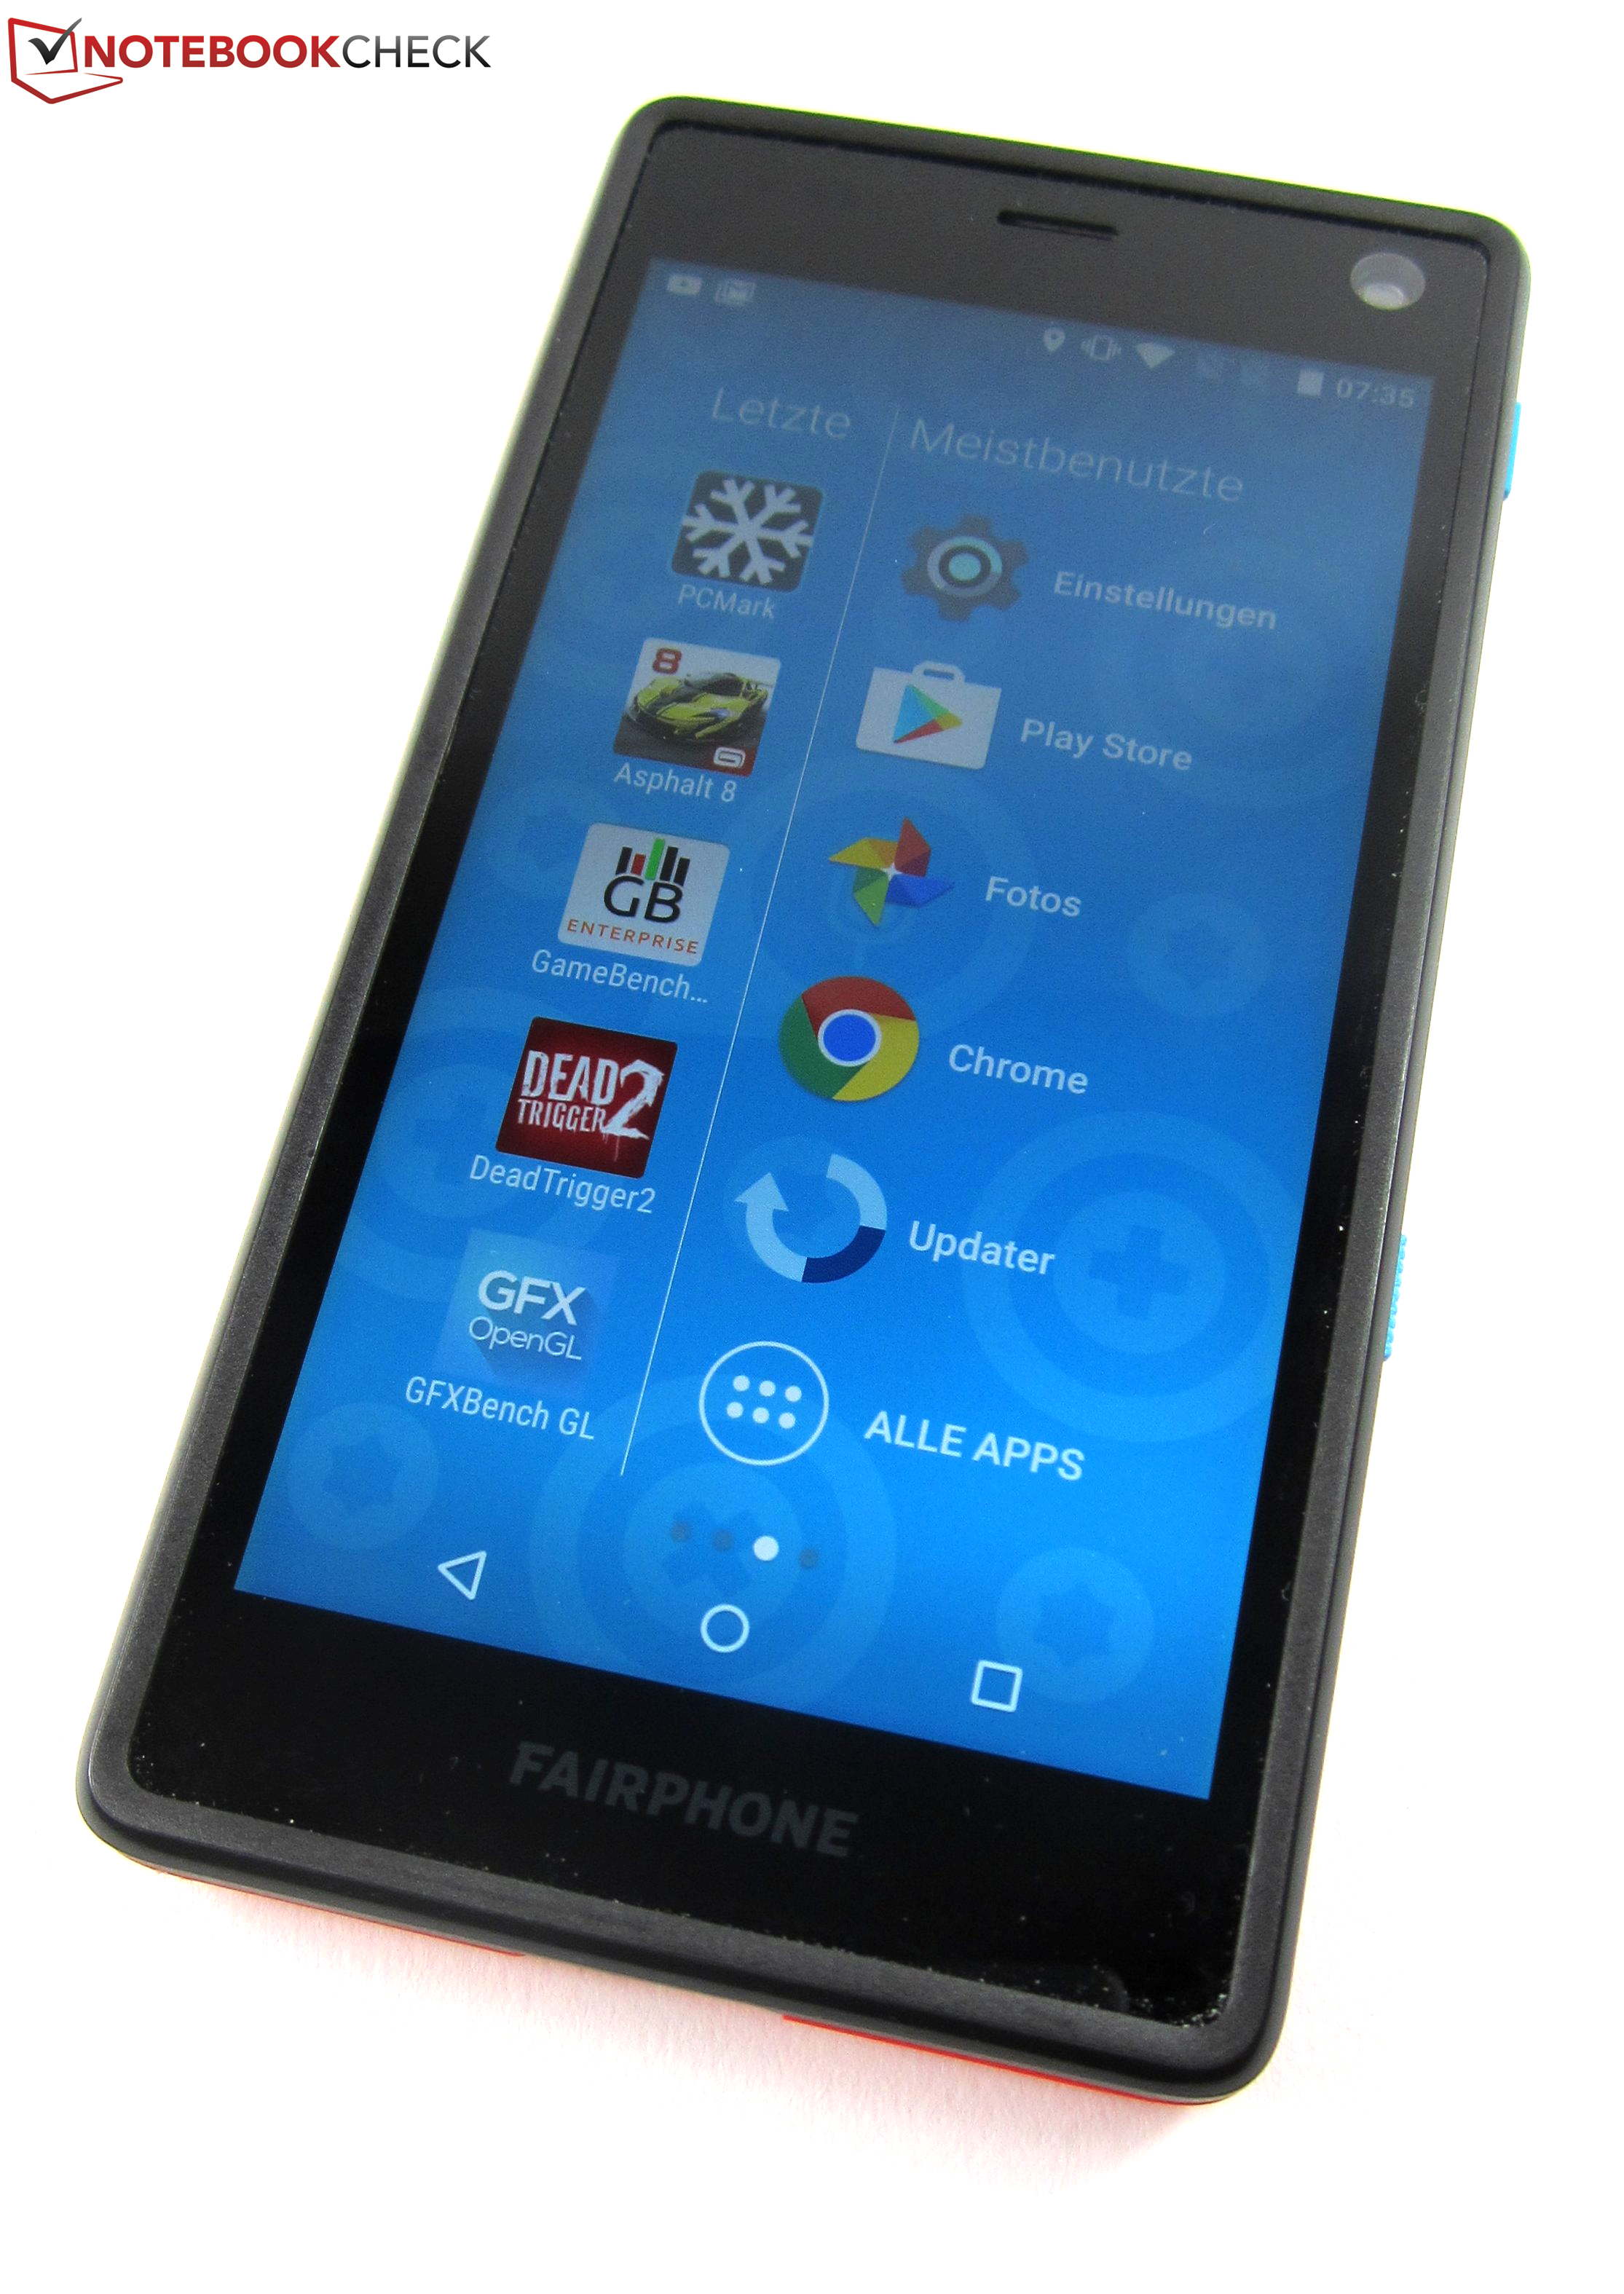
Foram estabelecidos padrões elevados: Matérias-primas de fontes conscientes da sua responsabilidade, em vez de serem financiadas por senhores da guerra, salários justos e representantes dos trabalhadores em vez de exploração, condições de trabalho justas em vez de uma fábrica que explora seus empregados e reciclagem em vez de descarte no pátio de sucata. Deve estar claro que um smartphone produzido em condições tão justas não seria uma barganha. Com um preço de 520 Euros (~$554), o Fairphone 2 é quase o dobro de caro que muito modelos cm uma configuração similar. E ao contrário do que o preço talvez sugere, os compradores não recebem um smartphone de gama alta, mas, visto sobriamente, um aparelho de gama média baseado no Android 5.1, desempenho sólido e uma câmera decente - e não muito mais.
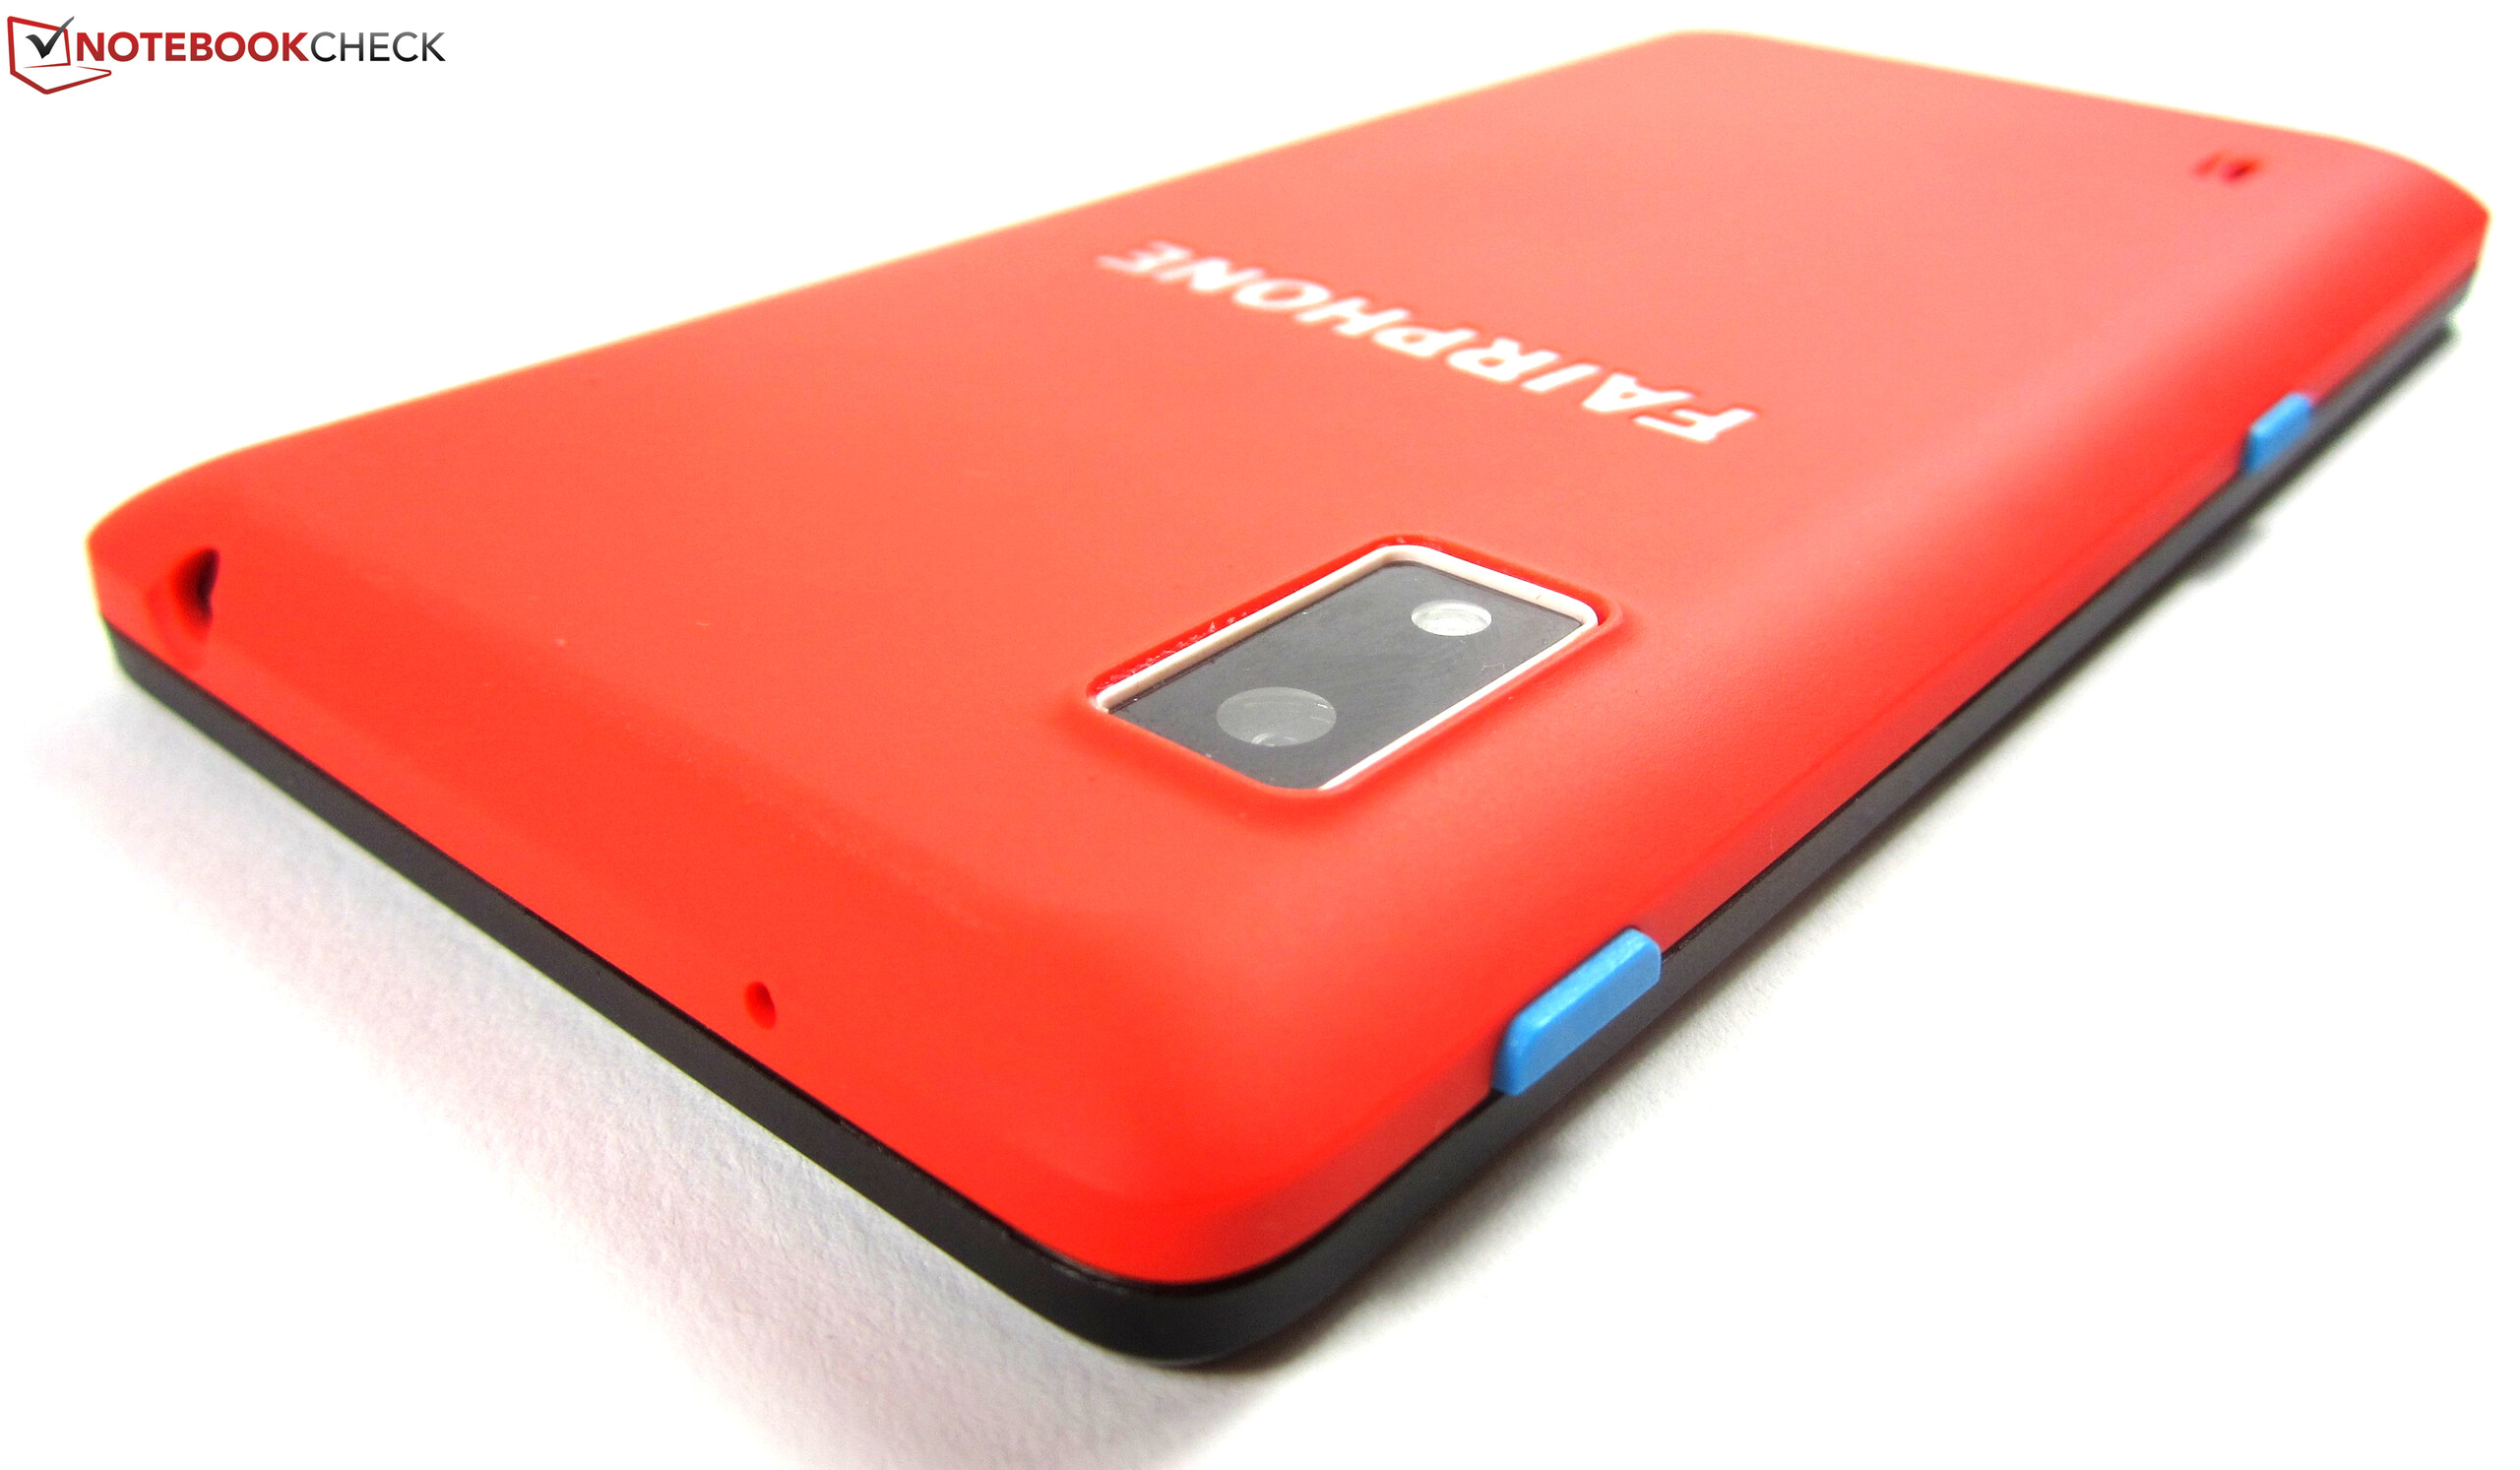
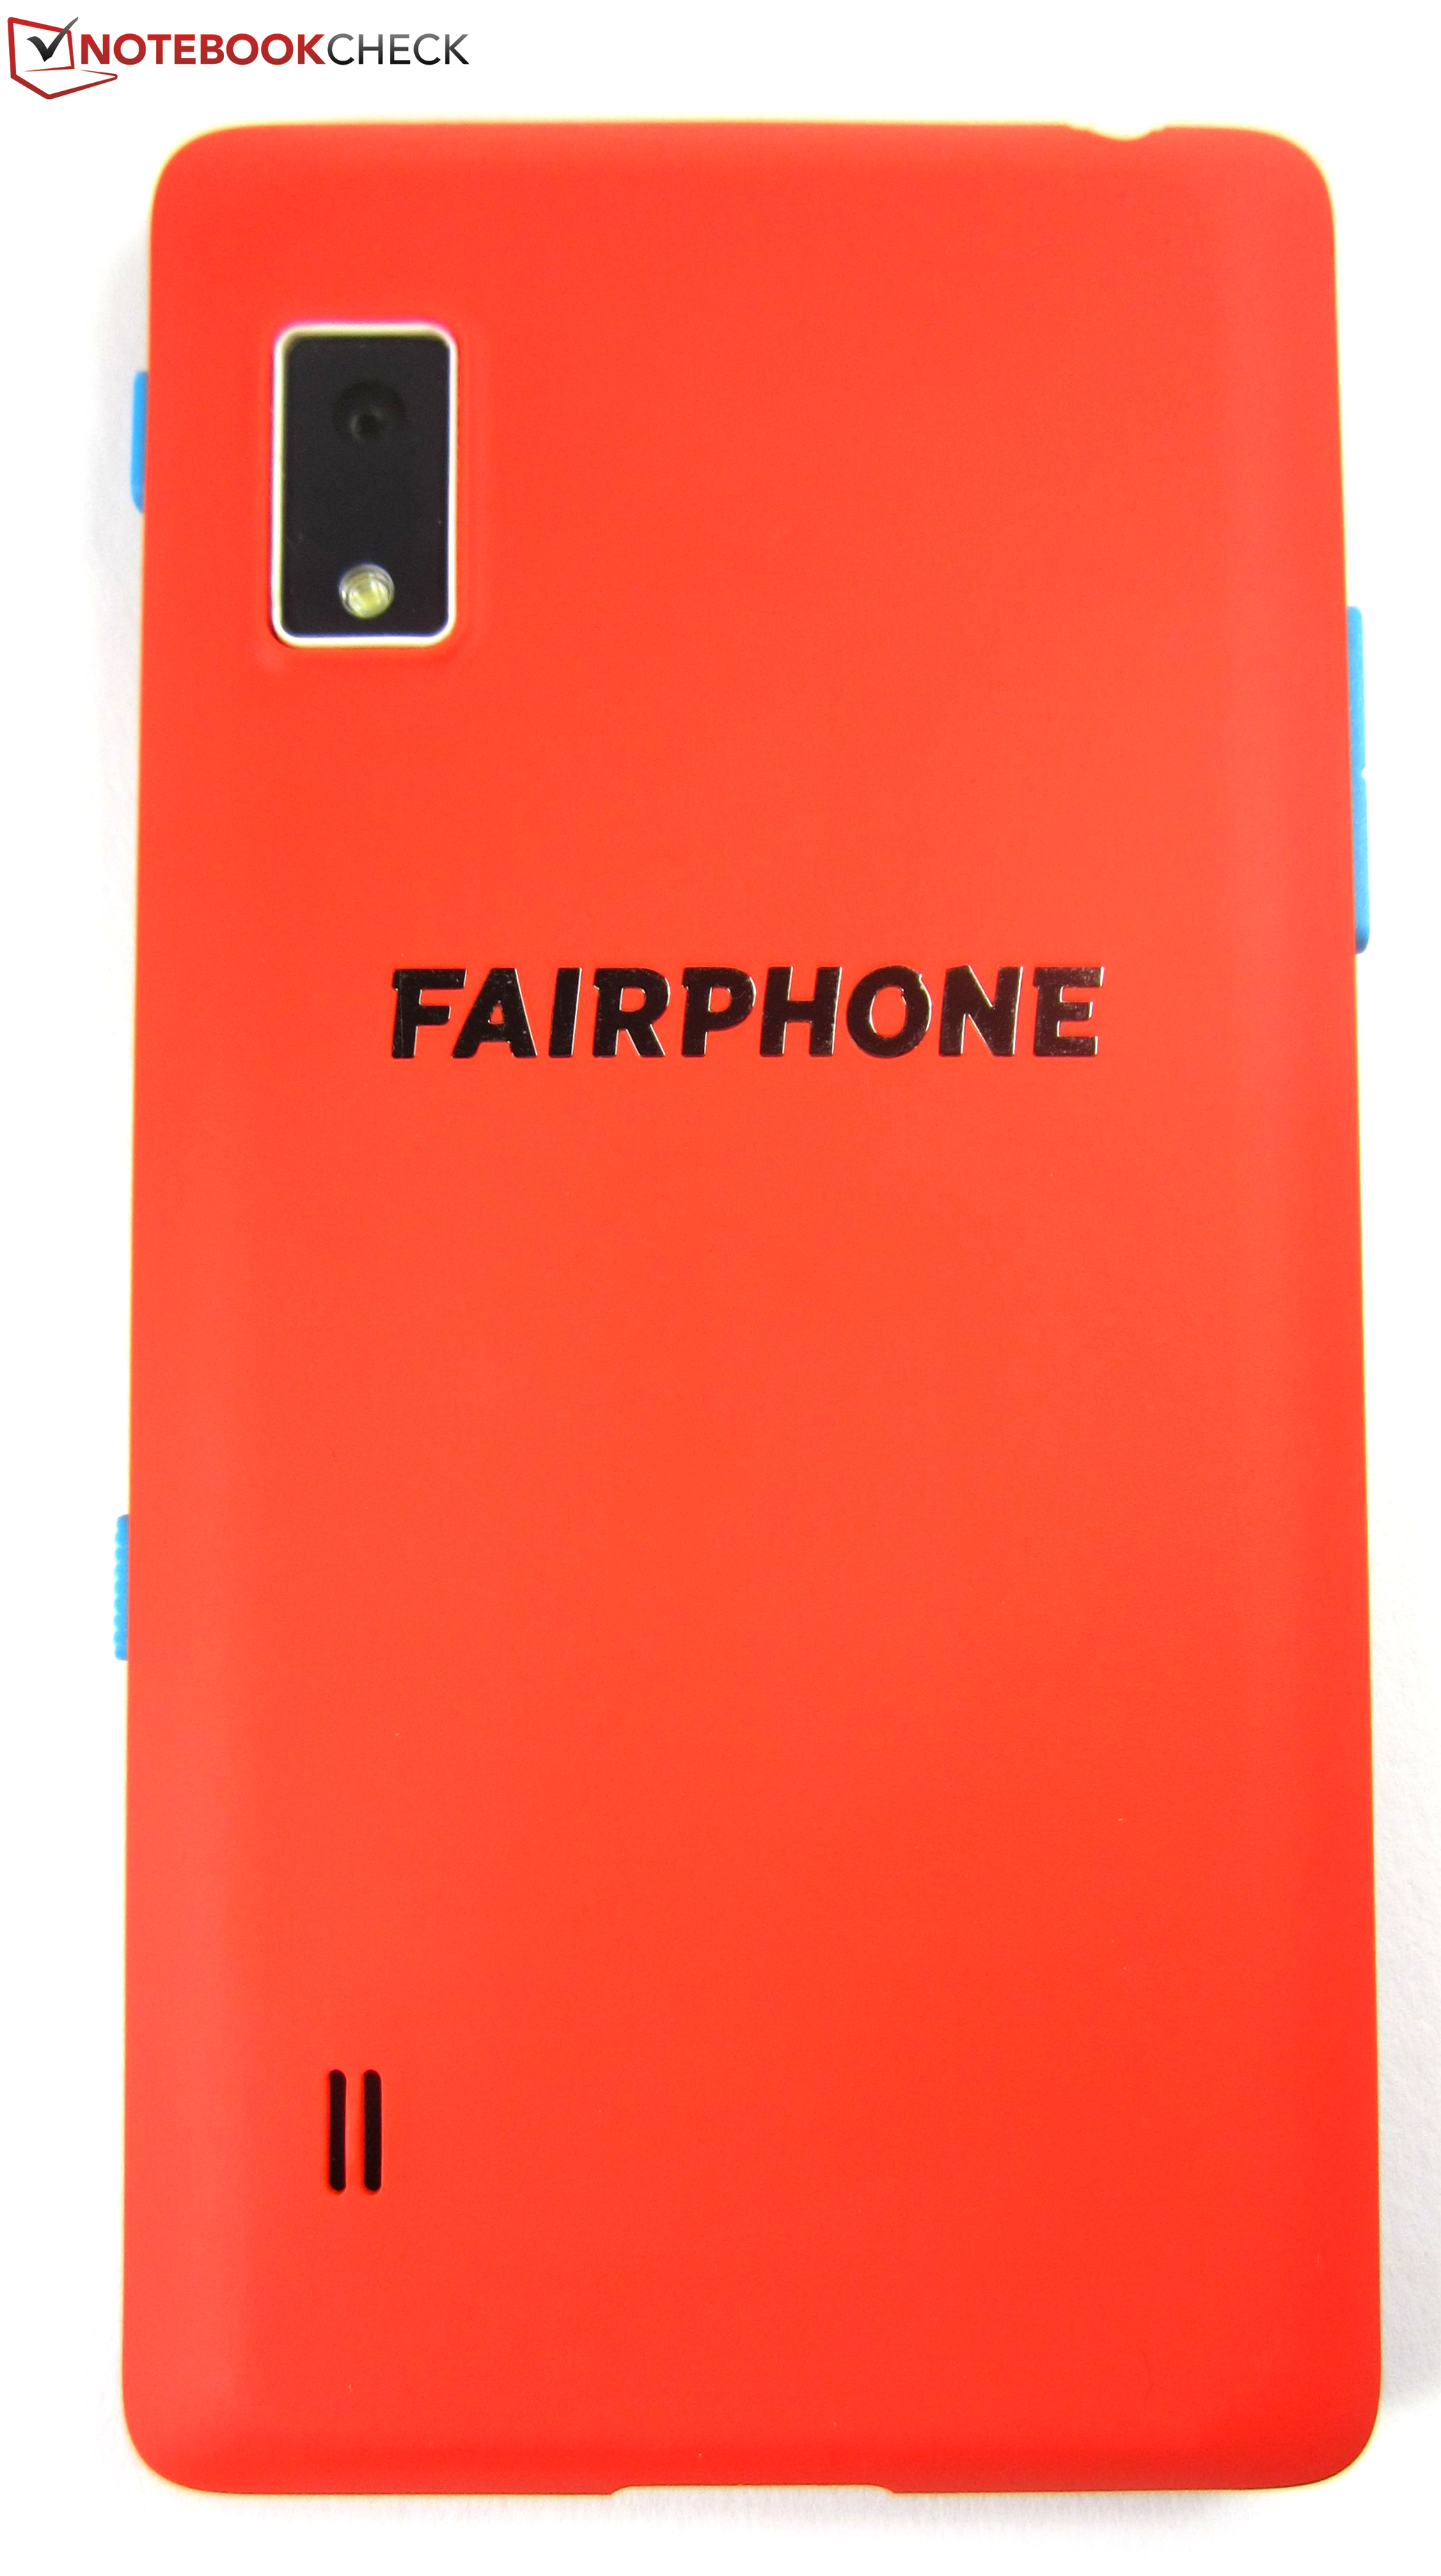
O Fairphone 2 está fora de todas as convenções de produção e possui um único ponto forte para suas vendas com o seu design modular. No entanto, o smartphone terá dificuldades no mercado, devido a seu preço alto.
Porém, reduzir o preço do Fairphone 2 para o desempenho disponível seria ... bom - injusto. Ao contrário dos dispositivos móveis fabricados "convencionalmente", na verdade não tem rivais e, visto estritamente, é incomparável. Finalmente os fabricantes não estão interessados em oferecer o dispositivo móvel mais barato possível. O preço assume um lugar secundário atrás da produção social e ambiental mais favorável possível. O seu preço é simplesmente uma consequência disto. E isso, mais uma vez é uma das maiores fortalezas do Fairphone 2: Ele incentiva os compradores a pensar sobre quanto dinheiro eles realmente devem gastar em um smartphone se os seres humanos e não os lucros estão no foco da cadeia de suprimentos. A resposta está diretamente incluída.
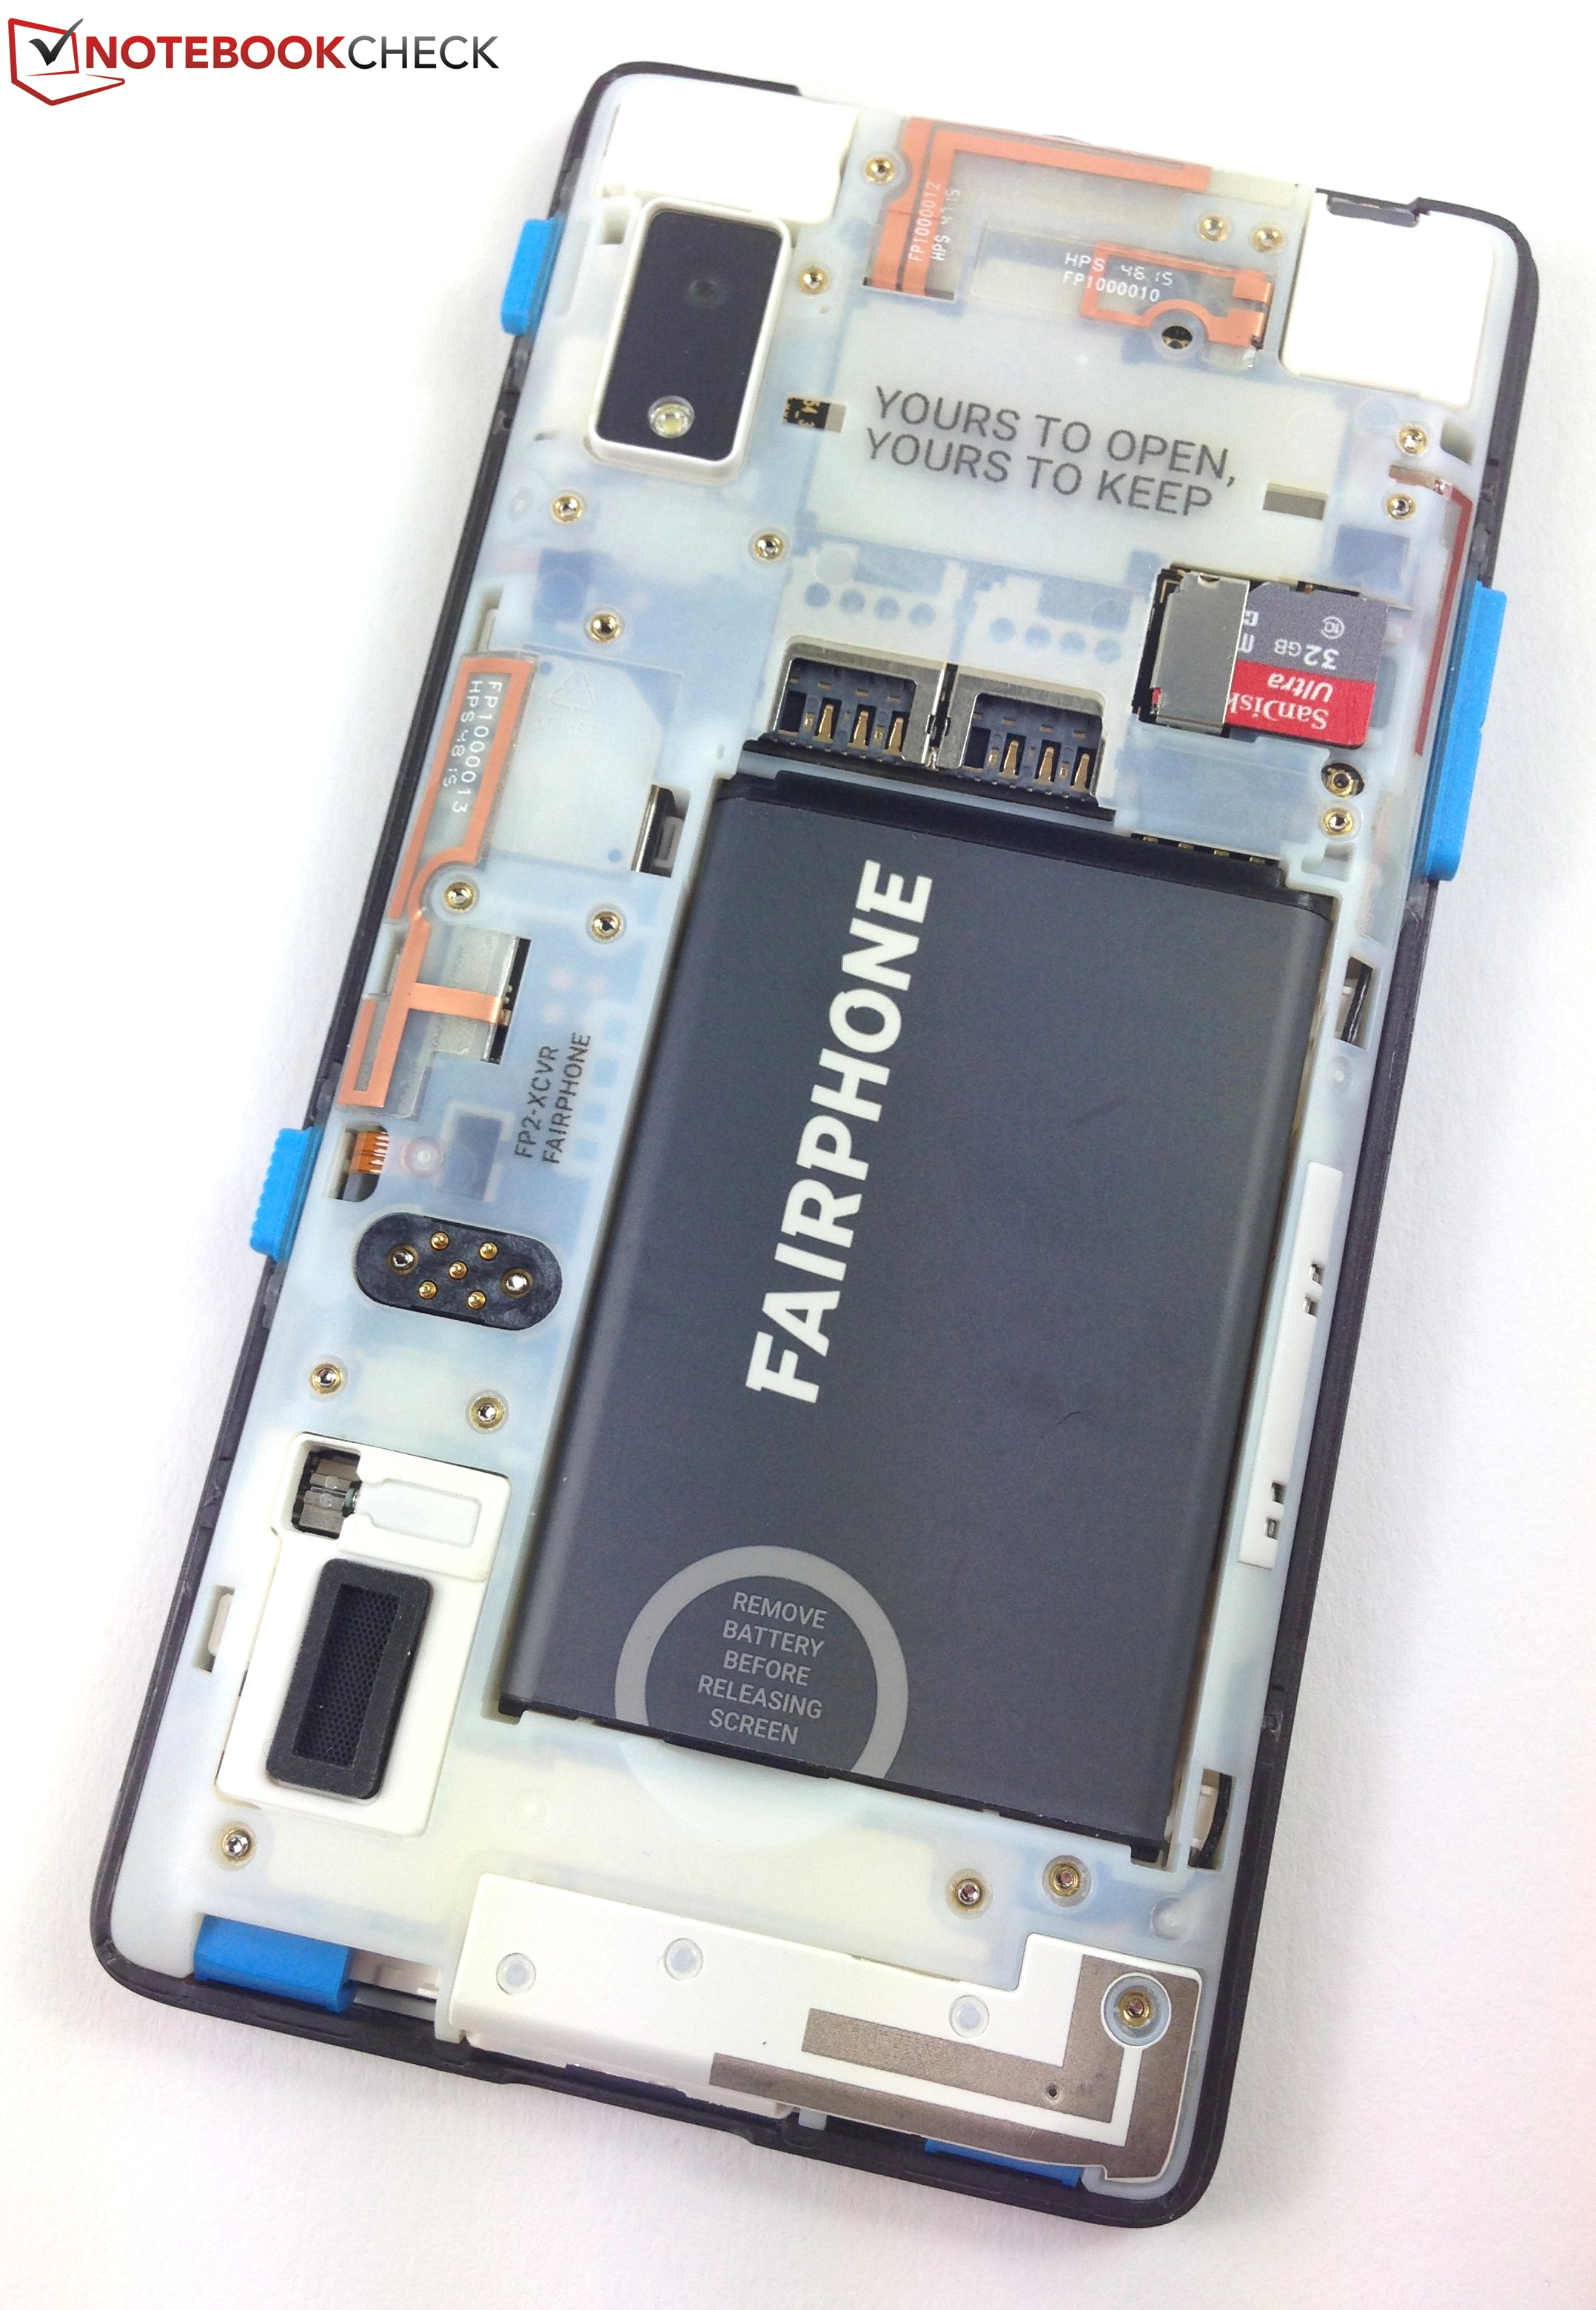
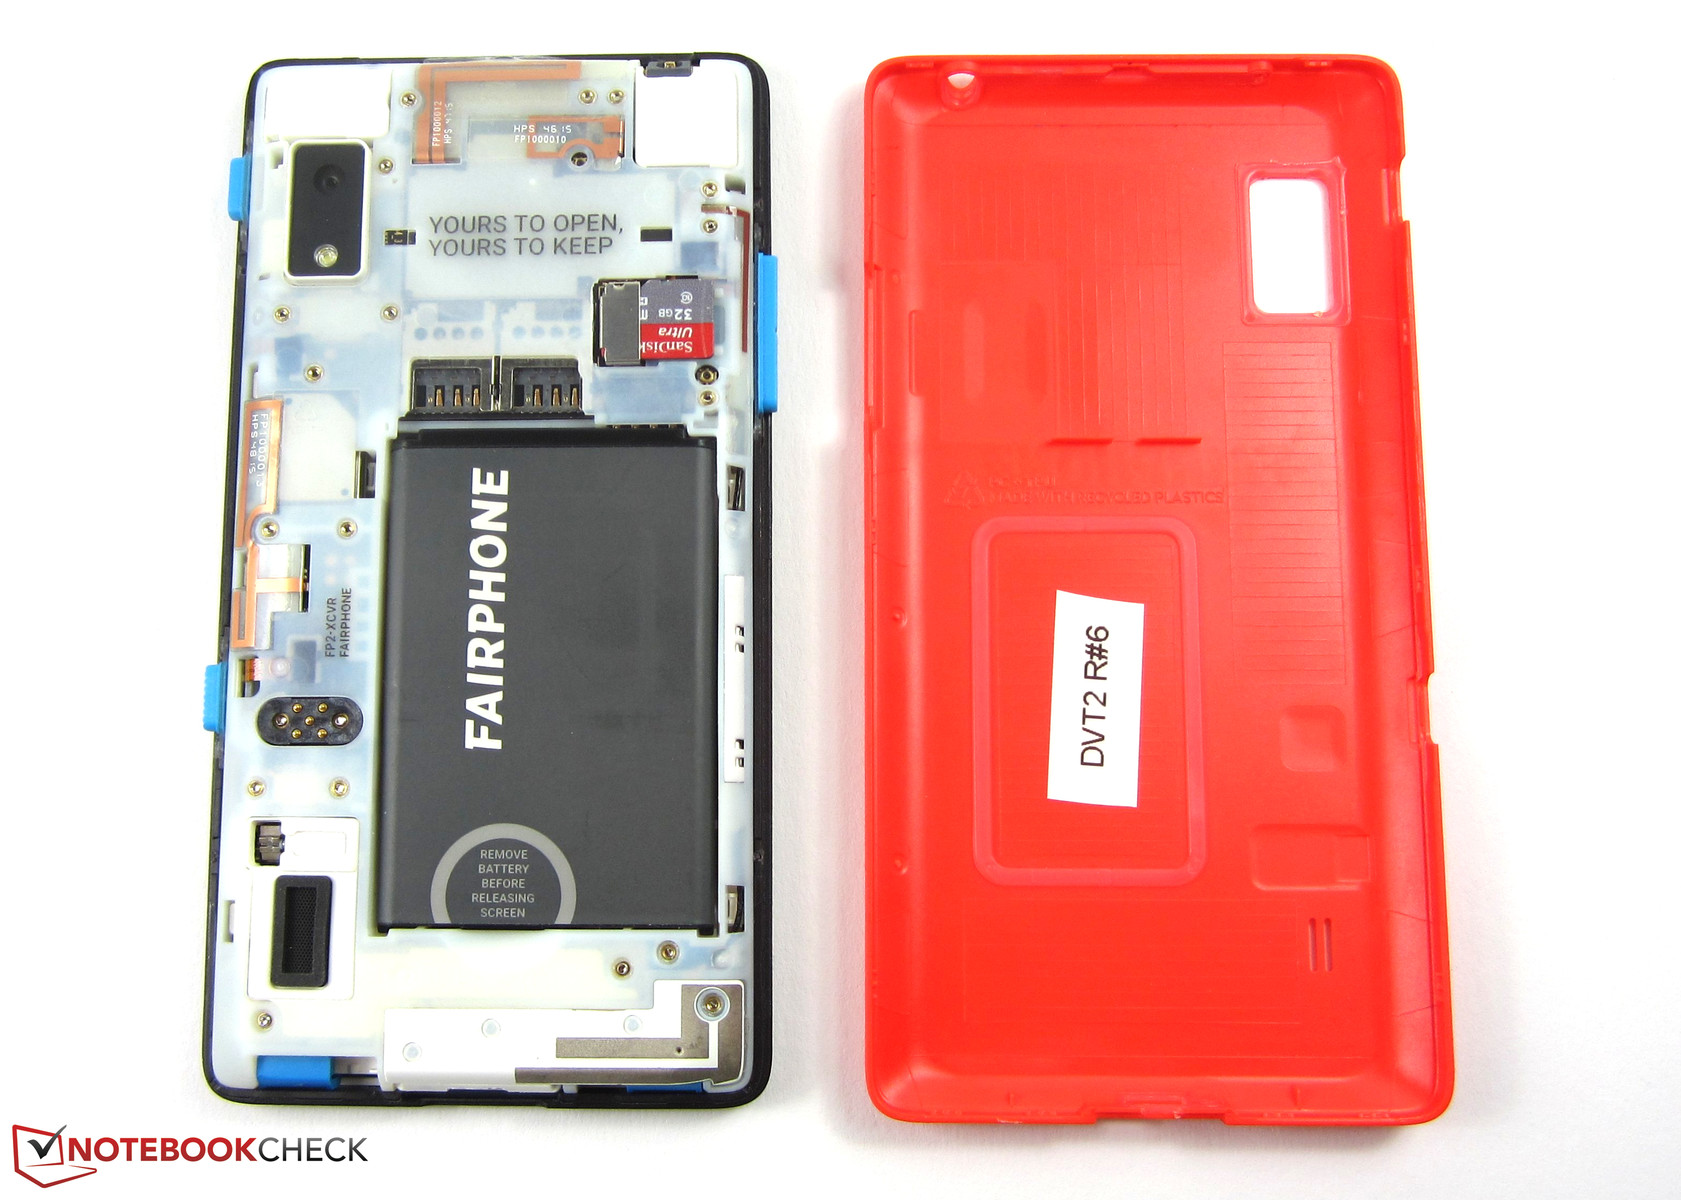
O modelo de teste vem com um recurso realmente assassino, e, assim, aumentamos a pontuação total em um ponto. O design modular mostra que os usuários podem consertar um smartphone por si mesmos, com pouco esforço e que inclusive é possível substituir o hardware ou instalar recursos melhores. Deve ser bastante óbvio que a indústria está em contra disto e deseja que os usuários comprem um smartphone completamente novo e caro, em vez de upgrades de hardware econômicos. A ideia consistente do Fairphone 2 nos convenceu, embora a decisão de compra poderia ter sido feita mais fácil. Depois de tudo, devem ser feitos compromissos em termos de configuração, que são are menores, no final.
Fairphone 2
- 11/24/2016 v5.1 (old)
Manuel Masiero