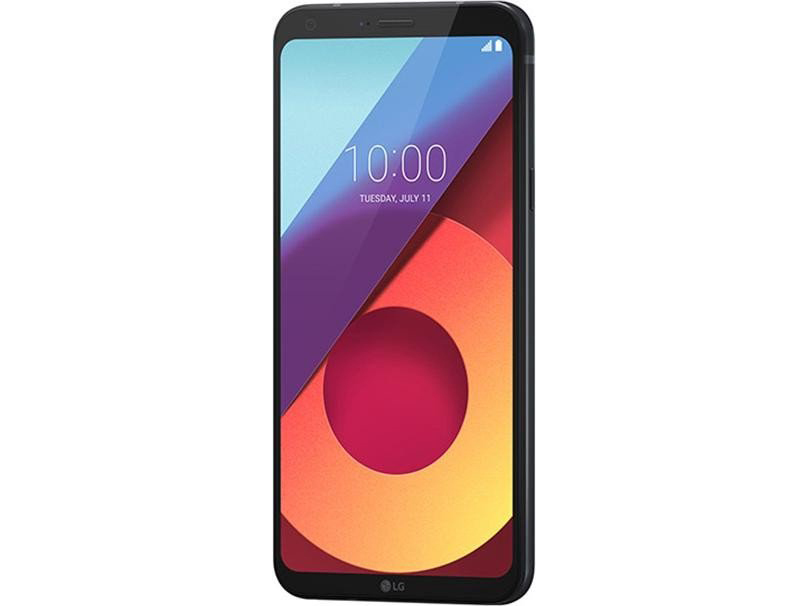
Breve Análise do Smartphone LG Q6
| Networking | |
| iperf3 transmit AX12 | |
| LG G6 | |
| Lenovo P2 | |
| Samsung Galaxy A5 2017 | |
| LG Q6 | |
| Asus Zenfone 3 ZE552KL | |
| iperf3 receive AX12 | |
| LG G6 | |
| Samsung Galaxy A5 2017 | |
| Lenovo P2 | |
| LG Q6 | |
| Asus Zenfone 3 ZE552KL | |

| |||||||||||||||||||||||||
iluminação: 88 %
iluminação com acumulador: 523 cd/m²
Contraste: 2179:1 (Preto: 0.24 cd/m²)
ΔE ColorChecker Calman: 6.4 | ∀{0.5-29.43 Ø4.71}
ΔE Greyscale Calman: 7.4 | ∀{0.09-98 Ø4.96}
98.1% sRGB (Calman 2D)
Gamma: 2.4
CCT: 8641 K
| LG Q6 IPS, 2160x1080, 5.5" | LG G6 IPS LCD, 2880x1440, 5.7" | Lenovo P2 AMOLED, 1920x1080, 5.5" | Samsung Galaxy A5 2017 Super AMOLED, 1920x1080, 5.2" | Asus Zenfone 3 ZE552KL IPS, 1920x1080, 5.5" | |
|---|---|---|---|---|---|
| Screen | 19% | 28% | 42% | -14% | |
| Brightness middle (cd/m²) | 523 | 646 24% | 479 -8% | 539 3% | 658 26% |
| Brightness (cd/m²) | 498 | 611 23% | 477 -4% | 542 9% | 633 27% |
| Brightness Distribution (%) | 88 | 89 1% | 91 3% | 93 6% | 93 6% |
| Black Level * (cd/m²) | 0.24 | 0.23 4% | 0.66 -175% | ||
| Contrast (:1) | 2179 | 2809 29% | 997 -54% | ||
| Colorchecker dE 2000 * | 6.4 | 4.5 30% | 2.4 63% | 1.6 75% | 4.9 23% |
| Colorchecker dE 2000 max. * | 11 | 8.3 25% | 5.6 49% | 2.6 76% | 9.1 17% |
| Greyscale dE 2000 * | 7.4 | 6 19% | 2.8 62% | 1.5 80% | 5.8 22% |
| Gamma | 2.4 92% | 2.27 97% | 2.28 96% | 2.28 96% | 2.26 97% |
| CCT | 8641 75% | 7996 81% | 6702 97% | 6422 101% | 7840 83% |
| Color Space (Percent of AdobeRGB 1998) (%) | 67.74 | ||||
| Color Space (Percent of sRGB) (%) | 99.05 |
* ... menor é melhor
Cintilação da tela / PWM (modulação por largura de pulso)
| Tela tremeluzindo / PWM não detectado | 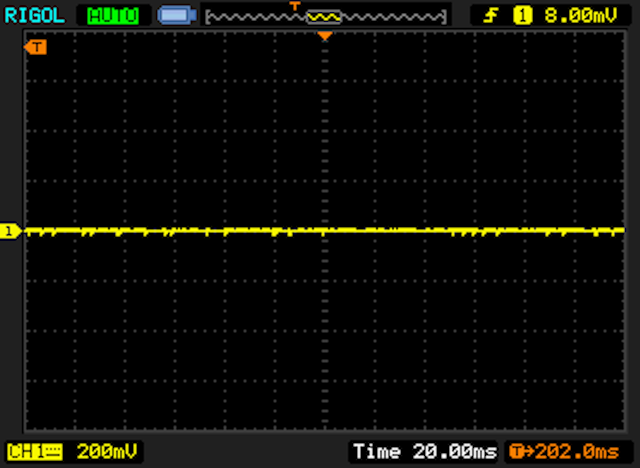 | ||
[pwm_comparison] Em comparação: 52 % de todos os dispositivos testados não usam PWM para escurecer a tela. Se PWM foi detectado, uma média de 7757 (mínimo: 5 - máximo: 343500) Hz foi medida. | |||
Exibir tempos de resposta
| ↔ Tempo de resposta preto para branco | ||
|---|---|---|
| 26 ms ... ascensão ↗ e queda ↘ combinadas | ↗ 13 ms ascensão | 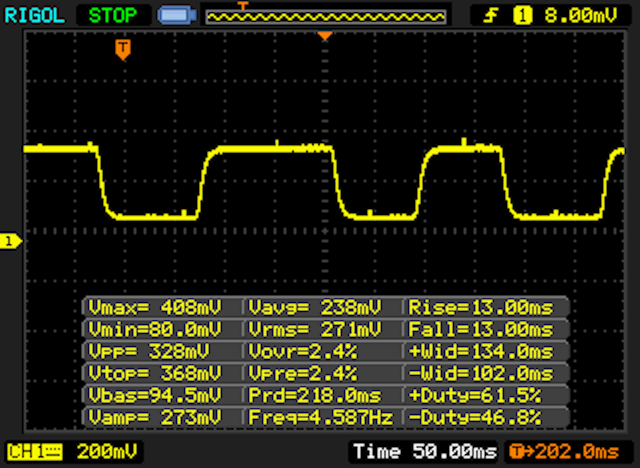 |
| ↘ 13 ms queda | ||
| A tela mostra taxas de resposta relativamente lentas em nossos testes e pode ser muito lenta para os jogadores. Em comparação, todos os dispositivos testados variam de 0.1 (mínimo) a 240 (máximo) ms. » 63 % de todos os dispositivos são melhores. Isso significa que o tempo de resposta medido é pior que a média de todos os dispositivos testados (19.8 ms). | ||
| ↔ Tempo de resposta 50% cinza a 80% cinza | ||
| 38 ms ... ascensão ↗ e queda ↘ combinadas | ↗ 19 ms ascensão | 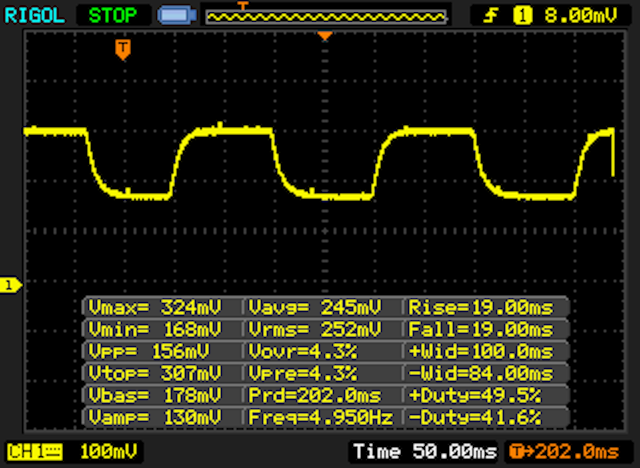 |
| ↘ 19 ms queda | ||
| A tela mostra taxas de resposta lentas em nossos testes e será insatisfatória para os jogadores. Em comparação, todos os dispositivos testados variam de 0.165 (mínimo) a 636 (máximo) ms. » 55 % de todos os dispositivos são melhores. Isso significa que o tempo de resposta medido é pior que a média de todos os dispositivos testados (31 ms). | ||
| AnTuTu v6 - Total Score (classificar por valor) | |
| LG Q6 | |
| LG G6 | |
| Lenovo P2 | |
| Samsung Galaxy A5 2017 | |
| Asus Zenfone 3 ZE552KL | |
| PCMark for Android | |
| Work performance score (classificar por valor) | |
| LG Q6 | |
| LG G6 | |
| Lenovo P2 | |
| Samsung Galaxy A5 2017 | |
| Asus Zenfone 3 ZE552KL | |
| Work 2.0 performance score (classificar por valor) | |
| LG Q6 | |
| LG G6 | |
| Lenovo P2 | |
| Samsung Galaxy A5 2017 | |
| Geekbench 4.4 | |
| 64 Bit Single-Core Score (classificar por valor) | |
| LG Q6 | |
| LG G6 | |
| Samsung Galaxy A5 2017 | |
| 64 Bit Multi-Core Score (classificar por valor) | |
| LG Q6 | |
| LG G6 | |
| Samsung Galaxy A5 2017 | |
| Compute RenderScript Score (classificar por valor) | |
| LG Q6 | |
| LG G6 | |
| Samsung Galaxy A5 2017 | |
| GFXBench (DX / GLBenchmark) 2.7 | |
| T-Rex Onscreen (classificar por valor) | |
| LG Q6 | |
| LG G6 | |
| Lenovo P2 | |
| Samsung Galaxy A5 2017 | |
| Asus Zenfone 3 ZE552KL | |
| 1920x1080 T-Rex Offscreen (classificar por valor) | |
| LG Q6 | |
| LG G6 | |
| Lenovo P2 | |
| Samsung Galaxy A5 2017 | |
| Asus Zenfone 3 ZE552KL | |
| GFXBench 3.0 | |
| on screen Manhattan Onscreen OGL (classificar por valor) | |
| LG Q6 | |
| LG G6 | |
| Lenovo P2 | |
| Samsung Galaxy A5 2017 | |
| Asus Zenfone 3 ZE552KL | |
| 1920x1080 1080p Manhattan Offscreen (classificar por valor) | |
| LG Q6 | |
| LG G6 | |
| Lenovo P2 | |
| Samsung Galaxy A5 2017 | |
| Asus Zenfone 3 ZE552KL | |
| GFXBench 3.1 | |
| on screen Manhattan ES 3.1 Onscreen (classificar por valor) | |
| LG Q6 | |
| LG G6 | |
| Lenovo P2 | |
| Samsung Galaxy A5 2017 | |
| Asus Zenfone 3 ZE552KL | |
| 1920x1080 Manhattan ES 3.1 Offscreen (classificar por valor) | |
| LG Q6 | |
| LG G6 | |
| Lenovo P2 | |
| Samsung Galaxy A5 2017 | |
| Asus Zenfone 3 ZE552KL | |
| GFXBench | |
| on screen Car Chase Onscreen (classificar por valor) | |
| LG Q6 | |
| LG G6 | |
| Lenovo P2 | |
| Samsung Galaxy A5 2017 | |
| Asus Zenfone 3 ZE552KL | |
| 1920x1080 Car Chase Offscreen (classificar por valor) | |
| LG Q6 | |
| LG G6 | |
| Lenovo P2 | |
| Samsung Galaxy A5 2017 | |
| Asus Zenfone 3 ZE552KL | |
| JetStream 1.1 - 1.1 Total | |
| LG G6 (Chrome 57) | |
| Samsung Galaxy A5 2017 (Samsung Browser (Chrome 44)) | |
| Asus Zenfone 3 ZE552KL (Chrome 53.0.2785.124) | |
| Lenovo P2 (Chrome 56) | |
| LG Q6 (Chrome 59) | |
| Octane V2 - Total Score | |
| LG G6 (Chrome 57) | |
| Samsung Galaxy A5 2017 (Samsung Browser (Chrome 44)) | |
| Asus Zenfone 3 ZE552KL (Chrome 53.0.2785.124) | |
| Lenovo P2 (Chrome 56) | |
| LG Q6 (Chrome 59) | |
| Mozilla Kraken 1.1 - Total | |
| LG Q6 (Chrome 59) | |
| Lenovo P2 (Chrome 56) | |
| Asus Zenfone 3 ZE552KL (Chrome 53.0.2785.124) | |
| Samsung Galaxy A5 2017 (Samsung Browser (Chrome 44)) | |
| LG G6 (Chrome 57) | |
| WebXPRT 2015 - Overall | |
| LG G6 (Chrome 57) | |
| Samsung Galaxy A5 2017 (Samsung Browser (Chrome 44)) | |
| Asus Zenfone 3 ZE552KL (Chrome 53.0.2785.124) | |
| Lenovo P2 | |
| LG Q6 (Chrome 59) | |
* ... menor é melhor
| LG Q6 | LG G6 | Lenovo P2 | Samsung Galaxy A5 2017 | Asus Zenfone 3 ZE552KL | |
|---|---|---|---|---|---|
| AndroBench 3-5 | 31% | 50% | -21% | 6% | |
| Sequential Read 256KB (MB/s) | 263.1 | 428.7 63% | 270.1 3% | 182 -31% | 282 7% |
| Sequential Write 256KB (MB/s) | 133.5 | 122.8 -8% | 76.7 -43% | 77.1 -42% | 188 41% |
| Random Read 4KB (MB/s) | 54.3 | 95.2 75% | 38.2 -30% | 22.41 -59% | 74 36% |
| Random Write 4KB (MB/s) | 9.2 | 16.58 80% | 44.4 383% | 12.13 32% | 7.4 -20% |
| Sequential Read 256KB SDCard (MB/s) | 84.8 | 77.6 ? -8% | 79.3 ? -6% | 73.7 ? -13% | 79.2 ? -7% |
| Sequential Write 256KB SDCard (MB/s) | 62.6 | 53.3 ? -15% | 59.4 ? -5% | 56 ? -11% | 50.1 ? -20% |
| Asphalt 8: Airborne | |||
| Configurações | Valor | ||
| high | 25 fps | ||
| very low | 30 fps | ||
| Dead Trigger 2 | |||
| Configurações | Valor | ||
| high | 30 fps | ||
(+) A temperatura máxima no lado superior é 34.6 °C / 94 F, em comparação com a média de 35.3 °C / 96 F , variando de 21.9 a 247 °C para a classe Smartphone.
(+) A parte inferior aquece até um máximo de 34 °C / 93 F, em comparação com a média de 34 °C / 93 F
(+) Em uso inativo, a temperatura média para o lado superior é 31.4 °C / 89 F, em comparação com a média do dispositivo de 33 °C / ### class_avg_f### F.
LG Q6 análise de áudio
(+) | os alto-falantes podem tocar relativamente alto (###valor### dB)
Graves 100 - 315Hz
(-) | quase nenhum baixo - em média 36% menor que a mediana
(±) | a linearidade dos graves é média (10% delta para a frequência anterior)
Médios 400 - 2.000 Hz
(±) | médios reduzidos - em média 13% menor que a mediana
(±) | a linearidade dos médios é média (12.8% delta para frequência anterior)
Altos 2 - 16 kHz
(±) | máximos mais altos - em média 7.9% maior que a mediana
(+) | os máximos são lineares (4.4% delta da frequência anterior)
Geral 100 - 16.000 Hz
(-) | o som geral não é linear (35.2% diferença em relação à mediana)
Comparado com a mesma classe
» 85% de todos os dispositivos testados nesta classe foram melhores, 1% semelhantes, 14% piores
» O melhor teve um delta de 11%, a média foi 34%, o pior foi 134%
Comparado com todos os dispositivos testados
» 93% de todos os dispositivos testados foram melhores, 1% semelhantes, 6% piores
» O melhor teve um delta de 4%, a média foi 23%, o pior foi 134%
Samsung Galaxy A5 2017 análise de áudio
(+) | os alto-falantes podem tocar relativamente alto (###valor### dB)
Graves 100 - 315Hz
(-) | quase nenhum baixo - em média 15.5% menor que a mediana
(±) | a linearidade dos graves é média (9.1% delta para a frequência anterior)
Médios 400 - 2.000 Hz
(±) | médios mais altos - em média 9.4% maior que a mediana
(±) | a linearidade dos médios é média (7.6% delta para frequência anterior)
Altos 2 - 16 kHz
(±) | máximos mais altos - em média 5% maior que a mediana
(±) | a linearidade dos máximos é média (7.6% delta para frequência anterior)
Geral 100 - 16.000 Hz
(±) | a linearidade do som geral é média (23.6% diferença em relação à mediana)
Comparado com a mesma classe
» 54% de todos os dispositivos testados nesta classe foram melhores, 8% semelhantes, 38% piores
» O melhor teve um delta de 11%, a média foi 34%, o pior foi 134%
Comparado com todos os dispositivos testados
» 71% de todos os dispositivos testados foram melhores, 6% semelhantes, 23% piores
» O melhor teve um delta de 4%, a média foi 23%, o pior foi 134%
| desligado | |
| Ocioso | |
| Carga |
|
Key:
min: | |
| LG Q6 3000 mAh | LG G6 3300 mAh | Lenovo P2 5100 mAh | Samsung Galaxy A5 2017 3000 mAh | Asus Zenfone 3 ZE552KL 3000 mAh | |
|---|---|---|---|---|---|
| Power Consumption | -25% | 39% | 28% | -4% | |
| Idle Minimum * (Watt) | 0.92 | 0.62 33% | 0.54 41% | 0.64 30% | 0.83 10% |
| Idle Average * (Watt) | 2.19 | 1.43 35% | 1.01 54% | 1.36 38% | 2.11 4% |
| Idle Maximum * (Watt) | 2.24 | 1.48 34% | 1.03 54% | 1.4 38% | 2.12 5% |
| Load Average * (Watt) | 3.38 | 5.52 -63% | 1.78 47% | 2.53 25% | 3.41 -1% |
| Load Maximum * (Watt) | 4 | 10.47 -162% | 3.98 -0% | 3.63 9% | 5.46 -37% |
* ... menor é melhor
| LG Q6 3000 mAh | LG G6 3300 mAh | Lenovo P2 5100 mAh | Samsung Galaxy A5 2017 3000 mAh | Asus Zenfone 3 ZE552KL 3000 mAh | |
|---|---|---|---|---|---|
| Duração da bateria | 23% | 101% | 72% | 38% | |
| Reader / Idle (h) | 22.8 | 29.8 31% | 47.4 108% | 40.3 77% | 25 10% |
| H.264 (h) | 10.4 | 13 25% | 20 92% | 16.4 58% | 15.1 45% |
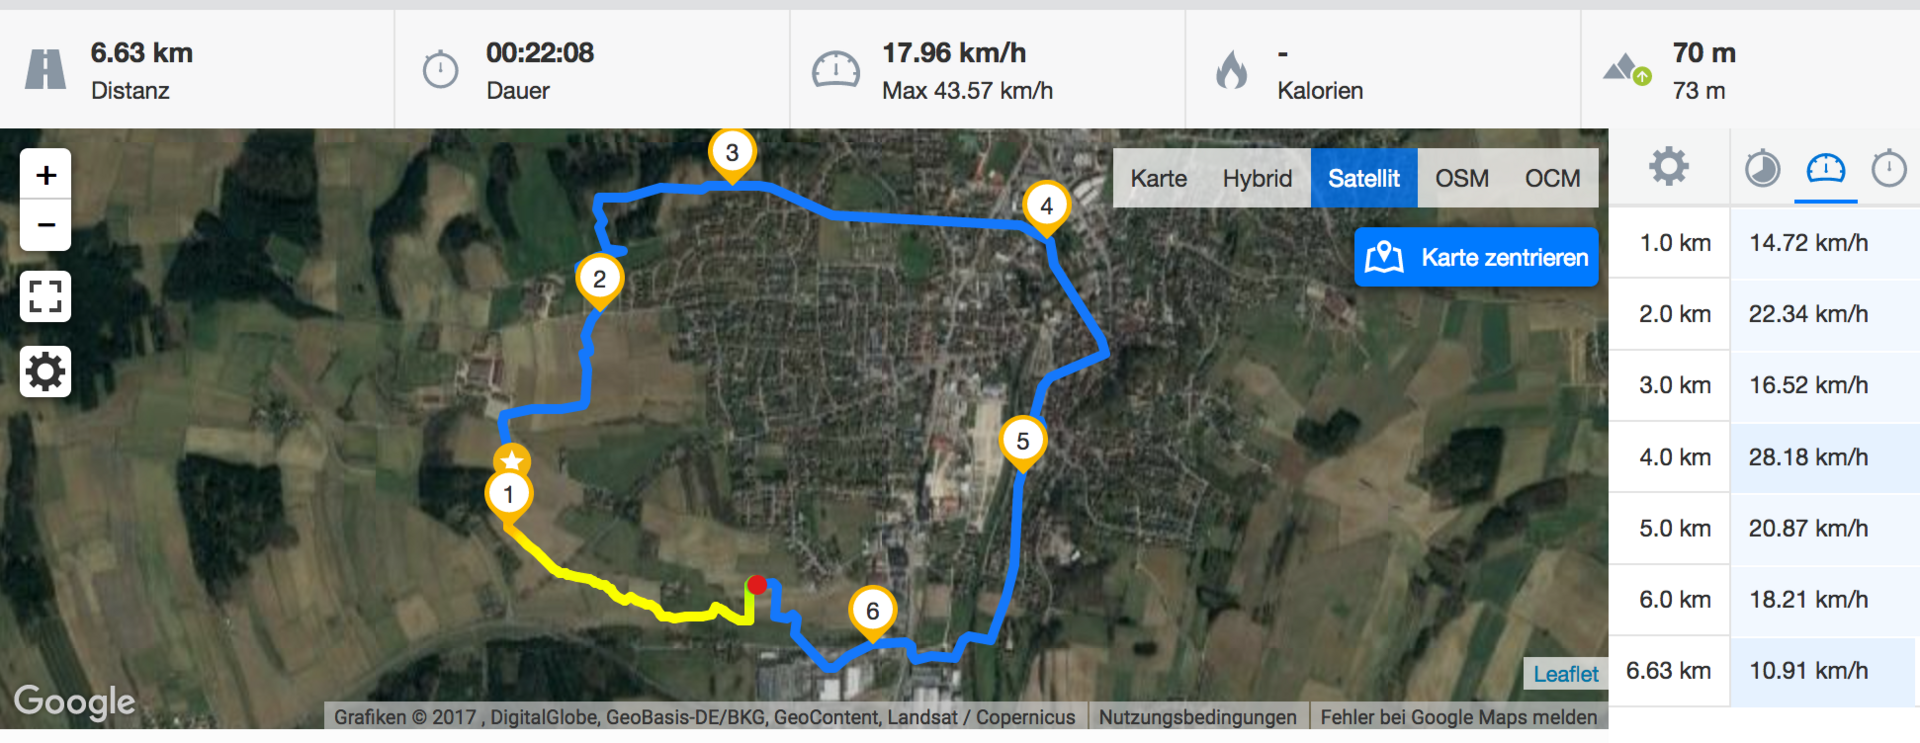
| WiFi v1.3 (h) | 8.4 | 11.5 37% | 16.3 94% | 14.1 68% | 13.3 58% |
| Load (h) | 4.2 | 4.2 0% | 8.8 110% | 7.8 86% | 5.9 40% |
Pro
Contra
A LG recortou o desempenho do Q6 um pouco demais, e o preço, pouco demais. O preço do LG Q6 compete com aparelhos que têm mais desempenho e mais duração da bateria - dois fatores importantes para um cliente potencial. Existem outras áreas, também, onde o LG Q6 não consegue manter o nível: os alto-falantes estão abaixo da média, o módulo Wi-Fi é bastante lento e o equipamento é apenas bom.
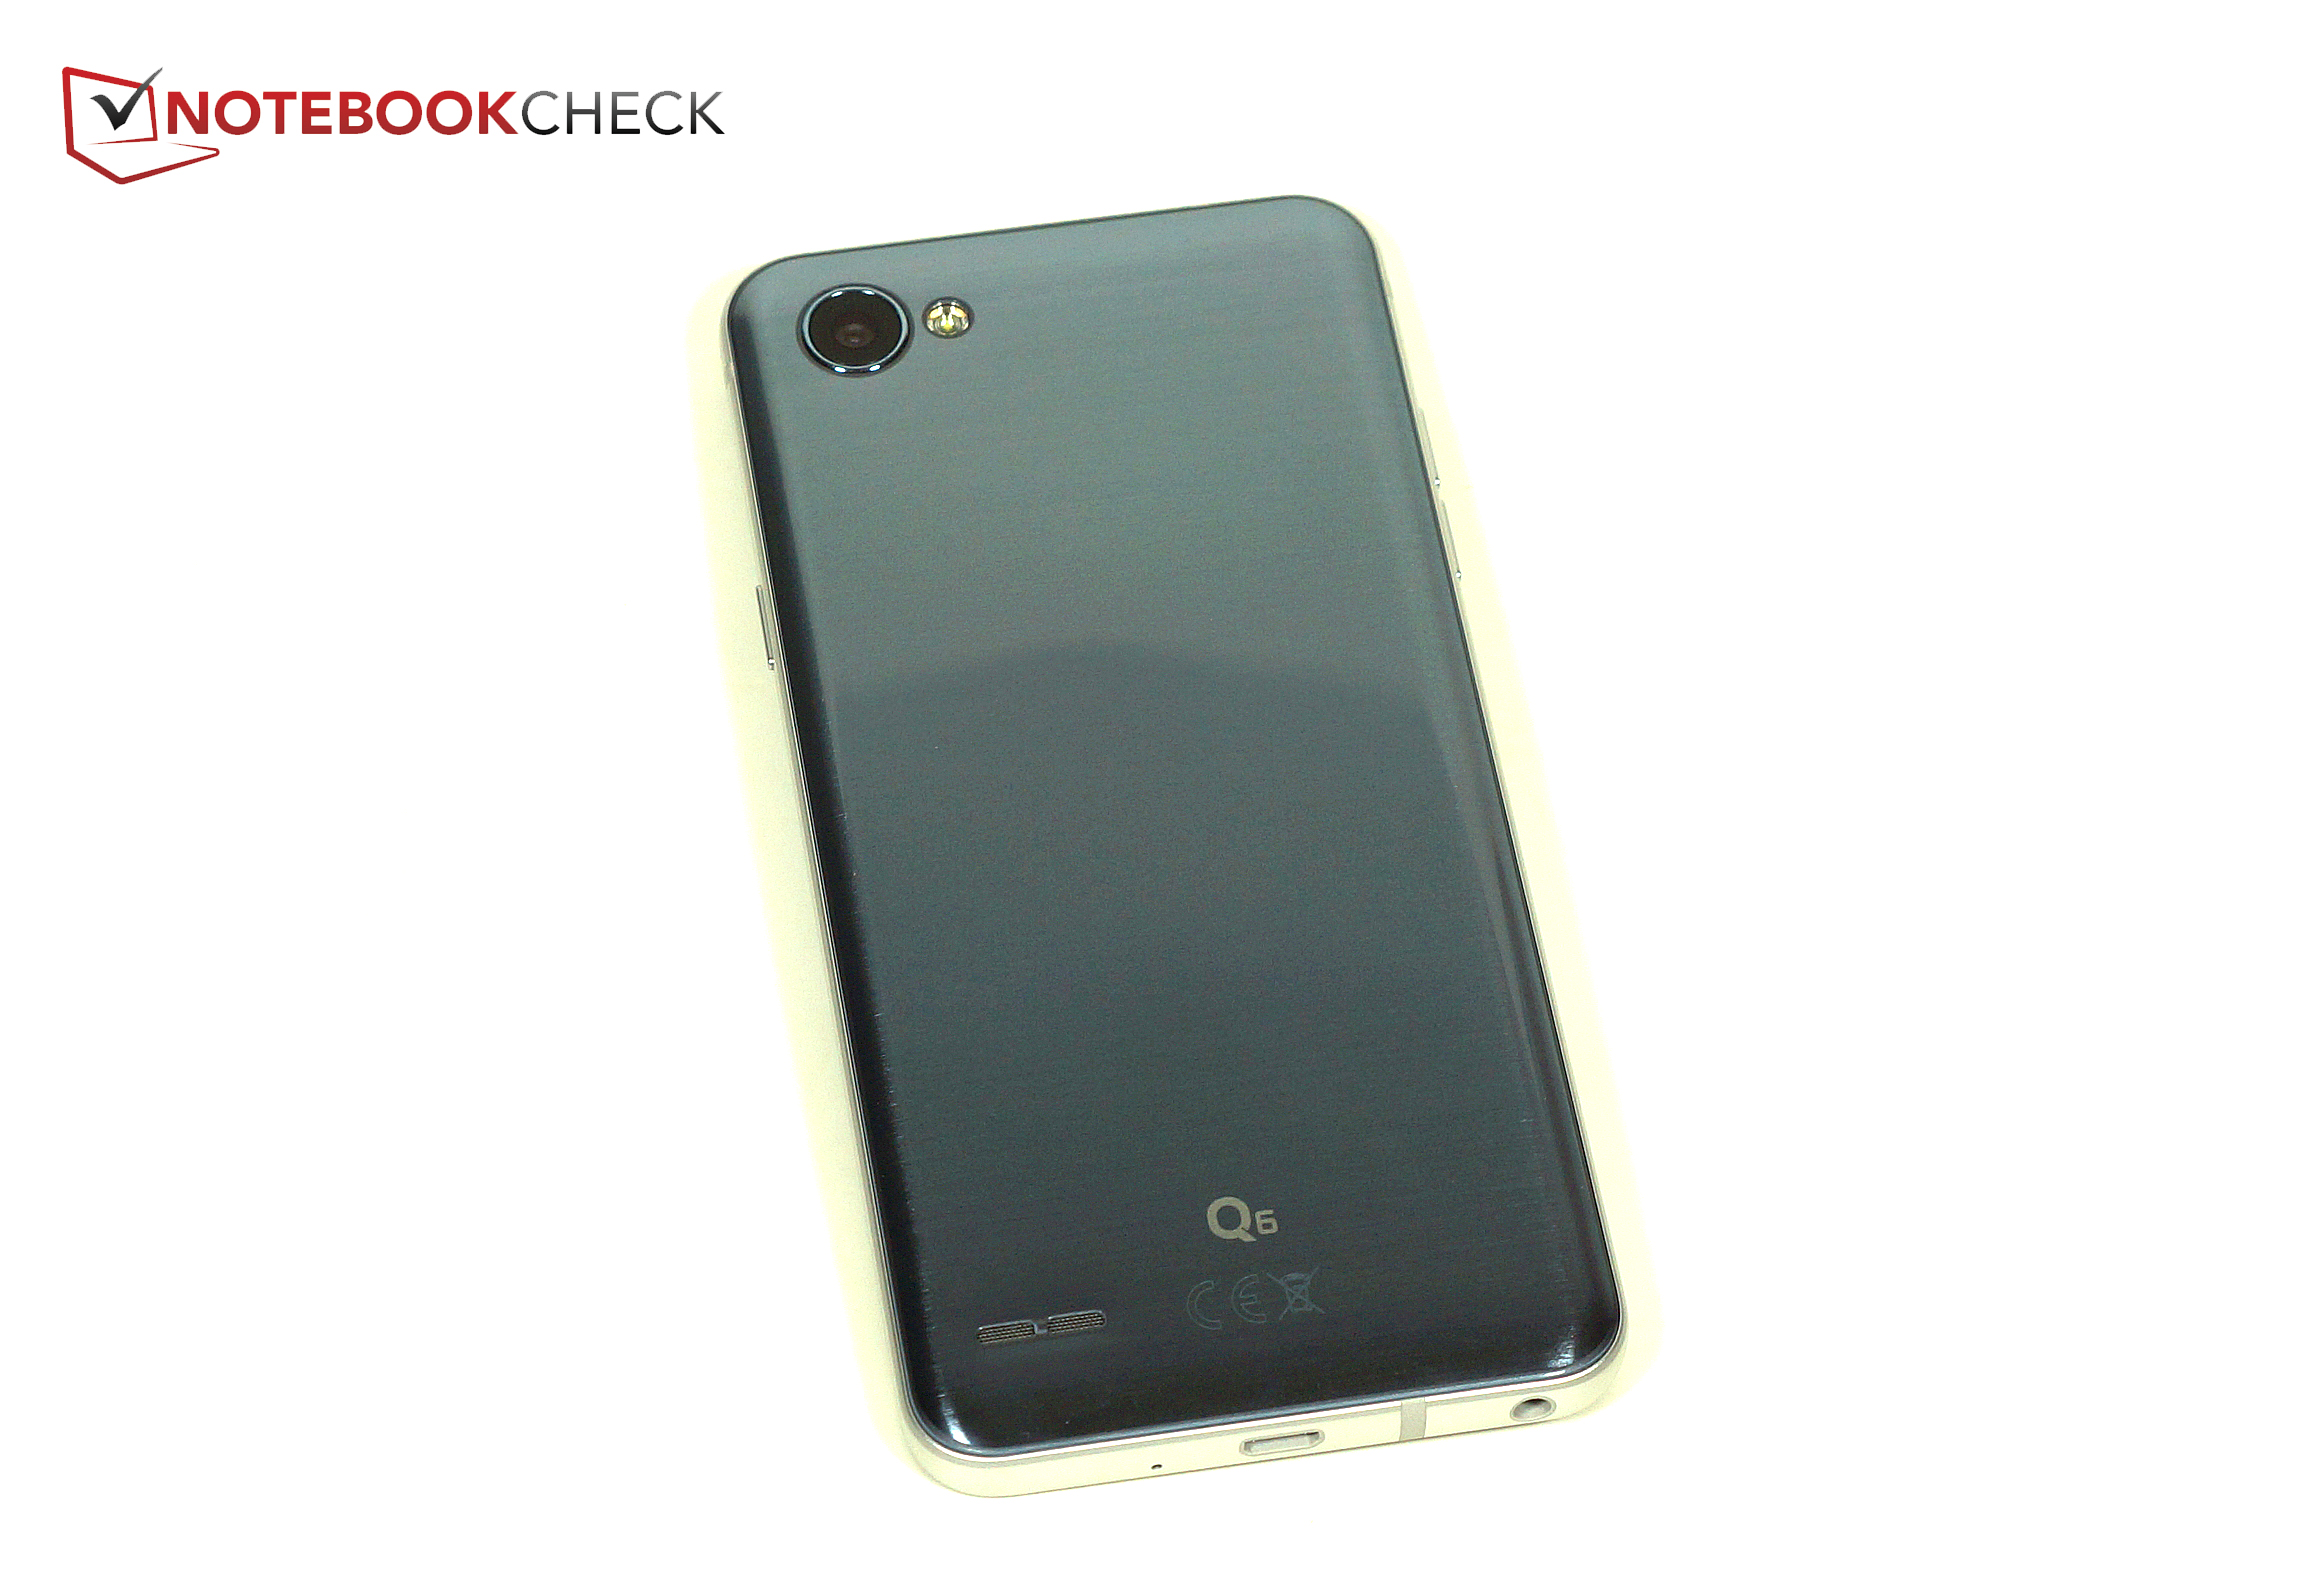
Então, novamente, a LG implementa alguns recursos agradáveis: a carcaça muito rígida e exclusiva com seu formato incomum e marcos laterais pequenos criam um aparelho muito atraente. O SO é atual e a LG promete atualizações rápidas no futuro. A qualidade das chamadas é boa, a câmera principal captura boas fotos, e a carcaça esquenta apenas um pouco sob uso intenso.
A LG fez recortes em muitos lugares. O desempenho do LG Q6 é muito baixo para esse segmento de preços. A carcaça sólida, as durações de bateria ligeiramente acima da média e a tela muito boa evitam que o telefone afunde.
Recomendamos que clientes potenciais esperem um pouco para a compra até que a LG ajustou o preço para o Q6 para um número mais adequado. Há muitos aparelhos melhores em seu segmento de preços atual, de cerca de $400. Se você gosta do design fino e está bem com o desempenho reduzido, estará recebendo um companheiro sólido para sua vida diária.
LG Q6
- 08/21/2017 v6 (old)
Florian Wimmer
Price comparison
