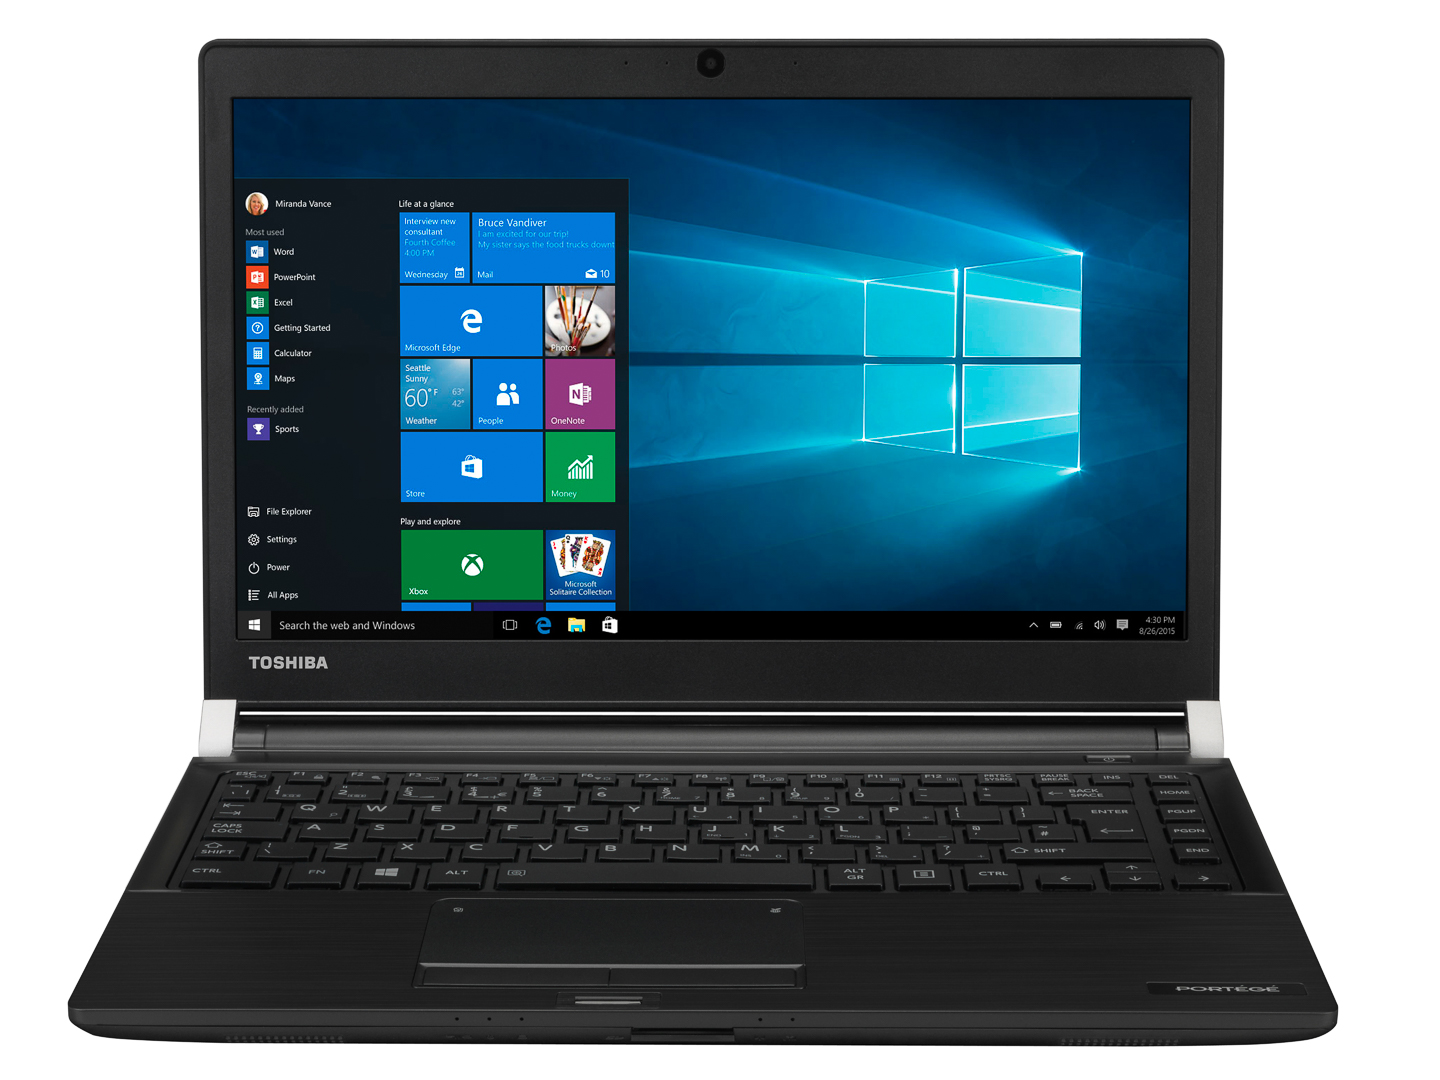
Breve Análise do Subportátil Toshiba Portégé A30-D (7100U, 128 GB)


| SD Card Reader | |
| average JPG Copy Test (av. of 3 runs) | |
| Dell XPS 13 9360 FHD i5 (Toshiba Exceria Pro SDXC 64 GB UHS-II) | |
| Toshiba Portege A30-D-139 (Toshiba Exceria Pro SDXC 64 GB UHS-II) | |
| Asus Zenbook UX3410UQ-GV077T (Toshiba Exceria Pro SDXC 64 GB UHS-II) | |
| maximum AS SSD Seq Read Test (1GB) | |
| Dell XPS 13 9360 FHD i5 (Toshiba Exceria Pro SDXC 64 GB UHS-II) | |
| Toshiba Portege A30-D-139 (Toshiba Exceria Pro SDXC 64 GB UHS-II) | |
| Asus Zenbook UX3410UQ-GV077T (Toshiba Exceria Pro SDXC 64 GB UHS-II) | |
| Networking | |
| iperf3 transmit AX12 | |
| Toshiba Portege A30-D-139 | |
| Huawei MateBook X | |
| Dell XPS 13 9360 FHD i5 | |
| Asus Zenbook UX3410UQ-GV077T | |
| iperf3 receive AX12 | |
| Asus Zenbook UX3410UQ-GV077T | |
| Toshiba Portege A30-D-139 | |
| Dell XPS 13 9360 FHD i5 | |
| Huawei MateBook X | |
| |||||||||||||||||||||||||
iluminação: 88 %
iluminação com acumulador: 310 cd/m²
Contraste: 1139:1 (Preto: 0.28 cd/m²)
ΔE ColorChecker Calman: 4.04 | ∀{0.5-29.43 Ø4.71}
ΔE Greyscale Calman: 5.5 | ∀{0.09-98 Ø4.96}
98% sRGB (Argyll 1.6.3 3D)
64% AdobeRGB 1998 (Argyll 1.6.3 3D)
70% AdobeRGB 1998 (Argyll 3D)
98.1% sRGB (Argyll 3D)
68% Display P3 (Argyll 3D)
Gamma: 2.4
CCT: 7198 K
| Toshiba Portege A30-D-139 Toshiba TOS508F, , 1920x1080, 13.3" | Huawei MateBook X Chi Mei CMN8201 / P130ZDZ-EF1, , 2160x1440, 13.3" | Asus Zenbook UX3410UQ-GV077T Chi Mei N140HCE-EN1, , 1920x1080, 14" | Dell XPS 13 9360 FHD i5 Sharp SHP1449 LQ133M1, , 1920x1080, 13.3" | |
|---|---|---|---|---|
| Display | -3% | -0% | -27% | |
| Display P3 Coverage (%) | 68 | 65.8 -3% | 67.2 -1% | 48.94 -28% |
| sRGB Coverage (%) | 98.1 | 96.2 -2% | 99.2 1% | 73.3 -25% |
| AdobeRGB 1998 Coverage (%) | 70 | 66.8 -5% | 69.3 -1% | 50.5 -28% |
| Response Times | 19% | -4% | 4% | |
| Response Time Grey 50% / Grey 80% * (ms) | 40 ? | 33 ? 17% | 44 ? -10% | 32.8 ? 18% |
| Response Time Black / White * (ms) | 30 ? | 24 ? 20% | 29 ? 3% | 33.2 ? -11% |
| PWM Frequency (Hz) | 208 ? | 60 ? | ||
| Screen | 17% | 10% | -5% | |
| Brightness middle (cd/m²) | 319 | 408 28% | 381 19% | 351.2 10% |
| Brightness (cd/m²) | 296 | 395 33% | 368 24% | 325 10% |
| Brightness Distribution (%) | 88 | 88 0% | 84 -5% | 89 1% |
| Black Level * (cd/m²) | 0.28 | 0.45 -61% | 0.3 -7% | 0.195 30% |
| Contrast (:1) | 1139 | 907 -20% | 1270 12% | 1801 58% |
| Colorchecker dE 2000 * | 4.04 | 1.55 62% | 2.84 30% | 7.4 -83% |
| Colorchecker dE 2000 max. * | 8.09 | 2.19 73% | 6.5 20% | 9.08 -12% |
| Greyscale dE 2000 * | 5.5 | 1.91 65% | 4.02 27% | 6.71 -22% |
| Gamma | 2.4 92% | 2.34 94% | 2.42 91% | 2.74 80% |
| CCT | 7198 90% | 6491 100% | 7430 87% | 7222 90% |
| Color Space (Percent of AdobeRGB 1998) (%) | 64 | 61 -5% | 56 -12% | 50.48 -21% |
| Color Space (Percent of sRGB) (%) | 98 | 96 -2% | 86 -12% | 73.31 -25% |
| Média Total (Programa/Configurações) | 11% /
13% | 2% /
6% | -9% /
-9% |
* ... menor é melhor
Exibir tempos de resposta
| ↔ Tempo de resposta preto para branco | ||
|---|---|---|
| 30 ms ... ascensão ↗ e queda ↘ combinadas | ↗ 16 ms ascensão | 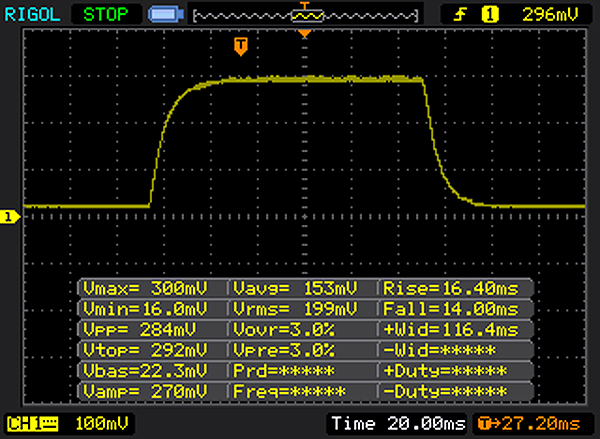 |
| ↘ 14 ms queda | ||
| A tela mostra taxas de resposta lentas em nossos testes e será insatisfatória para os jogadores. Em comparação, todos os dispositivos testados variam de 0.1 (mínimo) a 240 (máximo) ms. » 80 % de todos os dispositivos são melhores. Isso significa que o tempo de resposta medido é pior que a média de todos os dispositivos testados (19.8 ms). | ||
| ↔ Tempo de resposta 50% cinza a 80% cinza | ||
| 40 ms ... ascensão ↗ e queda ↘ combinadas | ↗ 20 ms ascensão | 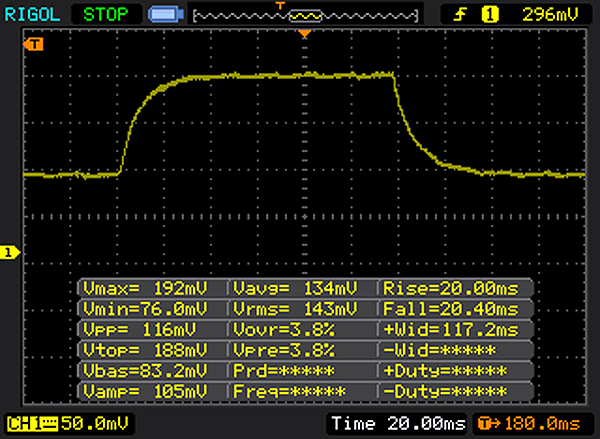 |
| ↘ 20 ms queda | ||
| A tela mostra taxas de resposta lentas em nossos testes e será insatisfatória para os jogadores. Em comparação, todos os dispositivos testados variam de 0.165 (mínimo) a 636 (máximo) ms. » 61 % de todos os dispositivos são melhores. Isso significa que o tempo de resposta medido é pior que a média de todos os dispositivos testados (31 ms). | ||
Cintilação da tela / PWM (modulação por largura de pulso)
| Tela tremeluzindo/PWM detectado | 208 Hz | ≤ 10 % configuração de brilho | 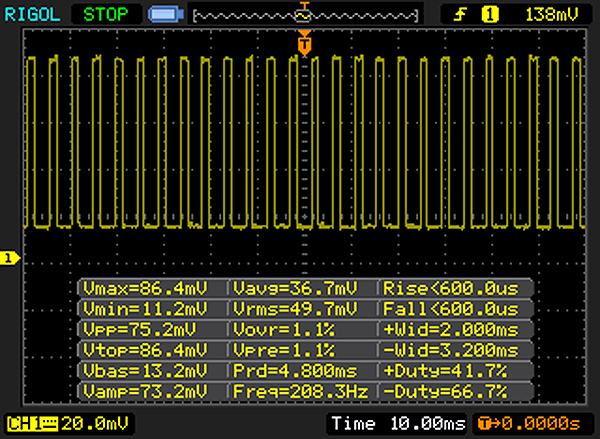 |
A luz de fundo da tela pisca em 208 Hz (pior caso, por exemplo, utilizando PWM) Cintilação detectada em uma configuração de brilho de 10 % e abaixo. Não deve haver cintilação ou PWM acima desta configuração de brilho. A frequência de 208 Hz é relativamente baixa, portanto, usuários sensíveis provavelmente notarão cintilação e sentirão fadiga ocular na configuração de brilho indicada e abaixo. [pwm_comparison] Em comparação: 52 % de todos os dispositivos testados não usam PWM para escurecer a tela. Se PWM foi detectado, uma média de 7754 (mínimo: 5 - máximo: 343500) Hz foi medida. | |||
| PCMark 8 | |
| Home Score Accelerated v2 | |
| Asus Zenbook UX3410UQ-GV077T | |
| Dell XPS 13 9360 FHD i5 | |
| Huawei MateBook X | |
| Toshiba Portege A30-D-139 | |
| Work Score Accelerated v2 | |
| Dell XPS 13 9360 FHD i5 | |
| Huawei MateBook X | |
| Toshiba Portege A30-D-139 | |
| PCMark 8 Home Score Accelerated v2 | 3247 pontos | |
| PCMark 8 Work Score Accelerated v2 | 4113 pontos | |
Ajuda | ||
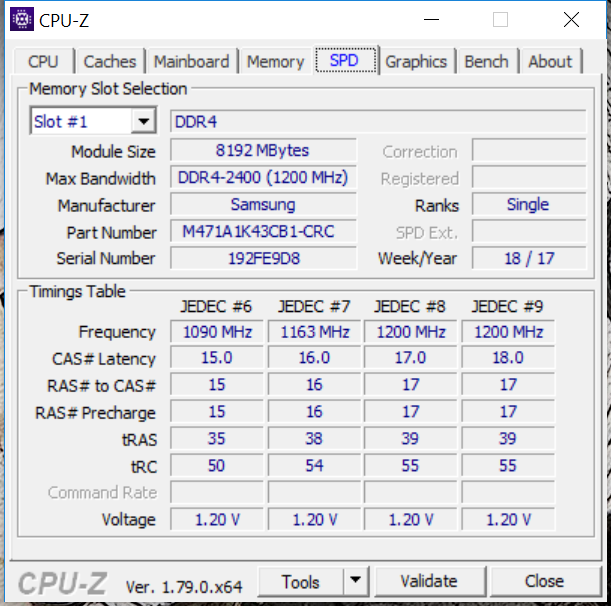
| Toshiba Portege A30-D-139 Toshiba SG5 THNSNK128GVN8 | Huawei MateBook X LITEON CB1-SD256 | Asus Zenbook UX3410UQ-GV077T SanDisk SD8SNAT256G1002 | Dell XPS 13 9360 FHD i5 Toshiba NVMe THNSN5256GPUK | |
|---|---|---|---|---|
| CrystalDiskMark 3.0 | 84% | 36% | 152% | |
| Read Seq (MB/s) | 471.1 | 741 57% | 497 5% | 1233 162% |
| Write Seq (MB/s) | 138.5 | 461.2 233% | 323.7 134% | 733 429% |
| Read 512 (MB/s) | 413.5 | 504 22% | 289 -30% | 1036 151% |
| Write 512 (MB/s) | 138.7 | 310.3 124% | 288 108% | 439.9 217% |
| Read 4k (MB/s) | 22.95 | 29.48 28% | 22.78 -1% | 29.31 28% |
| Write 4k (MB/s) | 79.4 | 68.1 -14% | 79.5 0% | 116.9 47% |
| Read 4k QD32 (MB/s) | 235 | 498.9 112% | 147 -37% | 479.2 104% |
| Write 4k QD32 (MB/s) | 121.8 | 257.5 111% | 257.2 111% | 218.3 79% |

| 3DMark 11 - 1280x720 Performance GPU | |
| Asus Zenbook UX3410UQ-GV077T | |
| Dell XPS 13 9360 FHD i5 | |
| Huawei MateBook X | |
| Toshiba Portege A30-D-139 | |
| 3DMark | |
| 1280x720 Cloud Gate Standard Graphics | |
| Dell XPS 13 9360 FHD i5 | |
| Huawei MateBook X | |
| Toshiba Portege A30-D-139 | |
| 1920x1080 Fire Strike Graphics | |
| Dell XPS 13 9360 FHD i5 | |
| Huawei MateBook X | |
| Toshiba Portege A30-D-139 | |
| 3DMark 11 Performance | 1478 pontos | |
| 3DMark Cloud Gate Standard Score | 5188 pontos | |
| 3DMark Fire Strike Score | 747 pontos | |
Ajuda | ||
| baixo | média | alto | ultra | |
|---|---|---|---|---|
| The Witcher 3 (2015) | 13.1 | |||
| Rise of the Tomb Raider (2016) | 17.2 | |||
| Farming Simulator 17 (2016) | 44 | 16.9 |
Barulho
| Ocioso |
| 30 / 30 / 30 dB |
| DVD |
| 37 / dB |
| Carga |
| 39.3 / 38.3 dB |
 | ||
30 dB silencioso 40 dB(A) audível 50 dB(A) ruidosamente alto |
||
min: | ||
(+) A temperatura máxima no lado superior é 39.2 °C / 103 F, em comparação com a média de 34.3 °C / 94 F , variando de 21.2 a 62.5 °C para a classe Office.
(+) A parte inferior aquece até um máximo de 39.5 °C / 103 F, em comparação com a média de 36.8 °C / 98 F
(+) Em uso inativo, a temperatura média para o lado superior é 26.8 °C / 80 F, em comparação com a média do dispositivo de 29.5 °C / ### class_avg_f### F.
(+) Os apoios para as mãos e o touchpad são mais frios que a temperatura da pele, com um máximo de 29.9 °C / 85.8 F e, portanto, são frios ao toque.
(-) A temperatura média da área do apoio para as mãos de dispositivos semelhantes foi 27.5 °C / 81.5 F (-2.4 °C / -4.3 F).
Toshiba Portege A30-D-139 análise de áudio
(±) | o volume do alto-falante é médio, mas bom (###valor### dB)
Graves 100 - 315Hz
(-) | quase nenhum baixo - em média 15.3% menor que a mediana
(+) | o baixo é linear (2.5% delta para a frequência anterior)
Médios 400 - 2.000 Hz
(±) | médios mais altos - em média 9.7% maior que a mediana
(±) | a linearidade dos médios é média (8.8% delta para frequência anterior)
Altos 2 - 16 kHz
(±) | máximos mais altos - em média 6% maior que a mediana
(±) | a linearidade dos máximos é média (7.9% delta para frequência anterior)
Geral 100 - 16.000 Hz
(±) | a linearidade do som geral é média (23.9% diferença em relação à mediana)
Comparado com a mesma classe
» 68% de todos os dispositivos testados nesta classe foram melhores, 9% semelhantes, 22% piores
» O melhor teve um delta de 7%, a média foi 21%, o pior foi 53%
Comparado com todos os dispositivos testados
» 72% de todos os dispositivos testados foram melhores, 6% semelhantes, 22% piores
» O melhor teve um delta de 4%, a média foi 23%, o pior foi 134%
Huawei MateBook X análise de áudio
(-) | alto-falantes não muito altos (###valor### dB)
Graves 100 - 315Hz
(±) | graves reduzidos - em média 8.3% menor que a mediana
(±) | a linearidade dos graves é média (7.6% delta para a frequência anterior)
Médios 400 - 2.000 Hz
(+) | médios equilibrados - apenas 3.3% longe da mediana
(+) | médios são lineares (6.2% delta para frequência anterior)
Altos 2 - 16 kHz
(+) | agudos equilibrados - apenas 2.6% longe da mediana
(+) | os máximos são lineares (6.6% delta da frequência anterior)
Geral 100 - 16.000 Hz
(+) | o som geral é linear (14.7% diferença em relação à mediana)
Comparado com a mesma classe
» 31% de todos os dispositivos testados nesta classe foram melhores, 5% semelhantes, 64% piores
» O melhor teve um delta de 5%, a média foi 18%, o pior foi 53%
Comparado com todos os dispositivos testados
» 19% de todos os dispositivos testados foram melhores, 4% semelhantes, 77% piores
» O melhor teve um delta de 4%, a média foi 23%, o pior foi 134%
Asus Zenbook UX3410UQ-GV077T análise de áudio
(±) | o volume do alto-falante é médio, mas bom (###valor### dB)
Graves 100 - 315Hz
(±) | graves reduzidos - em média 12% menor que a mediana
(+) | o baixo é linear (4.5% delta para a frequência anterior)
Médios 400 - 2.000 Hz
(±) | médios mais altos - em média 6.5% maior que a mediana
(+) | médios são lineares (6.7% delta para frequência anterior)
Altos 2 - 16 kHz
(+) | agudos equilibrados - apenas 3.9% longe da mediana
(+) | os máximos são lineares (4.8% delta da frequência anterior)
Geral 100 - 16.000 Hz
(±) | a linearidade do som geral é média (17% diferença em relação à mediana)
Comparado com a mesma classe
» 44% de todos os dispositivos testados nesta classe foram melhores, 8% semelhantes, 49% piores
» O melhor teve um delta de 5%, a média foi 18%, o pior foi 53%
Comparado com todos os dispositivos testados
» 31% de todos os dispositivos testados foram melhores, 8% semelhantes, 61% piores
» O melhor teve um delta de 4%, a média foi 23%, o pior foi 134%
Dell XPS 13 9360 FHD i5 análise de áudio
(-) | alto-falantes não muito altos (###valor### dB)
Graves 100 - 315Hz
(±) | graves reduzidos - em média 6.9% menor que a mediana
(±) | a linearidade dos graves é média (10.5% delta para a frequência anterior)
Médios 400 - 2.000 Hz
(+) | médios equilibrados - apenas 3.7% longe da mediana
(+) | médios são lineares (4% delta para frequência anterior)
Altos 2 - 16 kHz
(+) | agudos equilibrados - apenas 2% longe da mediana
(±) | a linearidade dos máximos é média (10.3% delta para frequência anterior)
Geral 100 - 16.000 Hz
(±) | a linearidade do som geral é média (18.3% diferença em relação à mediana)
Comparado com a mesma classe
» 53% de todos os dispositivos testados nesta classe foram melhores, 7% semelhantes, 40% piores
» O melhor teve um delta de 5%, a média foi 18%, o pior foi 53%
Comparado com todos os dispositivos testados
» 40% de todos os dispositivos testados foram melhores, 8% semelhantes, 52% piores
» O melhor teve um delta de 4%, a média foi 23%, o pior foi 134%
| desligado | |
| Ocioso | |
| Carga |
|
Key:
min: | |
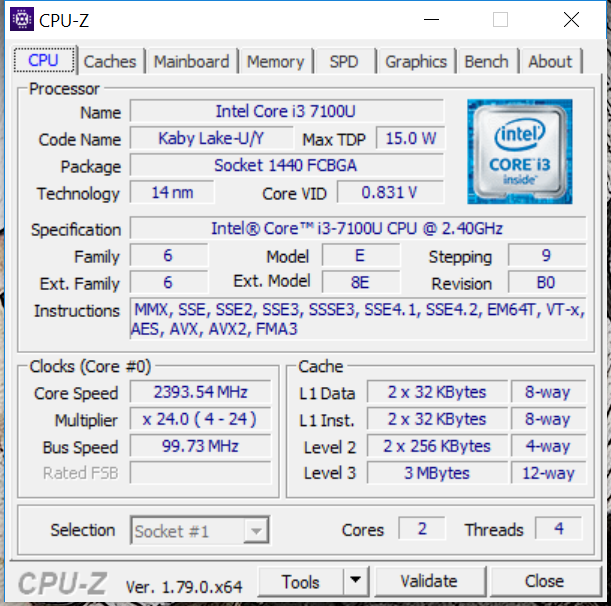
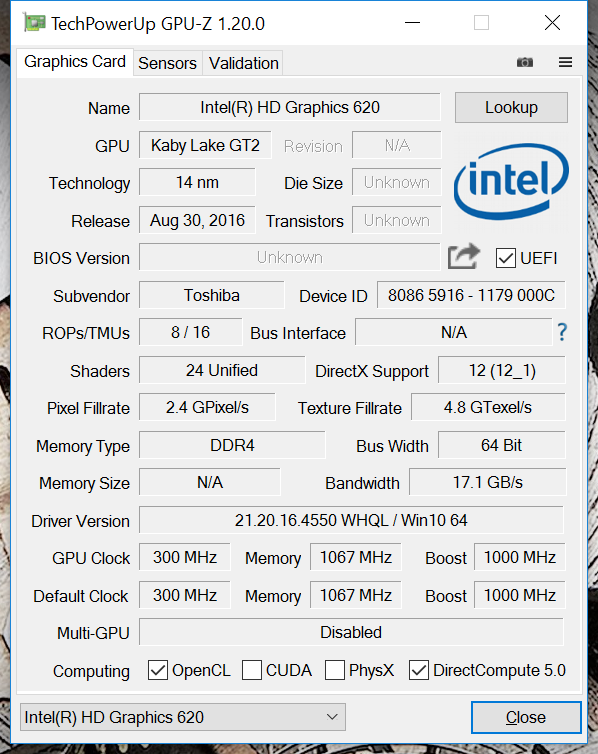
| Toshiba Portege A30-D-139 i3-7100U, HD Graphics 620, Toshiba SG5 THNSNK128GVN8, IPS, 1920x1080, 13.3" | Huawei MateBook X i5-7200U, HD Graphics 620, LITEON CB1-SD256, , 2160x1440, 13.3" | Asus Zenbook UX3410UQ-GV077T i7-7500U, GeForce 940MX, SanDisk SD8SNAT256G1002, IPS, 1920x1080, 14" | Dell XPS 13 9360 FHD i5 i5-7200U, HD Graphics 620, Toshiba NVMe THNSN5256GPUK, IPS, 1920x1080, 13.3" | |
|---|---|---|---|---|
| Power Consumption | -42% | -25% | 14% | |
| Idle Minimum * (Watt) | 3.2 | 4.6 -44% | 3.5 -9% | 4.1 -28% |
| Idle Average * (Watt) | 6.8 | 11 -62% | 6.6 3% | 4.2 38% |
| Idle Maximum * (Watt) | 8 | 12 -50% | 7.1 11% | 5.1 36% |
| Load Average * (Watt) | 30.4 | 39.5 -30% | 30 1% | 22.1 27% |
| Load Maximum * (Watt) | 28 | 34.6 -24% | 65 -132% | 29.4 -5% |
* ... menor é melhor
| Toshiba Portege A30-D-139 i3-7100U, HD Graphics 620, 45 Wh | Huawei MateBook X i5-7200U, HD Graphics 620, 40 Wh | Asus Zenbook UX3410UQ-GV077T i7-7500U, GeForce 940MX, 48 Wh | Dell XPS 13 9360 FHD i5 i5-7200U, HD Graphics 620, 60 Wh | |
|---|---|---|---|---|
| Duração da bateria | -30% | -7% | 15% | |
| Reader / Idle (h) | 16.8 | 8.5 -49% | 21.6 29% | |
| WiFi v1.3 (h) | 9.1 | 5.6 -38% | 8.5 -7% | 11.3 24% |
| Load (h) | 2.8 | 2.7 -4% | 2.6 -7% |
Pro
Contra
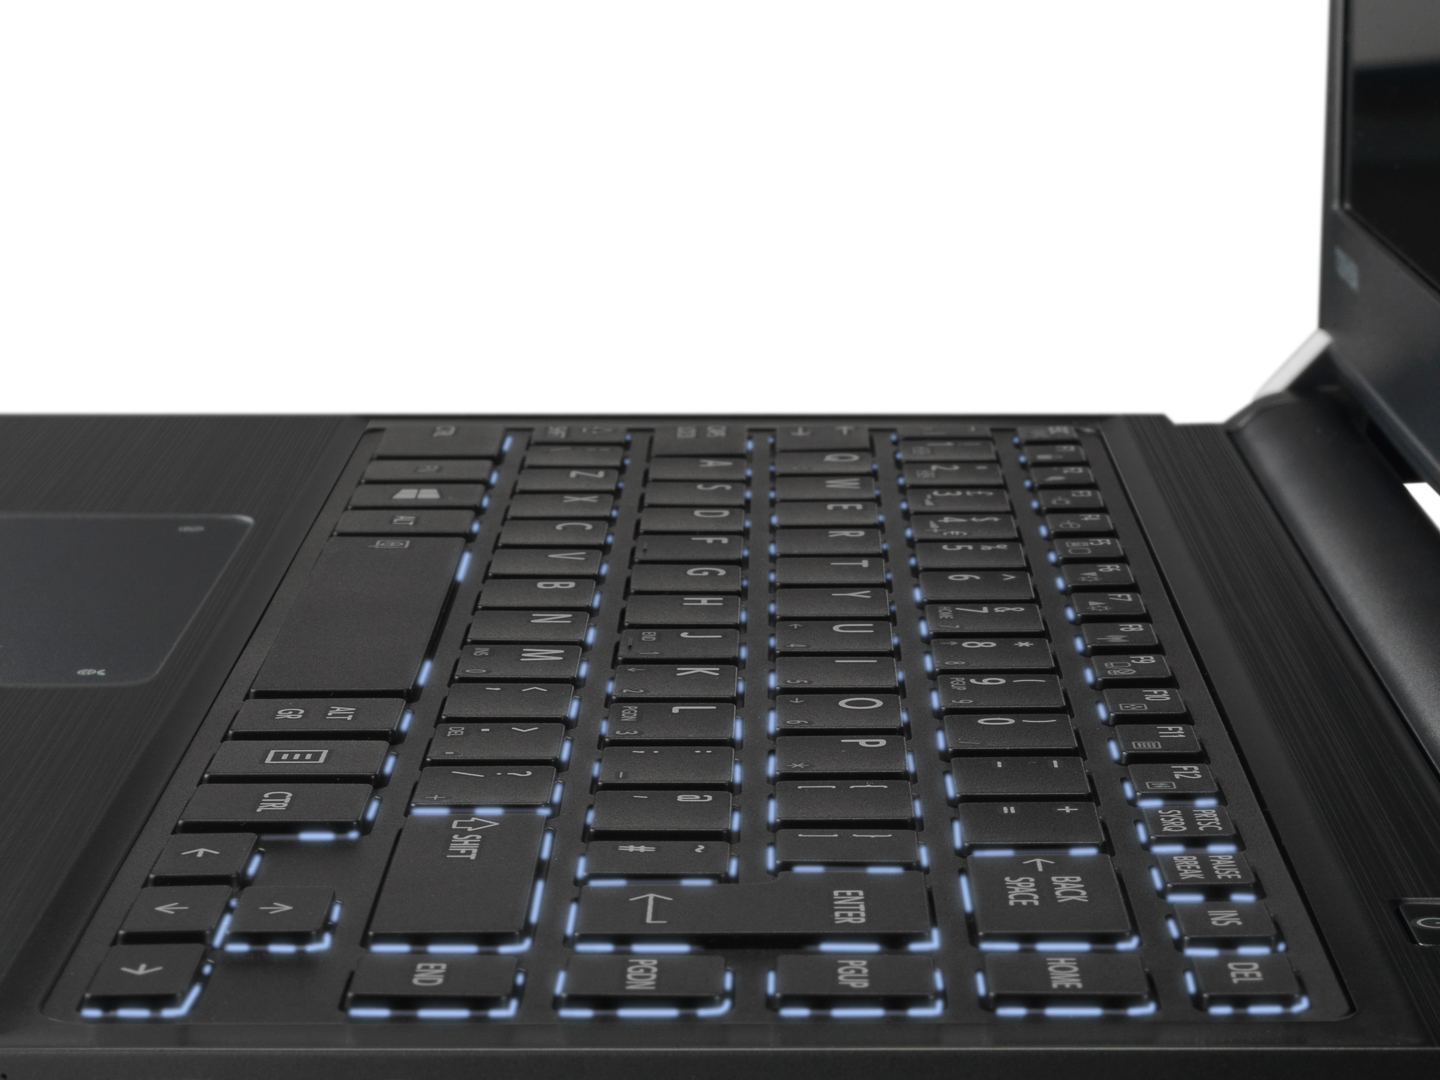
O Toshiba Portégé A30-D-139 nos deixa com alguns sentimentos mistos, apesar da classificação final boa a muito boa. Isto deve-se principalmente aos problemas com o touchpad e o som inaceitável da nossa unidade de teste, além do SSD lento.
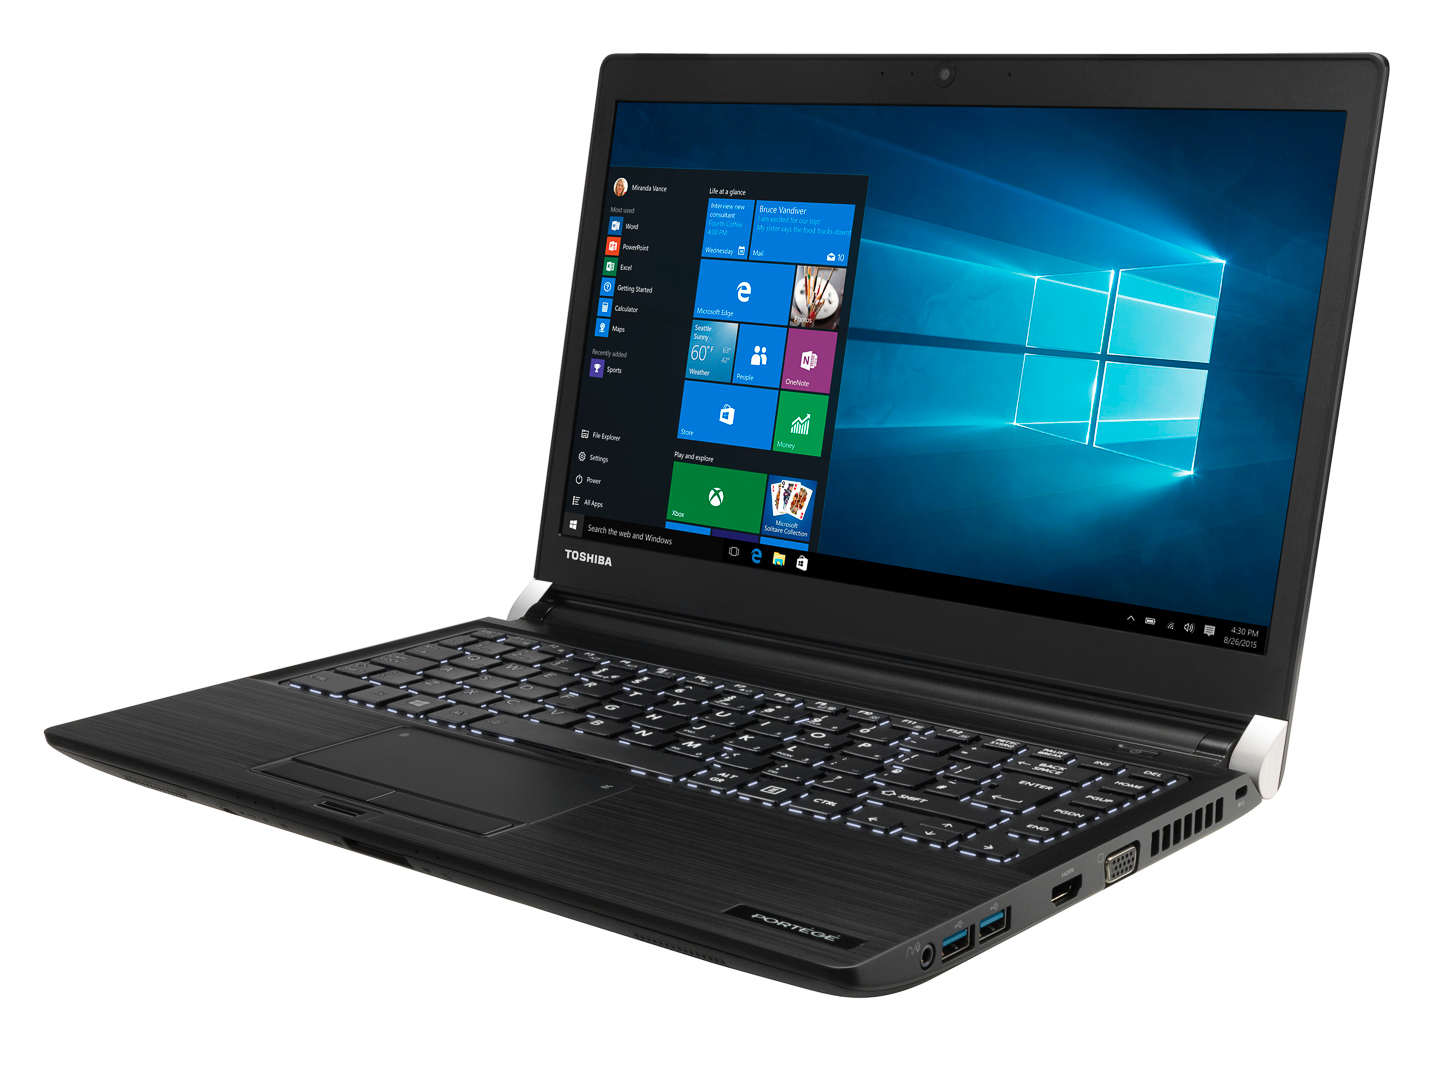
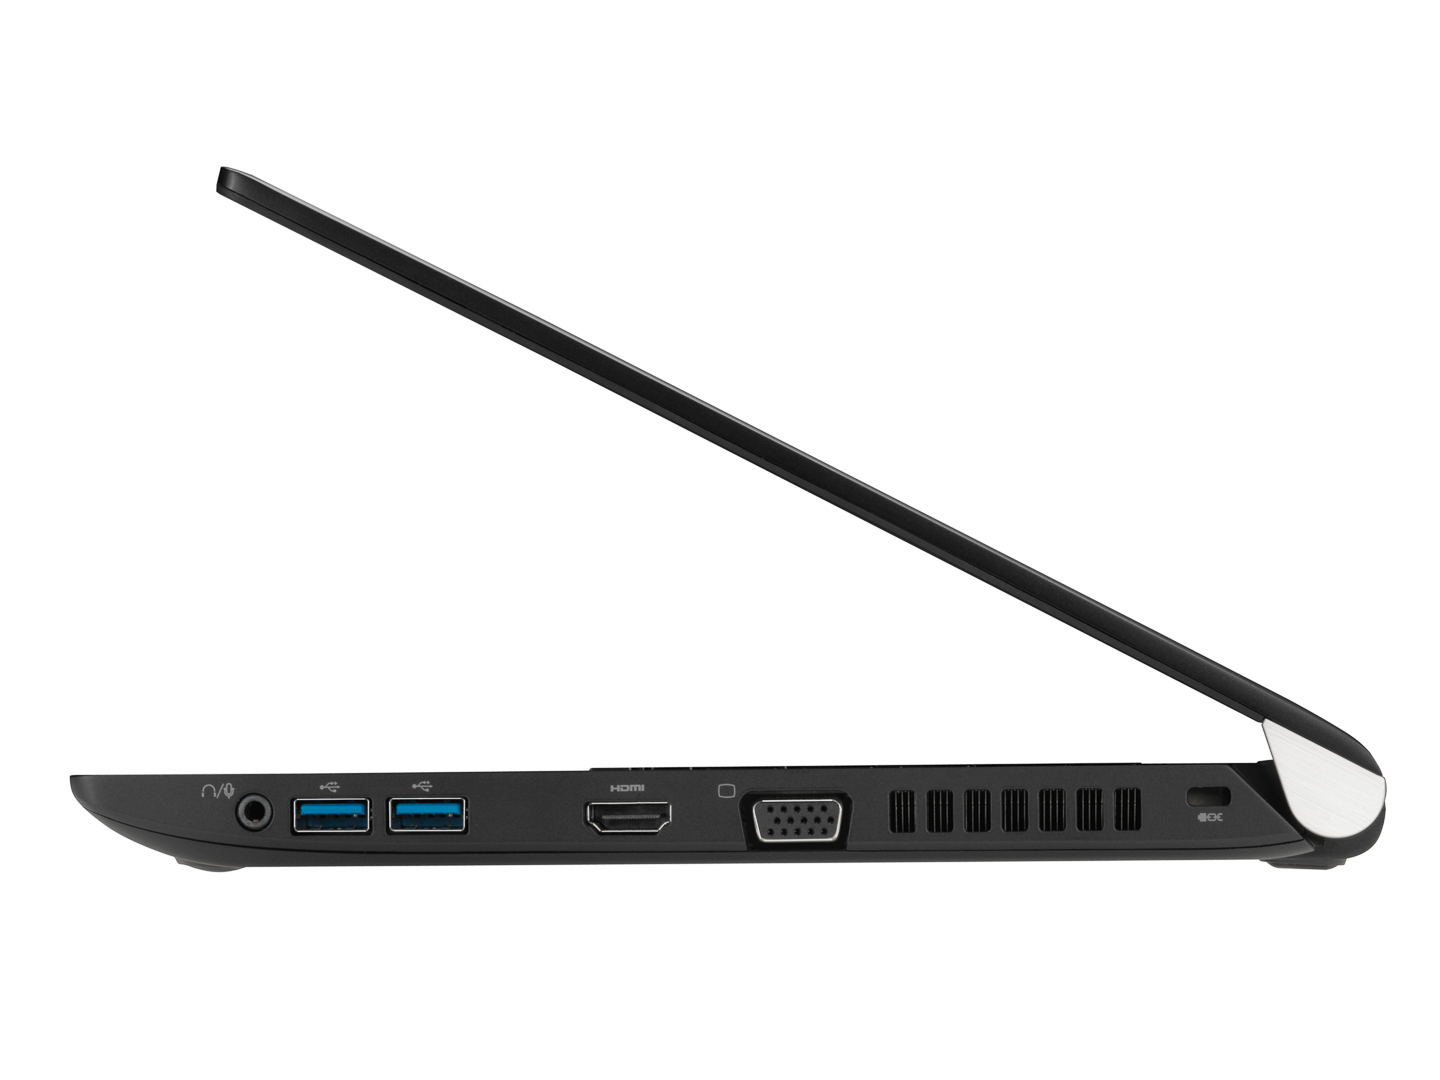
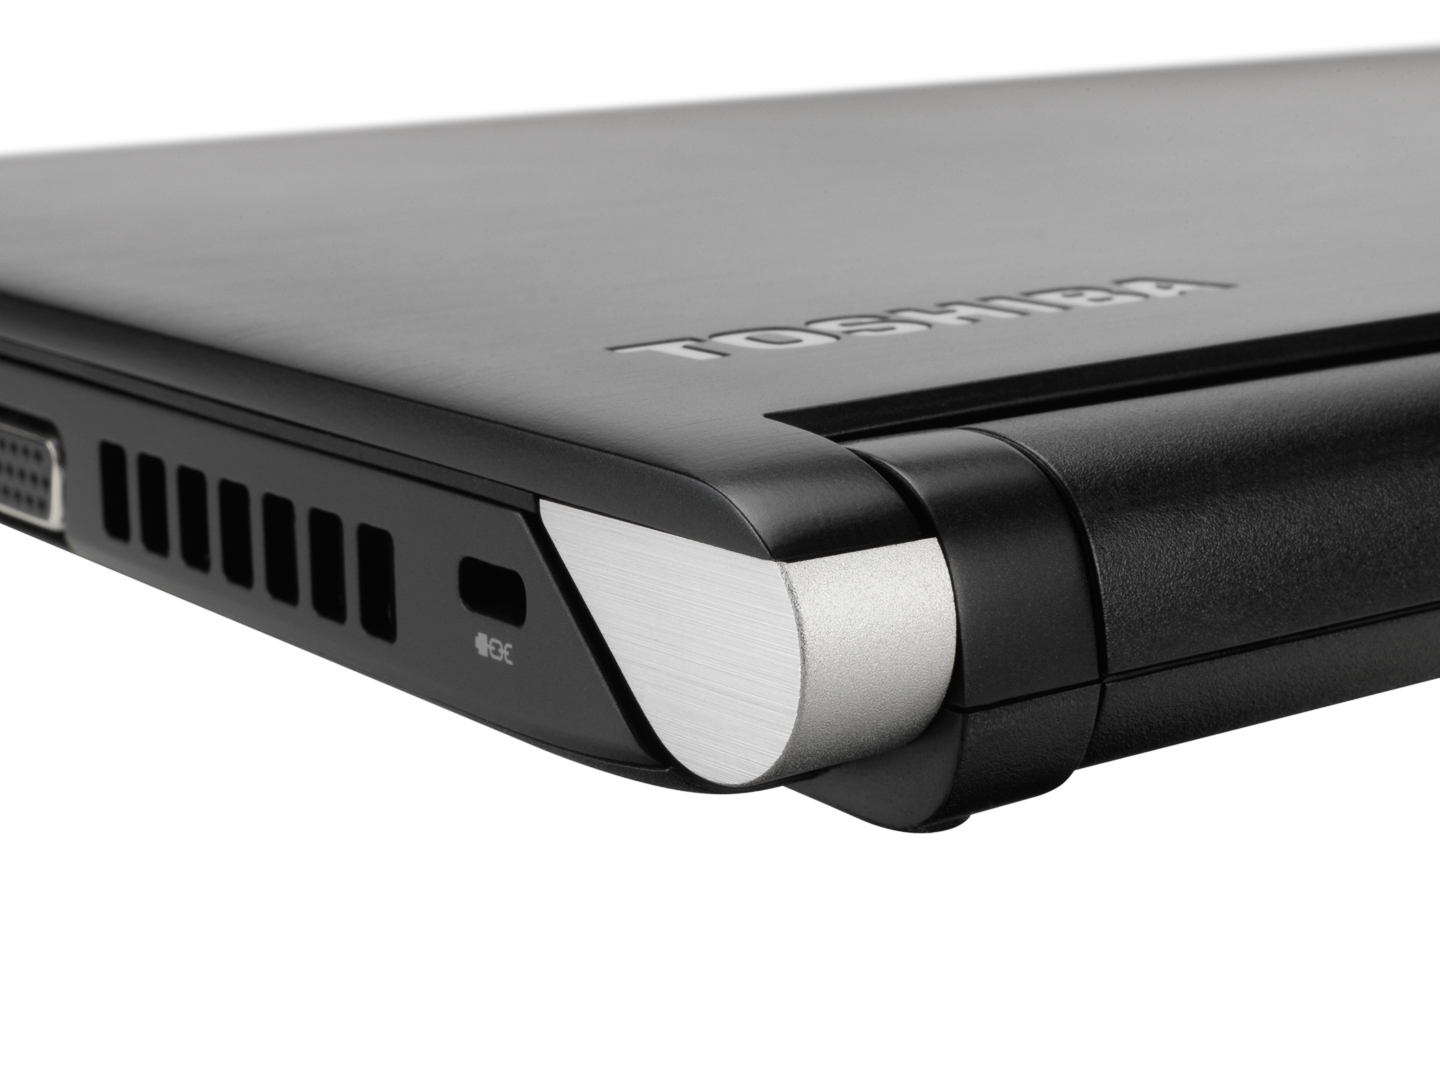
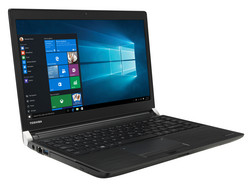
Tudo o que é necessário é presente para o grupo-alvo de usuários de escritório móveis e navegantes. Ao contrário dos rivais no teste, o Portégé vem com uma porta docking e, apenas, o visivelmente mais compacto Huawei MateBook X oferece recursos de segurança comparáveis. E de qualquer forma, a unidade de teste é relativamente grande e pesada em comparação com a concorrência. No entanto, o testador nunca notou isso de forma desfavorável. Não temos nenhuma queixa sobre a carcaça insensível e sólida, mas não perfeitamente construída.
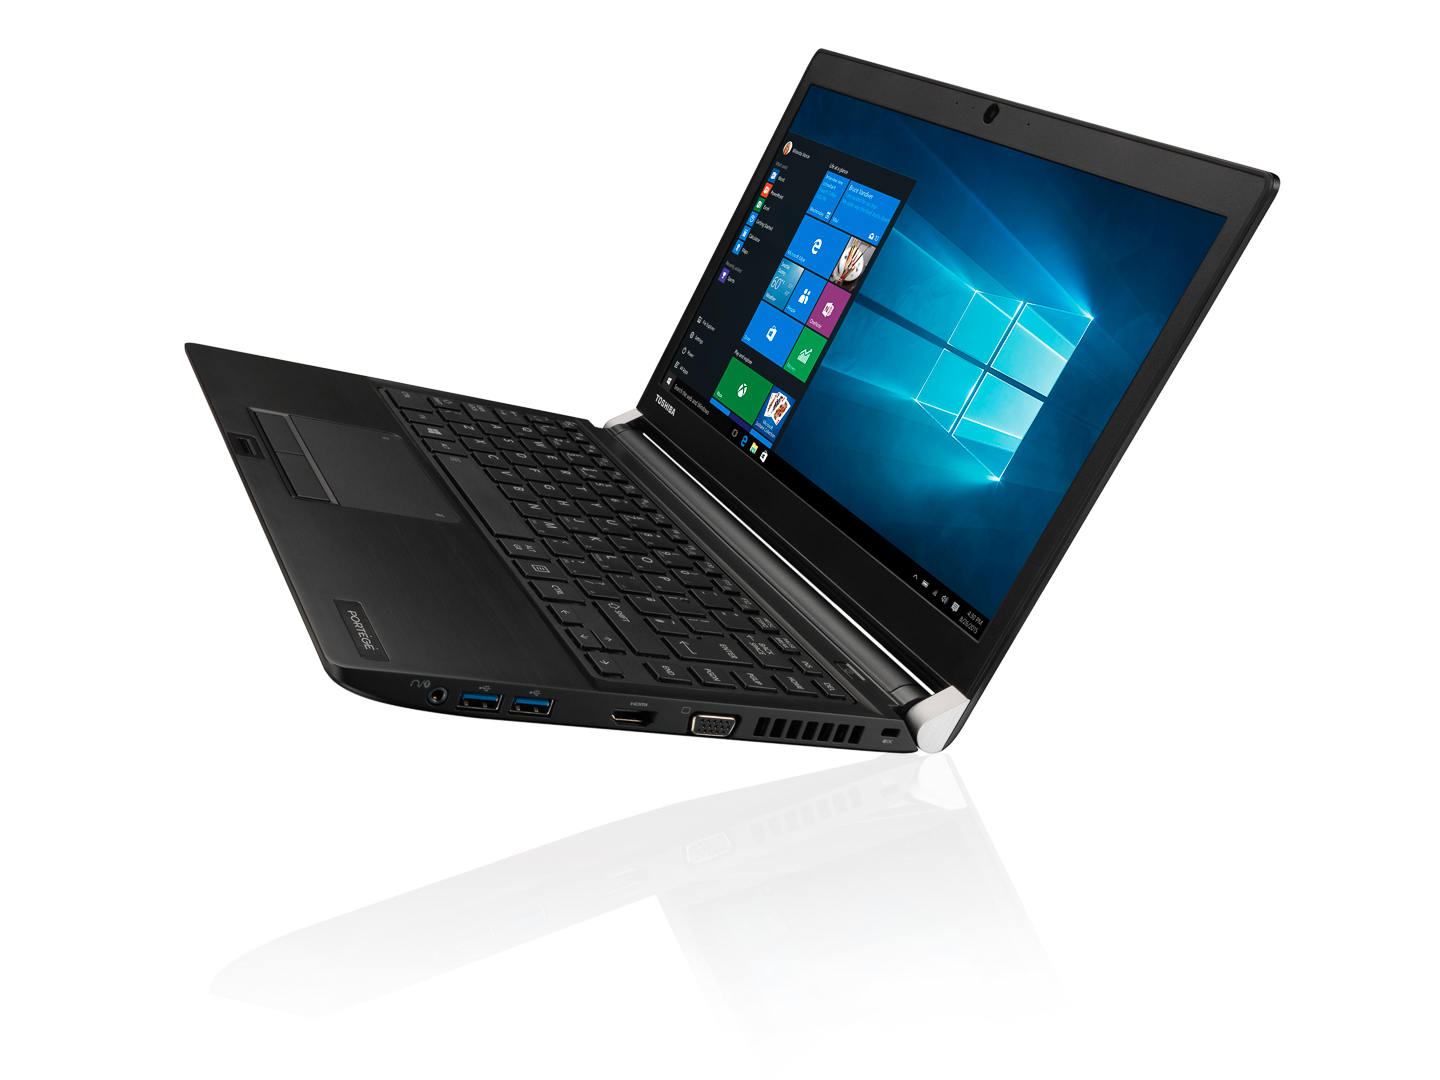
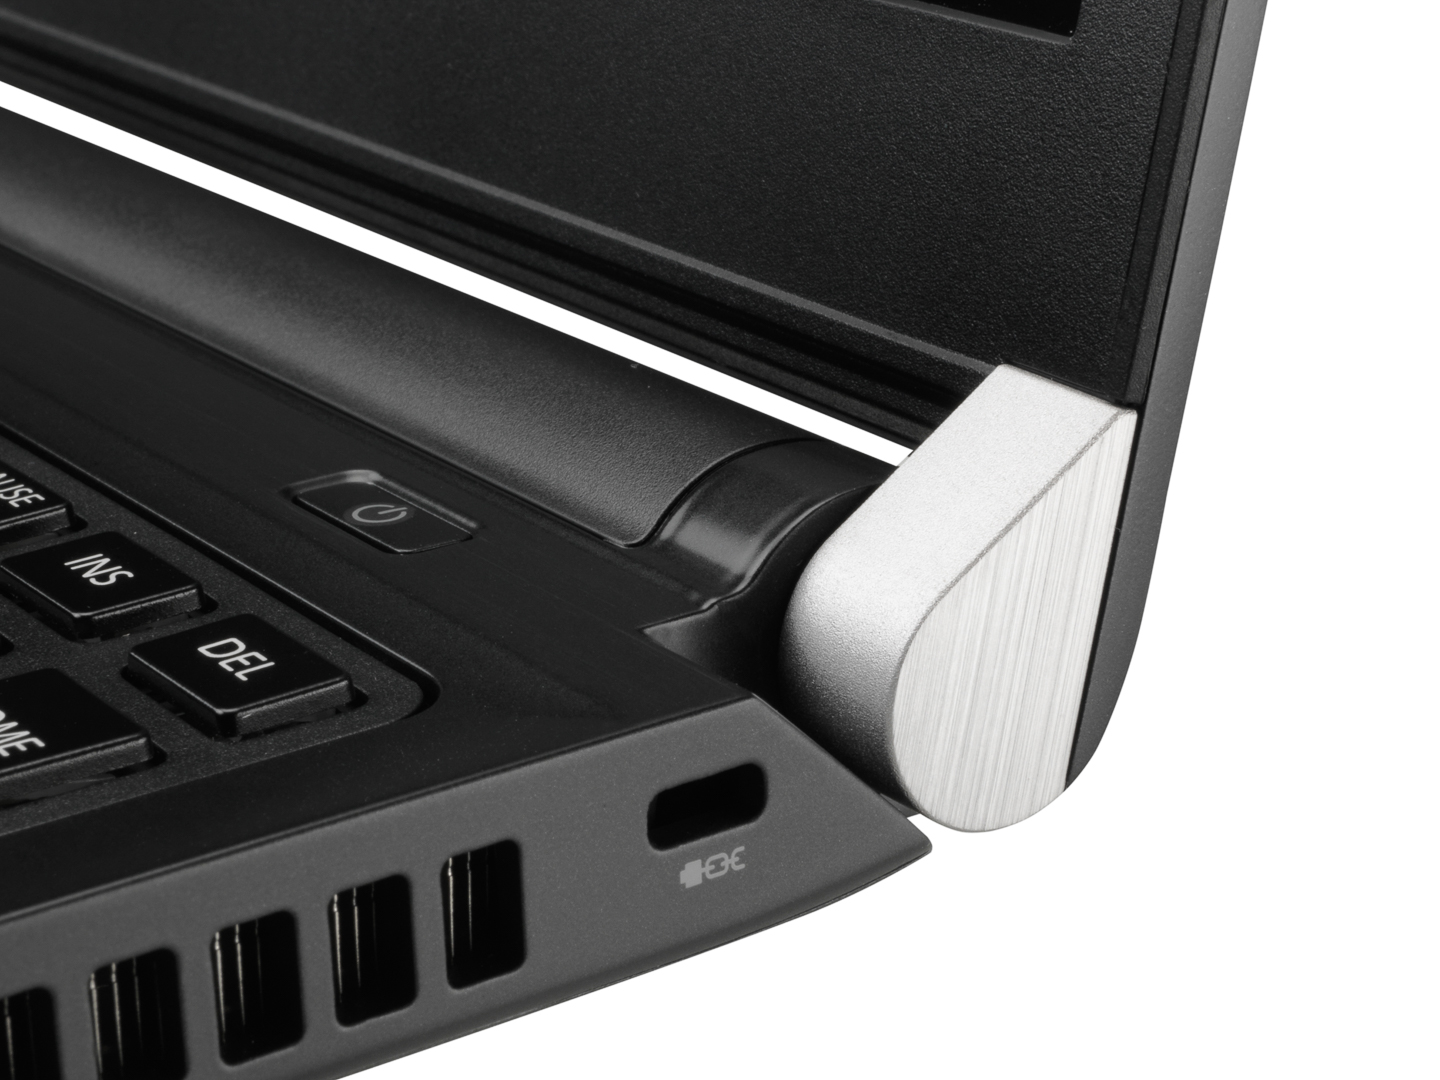
O dispositivo tem que ser elogiado por sua bateria de fácil substituição desde o exterior, a tela muito boa e, acima de tudo, o sistema geralmente absolutamente silencioso. O fato de que o fabricante não use um processador i5 no modelo testado e tenha optado por um i3-7100U ainda suficientemente rápido também o torna possível. Dificilmente poderia ser empurrado até seus limites, mesmo no teste de estresse.
Só podemos dar uma recomendação de compra condicional desta vez. O touchpad será usado com frequência? O peso e uma carcaça especialmente compacta/fina são importantes? O portátil será usado para ouvir música? Será que a porta TB3 e/ou uma DisplayPort é necessária? Todos aqueles que tenham respondido a maioria dessas perguntas com sim deveriam procurar outro portátil. Todos os outros deveriam poder se acomodar bem ao novo Portégé.
Toshiba Portege A30-D-139
- 09/12/2017 v6 (old)
Sven Kloevekorn