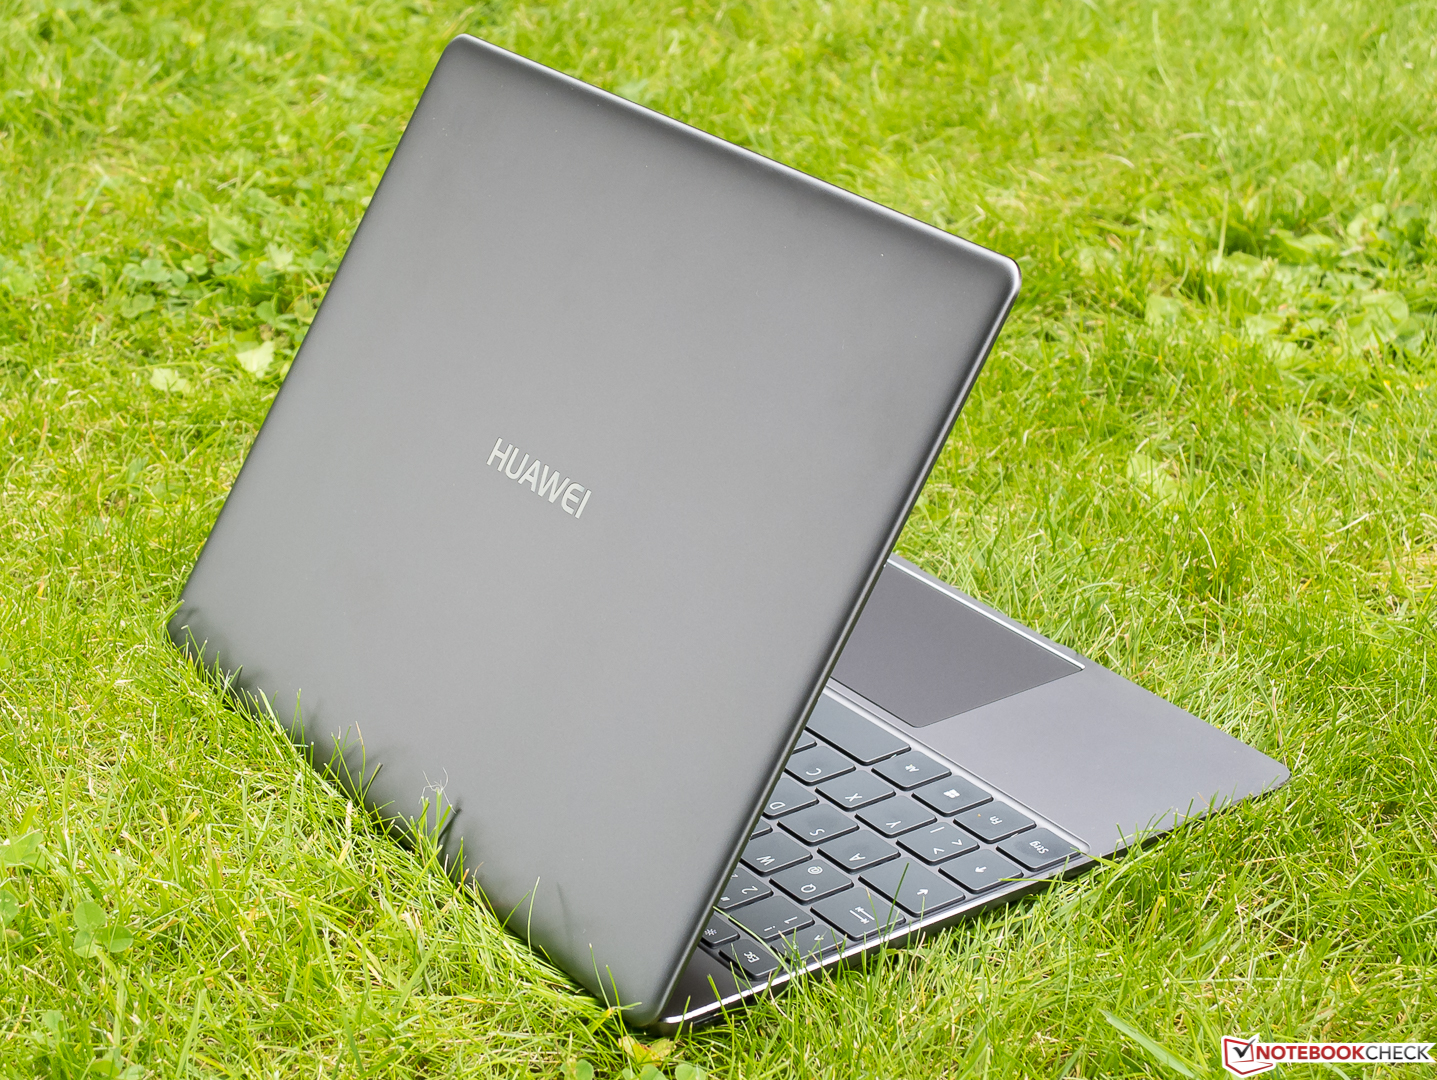
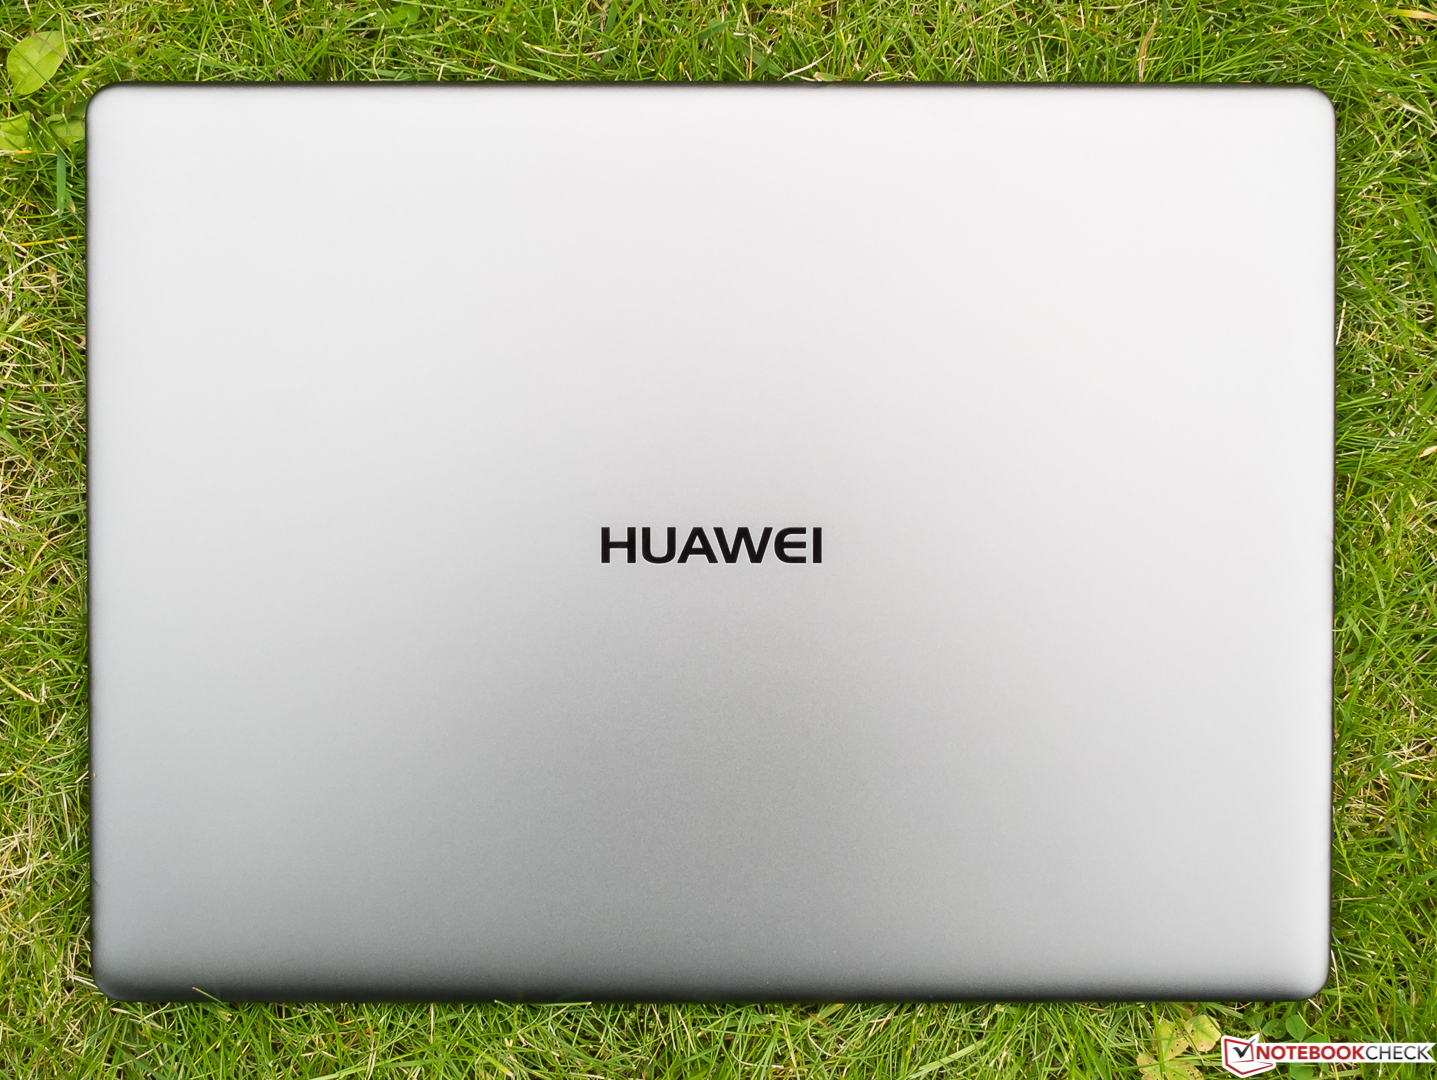
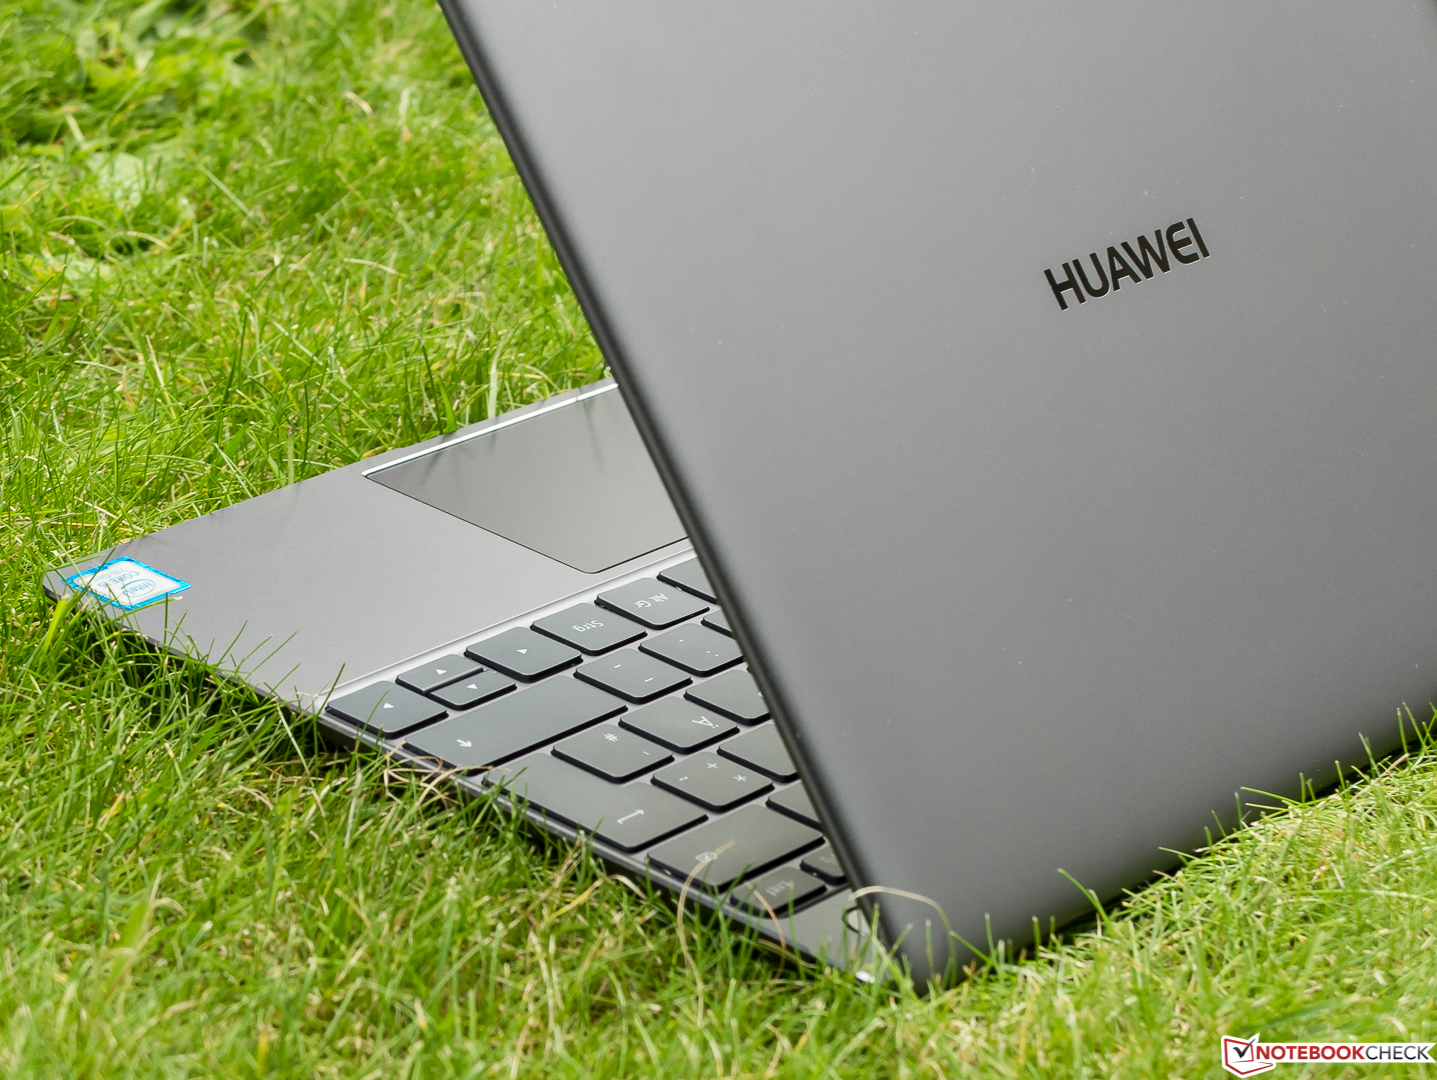
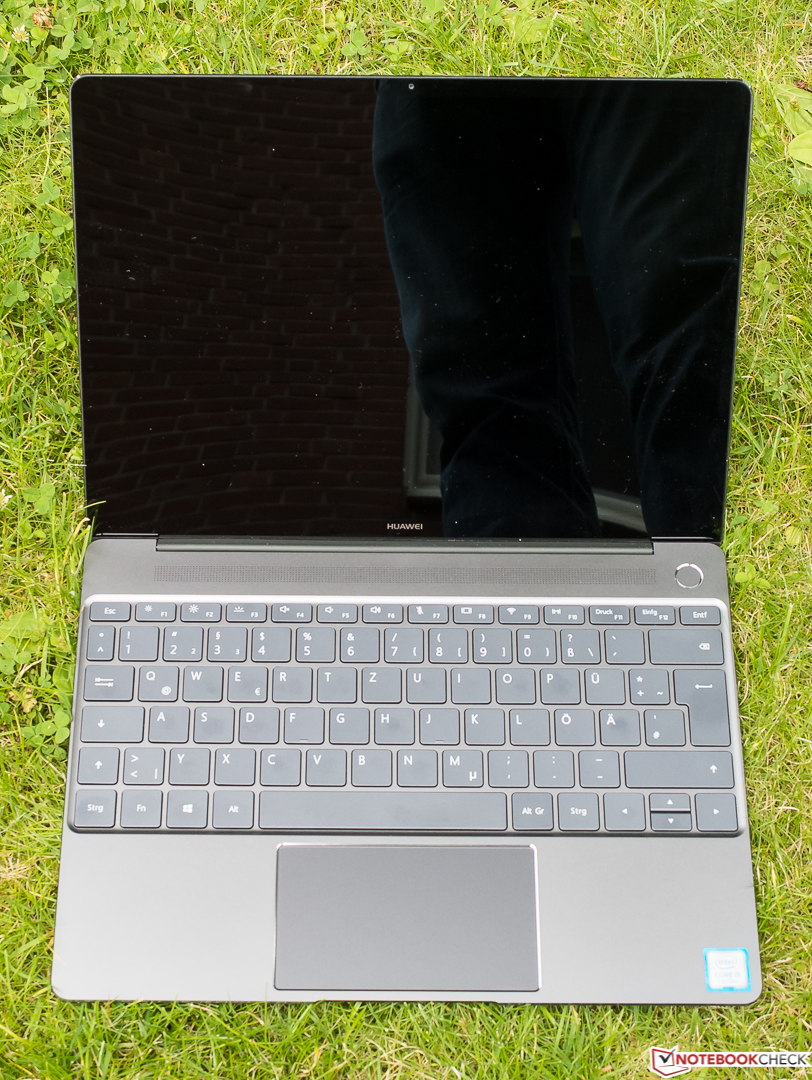
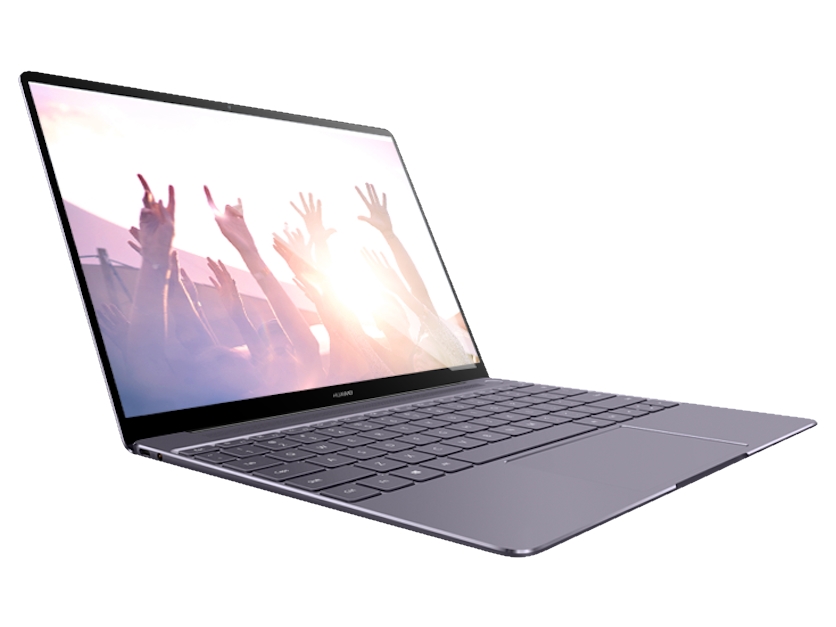
Breve Análise do Subportátil Huawei MateBook X (i5-7200U, 256 GB)


| Networking | |
| iperf3 transmit AX12 | |
| Huawei MateBook X | |
| Microsoft Surface Pro (2017) i5 | |
| Lenovo IdeaPad 710S Plus-13IKB | |
| Dell XPS 13 9360 FHD i5 | |
| iperf3 receive AX12 | |
| Lenovo IdeaPad 710S Plus-13IKB | |
| Microsoft Surface Pro (2017) i5 | |
| Dell XPS 13 9360 FHD i5 | |
| Huawei MateBook X | |
| |||||||||||||||||||||||||
iluminação: 88 %
iluminação com acumulador: 408 cd/m²
Contraste: 907:1 (Preto: 0.45 cd/m²)
ΔE ColorChecker Calman: 1.55 | ∀{0.5-29.43 Ø4.71}
ΔE Greyscale Calman: 1.91 | ∀{0.09-98 Ø4.96}
96% sRGB (Argyll 1.6.3 3D)
61% AdobeRGB 1998 (Argyll 1.6.3 3D)
66.8% AdobeRGB 1998 (Argyll 3D)
96.2% sRGB (Argyll 3D)
65.8% Display P3 (Argyll 3D)
Gamma: 2.34
CCT: 6491 K
| Huawei MateBook X Chi Mei CMN8201 / P130ZDZ-EF1, , 2160x1440, 13.3" | HP EliteBook 1030 G1-X2F03EA Sharp SHP1465, , 3200x1800, 13.3" | Dell XPS 13 9360 FHD i5 Sharp SHP1449 LQ133M1, , 1920x1080, 13.3" | Lenovo IdeaPad 710S Plus-13IKB LG Philips LP133WF4-SPB1 (LGD04EF), , 1920x1080, 13.3" | Microsoft Surface Pro (2017) i5 LG Display LP123WQ112604, , 2736x1824, 12.3" | |
|---|---|---|---|---|---|
| Display | 1% | -25% | -8% | 3% | |
| Display P3 Coverage (%) | 65.8 | 67.6 3% | 48.94 -26% | 65.3 -1% | 67.6 3% |
| sRGB Coverage (%) | 96.2 | 94.7 -2% | 73.3 -24% | 82.9 -14% | 99 3% |
| AdobeRGB 1998 Coverage (%) | 66.8 | 69 3% | 50.5 -24% | 60.6 -9% | 69.1 3% |
| Response Times | -18% | -19% | -29% | -24% | |
| Response Time Grey 50% / Grey 80% * (ms) | 33 ? | 42.4 ? -28% | 32.8 ? 1% | 45 ? -36% | 42 ? -27% |
| Response Time Black / White * (ms) | 24 ? | 25.6 ? -7% | 33.2 ? -38% | 29 ? -21% | 29 ? -21% |
| PWM Frequency (Hz) | 21000 | ||||
| Screen | -40% | -86% | -60% | -25% | |
| Brightness middle (cd/m²) | 408 | 401 -2% | 351.2 -14% | 343 -16% | 417 2% |
| Brightness (cd/m²) | 395 | 369 -7% | 325 -18% | 306 -23% | 401 2% |
| Brightness Distribution (%) | 88 | 85 -3% | 89 1% | 81 -8% | 88 0% |
| Black Level * (cd/m²) | 0.45 | 0.35 22% | 0.195 57% | 0.3 33% | 0.29 36% |
| Contrast (:1) | 907 | 1146 26% | 1801 99% | 1143 26% | 1438 59% |
| Colorchecker dE 2000 * | 1.55 | 3.5 -126% | 7.4 -377% | 4.73 -205% | 3.63 -134% |
| Colorchecker dE 2000 max. * | 2.19 | 6.33 -189% | 9.08 -315% | 9.05 -313% | 6.74 -208% |
| Greyscale dE 2000 * | 1.91 | 4.13 -116% | 6.71 -251% | 3.29 -72% | 2.18 -14% |
| Gamma | 2.34 94% | 2.28 96% | 2.74 80% | 2.36 93% | 3.09 71% |
| CCT | 6491 100% | 6508 100% | 7222 90% | 6437 101% | 6767 96% |
| Color Space (Percent of AdobeRGB 1998) (%) | 61 | 61.56 1% | 50.48 -17% | 54 -11% | 63 3% |
| Color Space (Percent of sRGB) (%) | 96 | 94.64 -1% | 73.31 -24% | 83 -14% | 99 3% |
| Média Total (Programa/Configurações) | -19% /
-28% | -43% /
-65% | -32% /
-46% | -15% /
-19% |
* ... menor é melhor
Exibir tempos de resposta
| ↔ Tempo de resposta preto para branco | ||
|---|---|---|
| 24 ms ... ascensão ↗ e queda ↘ combinadas | ↗ 12 ms ascensão | 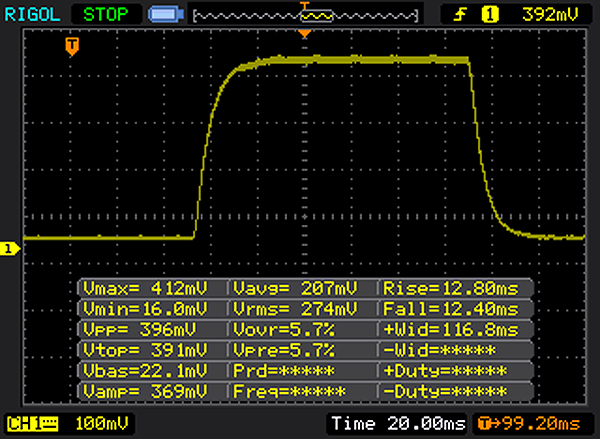 |
| ↘ 12 ms queda | ||
| A tela mostra boas taxas de resposta em nossos testes, mas pode ser muito lenta para jogadores competitivos. Em comparação, todos os dispositivos testados variam de 0.1 (mínimo) a 240 (máximo) ms. » 54 % de todos os dispositivos são melhores. Isso significa que o tempo de resposta medido é pior que a média de todos os dispositivos testados (19.8 ms). | ||
| ↔ Tempo de resposta 50% cinza a 80% cinza | ||
| 33 ms ... ascensão ↗ e queda ↘ combinadas | ↗ 15 ms ascensão | 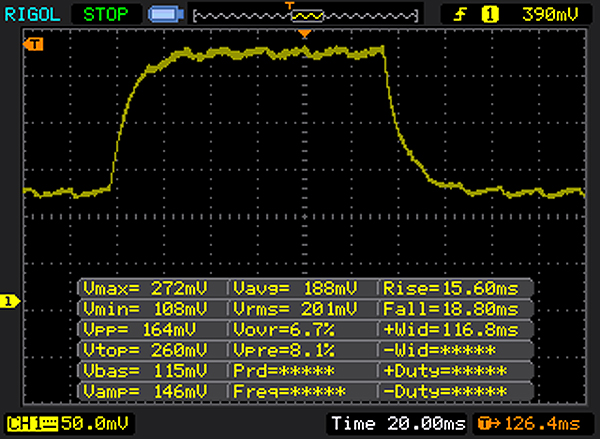 |
| ↘ 18 ms queda | ||
| A tela mostra taxas de resposta lentas em nossos testes e será insatisfatória para os jogadores. Em comparação, todos os dispositivos testados variam de 0.165 (mínimo) a 636 (máximo) ms. » 45 % de todos os dispositivos são melhores. Isso significa que o tempo de resposta medido é semelhante à média de todos os dispositivos testados (31 ms). | ||
Cintilação da tela / PWM (modulação por largura de pulso)
| Tela tremeluzindo / PWM não detectado | ||
[pwm_comparison] Em comparação: 52 % de todos os dispositivos testados não usam PWM para escurecer a tela. Se PWM foi detectado, uma média de 7754 (mínimo: 5 - máximo: 343500) Hz foi medida. | ||
| PCMark 8 Home Score Accelerated v2 | 3507 pontos | |
| PCMark 8 Work Score Accelerated v2 | 4276 pontos | |
Ajuda | ||
| Huawei MateBook X LITEON CB1-SD256 | HP EliteBook 1030 G1-X2F03EA Sandisk X300 SD7SN6S-512G-1006 | Dell XPS 13 9360 FHD i5 Toshiba NVMe THNSN5256GPUK | Lenovo IdeaPad 710S Plus-13IKB Samsung PM961 NVMe MZVLW512HMJP | Microsoft Surface Pro (2017) i5 Samsung PM971 KUS030202M | |
|---|---|---|---|---|---|
| CrystalDiskMark 3.0 | -21% | 41% | 117% | 30% | |
| Read Seq (MB/s) | 741 | 387.5 -48% | 1233 66% | 1577 113% | 723 -2% |
| Write Seq (MB/s) | 461.2 | 348.7 -24% | 733 59% | 1472 219% | 853 85% |
| Read 512 (MB/s) | 504 | 239.9 -52% | 1036 106% | 1165 131% | 225 -55% |
| Write 512 (MB/s) | 310.3 | 335.3 8% | 439.9 42% | 1244 301% | 445 43% |
| Read 4k (MB/s) | 29.48 | 30.34 3% | 29.31 -1% | 54.8 86% | 46 56% |
| Write 4k (MB/s) | 68.1 | 75.9 11% | 116.9 72% | 121.5 78% | 125 84% |
| Read 4k QD32 (MB/s) | 498.9 | 311.3 -38% | 479.2 -4% | 407.5 -18% | 423 -15% |
| Write 4k QD32 (MB/s) | 257.5 | 192.8 -25% | 218.3 -15% | 321.4 25% | 373 45% |

| 3DMark 11 - 1280x720 Performance GPU | |
| Lenovo IdeaPad 710S Plus-13IKB | |
| Dell XPS 13 9360 FHD i5 | |
| Huawei MateBook X | |
| HP EliteBook 1030 G1-X2F03EA | |
| 3DMark | |
| 1280x720 Cloud Gate Standard Graphics | |
| Lenovo IdeaPad 710S Plus-13IKB | |
| Dell XPS 13 9360 FHD i5 | |
| Huawei MateBook X | |
| Microsoft Surface Pro (2017) i5 | |
| HP EliteBook 1030 G1-X2F03EA | |
| 1920x1080 Fire Strike Graphics | |
| Lenovo IdeaPad 710S Plus-13IKB | |
| Dell XPS 13 9360 FHD i5 | |
| HP EliteBook 1030 G1-X2F03EA | |
| Microsoft Surface Pro (2017) i5 | |
| Huawei MateBook X | |
| 3DMark 11 Performance | 1667 pontos | |
| 3DMark Ice Storm Standard Score | 54224 pontos | |
| 3DMark Cloud Gate Standard Score | 5691 pontos | |
| 3DMark Fire Strike Score | 785 pontos | |
Ajuda | ||
| baixo | média | alto | ultra | |
|---|---|---|---|---|
| Battlefield 1 (2016) | 11.7 | |||
| Farming Simulator 17 (2016) | 61.2 | 40.8 | 14 | |
| For Honor (2017) | 20.2 |
(±) A temperatura máxima no lado superior é 40.4 °C / 105 F, em comparação com a média de 35.9 °C / 97 F , variando de 21.4 a 59 °C para a classe Subnotebook.
(±) A parte inferior aquece até um máximo de 41.2 °C / 106 F, em comparação com a média de 39.2 °C / 103 F
(+) Em uso inativo, a temperatura média para o lado superior é 25.3 °C / 78 F, em comparação com a média do dispositivo de 30.8 °C / ### class_avg_f### F.
(+) Os apoios para as mãos e o touchpad estão atingindo a temperatura máxima da pele (32.8 °C / 91 F) e, portanto, não estão quentes.
(-) A temperatura média da área do apoio para as mãos de dispositivos semelhantes foi 28.2 °C / 82.8 F (-4.6 °C / -8.2 F).
Huawei MateBook X análise de áudio
(-) | alto-falantes não muito altos (###valor### dB)
Graves 100 - 315Hz
(±) | graves reduzidos - em média 8.3% menor que a mediana
(±) | a linearidade dos graves é média (7.6% delta para a frequência anterior)
Médios 400 - 2.000 Hz
(+) | médios equilibrados - apenas 3.3% longe da mediana
(+) | médios são lineares (6.2% delta para frequência anterior)
Altos 2 - 16 kHz
(+) | agudos equilibrados - apenas 2.6% longe da mediana
(+) | os máximos são lineares (6.6% delta da frequência anterior)
Geral 100 - 16.000 Hz
(+) | o som geral é linear (14.7% diferença em relação à mediana)
Comparado com a mesma classe
» 31% de todos os dispositivos testados nesta classe foram melhores, 5% semelhantes, 64% piores
» O melhor teve um delta de 5%, a média foi 18%, o pior foi 53%
Comparado com todos os dispositivos testados
» 19% de todos os dispositivos testados foram melhores, 4% semelhantes, 77% piores
» O melhor teve um delta de 4%, a média foi 23%, o pior foi 134%
HP EliteBook 1030 G1-X2F03EA análise de áudio
(+) | os alto-falantes podem tocar relativamente alto (###valor### dB)
Graves 100 - 315Hz
(-) | quase nenhum baixo - em média 22.7% menor que a mediana
(±) | a linearidade dos graves é média (11.2% delta para a frequência anterior)
Médios 400 - 2.000 Hz
(+) | médios equilibrados - apenas 4.1% longe da mediana
(±) | a linearidade dos médios é média (7.5% delta para frequência anterior)
Altos 2 - 16 kHz
(+) | agudos equilibrados - apenas 2.2% longe da mediana
(+) | os máximos são lineares (5.2% delta da frequência anterior)
Geral 100 - 16.000 Hz
(±) | a linearidade do som geral é média (19.8% diferença em relação à mediana)
Comparado com a mesma classe
» 63% de todos os dispositivos testados nesta classe foram melhores, 7% semelhantes, 31% piores
» O melhor teve um delta de 5%, a média foi 18%, o pior foi 53%
Comparado com todos os dispositivos testados
» 51% de todos os dispositivos testados foram melhores, 7% semelhantes, 42% piores
» O melhor teve um delta de 4%, a média foi 23%, o pior foi 134%
Dell XPS 13 9360 FHD i5 análise de áudio
(-) | alto-falantes não muito altos (###valor### dB)
Graves 100 - 315Hz
(±) | graves reduzidos - em média 6.9% menor que a mediana
(±) | a linearidade dos graves é média (10.5% delta para a frequência anterior)
Médios 400 - 2.000 Hz
(+) | médios equilibrados - apenas 3.7% longe da mediana
(+) | médios são lineares (4% delta para frequência anterior)
Altos 2 - 16 kHz
(+) | agudos equilibrados - apenas 2% longe da mediana
(±) | a linearidade dos máximos é média (10.3% delta para frequência anterior)
Geral 100 - 16.000 Hz
(±) | a linearidade do som geral é média (18.3% diferença em relação à mediana)
Comparado com a mesma classe
» 53% de todos os dispositivos testados nesta classe foram melhores, 7% semelhantes, 40% piores
» O melhor teve um delta de 5%, a média foi 18%, o pior foi 53%
Comparado com todos os dispositivos testados
» 40% de todos os dispositivos testados foram melhores, 8% semelhantes, 52% piores
» O melhor teve um delta de 4%, a média foi 23%, o pior foi 134%
Lenovo IdeaPad 710S Plus-13IKB análise de áudio
(±) | o volume do alto-falante é médio, mas bom (###valor### dB)
Graves 100 - 315Hz
(-) | quase nenhum baixo - em média 21.4% menor que a mediana
(±) | a linearidade dos graves é média (12.2% delta para a frequência anterior)
Médios 400 - 2.000 Hz
(±) | médios mais altos - em média 6.7% maior que a mediana
(±) | a linearidade dos médios é média (10.6% delta para frequência anterior)
Altos 2 - 16 kHz
(+) | agudos equilibrados - apenas 2.2% longe da mediana
(+) | os máximos são lineares (6.9% delta da frequência anterior)
Geral 100 - 16.000 Hz
(±) | a linearidade do som geral é média (24.4% diferença em relação à mediana)
Comparado com a mesma classe
» 82% de todos os dispositivos testados nesta classe foram melhores, 4% semelhantes, 13% piores
» O melhor teve um delta de 5%, a média foi 18%, o pior foi 53%
Comparado com todos os dispositivos testados
» 74% de todos os dispositivos testados foram melhores, 6% semelhantes, 20% piores
» O melhor teve um delta de 4%, a média foi 23%, o pior foi 134%
Microsoft Surface Pro (2017) i5 análise de áudio
(-) | alto-falantes não muito altos (###valor### dB)
Graves 100 - 315Hz
(±) | graves reduzidos - em média 9.7% menor que a mediana
(±) | a linearidade dos graves é média (7% delta para a frequência anterior)
Médios 400 - 2.000 Hz
(+) | médios equilibrados - apenas 4.6% longe da mediana
(+) | médios são lineares (6.3% delta para frequência anterior)
Altos 2 - 16 kHz
(+) | agudos equilibrados - apenas 2.1% longe da mediana
(+) | os máximos são lineares (5.2% delta da frequência anterior)
Geral 100 - 16.000 Hz
(±) | a linearidade do som geral é média (18.2% diferença em relação à mediana)
Comparado com a mesma classe
» 40% de todos os dispositivos testados nesta classe foram melhores, 7% semelhantes, 53% piores
» O melhor teve um delta de 6%, a média foi 20%, o pior foi 57%
Comparado com todos os dispositivos testados
» 39% de todos os dispositivos testados foram melhores, 8% semelhantes, 53% piores
» O melhor teve um delta de 4%, a média foi 23%, o pior foi 134%
| desligado | |
| Ocioso | |
| Carga |
|
Key:
min: | |
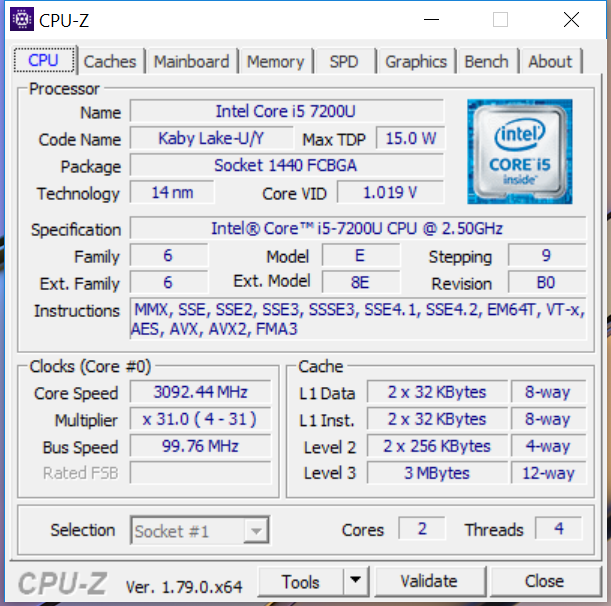
| Huawei MateBook X i5-7200U, HD Graphics 620, LITEON CB1-SD256, , 2160x1440, 13.3" | HP EliteBook 1030 G1-X2F03EA 6Y75, HD Graphics 515, Sandisk X300 SD7SN6S-512G-1006, IPS, 3200x1800, 13.3" | Dell XPS 13 9360 FHD i5 i5-7200U, HD Graphics 620, Toshiba NVMe THNSN5256GPUK, IPS, 1920x1080, 13.3" | Lenovo IdeaPad 710S Plus-13IKB i7-7500U, GeForce 940MX, Samsung PM961 NVMe MZVLW512HMJP, IPS, 1920x1080, 13.3" | Microsoft Surface Pro (2017) i5 i5-7300U, HD Graphics 620, Samsung PM971 KUS030202M, IPS, 2736x1824, 12.3" | |
|---|---|---|---|---|---|
| Power Consumption | 20% | 38% | 10% | 28% | |
| Idle Minimum * (Watt) | 4.6 | 4 13% | 4.1 11% | 3.6 22% | 3.6 22% |
| Idle Average * (Watt) | 11 | 8 27% | 4.2 62% | 7.4 33% | 8.1 26% |
| Idle Maximum * (Watt) | 12 | 8.6 28% | 5.1 57% | 8.7 27% | 8.7 27% |
| Load Average * (Watt) | 39.5 | 26.5 33% | 22.1 44% | 43 -9% | 25.5 35% |
| Load Maximum * (Watt) | 34.6 | 34.8 -1% | 29.4 15% | 42 -21% | 23.5 32% |
* ... menor é melhor
| Huawei MateBook X i5-7200U, HD Graphics 620, 40 Wh | HP EliteBook 1030 G1-X2F03EA 6Y75, HD Graphics 515, 40 Wh | Dell XPS 13 9360 FHD i5 i5-7200U, HD Graphics 620, 60 Wh | Lenovo IdeaPad 710S Plus-13IKB i7-7500U, GeForce 940MX, 46 Wh | Microsoft Surface Pro (2017) i5 i5-7300U, HD Graphics 620, 45 Wh | |
|---|---|---|---|---|---|
| Duração da bateria | 0% | 84% | -17% | 77% | |
| Reader / Idle (h) | 8.5 | 10.3 21% | 21.6 154% | 7.8 -8% | 17.6 107% |
| WiFi v1.3 (h) | 5.6 | 5.1 -9% | 11.3 102% | 5.6 0% | 12.4 121% |
| Load (h) | 2.7 | 2.4 -11% | 2.6 -4% | 1.5 -44% | 2.8 4% |
| H.264 (h) | 6.3 |
Pro
Contra
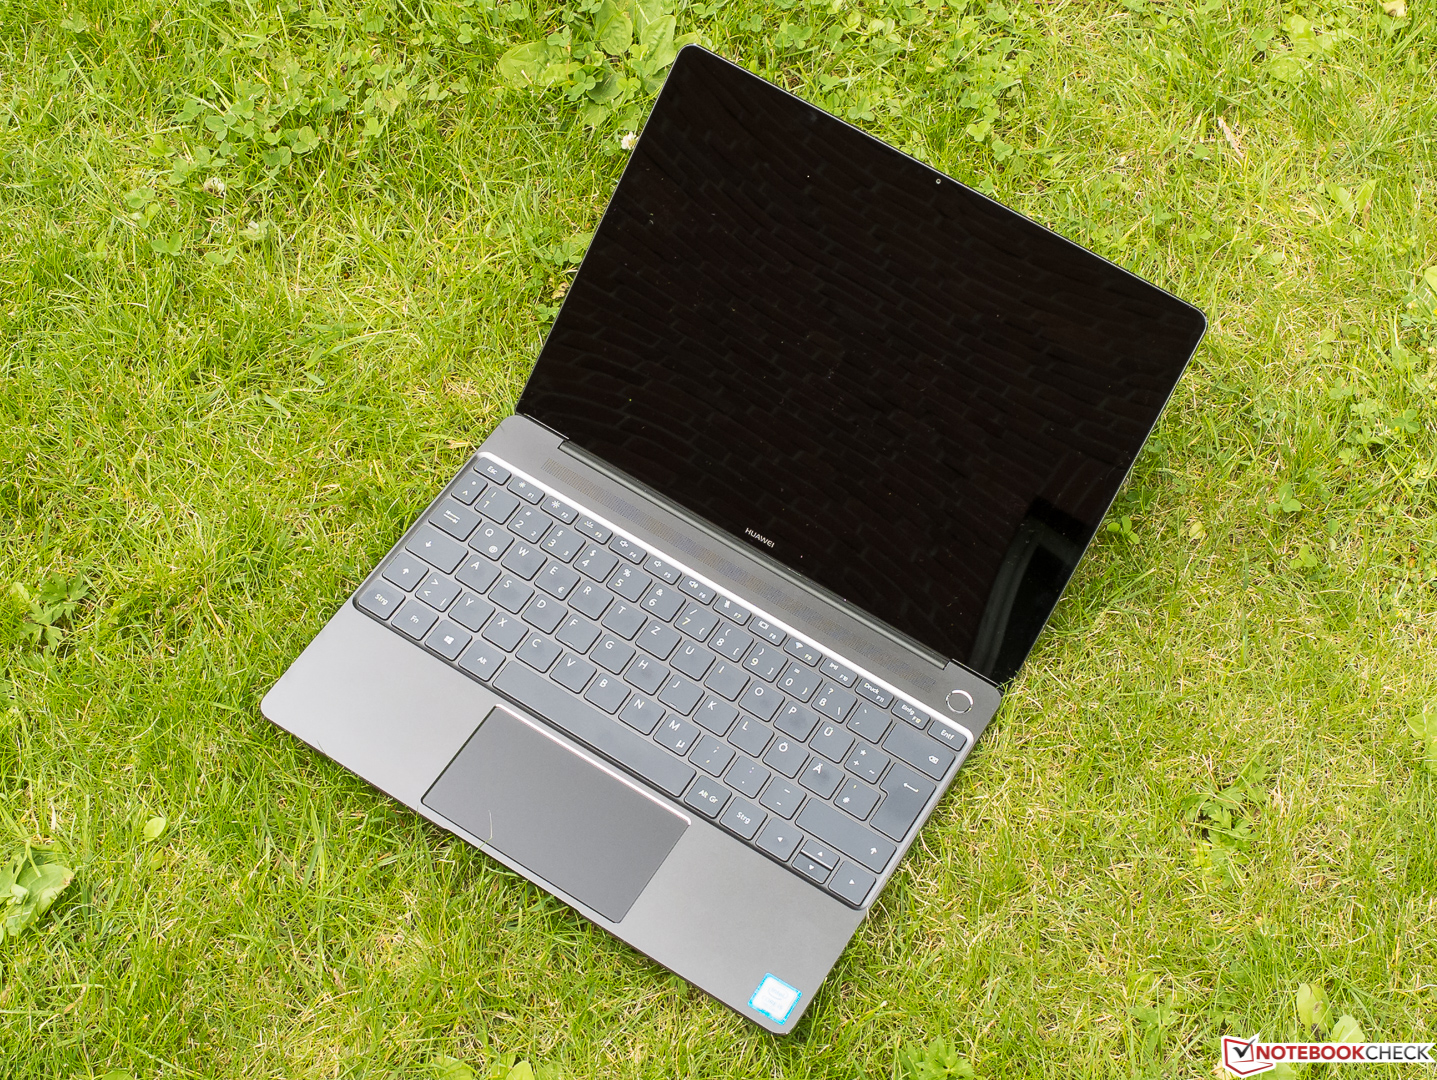
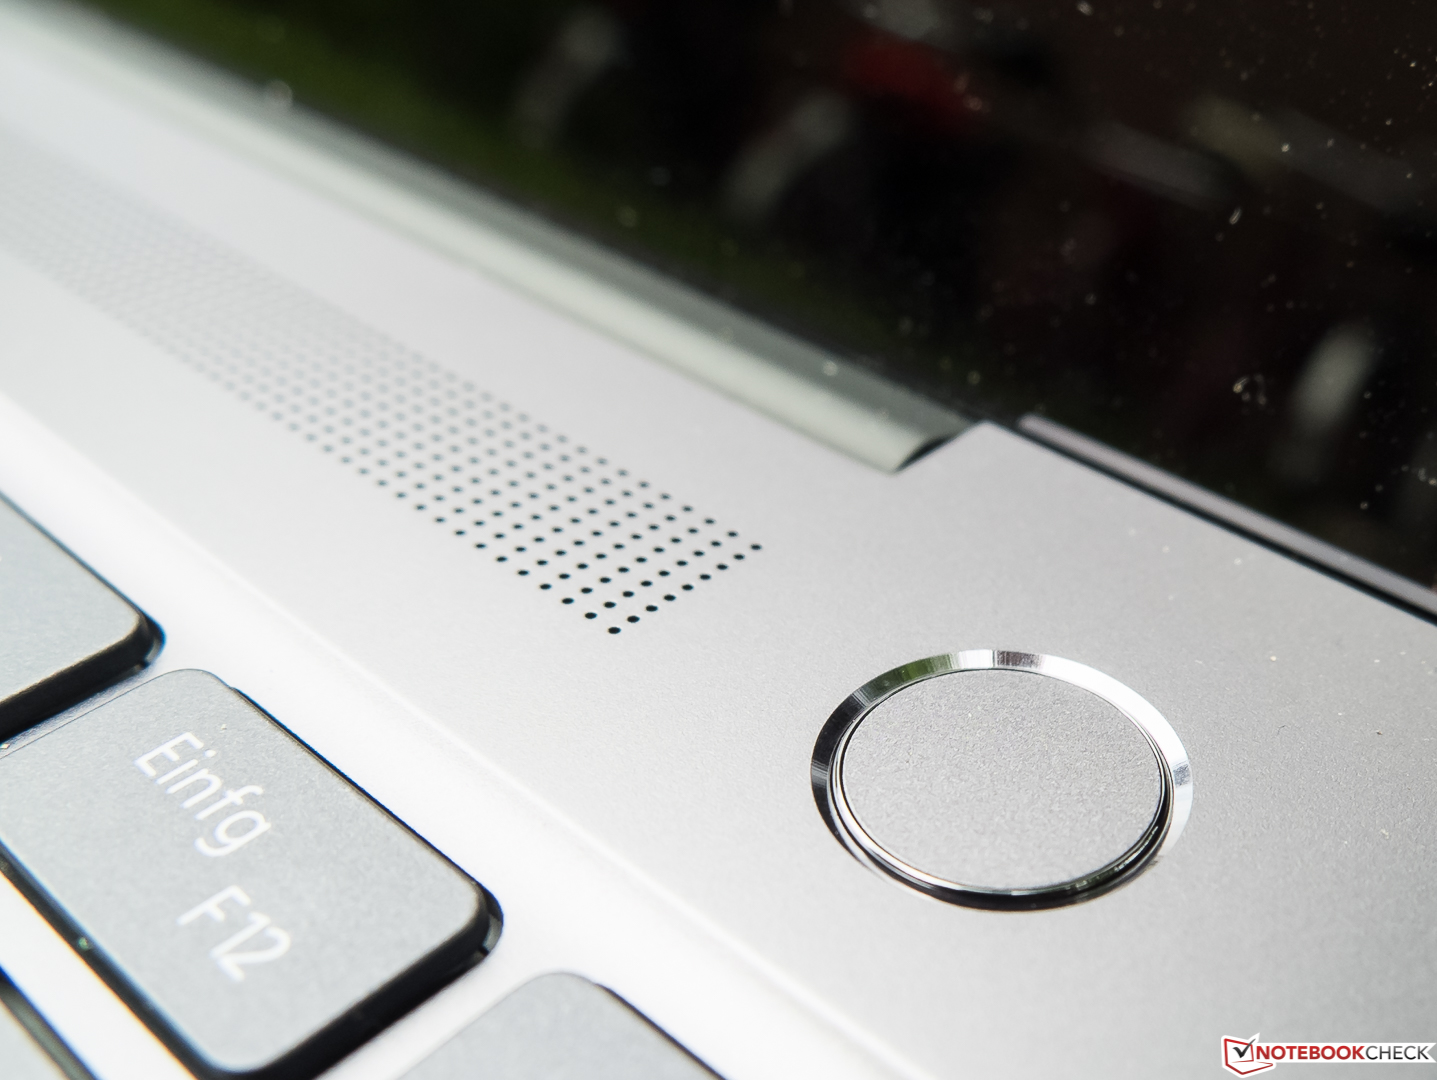
Em nossa opinião, a estreia da Huawei no mercado de portáteis foi um sucesso. O bem equipado MateBook X no formato emergente de 3: 2 é muito compacto, robusto, tem um visual bom e traz um novo e sistema de resfriamento passivo MEPCM, que é bom o suficiente para uma operação normal para permitir que seus componentes aproveitem suas reservas, mesmo que atinja seus limites durante usos intensos constantes. Os recursos de segurança disponíveis, como um sensor de digitais e TPM 2.0, sublinham seu aspecto móvel.
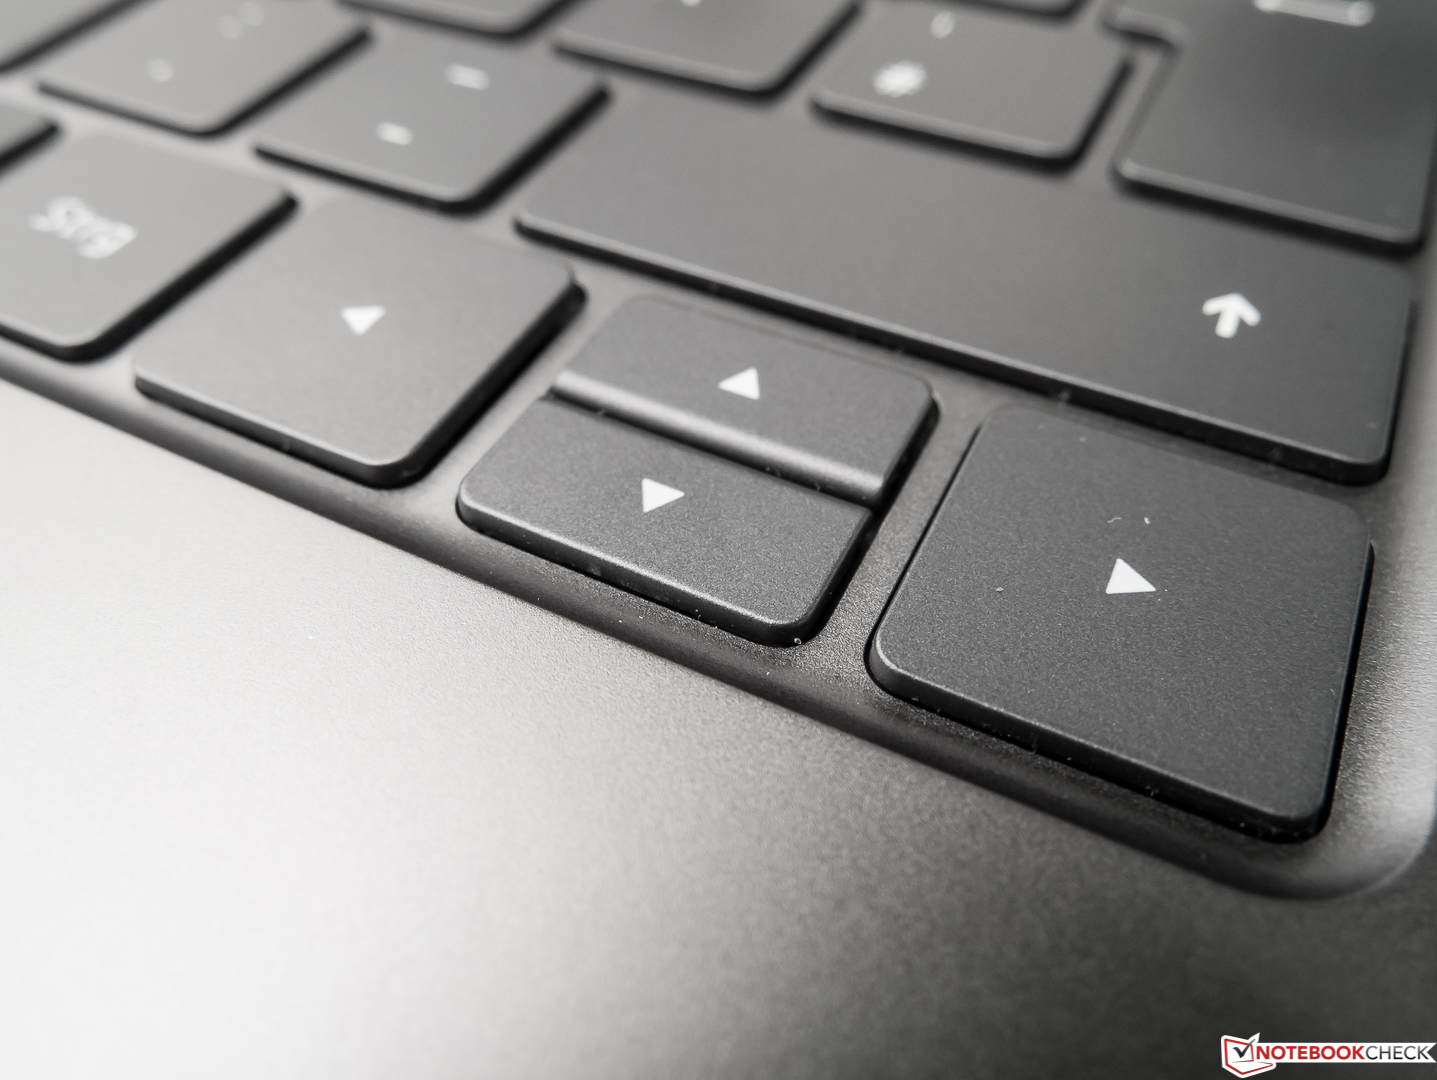
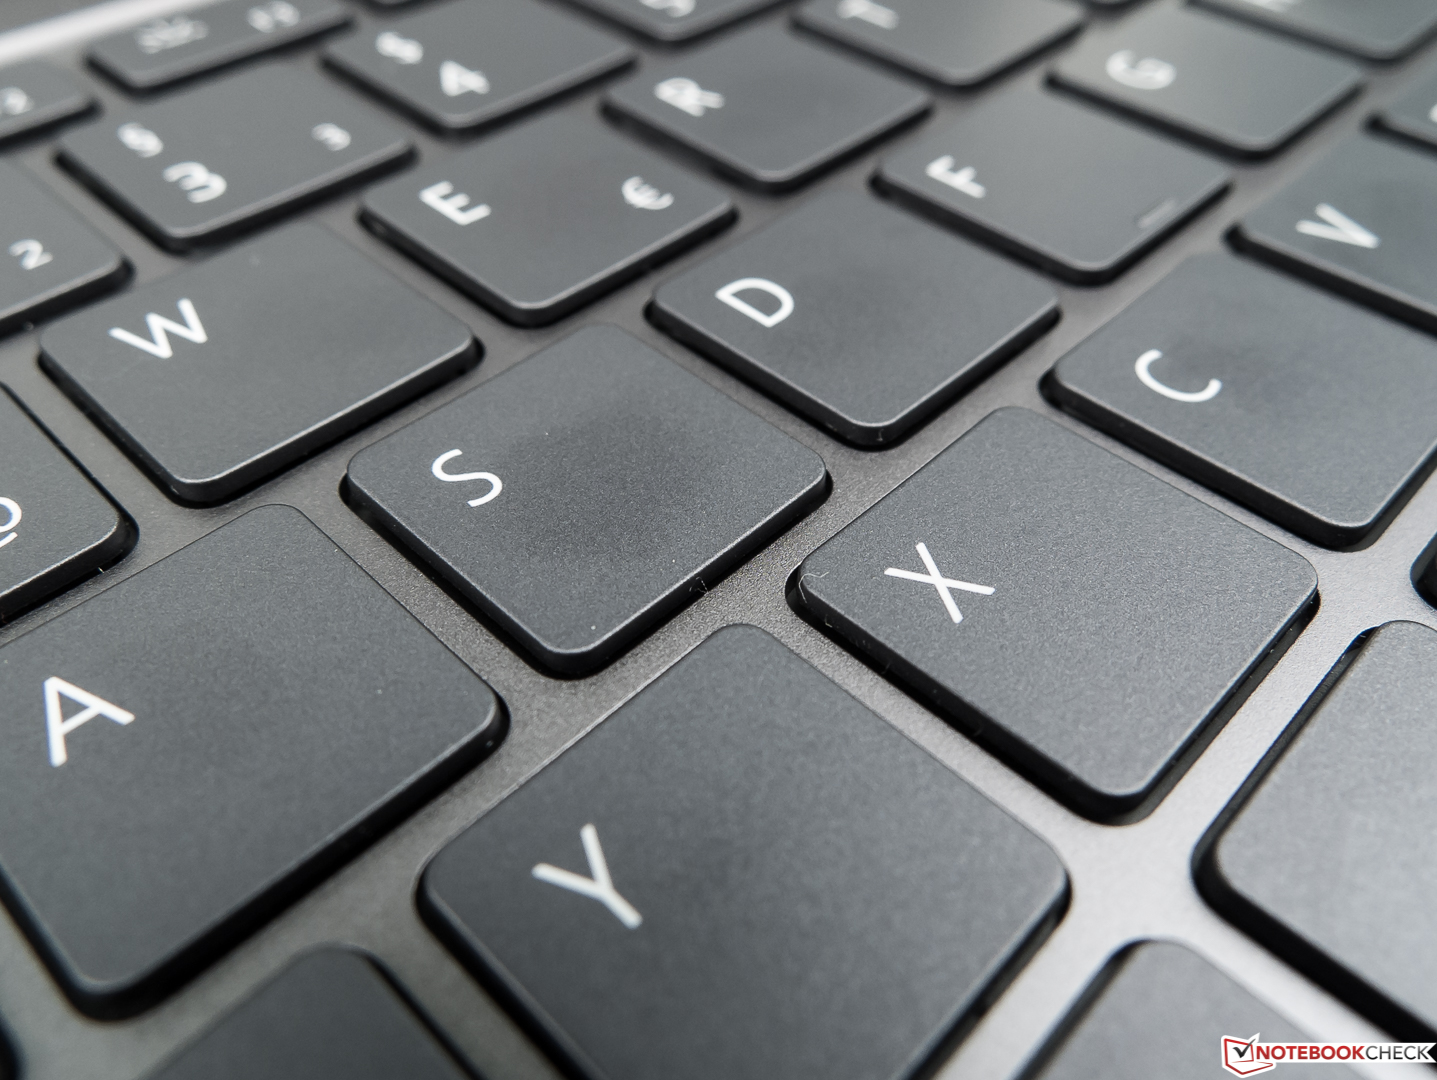
Você provavelmente pode se acostumar com o teclado com sua resposta que parece inferior para o testador. O consumo de energia muito alto e com isso, a decepcionante duração da bateria poderia ser corrigida com uma atualização do BIOS/UEFI. A Huawei definitivamente deveria melhorar isso. O assunto do touchpad permanecerá sob observação.
A pobreza das conexões no próprio aparelho, o que muitas vezes o obriga a usar o adaptador bem-sucedido incluído é uma questão diferente, dado que deve carregá-lo. No entanto, talvez não tenha sido possível implementar o conceito da carcaça de forma diferente. As únicas fraquezas da ótima tela são o seu valor preto ligeiramente alto e, claro, a superfície refletiva.
Se a Huawei pudesse cuidar do alto consumo de energia e com isso, baixa duração da bateria, o inovador MateBook X chegaria mais perto de uma classificação de 90%. Ele fala por si mesmo que apesar de tudo isso, atinge uma avaliação geral de 87%, o que ainda é excelente.
Huawei MateBook X
- 07/26/2017 v6 (old)
Sven Kloevekorn