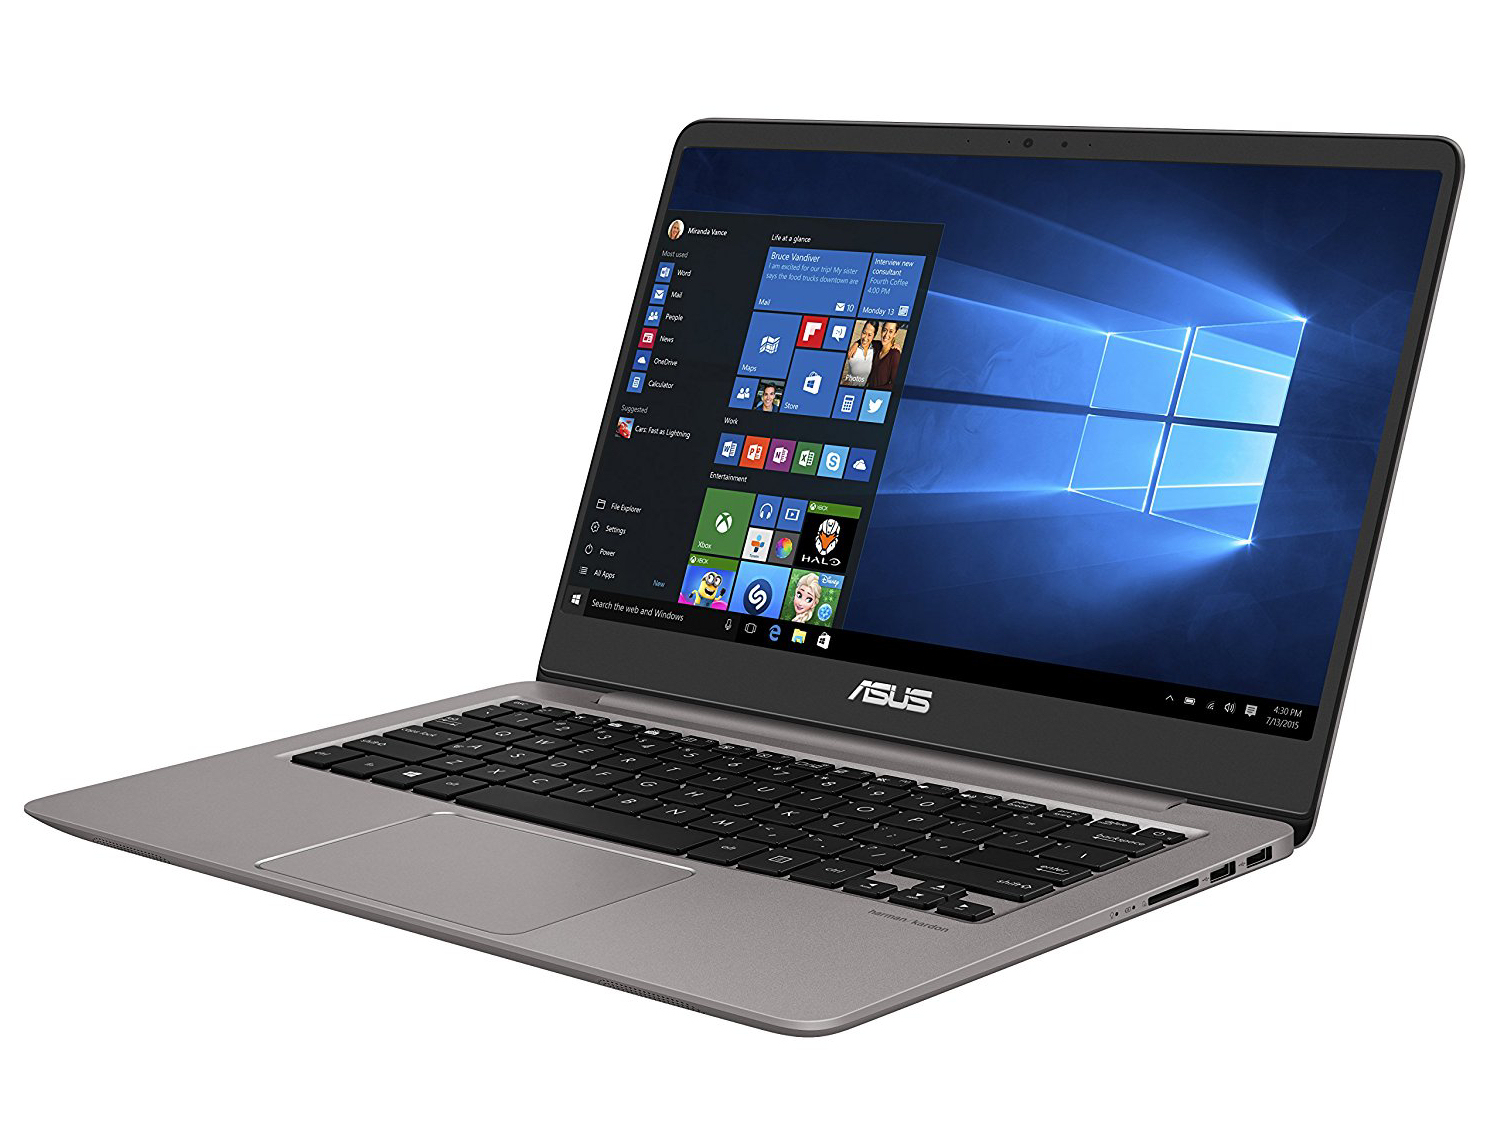
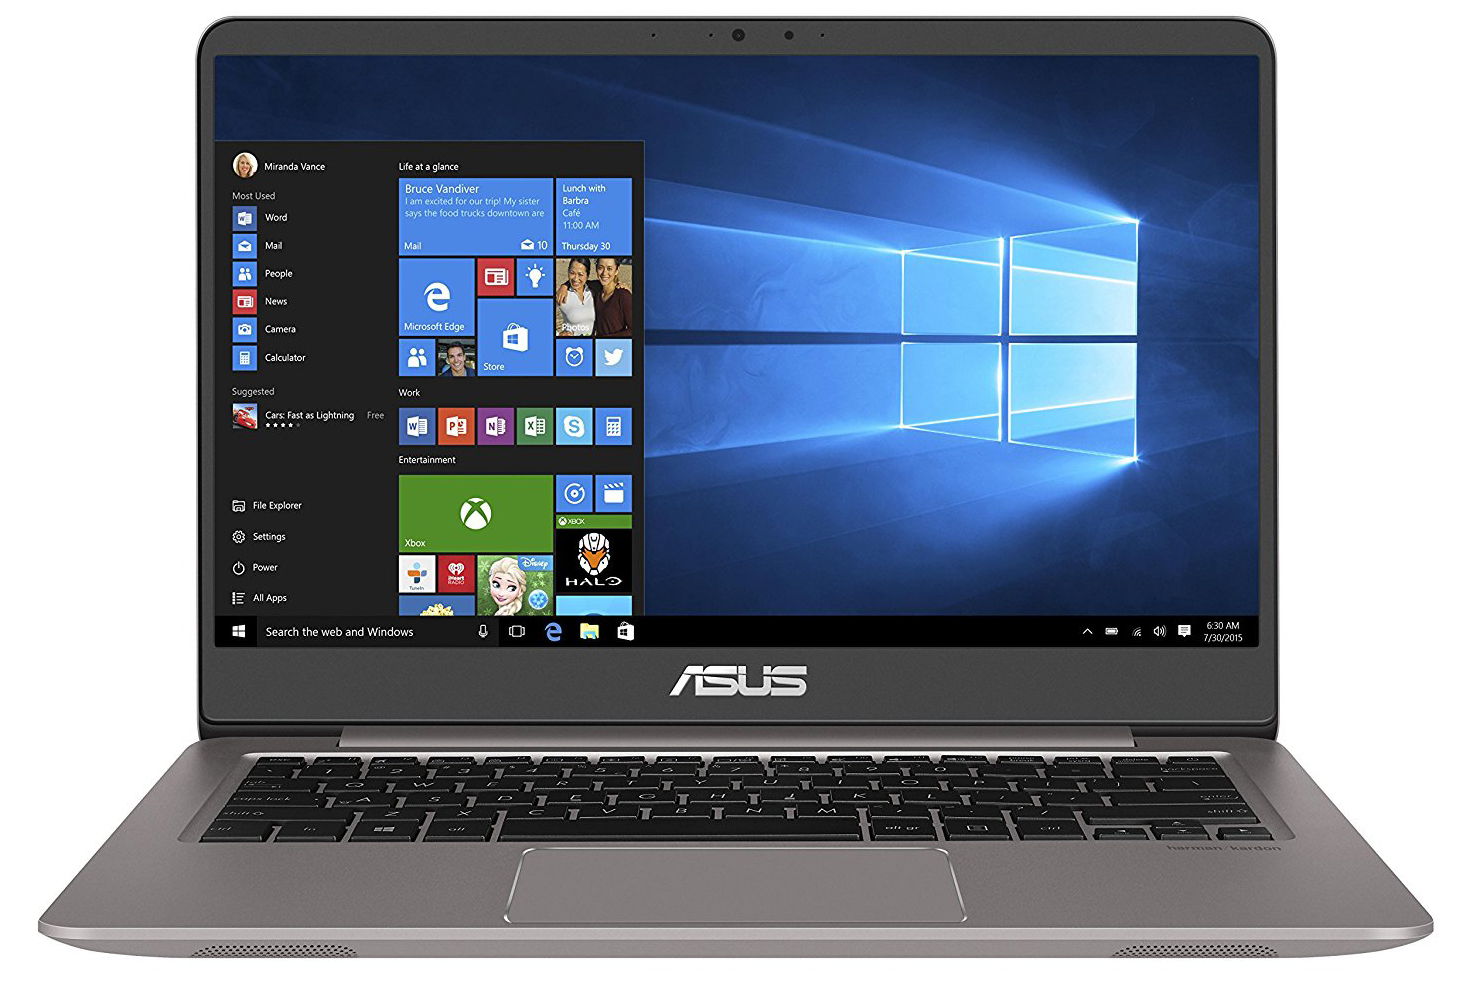
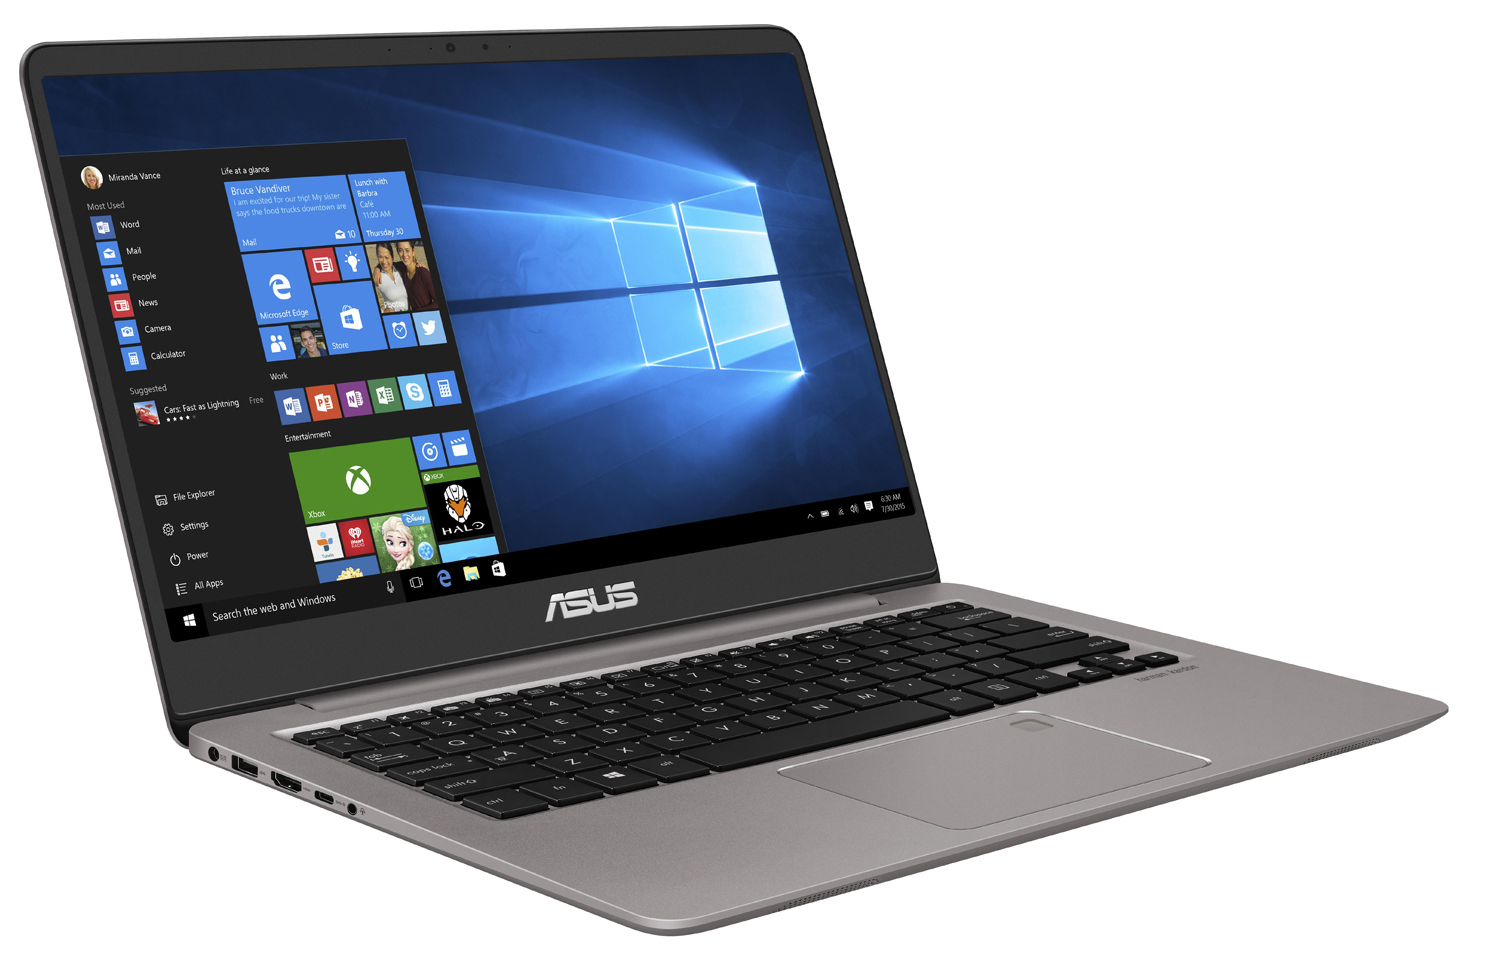
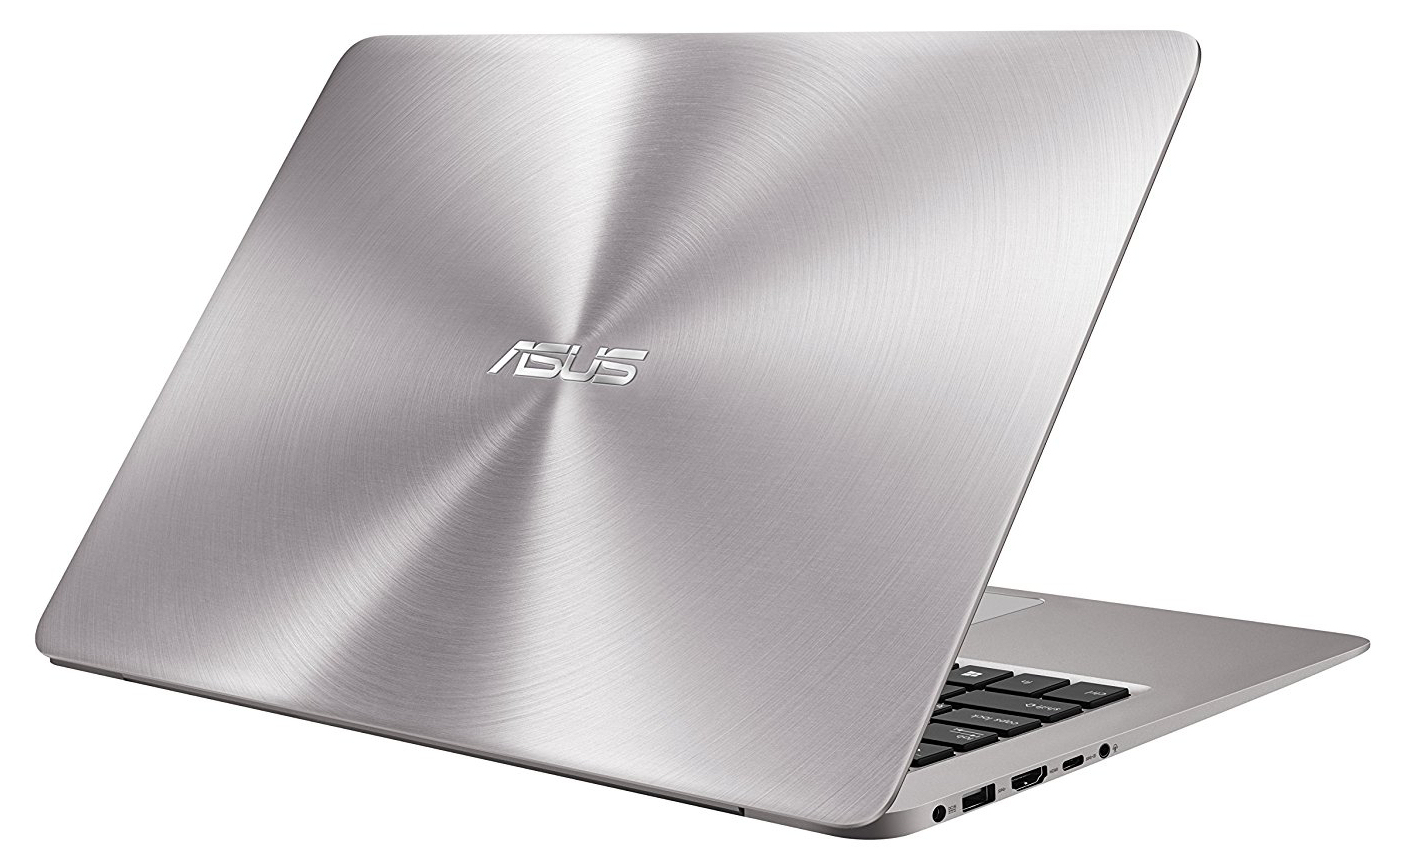
Breve Análise do Portátil Asus ZenBook UX3410UQ (7500U, 940MX, Full HD)
| SD Card Reader | |
| average JPG Copy Test (av. of 3 runs) | |
| Acer Swift 5 SF514-51-59AV | |
| Lenovo ThinkPad X1 Carbon 2017-20HQS03P00 | |
| Asus Zenbook UX3410UQ-GV077T | |
| Asus UX310UQ-FC396T | |
| Asus Zenbook UX3410UA | |
| Acer TravelMate X349-G2 | |
| maximum AS SSD Seq Read Test (1GB) | |
| Acer Swift 5 SF514-51-59AV | |
| Lenovo ThinkPad X1 Carbon 2017-20HQS03P00 | |
| Asus Zenbook UX3410UQ-GV077T | |
| Asus Zenbook UX3410UA | |
| Asus UX310UQ-FC396T | |
| Acer TravelMate X349-G2 | |
| Networking | |
| iperf3 transmit AX12 | |
| Acer TravelMate X349-G2 | |
| HP Spectre 13-v131ng | |
| Asus UX310UQ-FC396T (jseb) | |
| Apple MacBook Pro 13 2016 (Klaus I211) | |
| Lenovo ThinkPad X1 Carbon 2017-20HQS03P00 | |
| Asus Zenbook UX3410UQ-GV077T | |
| Asus Zenbook UX3410UA | |
| iperf3 receive AX12 | |
| Apple MacBook Pro 13 2016 (Klaus I211) | |
| Asus Zenbook UX3410UQ-GV077T | |
| Lenovo ThinkPad X1 Carbon 2017-20HQS03P00 | |
| Acer TravelMate X349-G2 | |
| Asus UX310UQ-FC396T (jseb) | |
| HP Spectre 13-v131ng | |
| Asus Zenbook UX3410UA | |
| |||||||||||||||||||||||||
iluminação: 84 %
iluminação com acumulador: 381 cd/m²
Contraste: 1270:1 (Preto: 0.3 cd/m²)
ΔE ColorChecker Calman: 2.84 | ∀{0.5-29.43 Ø4.73}
ΔE Greyscale Calman: 4.02 | ∀{0.09-98 Ø4.97}
86% sRGB (Argyll 1.6.3 3D)
56% AdobeRGB 1998 (Argyll 1.6.3 3D)
69.3% AdobeRGB 1998 (Argyll 3D)
99.2% sRGB (Argyll 3D)
67.2% Display P3 (Argyll 3D)
Gamma: 2.42
CCT: 7430 K
| Asus Zenbook UX3410UQ-GV077T IPS, 1920x1080, 14" | Asus Zenbook UX3410UA IPS, 1920x1080, 14" | Acer TravelMate X349-G2 IPS, 1920x1080, 14" | Acer Swift 5 SF514-51-59AV IPS, 1920x1080, 14" | Lenovo ThinkPad X1 Carbon 2017-20HQS03P00 IPS, 1920x1080, 14" | Apple MacBook Pro 13 2016 2560x1600, 13.3" | HP Spectre 13-v131ng IPS UWVA, 1920x1080, 13.3" | |
|---|---|---|---|---|---|---|---|
| Display | 0% | -38% | -7% | -11% | 23% | -7% | |
| Display P3 Coverage (%) | 67.2 | 67.7 1% | 41.81 -38% | 62.8 -7% | 61.4 -9% | 97.1 44% | 64.6 -4% |
| sRGB Coverage (%) | 99.2 | 99.1 0% | 62.3 -37% | 91.3 -8% | 85.9 -13% | 99.8 1% | 88.8 -10% |
| AdobeRGB 1998 Coverage (%) | 69.3 | 69.4 0% | 43.26 -38% | 64.3 -7% | 62.4 -10% | 86.7 25% | 64.8 -6% |
| Response Times | 4% | -4% | -7% | -2% | -43% | -10% | |
| Response Time Grey 50% / Grey 80% * (ms) | 44 ? | 33 ? 25% | 43 ? 2% | 51 ? -16% | 41.6 ? 5% | 47.2 ? -7% | 46 ? -5% |
| Response Time Black / White * (ms) | 29 ? | 34 ? -17% | 32 ? -10% | 28 ? 3% | 31.6 ? -9% | 51.6 ? -78% | 33 ? -14% |
| PWM Frequency (Hz) | 60 ? | 25000 ? | |||||
| Screen | -2% | -36% | -26% | -20% | 21% | -20% | |
| Brightness middle (cd/m²) | 381 | 376 -1% | 271 -29% | 393 3% | 311 -18% | 600 57% | 404 6% |
| Brightness (cd/m²) | 368 | 355 -4% | 253 -31% | 338 -8% | 288 -22% | 564 53% | 382 4% |
| Brightness Distribution (%) | 84 | 87 4% | 83 -1% | 79 -6% | 85 1% | 89 6% | 91 8% |
| Black Level * (cd/m²) | 0.3 | 0.32 -7% | 0.35 -17% | 0.29 3% | 0.24 20% | 0.57 -90% | 0.35 -17% |
| Contrast (:1) | 1270 | 1175 -7% | 774 -39% | 1355 7% | 1296 2% | 1053 -17% | 1154 -9% |
| Colorchecker dE 2000 * | 2.84 | 3.2 -13% | 5.05 -78% | 6.17 -117% | 5.5 -94% | 1.5 47% | 5.37 -89% |
| Colorchecker dE 2000 max. * | 6.5 | 7.1 -9% | 11.74 -81% | 11.21 -72% | 9 -38% | 2.9 55% | 9.46 -46% |
| Greyscale dE 2000 * | 4.02 | 4.4 -9% | 4.3 -7% | 6.8 -69% | 6.2 -54% | 2 50% | 6.44 -60% |
| Gamma | 2.42 91% | 2.12 104% | 2.44 90% | 2.27 97% | 2.02 109% | 2.27 97% | 2.52 87% |
| CCT | 7430 87% | 7440 87% | 6726 97% | 6873 95% | 5950 109% | 6855 95% | 6738 96% |
| Color Space (Percent of AdobeRGB 1998) (%) | 56 | 63.78 14% | 42 -25% | 51 -9% | 55.96 0% | 77 38% | 58 4% |
| Color Space (Percent of sRGB) (%) | 86 | 98.98 15% | 39 -55% | 91 6% | 85.77 0% | 92 7% | 89 3% |
| Média Total (Programa/Configurações) | 1% /
-1% | -26% /
-32% | -13% /
-20% | -11% /
-16% | 0% /
13% | -12% /
-16% |
* ... menor é melhor
Cintilação da tela / PWM (modulação por largura de pulso)
| Tela tremeluzindo/PWM detectado | 60 Hz | ≤ 30 % configuração de brilho | 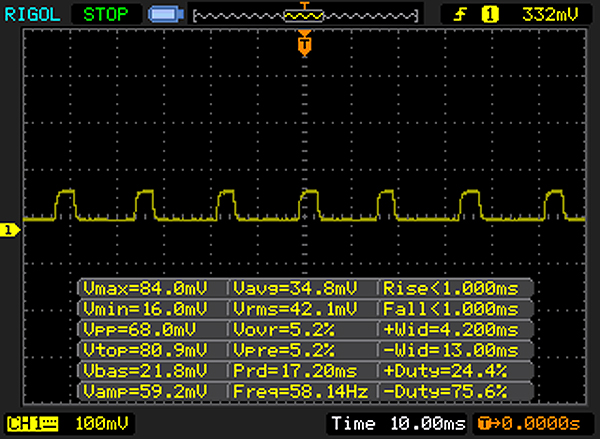 |
A luz de fundo da tela pisca em 60 Hz (pior caso, por exemplo, utilizando PWM) Cintilação detectada em uma configuração de brilho de 30 % e abaixo. Não deve haver cintilação ou PWM acima desta configuração de brilho. A frequência de 60 Hz é muito baixa, portanto a oscilação pode causar fadiga ocular e dores de cabeça após uso prolongado. [pwm_comparison] Em comparação: 52 % de todos os dispositivos testados não usam PWM para escurecer a tela. Se PWM foi detectado, uma média de 7798 (mínimo: 5 - máximo: 343500) Hz foi medida. | |||
Exibir tempos de resposta
| ↔ Tempo de resposta preto para branco | ||
|---|---|---|
| 29 ms ... ascensão ↗ e queda ↘ combinadas | ↗ 17 ms ascensão | 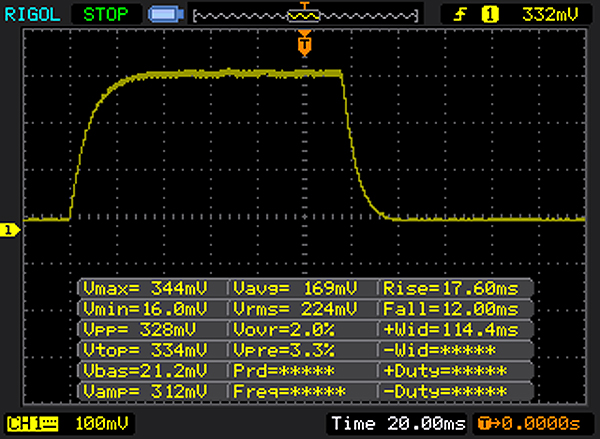 |
| ↘ 12 ms queda | ||
| A tela mostra taxas de resposta relativamente lentas em nossos testes e pode ser muito lenta para os jogadores. Em comparação, todos os dispositivos testados variam de 0.1 (mínimo) a 240 (máximo) ms. » 77 % de todos os dispositivos são melhores. Isso significa que o tempo de resposta medido é pior que a média de todos os dispositivos testados (19.9 ms). | ||
| ↔ Tempo de resposta 50% cinza a 80% cinza | ||
| 44 ms ... ascensão ↗ e queda ↘ combinadas | ↗ 24 ms ascensão | 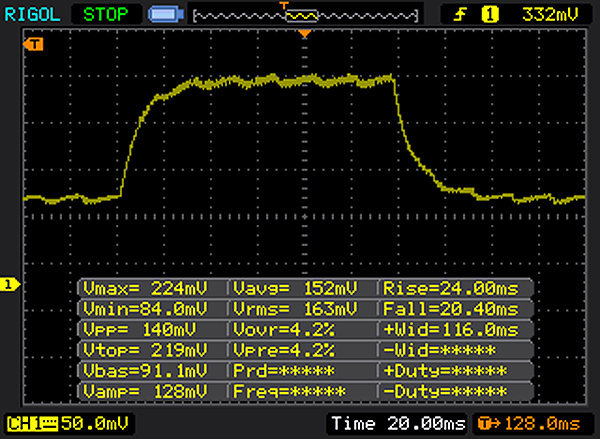 |
| ↘ 20 ms queda | ||
| A tela mostra taxas de resposta lentas em nossos testes e será insatisfatória para os jogadores. Em comparação, todos os dispositivos testados variam de 0.165 (mínimo) a 636 (máximo) ms. » 73 % de todos os dispositivos são melhores. Isso significa que o tempo de resposta medido é pior que a média de todos os dispositivos testados (31.1 ms). | ||
| Cinebench R10 | |
| Rendering Multiple CPUs 32Bit | |
| Asus UX310UQ-FC396T | |
| Asus Zenbook UX3410UQ-GV077T | |
| HP Spectre 13-v131ng | |
| Apple MacBook Pro 13 2016 | |
| Rendering Single 32Bit | |
| Asus Zenbook UX3410UQ-GV077T | |
| HP Spectre 13-v131ng | |
| Asus UX310UQ-FC396T | |
| Apple MacBook Pro 13 2016 | |
| Geekbench 3 | |
| 32 Bit Multi-Core Score | |
| Asus Zenbook UX3410UQ-GV077T | |
| 32 Bit Single-Core Score | |
| Asus Zenbook UX3410UQ-GV077T | |
| Geekbench 4.0 | |
| 64 Bit Multi-Core Score | |
| Asus Zenbook UX3410UQ-GV077T | |
| Apple MacBook Pro 13 2016 | |
| Apple MacBook Pro 13 2016 | |
| 64 Bit Single-Core Score | |
| Asus Zenbook UX3410UQ-GV077T | |
| Apple MacBook Pro 13 2016 | |
| Apple MacBook Pro 13 2016 | |
| Geekbench 4.4 | |
| 64 Bit Multi-Core Score | |
| Asus Zenbook UX3410UQ-GV077T | |
| 64 Bit Single-Core Score | |
| Asus Zenbook UX3410UQ-GV077T | |
| PCMark 8 Home Score Accelerated v2 | 3923 pontos | |
Ajuda | ||

| Asus Zenbook UX3410UQ-GV077T SanDisk SD8SNAT256G1002 | Asus Zenbook UX3410UA SanDisk SD8SN8U512G1002 | Acer TravelMate X349-G2 Intel SSD 600p SSDPEKKW512G7 | Acer Swift 5 SF514-51-59AV SK Hynix HFS256G39TND-N210A | Lenovo ThinkPad X1 Carbon 2017-20HQS03P00 Samsung PM961 NVMe MZVLW512HMJP | Apple MacBook Pro 13 2016 Apple SSD AP0256 | HP Spectre 13-v131ng Samsung PM961 NVMe MZVLW512HMJP | |
|---|---|---|---|---|---|---|---|
| CrystalDiskMark 3.0 | 29% | 125% | 13% | 218% | 168% | 158% | |
| Read Seq (MB/s) | 497 | 494.5 -1% | 1818 266% | 517 4% | 1827 268% | 1345 171% | 1090 119% |
| Write Seq (MB/s) | 323.7 | 461.7 43% | 582 80% | 258.1 -20% | 1383 327% | 1320 308% | 1088 236% |
| Read 512 (MB/s) | 289 | 328 13% | 1134 292% | 355 23% | 814 182% | 831 188% | 753 161% |
| Write 512 (MB/s) | 288 | 419.7 46% | 586 103% | 258.5 -10% | 1098 281% | 1486 416% | 911 216% |
| Read 4k (MB/s) | 22.78 | 27.53 21% | 34.93 53% | 29.65 30% | 61 168% | 31.68 39% | 57.5 152% |
| Write 4k (MB/s) | 79.5 | 56.5 -29% | 133.4 68% | 77.3 -3% | 172.2 117% | 11.02 -86% | 140.2 76% |
| Read 4k QD32 (MB/s) | 147 | 351 139% | 373.7 154% | 277.1 89% | 601 309% | 533 263% | 497.1 238% |
| Write 4k QD32 (MB/s) | 257.2 | 249.3 -3% | 210.8 -18% | 242.5 -6% | 495.6 93% | 362 41% | 416 62% |
| 3DMark 11 Performance | 2205 pontos | |
Ajuda | ||
| baixo | média | alto | ultra | |
|---|---|---|---|---|
| BioShock Infinite (2013) | 83.8 | 45.4 | 37.4 | 13.2 |
Barulho
| Ocioso |
| 30 / 30 / 31.1 dB |
| HDD |
| 31 dB |
| Carga |
| 32.2 / 37.6 dB |
 | ||
30 dB silencioso 40 dB(A) audível 50 dB(A) ruidosamente alto |
||
min: | ||
(+) A temperatura máxima no lado superior é 34.1 °C / 93 F, em comparação com a média de 35.9 °C / 97 F , variando de 21.4 a 59 °C para a classe Subnotebook.
(+) A parte inferior aquece até um máximo de 38.3 °C / 101 F, em comparação com a média de 39.2 °C / 103 F
(+) Em uso inativo, a temperatura média para o lado superior é 21.4 °C / 71 F, em comparação com a média do dispositivo de 30.8 °C / ### class_avg_f### F.
(+) Os apoios para as mãos e o touchpad são mais frios que a temperatura da pele, com um máximo de 28.2 °C / 82.8 F e, portanto, são frios ao toque.
(±) A temperatura média da área do apoio para as mãos de dispositivos semelhantes foi 28.2 °C / 82.8 F (0 °C / 0 F).
Asus Zenbook UX3410UQ-GV077T análise de áudio
(±) | o volume do alto-falante é médio, mas bom (###valor### dB)
Graves 100 - 315Hz
(±) | graves reduzidos - em média 12% menor que a mediana
(+) | o baixo é linear (4.5% delta para a frequência anterior)
Médios 400 - 2.000 Hz
(±) | médios mais altos - em média 6.5% maior que a mediana
(+) | médios são lineares (6.7% delta para frequência anterior)
Altos 2 - 16 kHz
(+) | agudos equilibrados - apenas 3.9% longe da mediana
(+) | os máximos são lineares (4.8% delta da frequência anterior)
Geral 100 - 16.000 Hz
(±) | a linearidade do som geral é média (17% diferença em relação à mediana)
Comparado com a mesma classe
» 43% de todos os dispositivos testados nesta classe foram melhores, 8% semelhantes, 49% piores
» O melhor teve um delta de 5%, a média foi 18%, o pior foi 53%
Comparado com todos os dispositivos testados
» 30% de todos os dispositivos testados foram melhores, 8% semelhantes, 62% piores
» O melhor teve um delta de 4%, a média foi 24%, o pior foi 134%
Apple MacBook 12 (Early 2016) 1.1 GHz análise de áudio
(+) | os alto-falantes podem tocar relativamente alto (###valor### dB)
Graves 100 - 315Hz
(±) | graves reduzidos - em média 11.3% menor que a mediana
(±) | a linearidade dos graves é média (14.2% delta para a frequência anterior)
Médios 400 - 2.000 Hz
(+) | médios equilibrados - apenas 2.4% longe da mediana
(+) | médios são lineares (5.5% delta para frequência anterior)
Altos 2 - 16 kHz
(+) | agudos equilibrados - apenas 2% longe da mediana
(+) | os máximos são lineares (4.5% delta da frequência anterior)
Geral 100 - 16.000 Hz
(+) | o som geral é linear (10.2% diferença em relação à mediana)
Comparado com a mesma classe
» 7% de todos os dispositivos testados nesta classe foram melhores, 2% semelhantes, 91% piores
» O melhor teve um delta de 5%, a média foi 18%, o pior foi 53%
Comparado com todos os dispositivos testados
» 5% de todos os dispositivos testados foram melhores, 1% semelhantes, 94% piores
» O melhor teve um delta de 4%, a média foi 24%, o pior foi 134%
| desligado | |
| Ocioso | |
| Carga |
|
Key:
min: | |
Pro
Contra
A Asus equipou o ZenBook com um processador Core-i7 da geração Kaby-Lake. Em combinação com o núcleo gráfico GeForce 940MX, o computador oferece energia suficiente mesmo para aplicativos além do escritório e da Internet. O núcleo gráfico integrado da GeForce é a principal diferença em comparação com o ZenBook UX3410UA que já testamos, que não possui uma GPU dedicada.
Você pode estar preocupado com o fato de que o núcleo gráfico adicional levaria ao aumento do ruído e à diminuição da duração da bateria. Não podemos confirmar isso.
Em geral, o UX3410UQ opera mais silenciosamente do que o UX3410UA e atinge uma melhor duração da bateria em nosso teste WLAN praticamente relevante.
Um SSD garante um sistema veloz. Além disso, há um disco rígido convencional de 2,5 polegadas (1 TB) servindo como armazenamento de dados. Ambos os meios de armazenamento podem ser comutados. No entanto, para fazer isso, você terá que abrir a carcaça. A tela IPS mate agrada com seu alto brilho e contraste, e ângulos de visão estáveis.
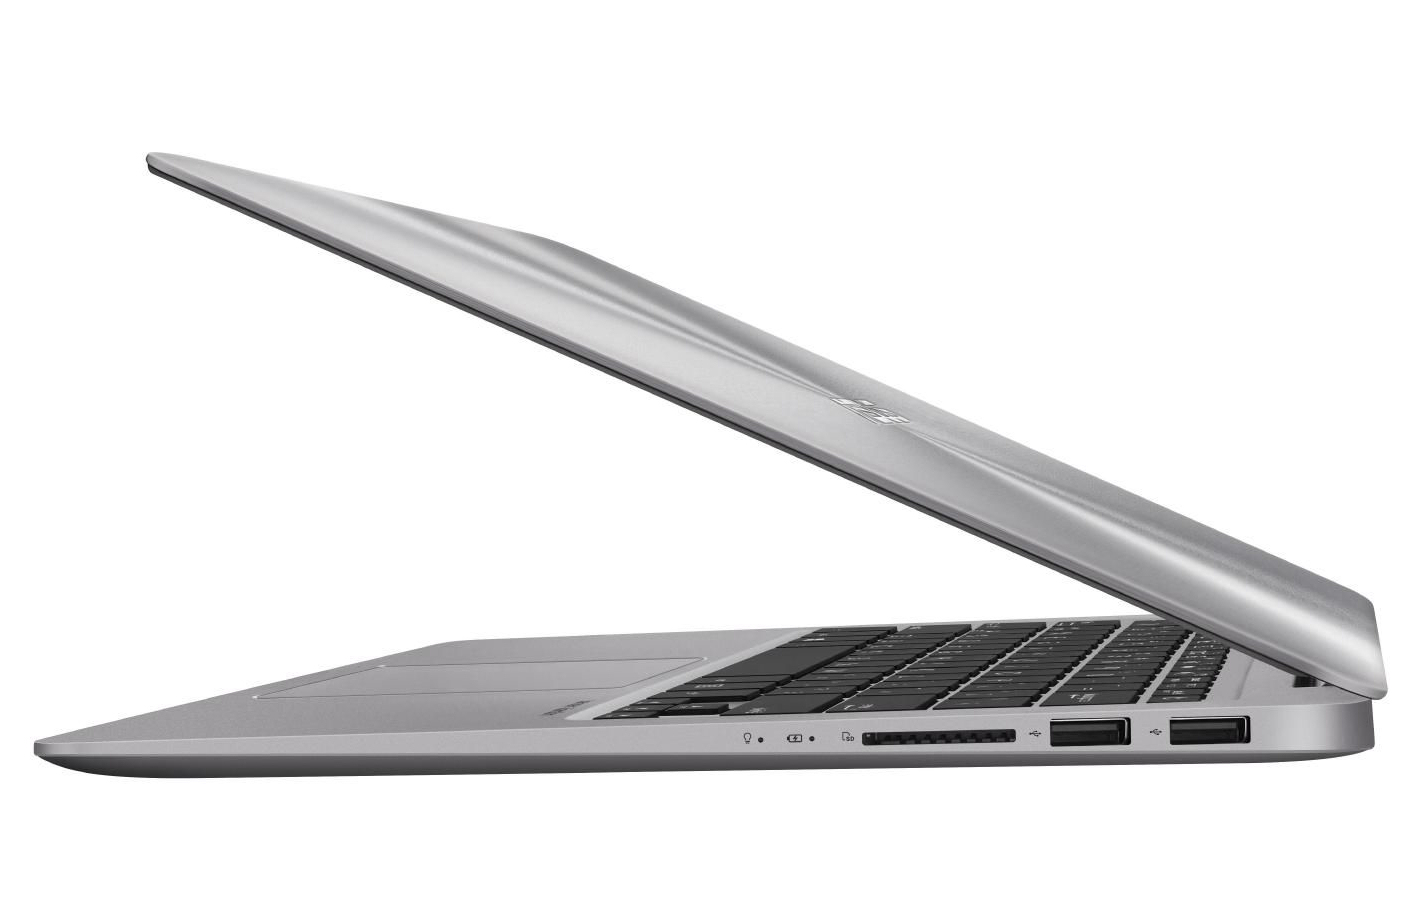
Asus Zenbook UX3410UQ-GV077T
- 05/17/2017 v6 (old)
Sascha Mölck