Breve Análise do Tablet Dell Venue 10 Pro (5056)
Comparação de imagens
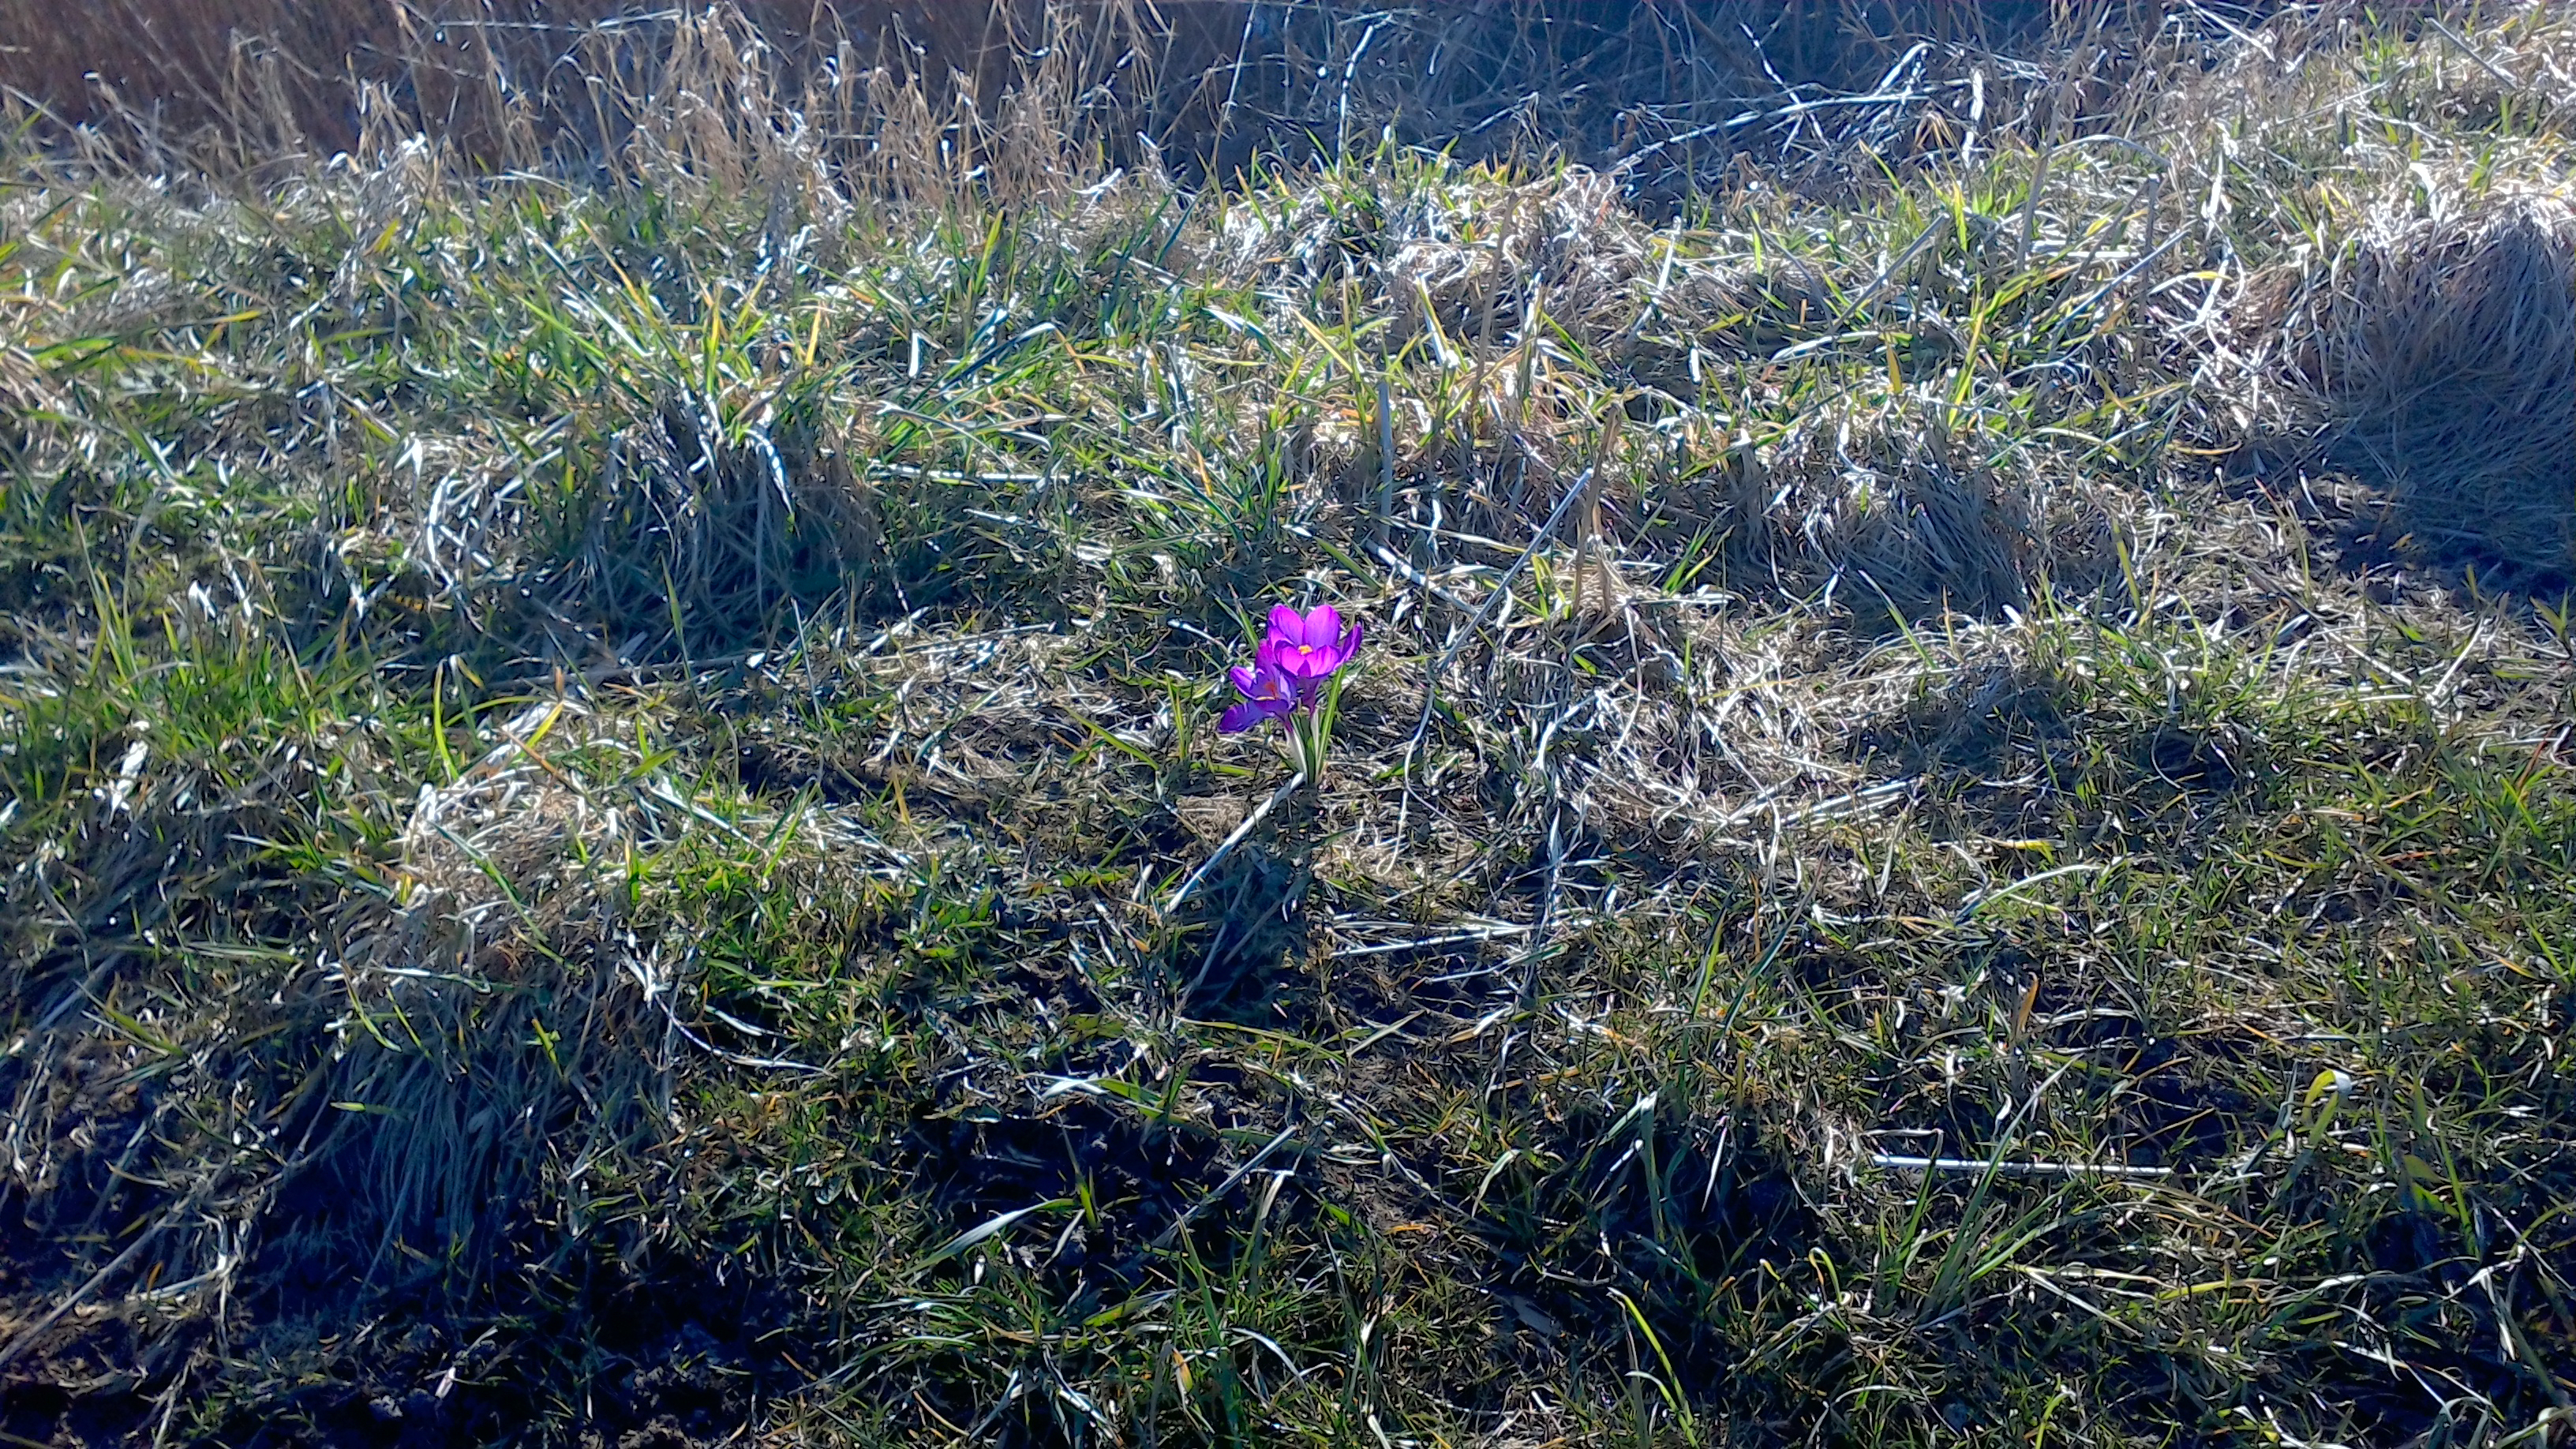
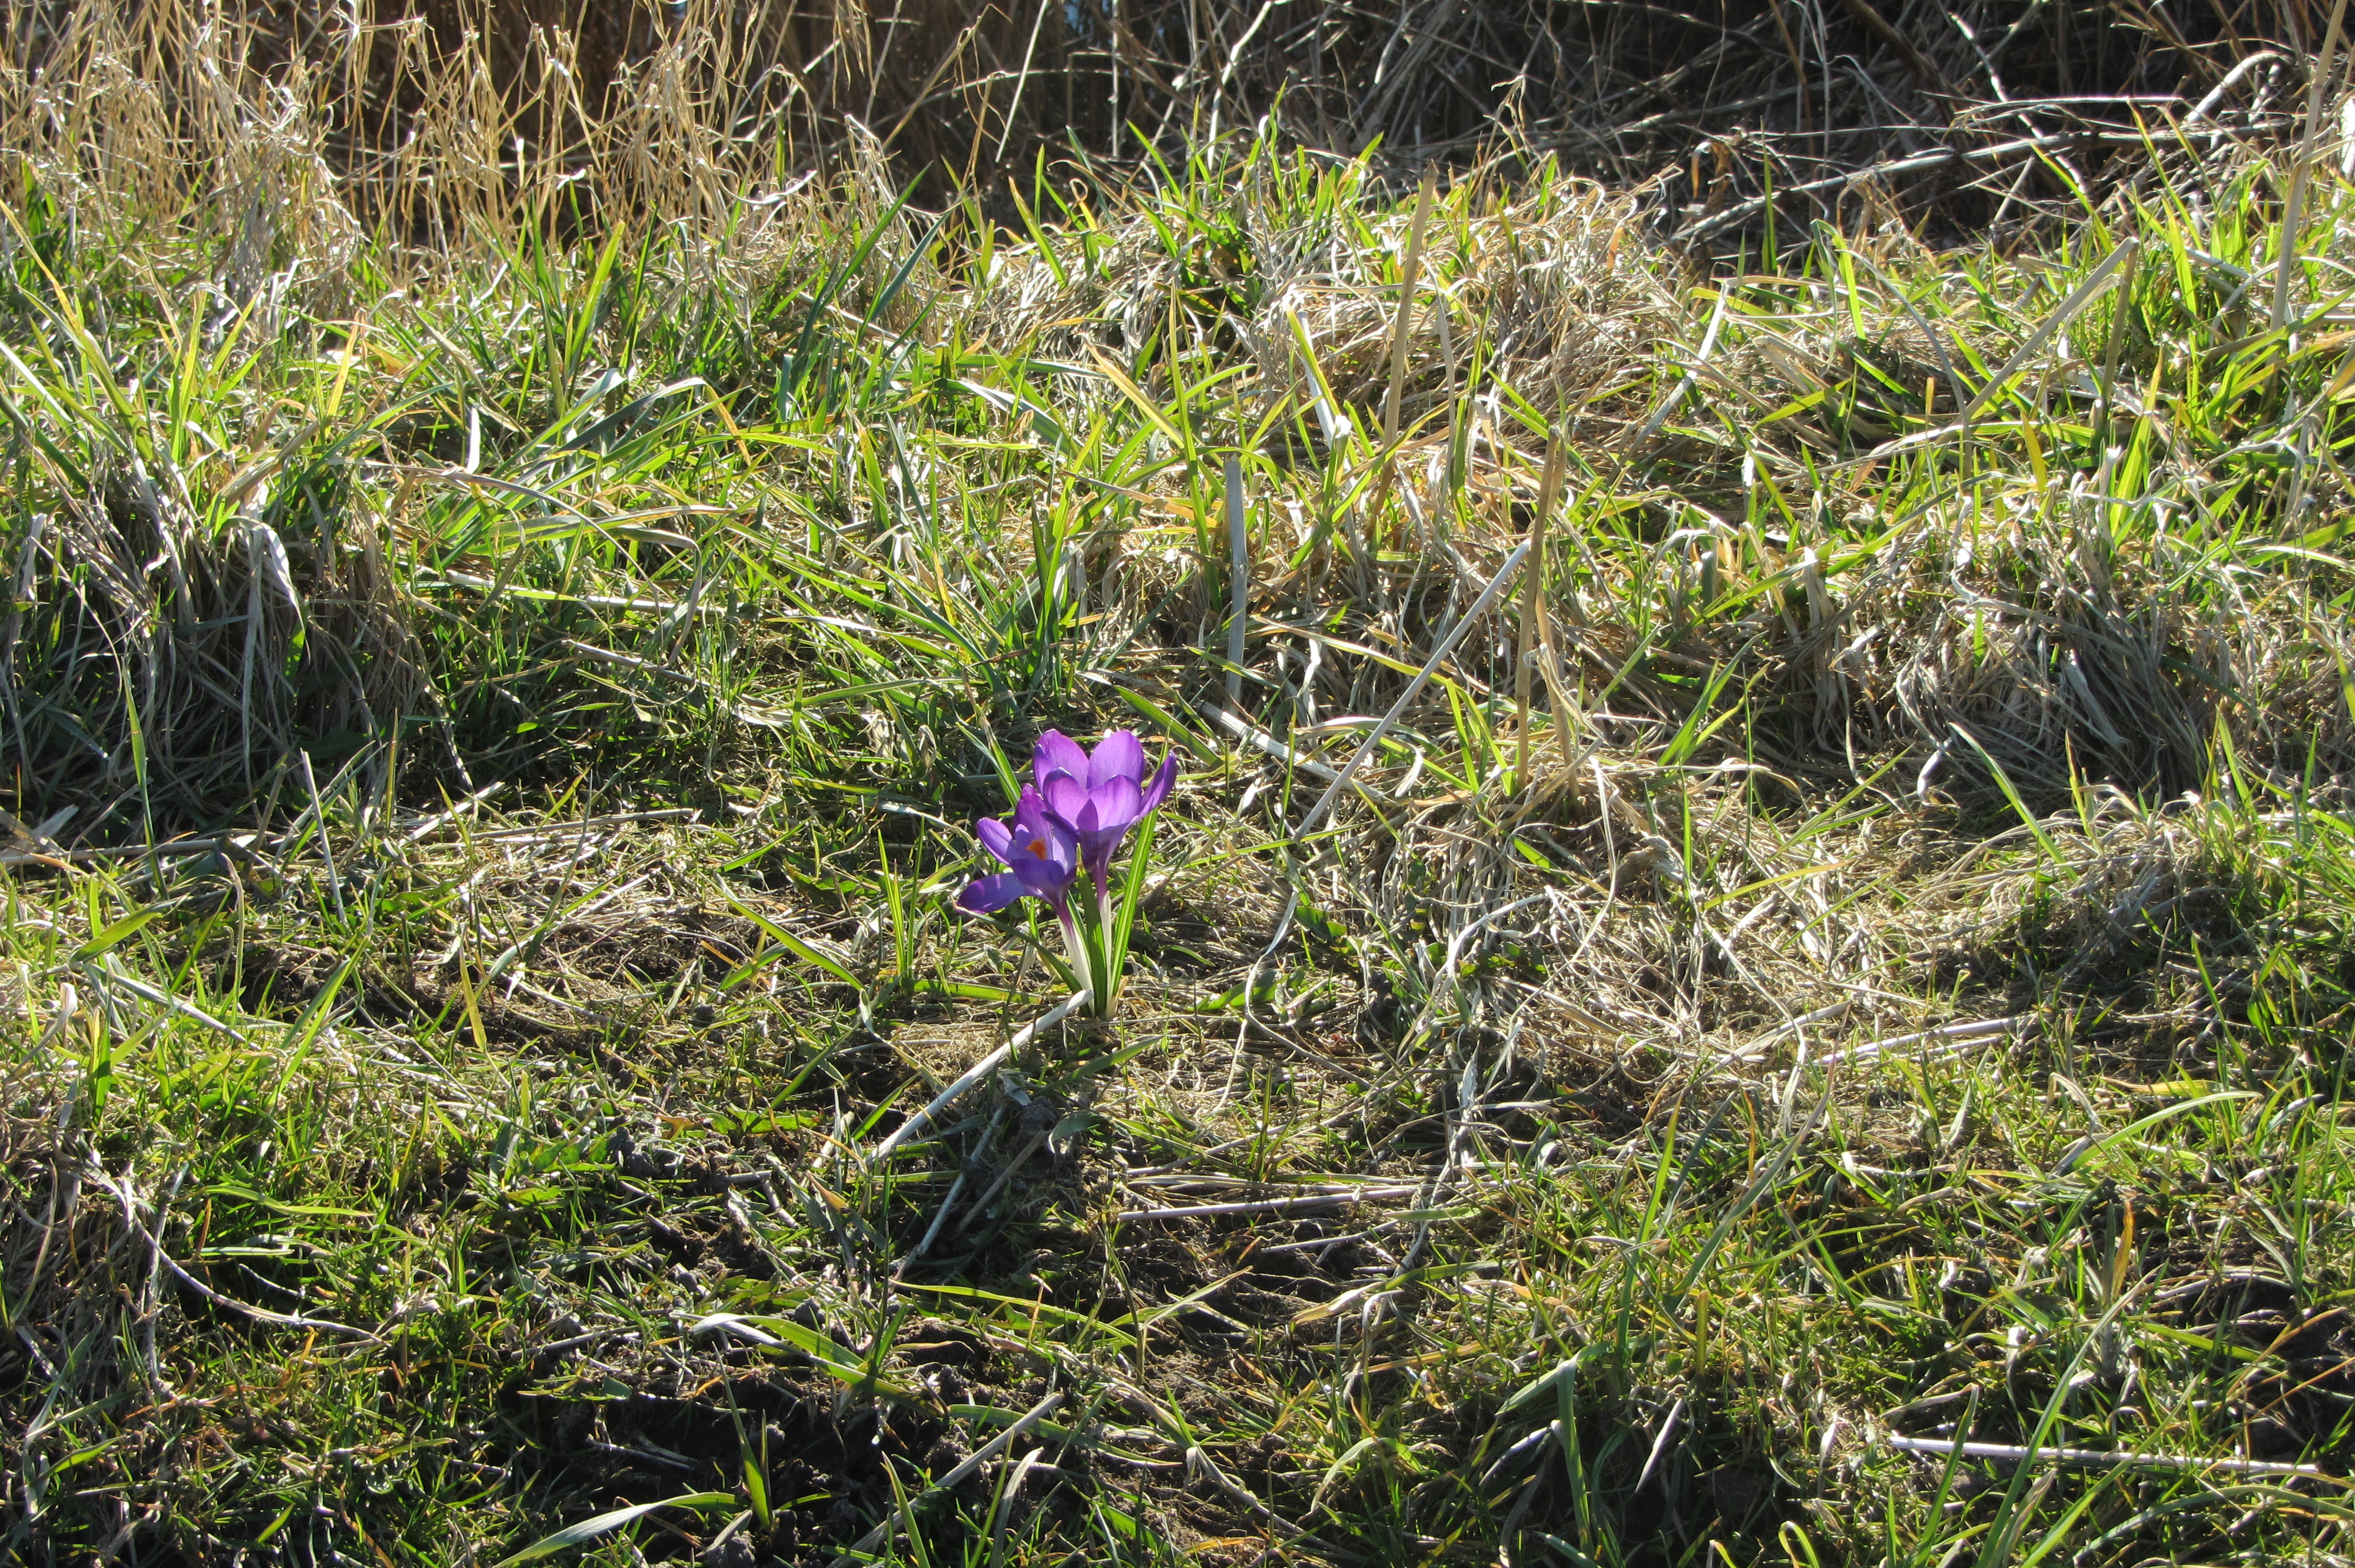
Escolha uma cena e navegue pela primeira imagem. Um clique muda a posição nas telas sensíveis ao toque. Um clique na imagem ampliada abre o original em uma nova janela. A primeira imagem mostra a fotografia em escala do dispositivo de teste.


| |||||||||||||||||||||||||
iluminação: 91 %
iluminação com acumulador: 365 cd/m²
Contraste: 1521:1 (Preto: 0.24 cd/m²)
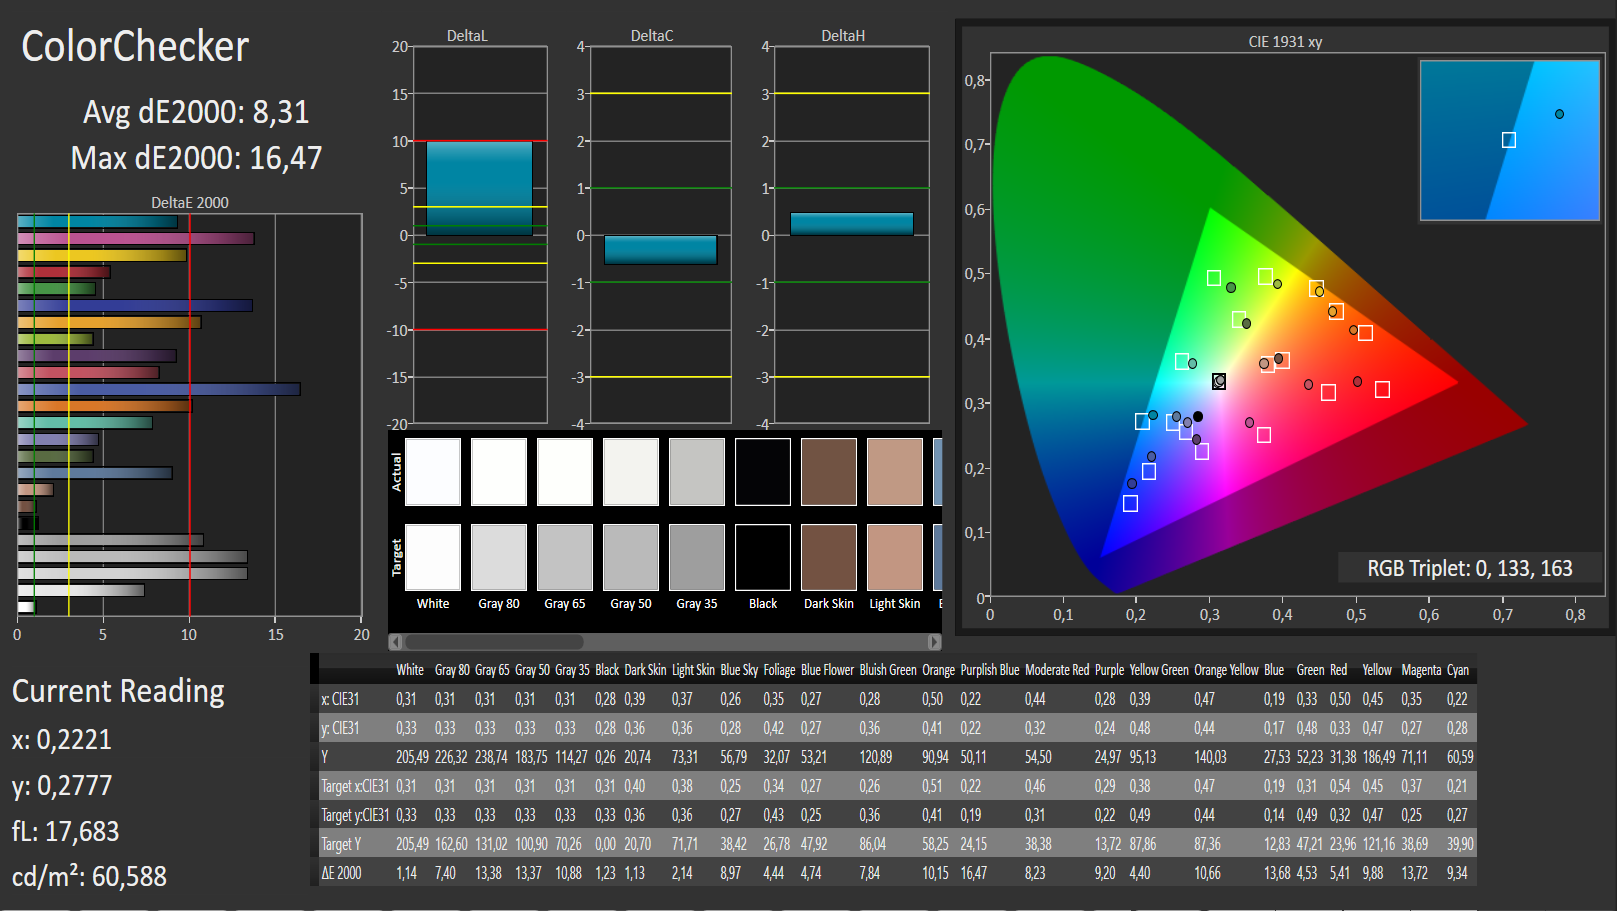
ΔE ColorChecker Calman: 8.31 | ∀{0.5-29.43 Ø4.73}
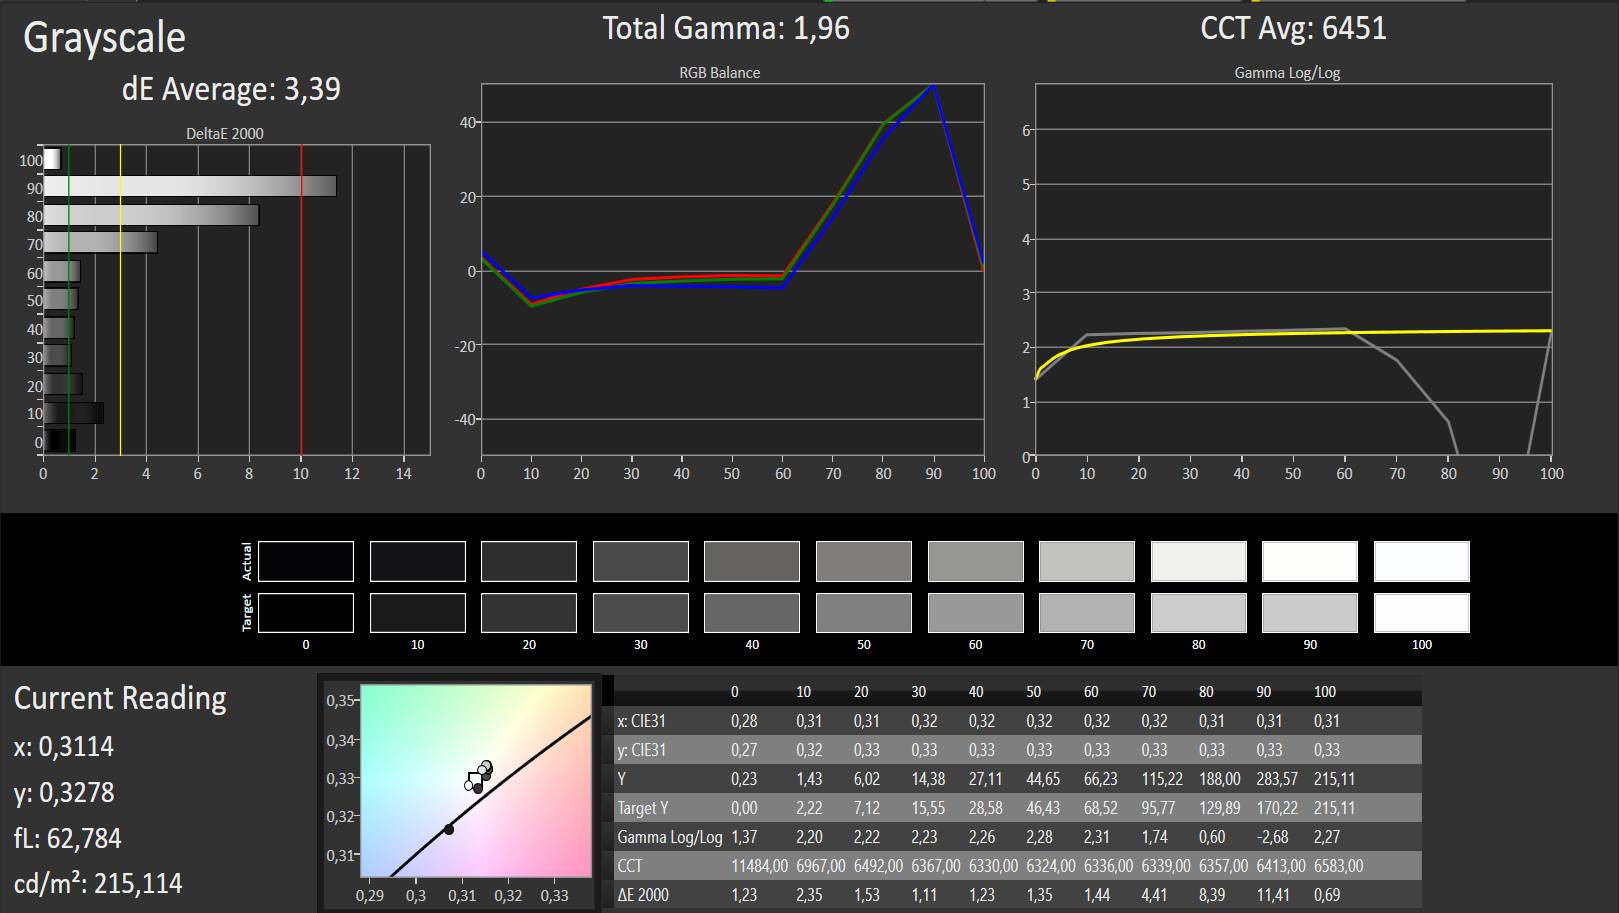
ΔE Greyscale Calman: 3.39 | ∀{0.09-98 Ø4.97}
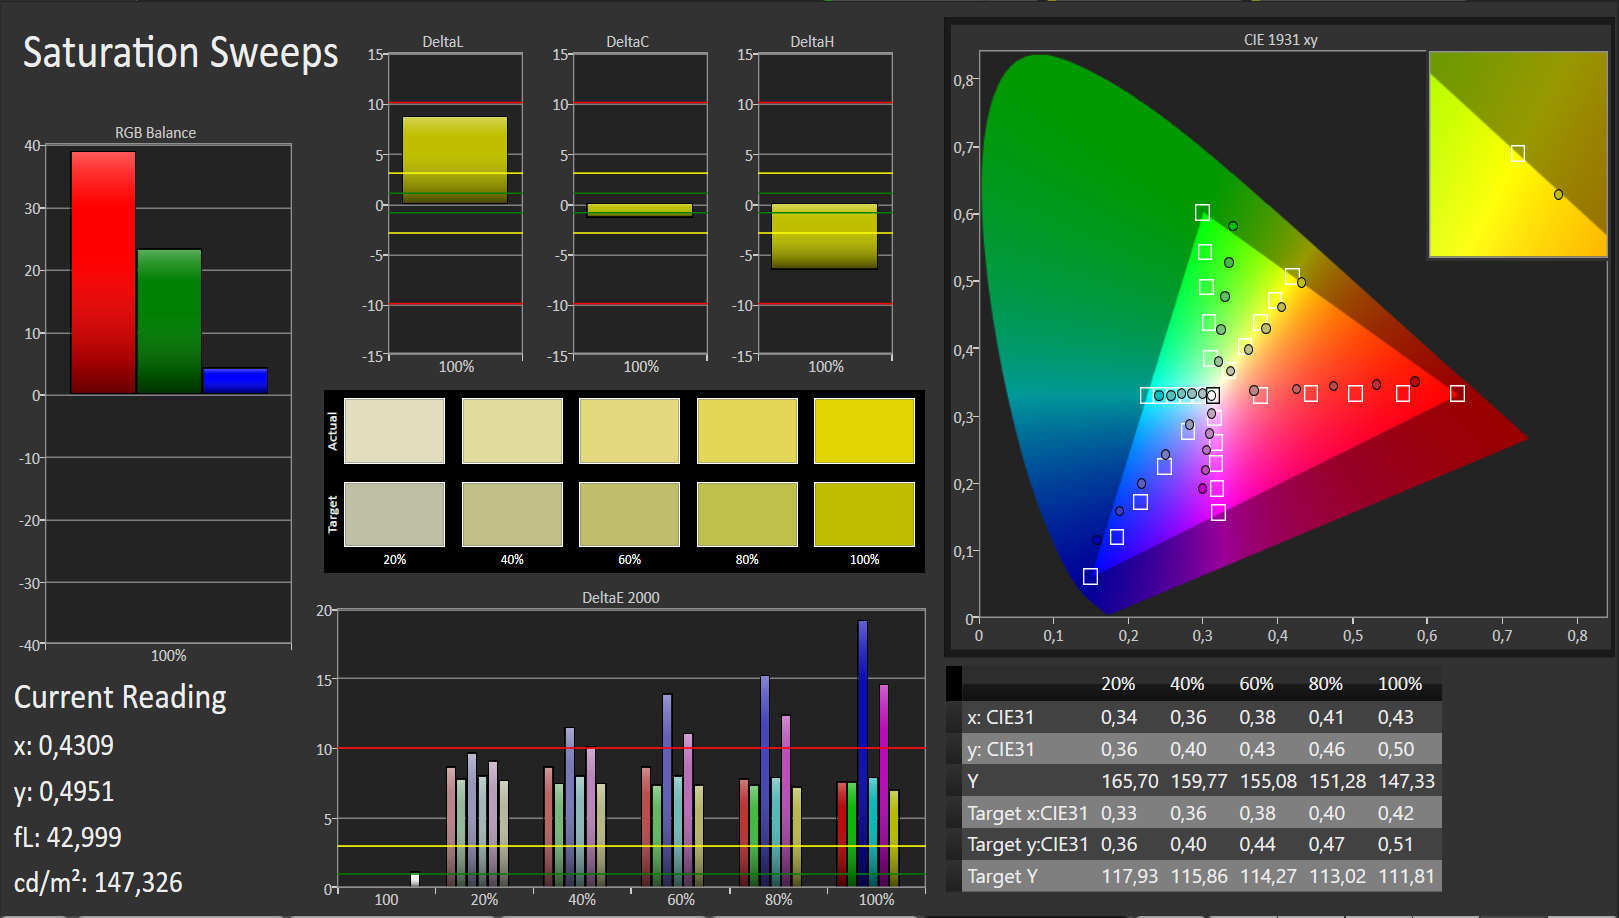
60% sRGB (Argyll 1.6.3 3D)
38% AdobeRGB 1998 (Argyll 1.6.3 3D)
41.72% AdobeRGB 1998 (Argyll 3D)
60.7% sRGB (Argyll 3D)
40.38% Display P3 (Argyll 3D)
Gamma: 1.96
CCT: 6451 K
Cintilação da tela / PWM (modulação por largura de pulso)
| Tela tremeluzindo / PWM não detectado | 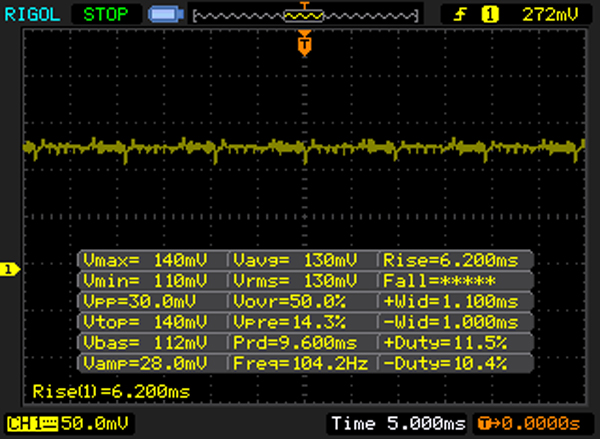 | ||
[pwm_comparison] Em comparação: 52 % de todos os dispositivos testados não usam PWM para escurecer a tela. Se PWM foi detectado, uma média de 7798 (mínimo: 5 - máximo: 343500) Hz foi medida. | |||
Exibir tempos de resposta
| ↔ Tempo de resposta preto para branco | ||
|---|---|---|
| 26 ms ... ascensão ↗ e queda ↘ combinadas | ↗ 7 ms ascensão | 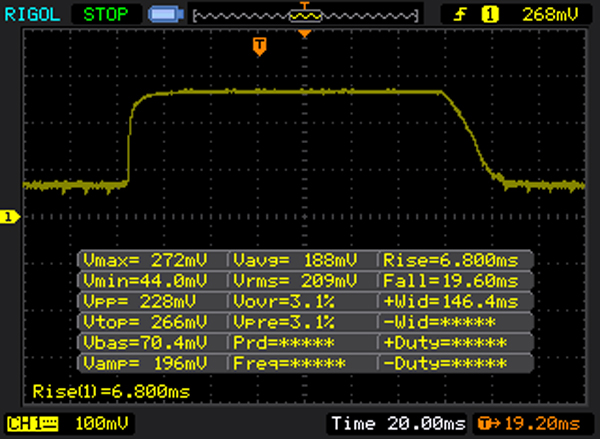 |
| ↘ 19 ms queda | ||
| A tela mostra taxas de resposta relativamente lentas em nossos testes e pode ser muito lenta para os jogadores. Em comparação, todos os dispositivos testados variam de 0.1 (mínimo) a 240 (máximo) ms. » 62 % de todos os dispositivos são melhores. Isso significa que o tempo de resposta medido é pior que a média de todos os dispositivos testados (19.9 ms). | ||
| ↔ Tempo de resposta 50% cinza a 80% cinza | ||
| 30 ms ... ascensão ↗ e queda ↘ combinadas | ↗ 14 ms ascensão | 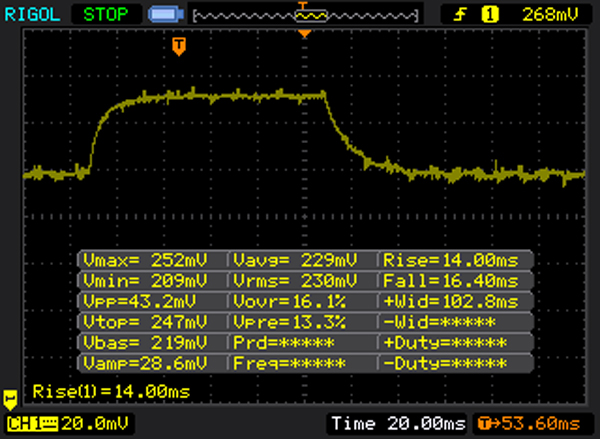 |
| ↘ 16 ms queda | ||
| A tela mostra taxas de resposta lentas em nossos testes e será insatisfatória para os jogadores. Em comparação, todos os dispositivos testados variam de 0.165 (mínimo) a 636 (máximo) ms. » 40 % de todos os dispositivos são melhores. Isso significa que o tempo de resposta medido é semelhante à média de todos os dispositivos testados (31.1 ms). | ||
| Dell Venue 10 Pro 5056 IPS, 1920x1200 | Dell Venue 10 Pro 5055 IPS, 1920x1200 | Apple iPad Air 2 2014 IPS, 2048x1536 | Google Pixel C LTPS, 2560x1800 | Lenovo Thinkpad Tablet 10 2nd Gen IPS, 1920x1200 | Amazon Fire HD 10 inch 2015 IPS, 1280x800 | Asus Transformer Book T100HA-C4-GR IPS, 1280x800 | Samsung Galaxy Tab S2 9.7 LTE Super AMOLED, 2048x1536 | Samsung Galaxy Tab A 9.7 SM-T555 TFT, 1024x768 | |
|---|---|---|---|---|---|---|---|---|---|
| Display | 18% | 26% | |||||||
| Display P3 Coverage (%) | 40.38 | 48.01 19% | 52.8 31% | ||||||
| sRGB Coverage (%) | 60.7 | 70.6 16% | 73 20% | ||||||
| AdobeRGB 1998 Coverage (%) | 41.72 | 49.79 19% | 53.3 28% | ||||||
| Response Times | -39% | ||||||||
| Response Time Grey 50% / Grey 80% * (ms) | 30 ? | 42 ? -40% | |||||||
| Response Time Black / White * (ms) | 26 ? | 36 ? -38% | |||||||
| PWM Frequency (Hz) | |||||||||
| Screen | -22% | 8% | -14% | -15% | -7% | 18% | 27% | -17% | |
| Brightness middle (cd/m²) | 365 | 436 19% | 423 16% | 487 33% | 345 -5% | 458 25% | 480.2 32% | 358 -2% | 394 8% |
| Brightness (cd/m²) | 348 | 418 20% | 427 23% | 510 47% | 337 -3% | 434 25% | 455 31% | 357 3% | 392 13% |
| Brightness Distribution (%) | 91 | 92 1% | 92 1% | 91 0% | 94 3% | 86 -5% | 85 -7% | 86 -5% | 80 -12% |
| Black Level * (cd/m²) | 0.24 | 0.58 -142% | 0.61 -154% | 0.39 -63% | 0.43 -79% | 0.43 -79% | 0.324 -35% | 0.51 -113% | |
| Contrast (:1) | 1521 | 752 -51% | 693 -54% | 1249 -18% | 802 -47% | 1065 -30% | 1482 -3% | 773 -49% | |
| Colorchecker dE 2000 * | 8.31 | 5.17 38% | 2.86 66% | 5.24 37% | 5.86 29% | 4.18 50% | 3.45 58% | 1.78 79% | 3.59 57% |
| Colorchecker dE 2000 max. * | 16.47 | ||||||||
| Greyscale dE 2000 * | 3.39 | 4.68 -38% | 2.37 30% | 7.95 -135% | 5.63 -66% | 4.54 -34% | 2.67 21% | 1.38 59% | 4.25 -25% |
| Gamma | 1.96 112% | 2.31 95% | 2.43 91% | 2.16 102% | 2.33 94% | 2.15 102% | 2.34 94% | 2.24 98% | 2.56 86% |
| CCT | 6451 101% | 6652 98% | 6941 94% | 6565 99% | 6533 99% | 7083 92% | 6164 105% | 6366 102% | 7148 91% |
| Color Space (Percent of AdobeRGB 1998) (%) | 38 | 88 132% | 45.7 20% | 47.28 24% | |||||
| Color Space (Percent of sRGB) (%) | 60 | 70.1 17% | 84.38 41% | ||||||
| Média Total (Programa/Configurações) | -22% /
-22% | 8% /
8% | -27% /
-20% | 2% /
-6% | -7% /
-7% | 22% /
20% | 27% /
27% | -17% /
-17% |
* ... menor é melhor
| Cinebench R10 | |
| Rendering Multiple CPUs 32Bit (classificar por valor) | |
| Dell Venue 10 Pro 5056 | |
| Dell Venue 10 Pro 5055 | |
| HP Pro Tablet 10 EE G1 | |
| Lenovo Thinkpad Tablet 10 2nd Gen | |
| Asus Transformer Book T100HA-C4-GR | |
| Rendering Single 32Bit (classificar por valor) | |
| Dell Venue 10 Pro 5056 | |
| Dell Venue 10 Pro 5055 | |
| HP Pro Tablet 10 EE G1 | |
| Lenovo Thinkpad Tablet 10 2nd Gen | |
| Asus Transformer Book T100HA-C4-GR | |
| Geekbench 3 | |
| 32 Bit Single-Core Score (classificar por valor) | |
| Dell Venue 10 Pro 5056 | |
| HP Pro Tablet 10 EE G1 | |
| LG G Pad II 10.1 | |
| Amazon Fire HD 10 inch 2015 | |
| Samsung Galaxy Tab A 9.7 SM-T555 | |
| 32 Bit Multi-Core Score (classificar por valor) | |
| Dell Venue 10 Pro 5056 | |
| HP Pro Tablet 10 EE G1 | |
| LG G Pad II 10.1 | |
| Amazon Fire HD 10 inch 2015 | |
| Samsung Galaxy Tab A 9.7 SM-T555 | |
| JetStream 1.1 - 1.1 Total (classificar por valor) | |
| Dell Venue 10 Pro 5056 | |
| HP Pro Tablet 10 EE G1 | |
| Google Pixel C | |
| Lenovo Yoga Tab 3 Pro 10 YT3-X90L | |
| Samsung Galaxy Tab S2 9.7 LTE | |
| Peacekeeper - --- (classificar por valor) | |
| Dell Venue 10 Pro 5056 | |
| Dell Venue 10 Pro 5055 | |
| HP Pro Tablet 10 EE G1 | |
| Apple iPad Air 2 2014 | |
| Browsermark - 2.1 (classificar por valor) | |
| Dell Venue 10 Pro 5056 | |
| Apple iPad Air 2 2014 | |
| Google Pixel C | |
* ... menor é melhor
| 3DMark 11 - 1280x720 Performance (classificar por valor) | |
| Dell Venue 10 Pro 5056 | |
| Dell Venue 10 Pro 5055 | |
| HP Pro Tablet 10 EE G1 | |
| Lenovo Thinkpad Tablet 10 2nd Gen | |
| Asus Transformer Book T100HA-C4-GR | |
| 3DMark - 1280x720 Ice Storm Standard Score (classificar por valor) | |
| Dell Venue 10 Pro 5056 | |
| HP Pro Tablet 10 EE G1 | |
| Google Pixel C | |
| Lenovo Thinkpad Tablet 10 2nd Gen | |
| Asus Transformer Book T100HA-C4-GR | |
| 3DMark 06 - 1280x1024 Standard Score AA:0x AF:0x (classificar por valor) | |
| Dell Venue 10 Pro 5056 | |
| Asus Transformer Book T100HA-C4-GR | |
| GFXBench | |
| on screen Car Chase Onscreen (classificar por valor) | |
| Dell Venue 10 Pro 5056 | |
| Google Pixel C | |
| Lenovo Yoga Tab 3 Pro 10 YT3-X90L | |
| 1920x1080 Car Chase Offscreen (classificar por valor) | |
| Dell Venue 10 Pro 5056 | |
| Google Pixel C | |
| Lenovo Yoga Tab 3 Pro 10 YT3-X90L | |
| GFXBench 3.1 | |
| on screen Manhattan ES 3.1 Onscreen (classificar por valor) | |
| Dell Venue 10 Pro 5056 | |
| Apple iPad Air 2 2014 | |
| Google Pixel C | |
| Amazon Fire HD 10 inch 2015 | |
| Lenovo Yoga Tab 3 Pro 10 YT3-X90L | |
| 1920x1080 Manhattan ES 3.1 Offscreen (classificar por valor) | |
| Dell Venue 10 Pro 5056 | |
| Apple iPad Air 2 2014 | |
| Google Pixel C | |
| Amazon Fire HD 10 inch 2015 | |
| Lenovo Yoga Tab 3 Pro 10 YT3-X90L | |
| GFXBench 3.0 | |
| on screen Manhattan Onscreen OGL (classificar por valor) | |
| Dell Venue 10 Pro 5056 | |
| Apple iPad Air 2 2014 | |
| Google Pixel C | |
| LG G Pad II 10.1 | |
| Amazon Fire HD 10 inch 2015 | |
| Lenovo Yoga Tab 3 Pro 10 YT3-X90L | |
| 1920x1080 1080p Manhattan Offscreen (classificar por valor) | |
| Dell Venue 10 Pro 5056 | |
| Apple iPad Air 2 2014 | |
| Google Pixel C | |
| LG G Pad II 10.1 | |
| Amazon Fire HD 10 inch 2015 | |
| Lenovo Yoga Tab 3 Pro 10 YT3-X90L | |
| baixo | média | alto | ultra | |
|---|---|---|---|---|
| Trackmania Nations Forever (2008) | 128 | 29.2 | 16.8 | |
| Tomb Raider (2013) | 25.7 | 12 | 8.3 | 3.7 |
| BioShock Infinite (2013) | 20.1 | 9.3 | 7.6 | 2.4 |
| Dragon Age: Inquisition (2014) | 9.5 | 5.7 | ||
| Dirt Rally (2015) | 20.1 | 12.5 | ||
| Metal Gear Solid V (2015) | 15.1 | 9.8 | ||
| Anno 2205 (2015) | 8.1 | 3.9 | ||
| Star Wars Battlefront (2015) | 8.8 | 4.8 | ||
| Rainbow Six Siege (2015) | 11.5 | 7 |
(±) A temperatura máxima no lado superior é 42.2 °C / 108 F, em comparação com a média de 33.6 °C / 92 F , variando de 20.7 a 53.2 °C para a classe Tablet.
(-) A parte inferior aquece até um máximo de 50.2 °C / 122 F, em comparação com a média de 33.2 °C / 92 F
(+) Em uso inativo, a temperatura média para o lado superior é 28.6 °C / 83 F, em comparação com a média do dispositivo de 30 °C / ### class_avg_f### F.
| Dell Venue 10 Pro 5056 Z8500, HD Graphics (Cherry Trail) | Dell Venue 10 Pro 5055 Z3735F, HD Graphics (Bay Trail) | HP Pro Tablet 10 EE G1 Z3735F, HD Graphics (Bay Trail) | Apple iPad Air 2 2014 A8X, PowerVR GXA6850 | Google Pixel C X1, Tegra X1 Maxwell GPU | Lenovo Thinkpad Tablet 10 2nd Gen Z8700, HD Graphics (Cherry Trail) | Amazon Fire HD 10 inch 2015 MT8135, PowerVR G6200 | Asus Transformer Book T100HA-C4-GR Z8500, HD Graphics (Cherry Trail) | Samsung Galaxy Tab S2 9.7 LTE Exynos 5433, Mali-T760 MP6 | Samsung Galaxy Tab A 9.7 SM-T555 410 APQ8016, Adreno 306 | |
|---|---|---|---|---|---|---|---|---|---|---|
| Heat | -8% | 6% | 9% | 11% | -1% | 23% | 22% | 12% | 11% | |
| Maximum Upper Side * (°C) | 42.2 | 43.6 -3% | 39 8% | 36.2 14% | 42.3 -0% | 51 -21% | 30.4 28% | 35.2 17% | 40.8 3% | 37 12% |
| Maximum Bottom * (°C) | 50.2 | 47.6 5% | 44.9 11% | 42.8 15% | 36 28% | 55 -10% | 30.2 40% | 33.4 33% | 35.7 29% | 36.9 26% |
| Idle Upper Side * (°C) | 34.1 | 38 -11% | 31.1 9% | 31 9% | 31.8 7% | 27.1 21% | 29.8 13% | 27.6 19% | 31.2 9% | 33.7 1% |
| Idle Bottom * (°C) | 31.2 | 37.8 -21% | 33 -6% | 32 -3% | 28 10% | 29 7% | 28 10% | 25.8 17% | 29.1 7% | 29.8 4% |
* ... menor é melhor
| desligado | |
| Ocioso | |
| Carga |
|
Key:
min: | |
| Dell Venue 10 Pro 5056 Z8500, HD Graphics (Cherry Trail) | Dell Venue 10 Pro 5055 Z3735F, HD Graphics (Bay Trail) | HP Pro Tablet 10 EE G1 Z3735F, HD Graphics (Bay Trail) | Apple iPad Air 2 2014 A8X, PowerVR GXA6850 | Google Pixel C X1, Tegra X1 Maxwell GPU | Lenovo Thinkpad Tablet 10 2nd Gen Z8700, HD Graphics (Cherry Trail) | Amazon Fire HD 10 inch 2015 MT8135, PowerVR G6200 | Samsung Galaxy Tab S2 9.7 LTE Exynos 5433, Mali-T760 MP6 | Samsung Galaxy Tab A 9.7 SM-T555 410 APQ8016, Adreno 306 | |
|---|---|---|---|---|---|---|---|---|---|
| Power Consumption | 12% | 5% | 28% | 22% | 11% | 48% | 23% | 44% | |
| Idle Minimum * (Watt) | 3.2 | 2.8 13% | 3.5 -9% | 1.2 63% | 1.82 43% | 2.4 25% | 1.24 61% | 2.3 28% | 1.1 66% |
| Idle Average * (Watt) | 6 | 5.4 10% | 5.5 8% | 5.1 15% | 4.26 29% | 5.1 15% | 3.81 36% | 4.5 25% | 3.6 40% |
| Idle Maximum * (Watt) | 6.2 | 5.5 11% | 5.7 8% | 5.4 13% | 4.33 30% | 6 3% | 3.92 37% | 5 19% | 3.9 37% |
| Load Average * (Watt) | 14.5 | 10.9 25% | 10.7 26% | 7.9 46% | 9.82 32% | 14.7 -1% | 5.94 59% | 9.4 35% | 6.8 53% |
| Load Maximum * (Watt) | 11.2 | 11.1 1% | 12.2 -9% | 11.1 1% | 13.99 -25% | 5.94 47% | 10.4 7% | 8.4 25% |
* ... menor é melhor
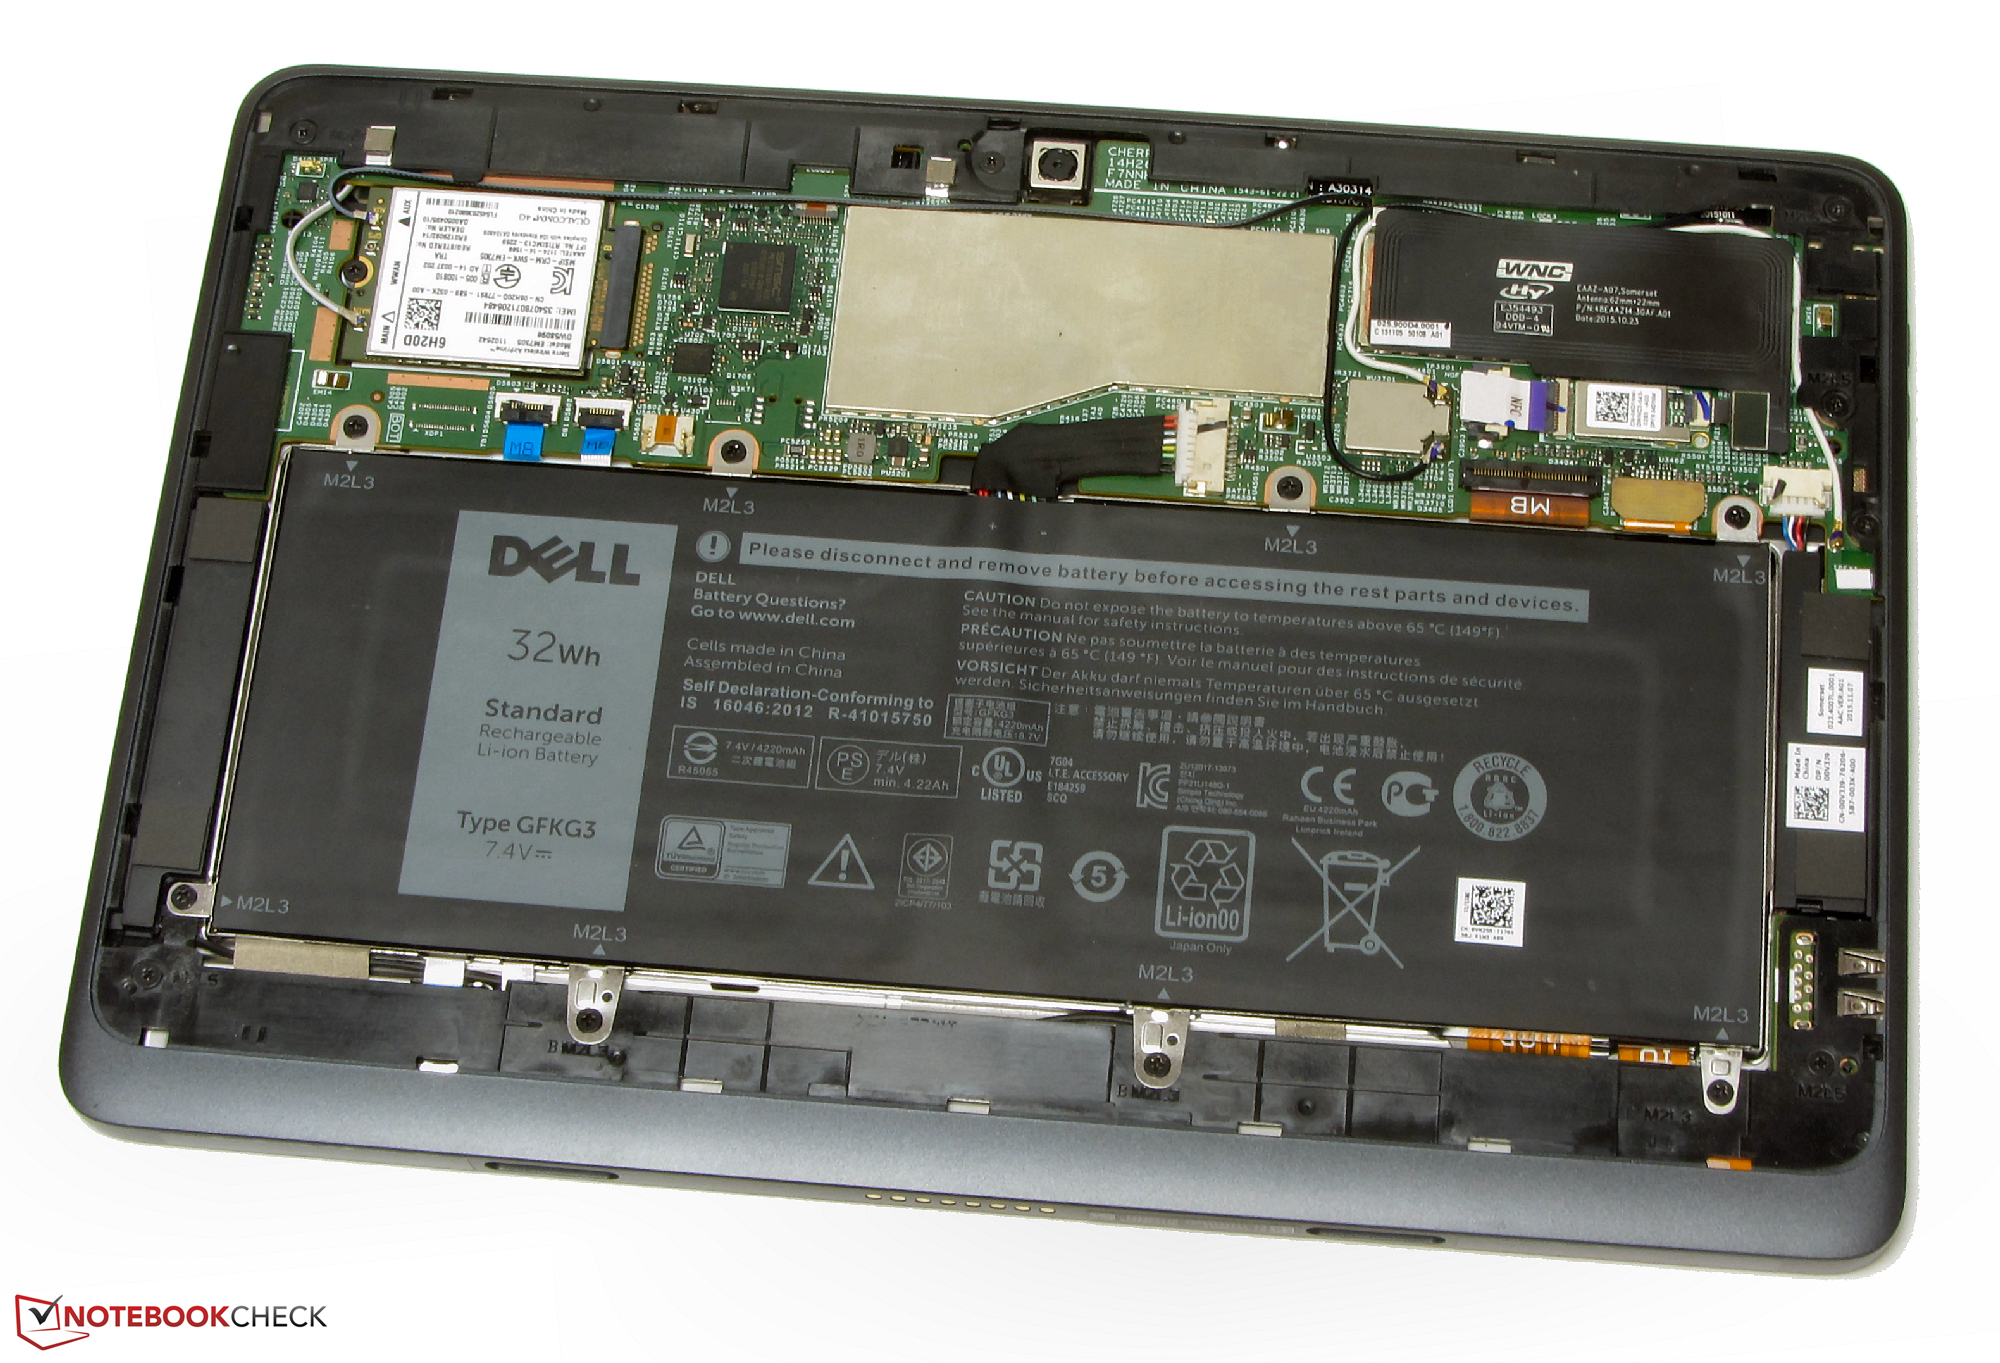
| Dell Venue 10 Pro 5056 32 Wh | Dell Venue 10 Pro 5055 32 Wh | Apple iPad Air 2 2014 28 Wh | Google Pixel C 34 Wh | Lenovo Thinkpad Tablet 10 2nd Gen 32 Wh | Amazon Fire HD 10 inch 2015 Wh | Lenovo Yoga Tab 3 Pro 10 YT3-X90L 23 Wh | Asus Transformer Book T100HA-C4-GR 30 Wh | Samsung Galaxy Tab S2 9.7 LTE 22 Wh | Samsung Galaxy Tab A 9.7 SM-T555 Wh | |
|---|---|---|---|---|---|---|---|---|---|---|
| Duração da bateria | -24% | 29% | 73% | 17% | 16% | 43% | 36% | 21% | 126% | |
| Reader / Idle (h) | 14.5 | 11.3 -22% | 22.7 57% | 34.8 140% | 14.4 -1% | 19 31% | 21 45% | 24.3 68% | 15.3 6% | 49.2 239% |
| H.264 (h) | 7.4 | 9.4 27% | 12.3 66% | 9.1 23% | 10.4 41% | 10.7 45% | 10.9 47% | |||
| WiFi v1.3 (h) | 7.5 | 10.6 41% | 7.5 0% | 7.5 0% | 9.3 24% | 9 20% | 6.6 -12% | 14.4 92% | ||
| Load (h) | 3.4 | 2.5 -26% | 3.5 3% | 4.9 44% | 5 47% | 3.1 -9% | 5.4 59% | 4.1 21% | 4.9 44% | 5 47% |
| WiFi (h) | 4.2 | 10.5 |
Pro
Contra
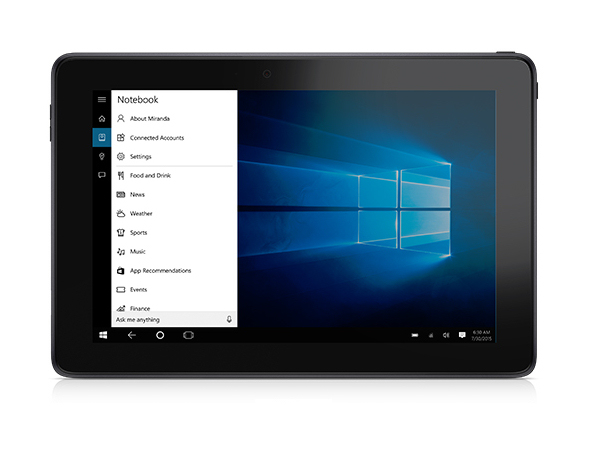
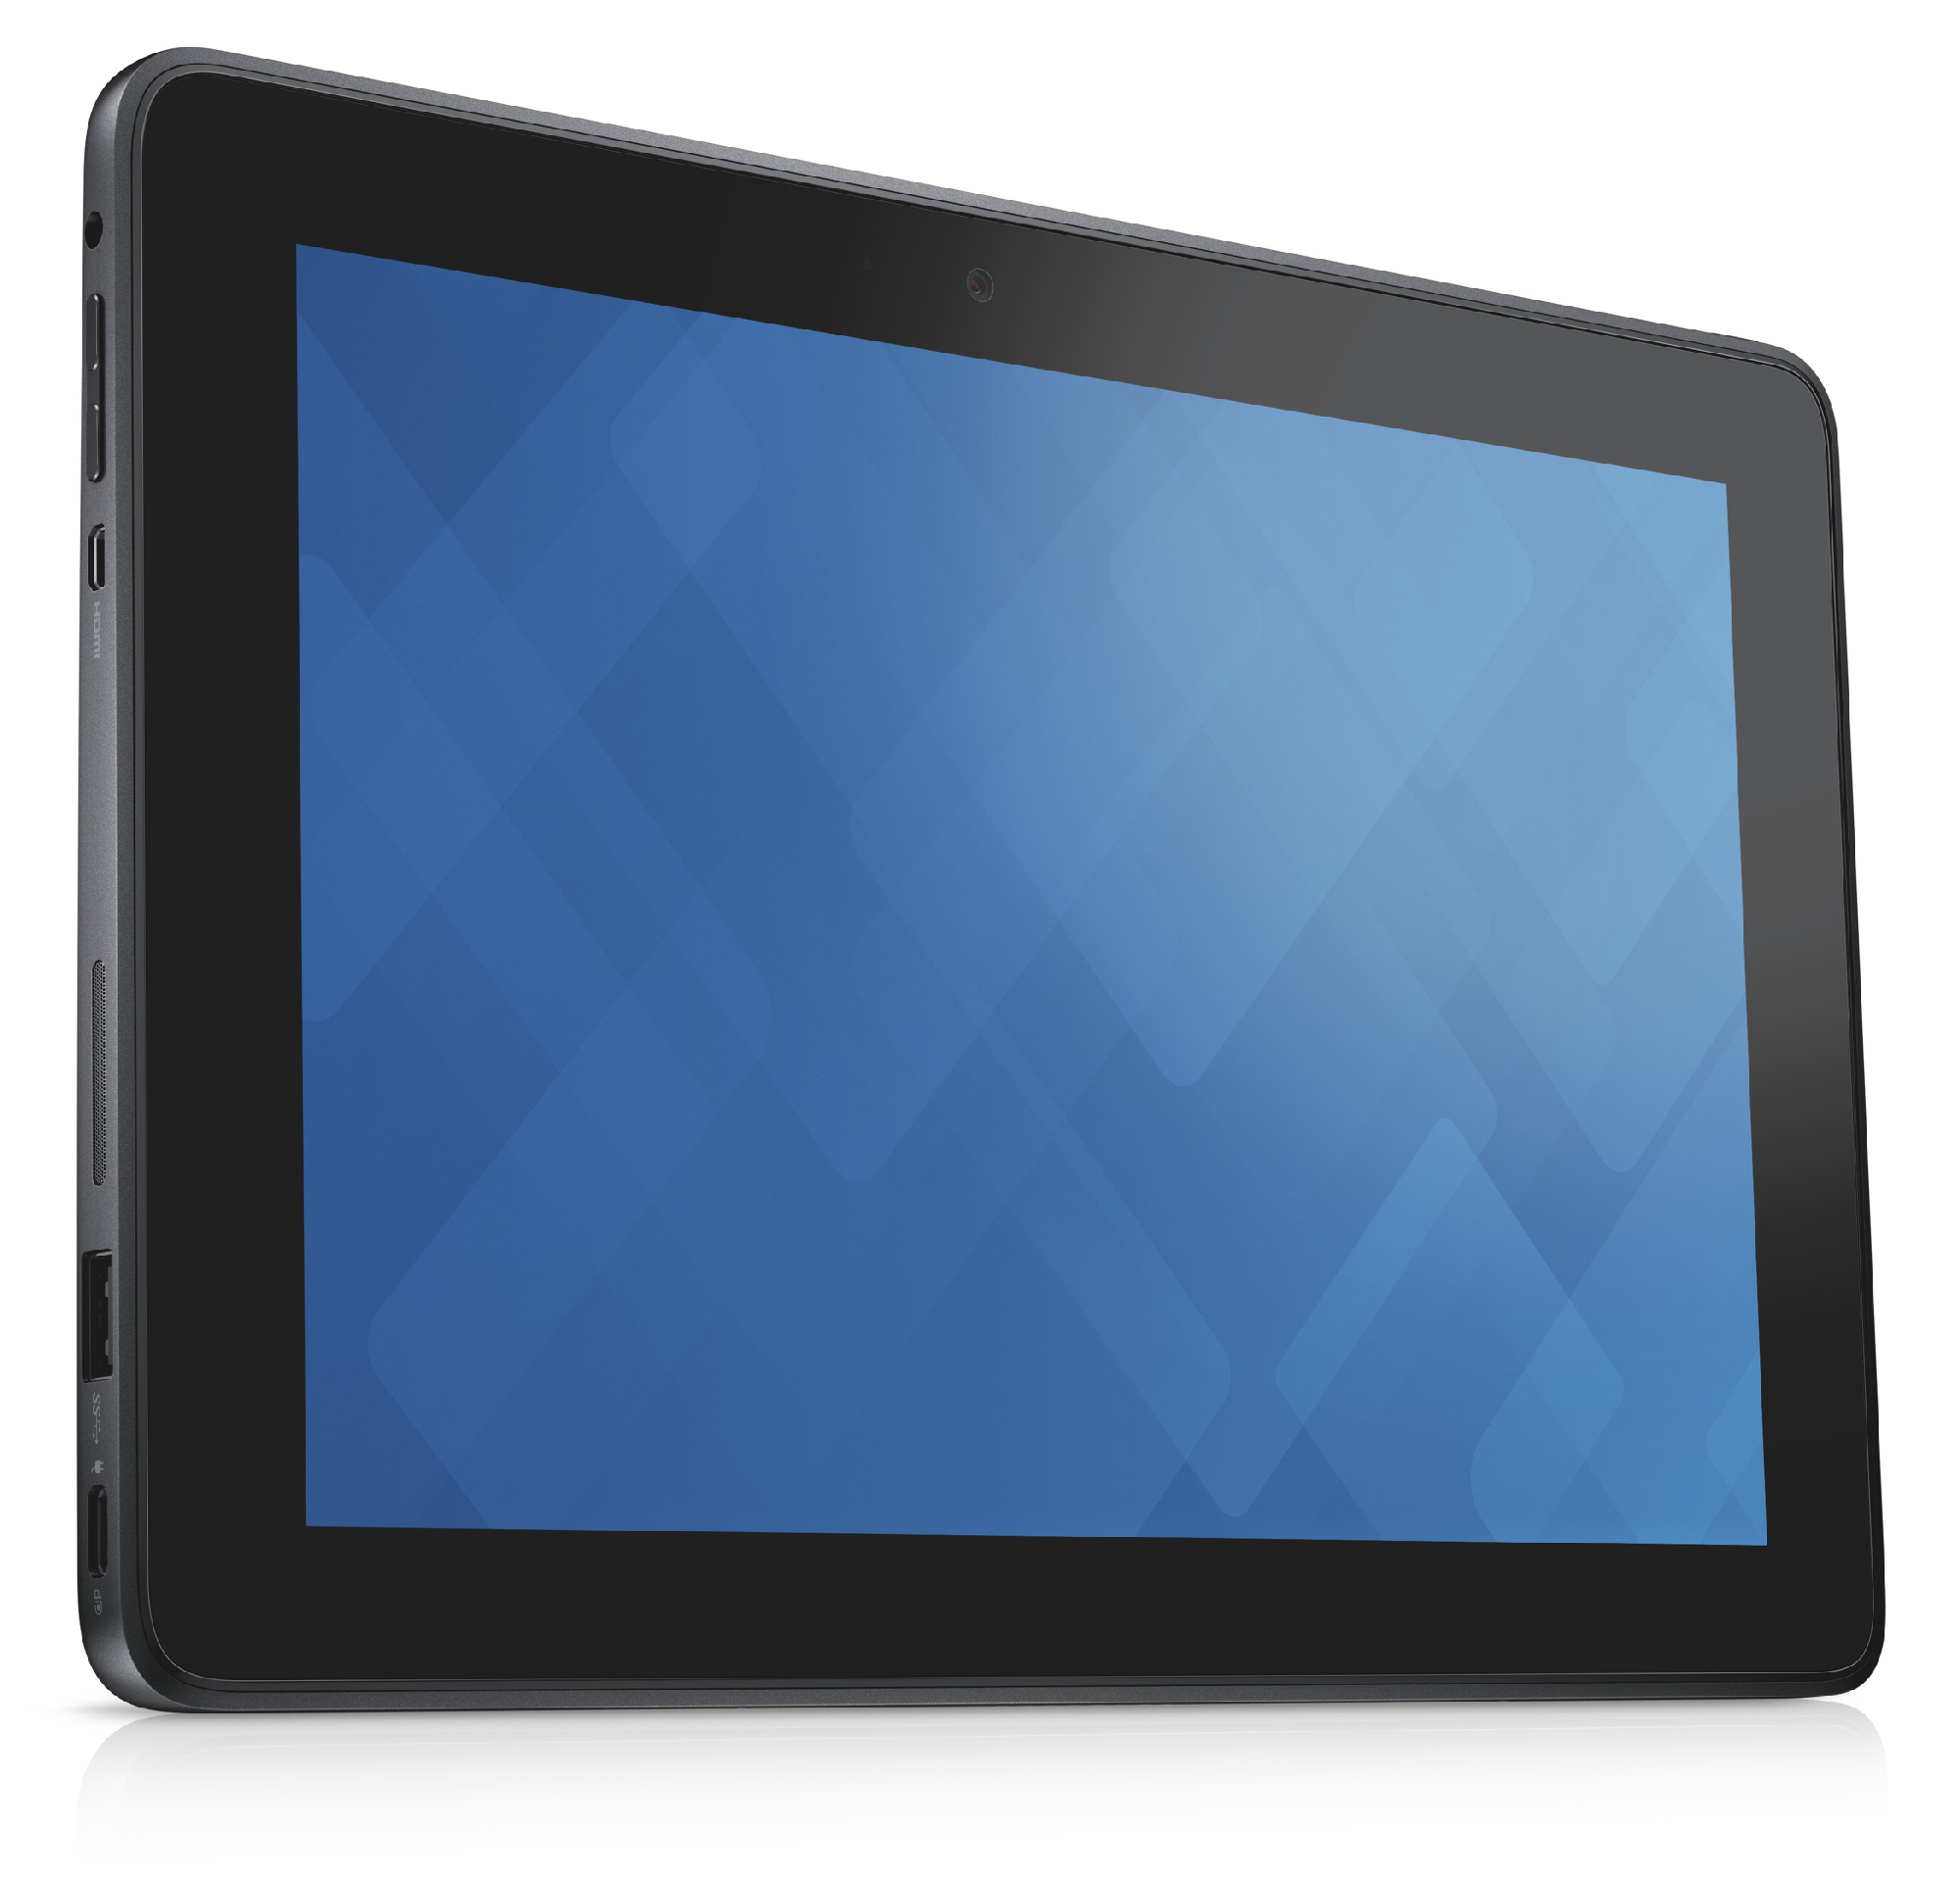
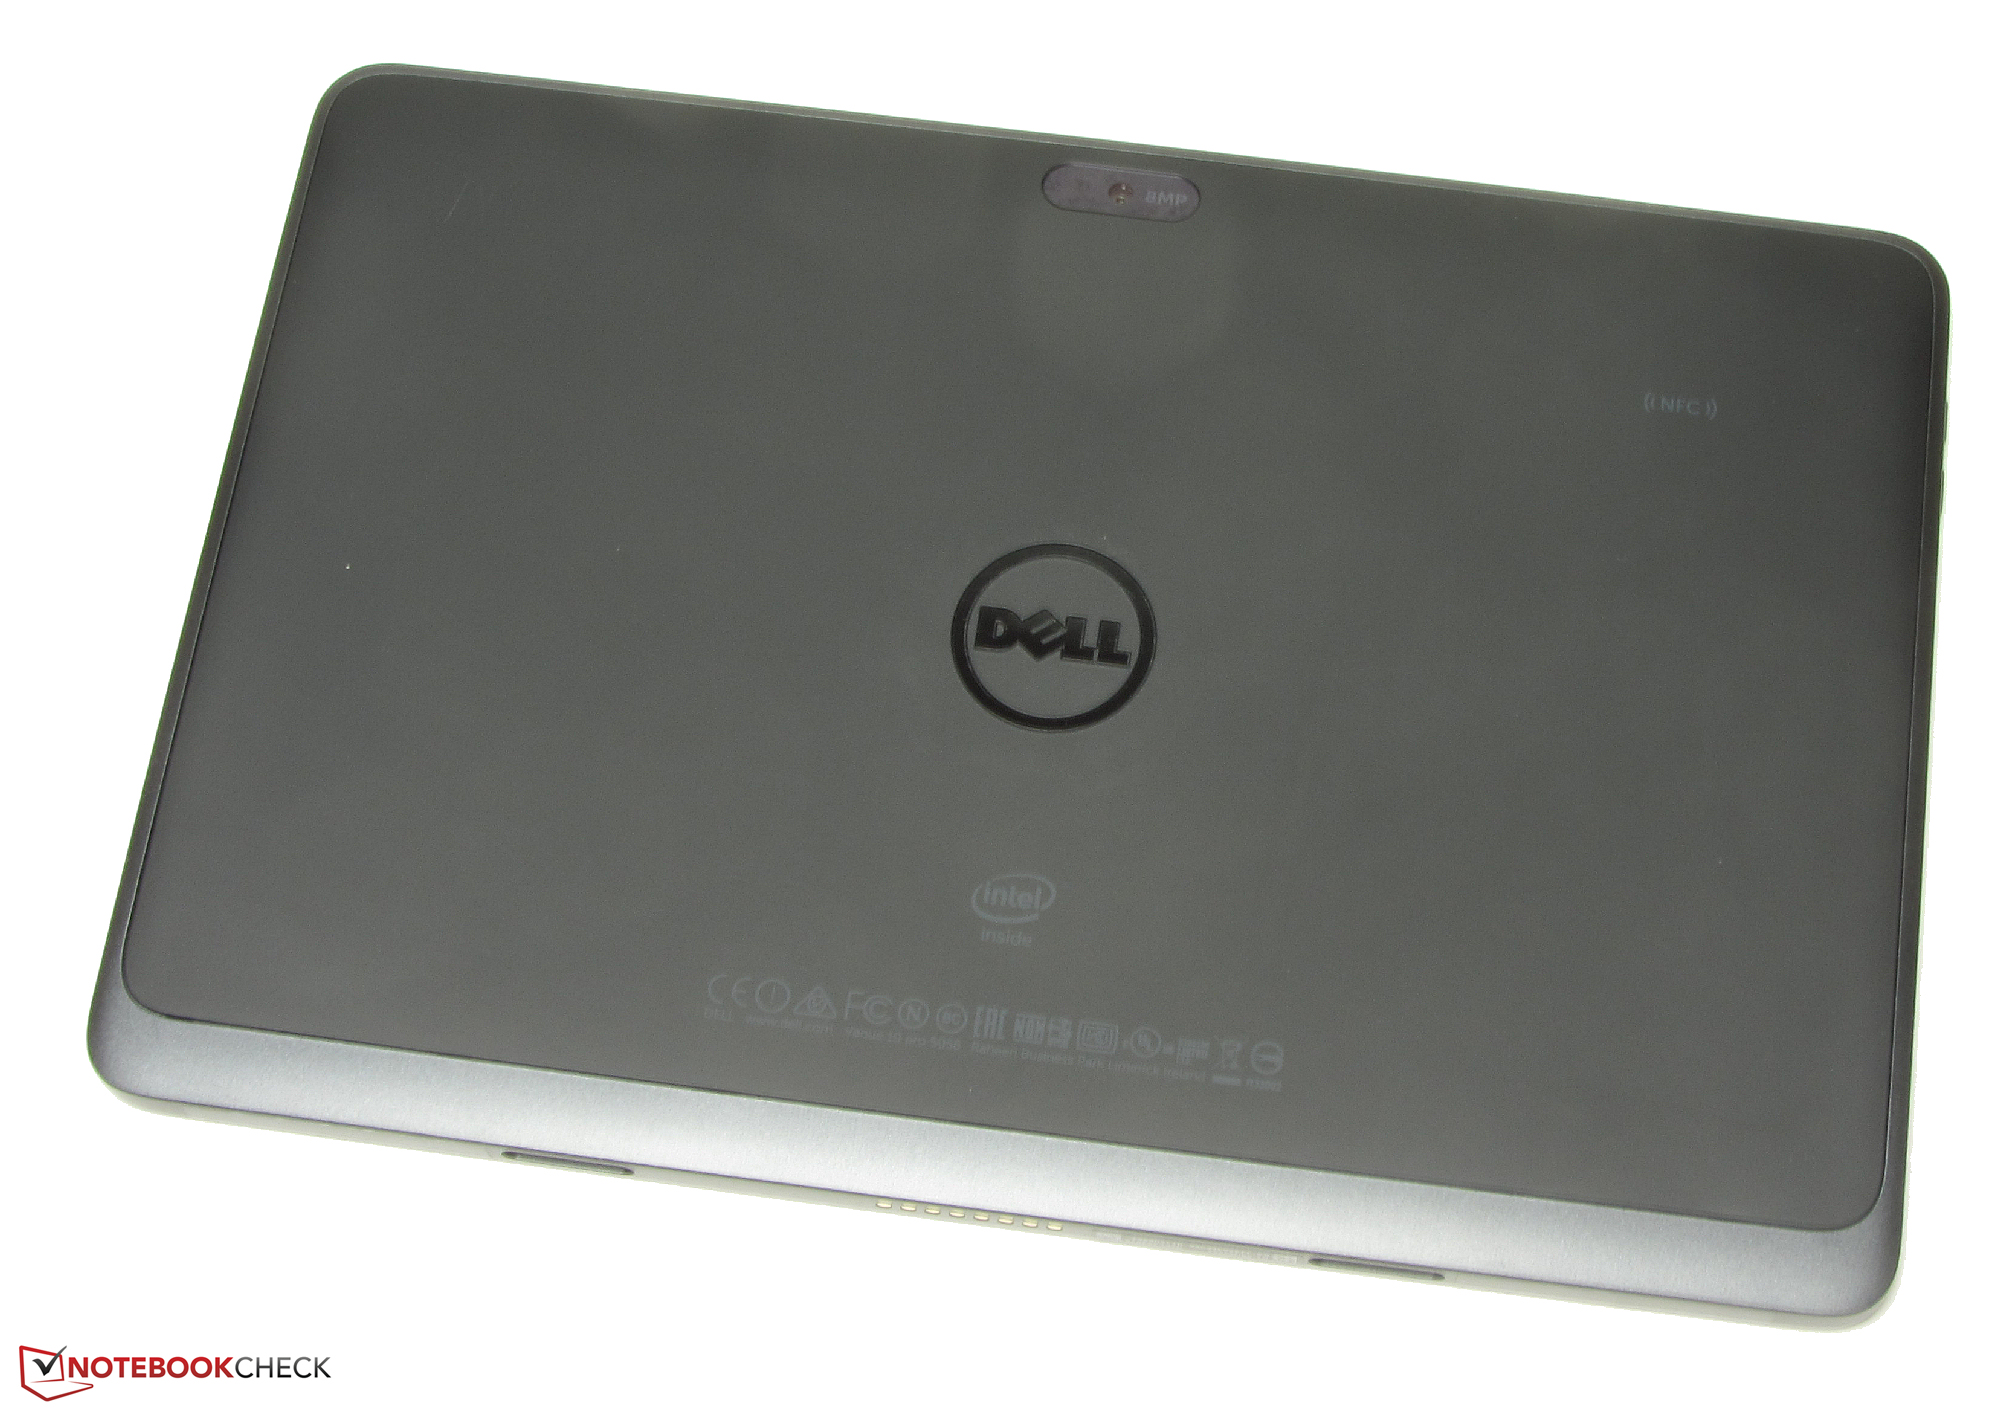
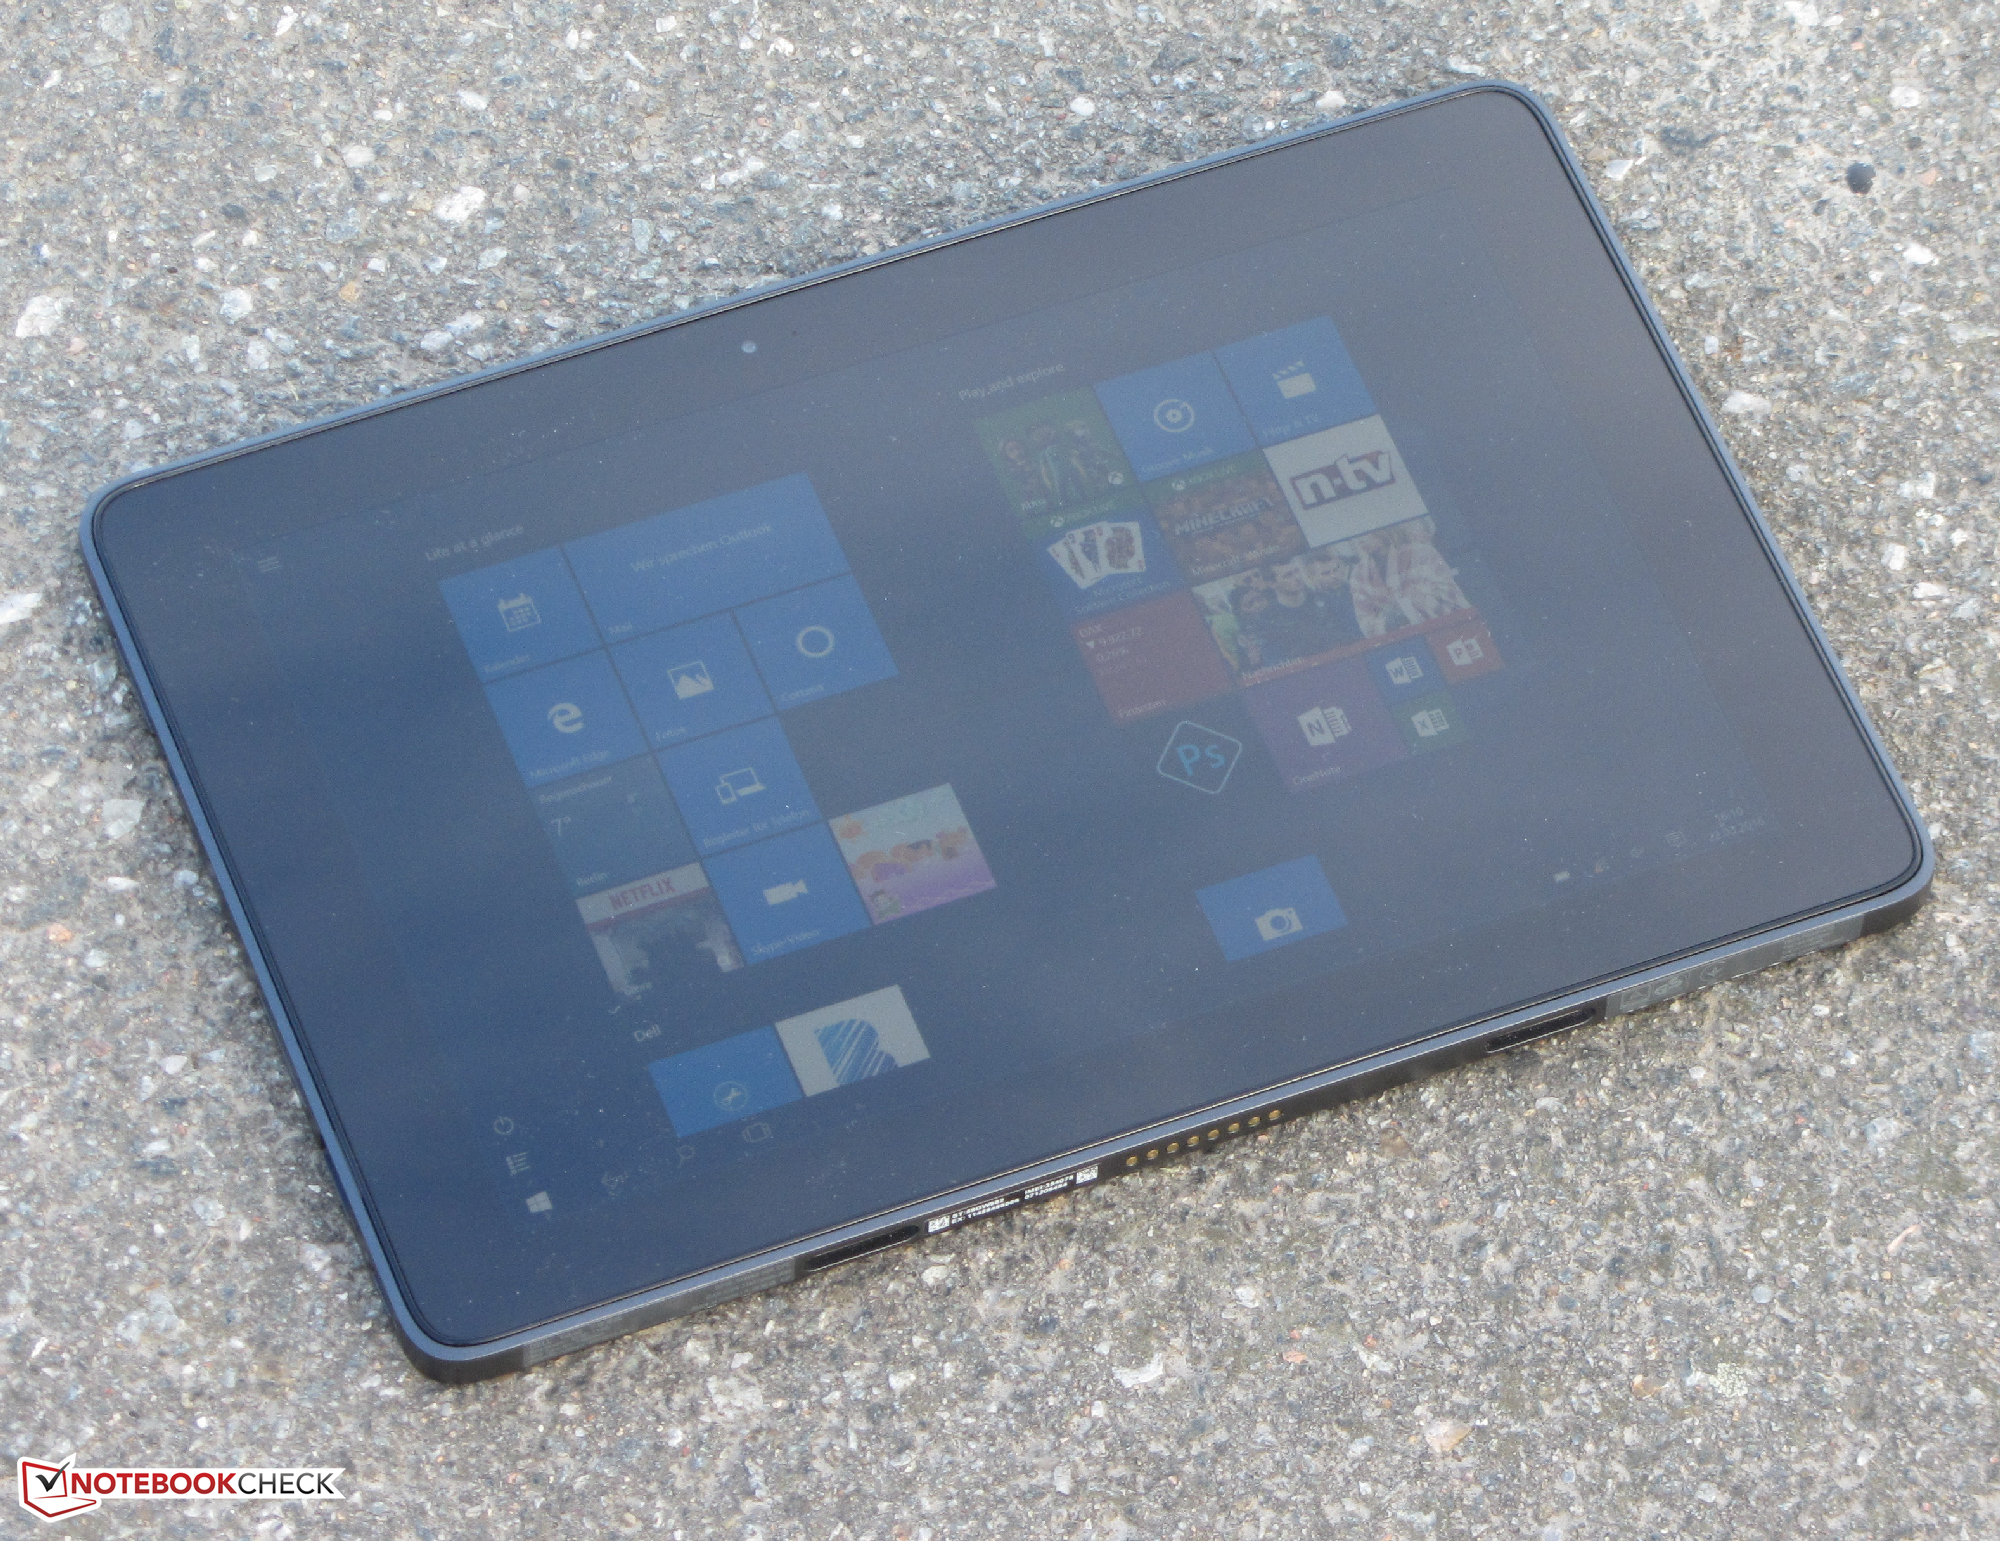
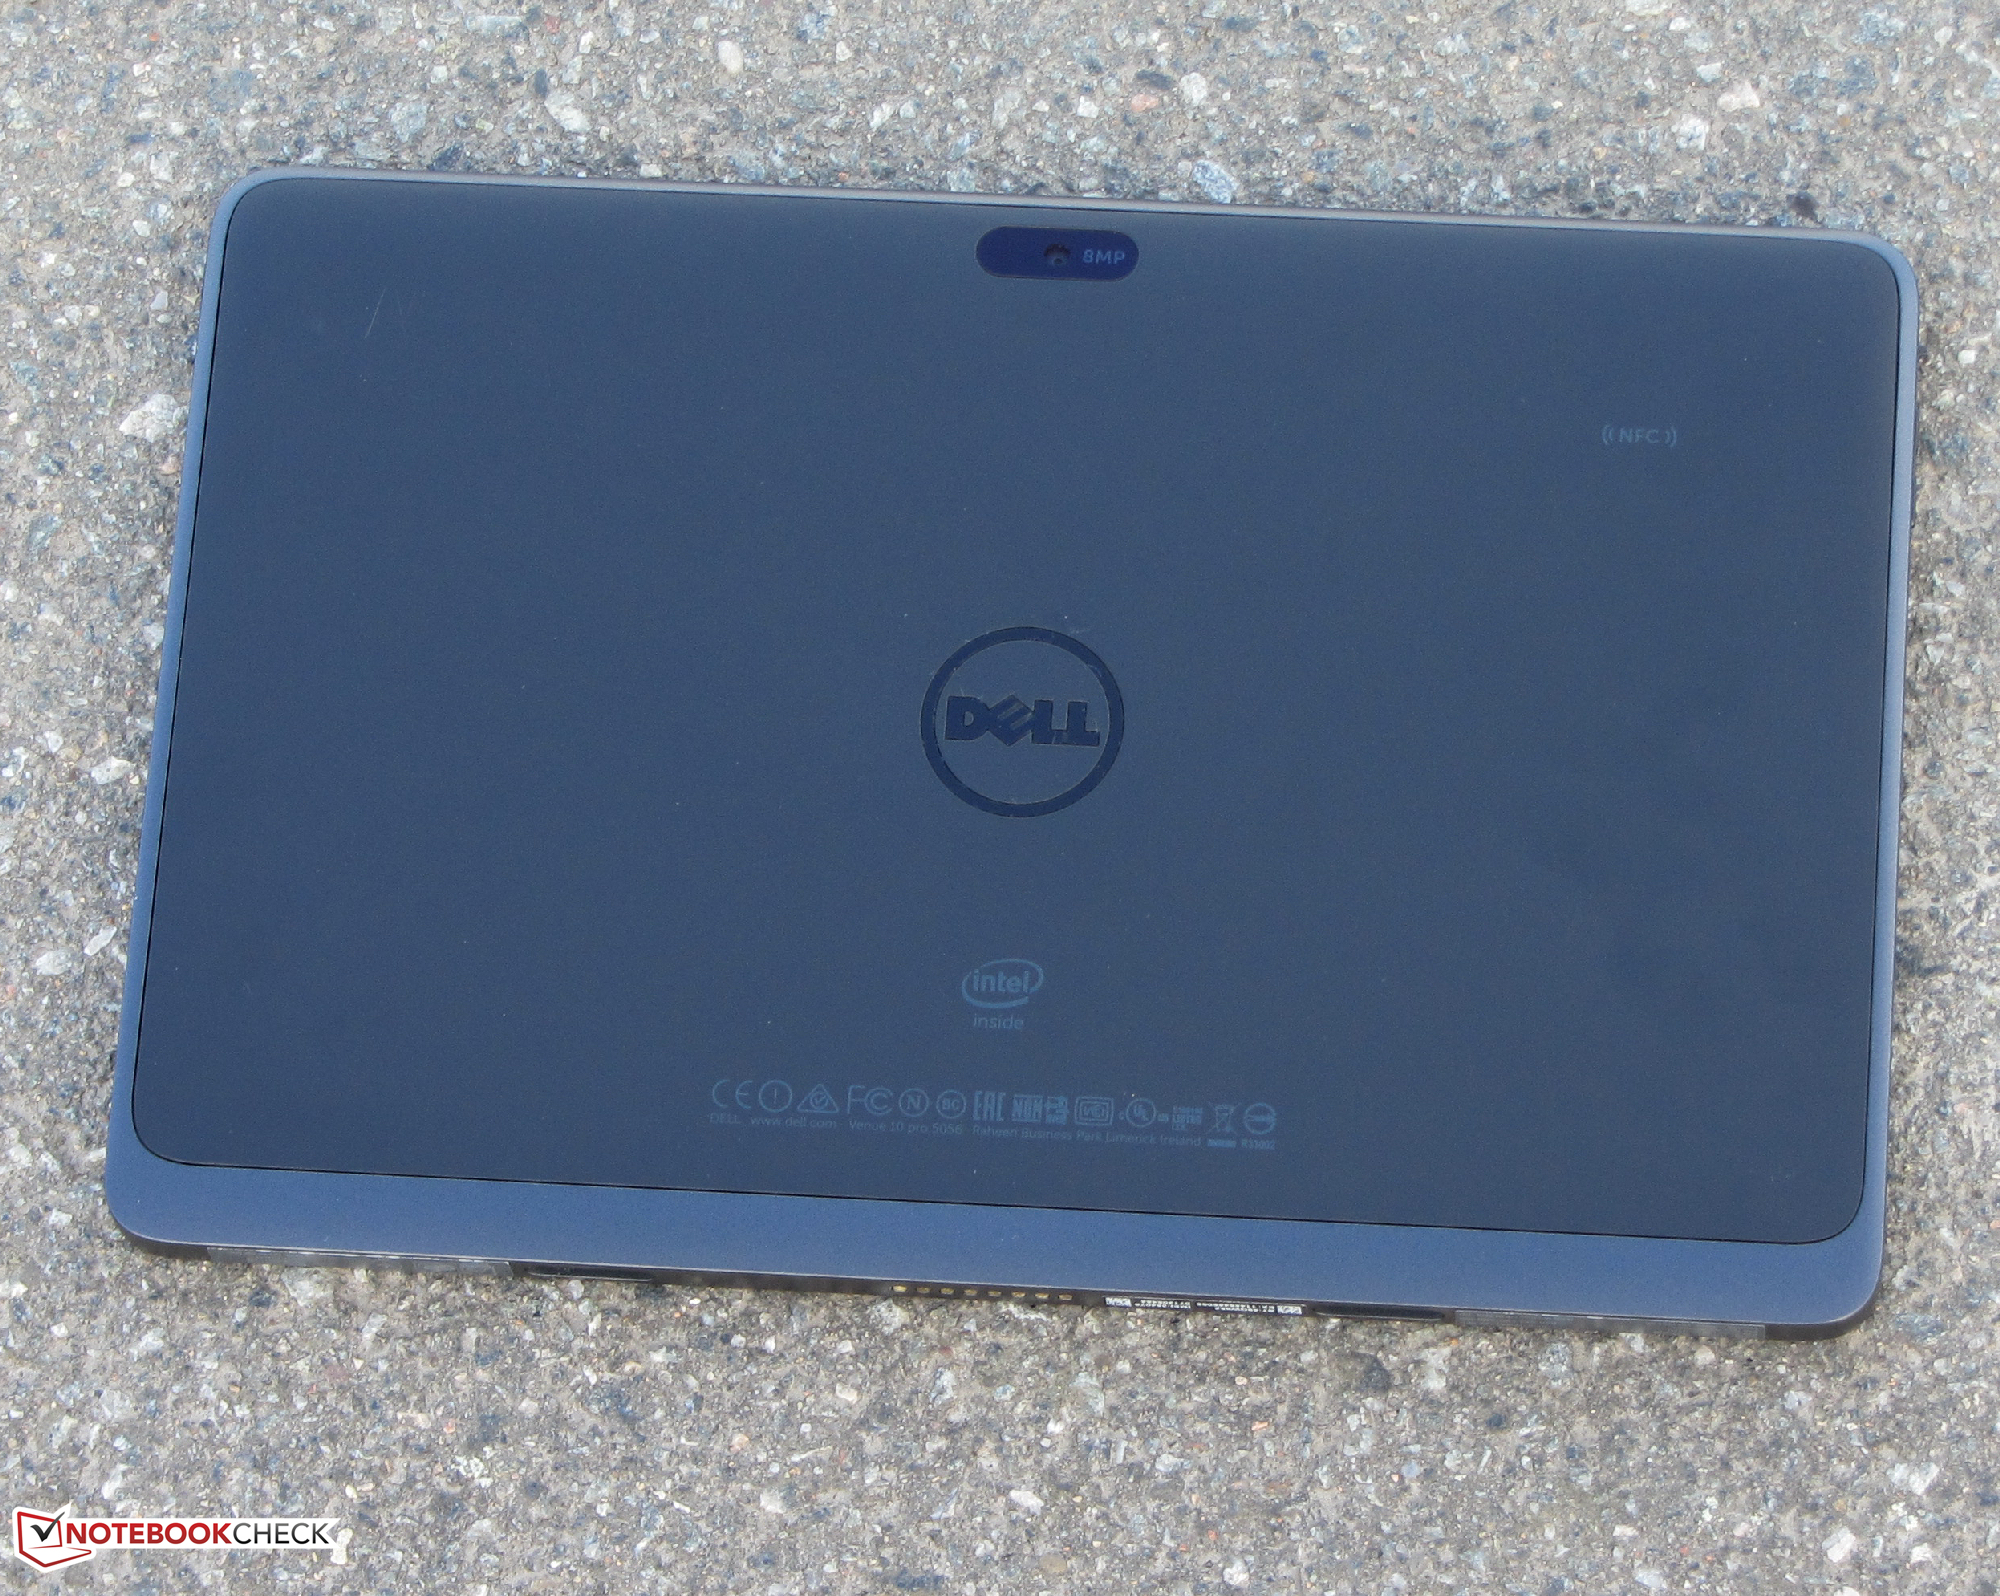
O Dell Venue 10 Pro é um sólido tablet Windows de 10,1-polegadas. Como todos os tablets Windows tablets, o Venue permite ao usuário instalar e usar aplicativos de desktop normais. A CPU somente consegue lidar com tarefas simples como processamento de textos e navegação na web. A unidade flash eMMC de 128 GB oferece um amplo armazenamento. Também gostamos da brilhante tela IPS com muito contraste - embora a tela do Venue 10 Pro 5055 era bastante mais brilhante. A duração da bateria é muito boa.
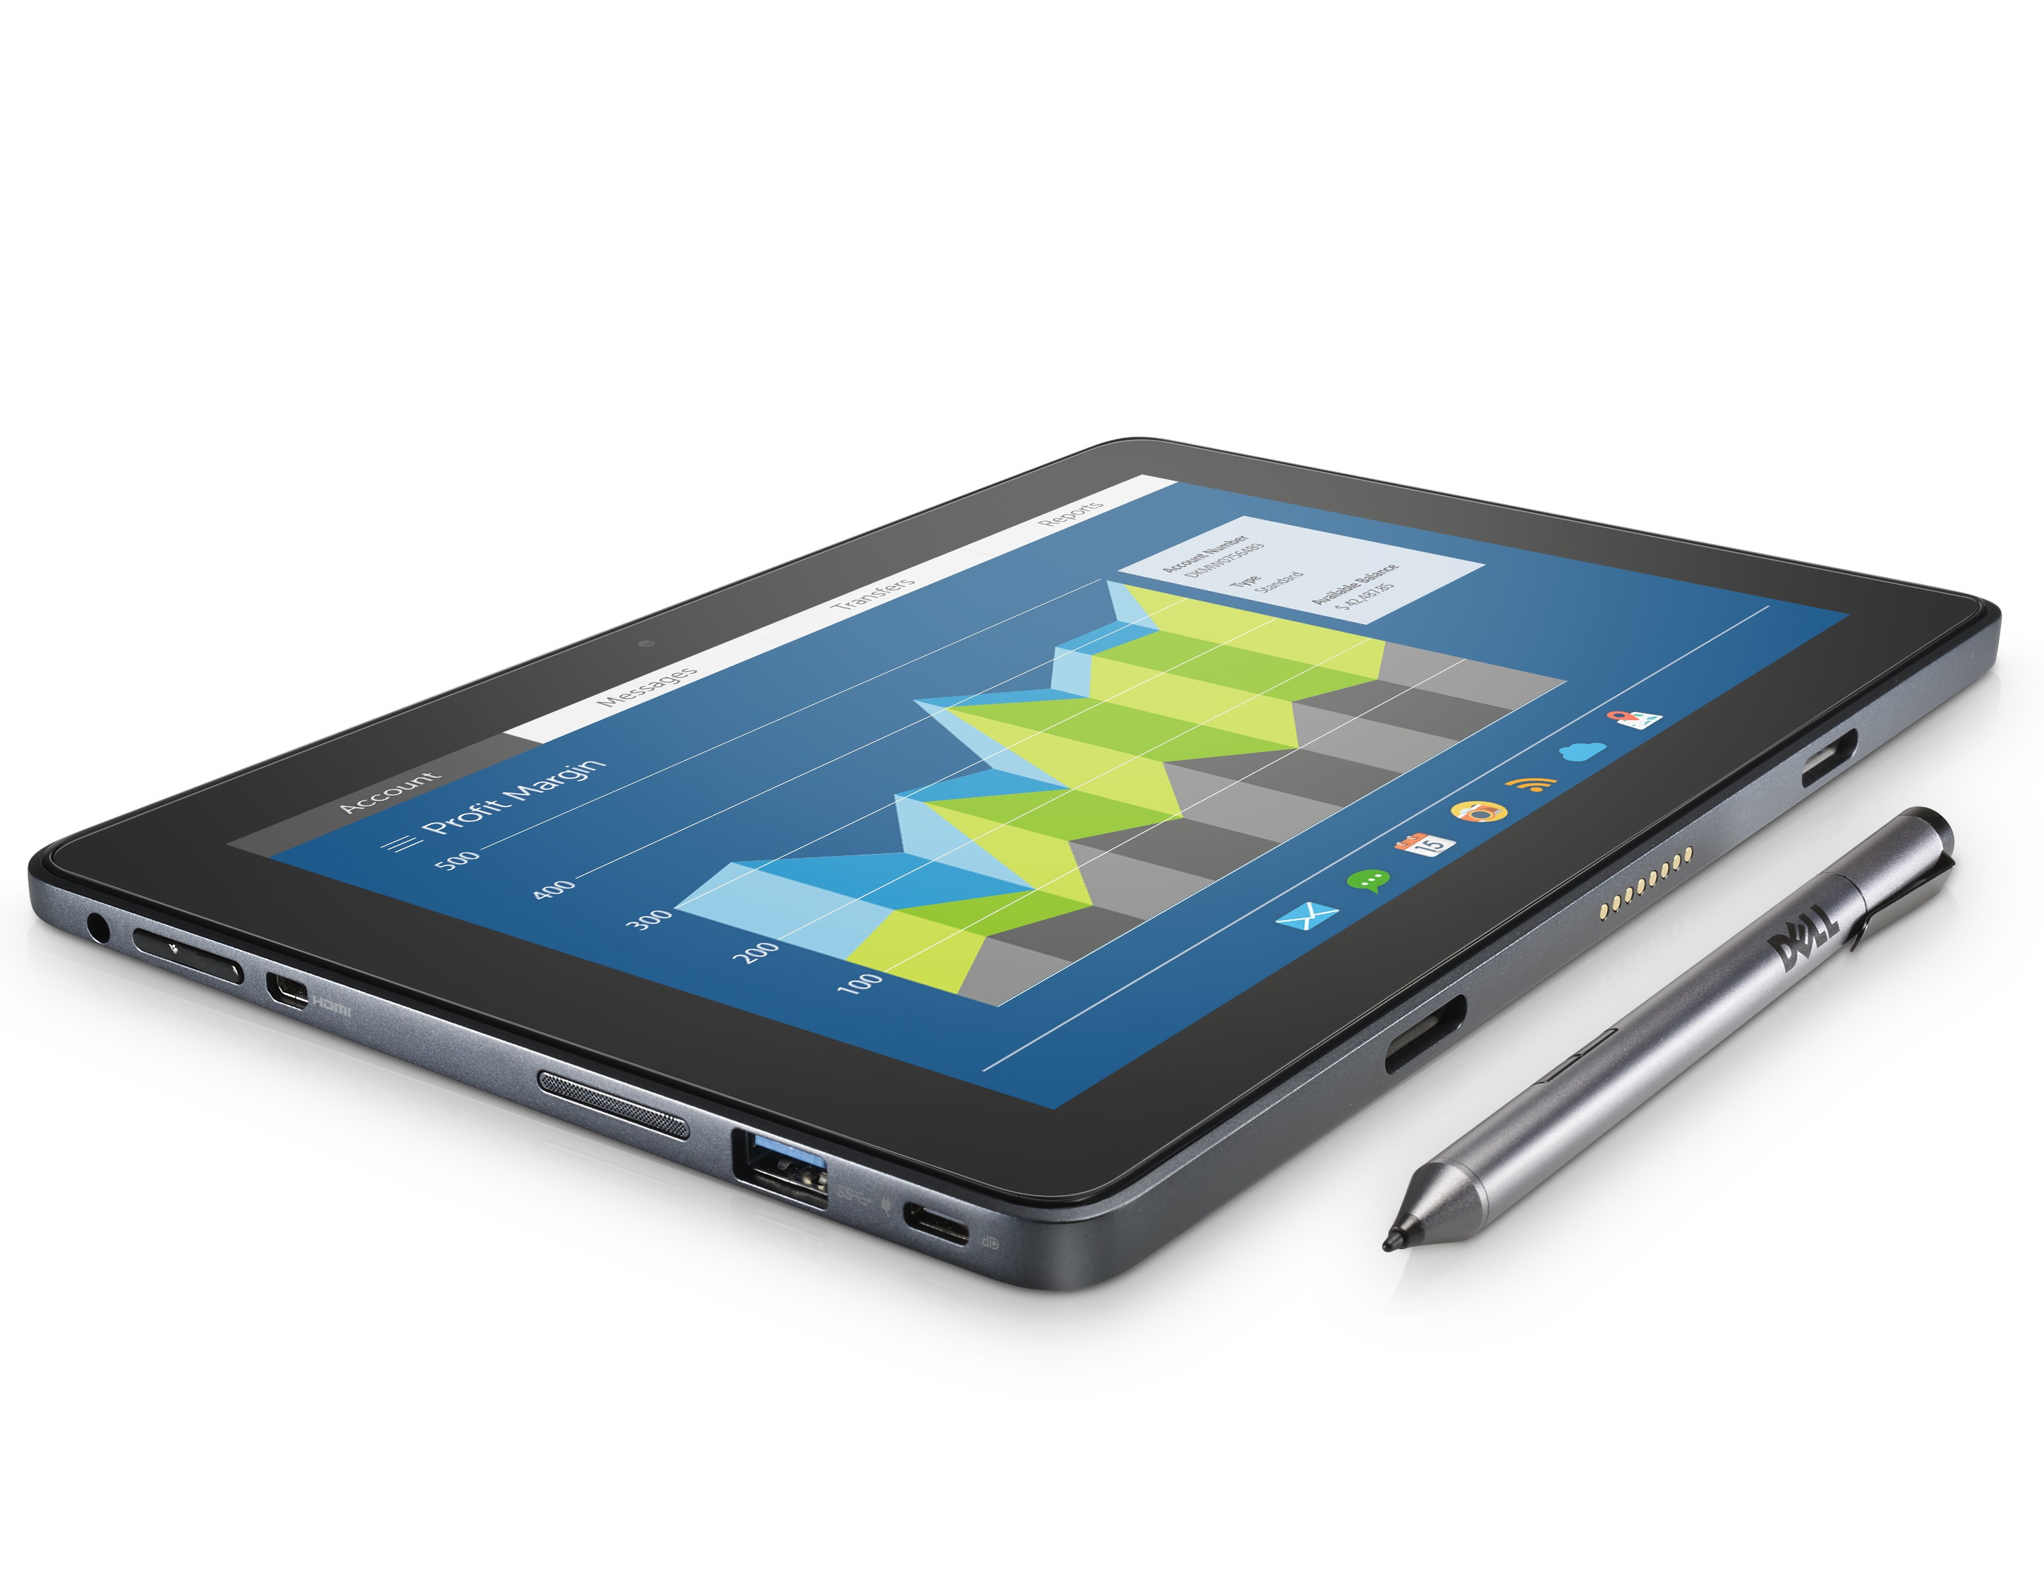
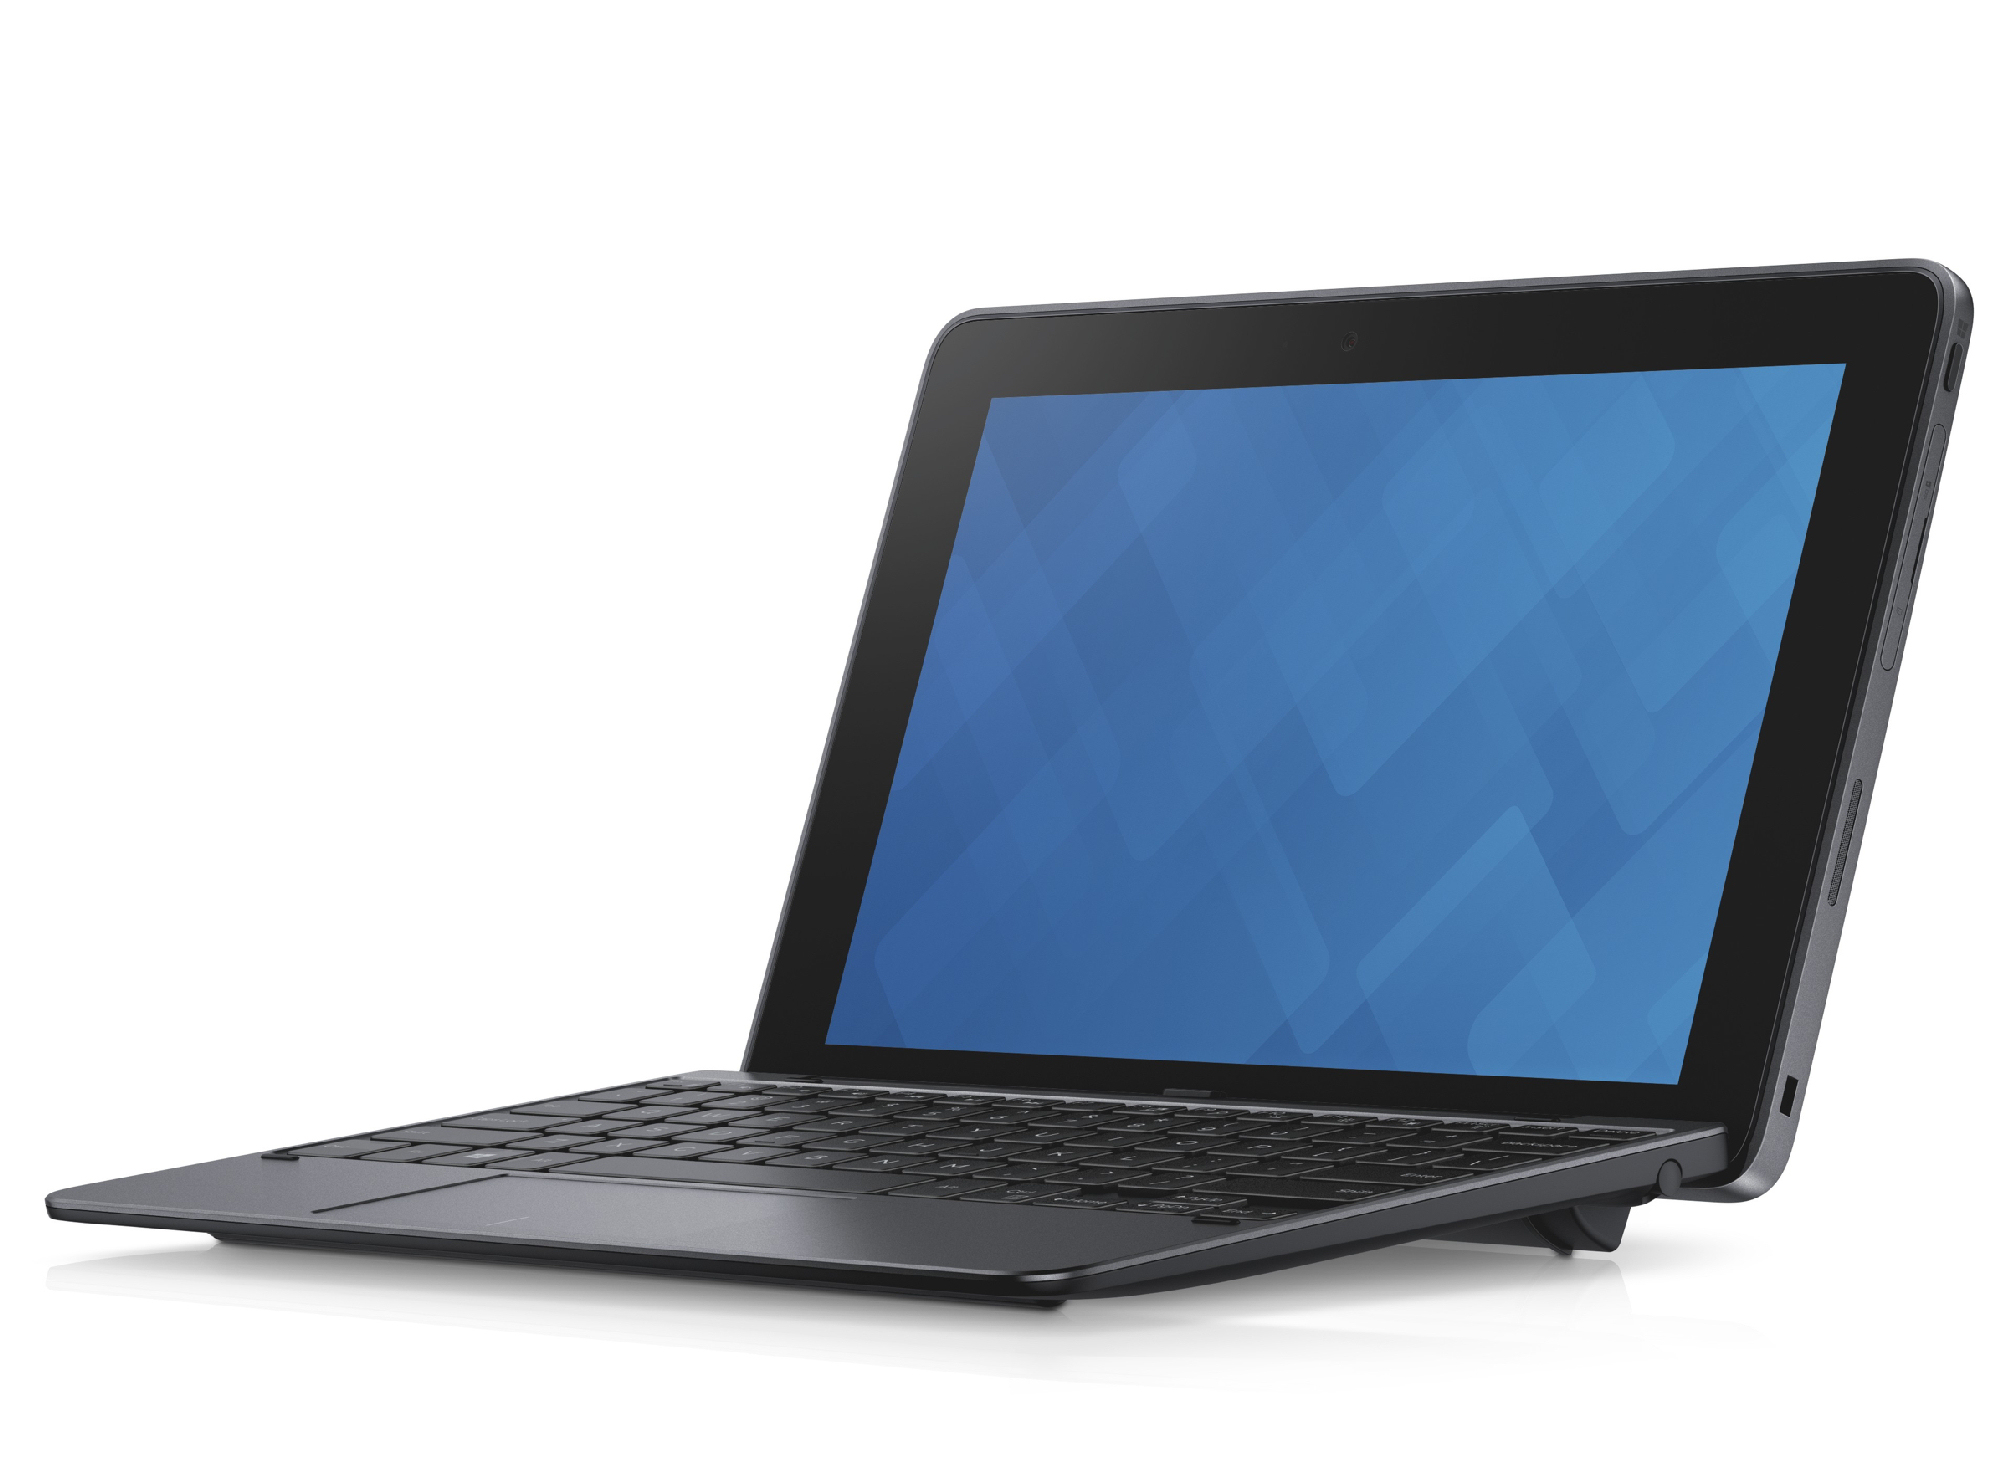
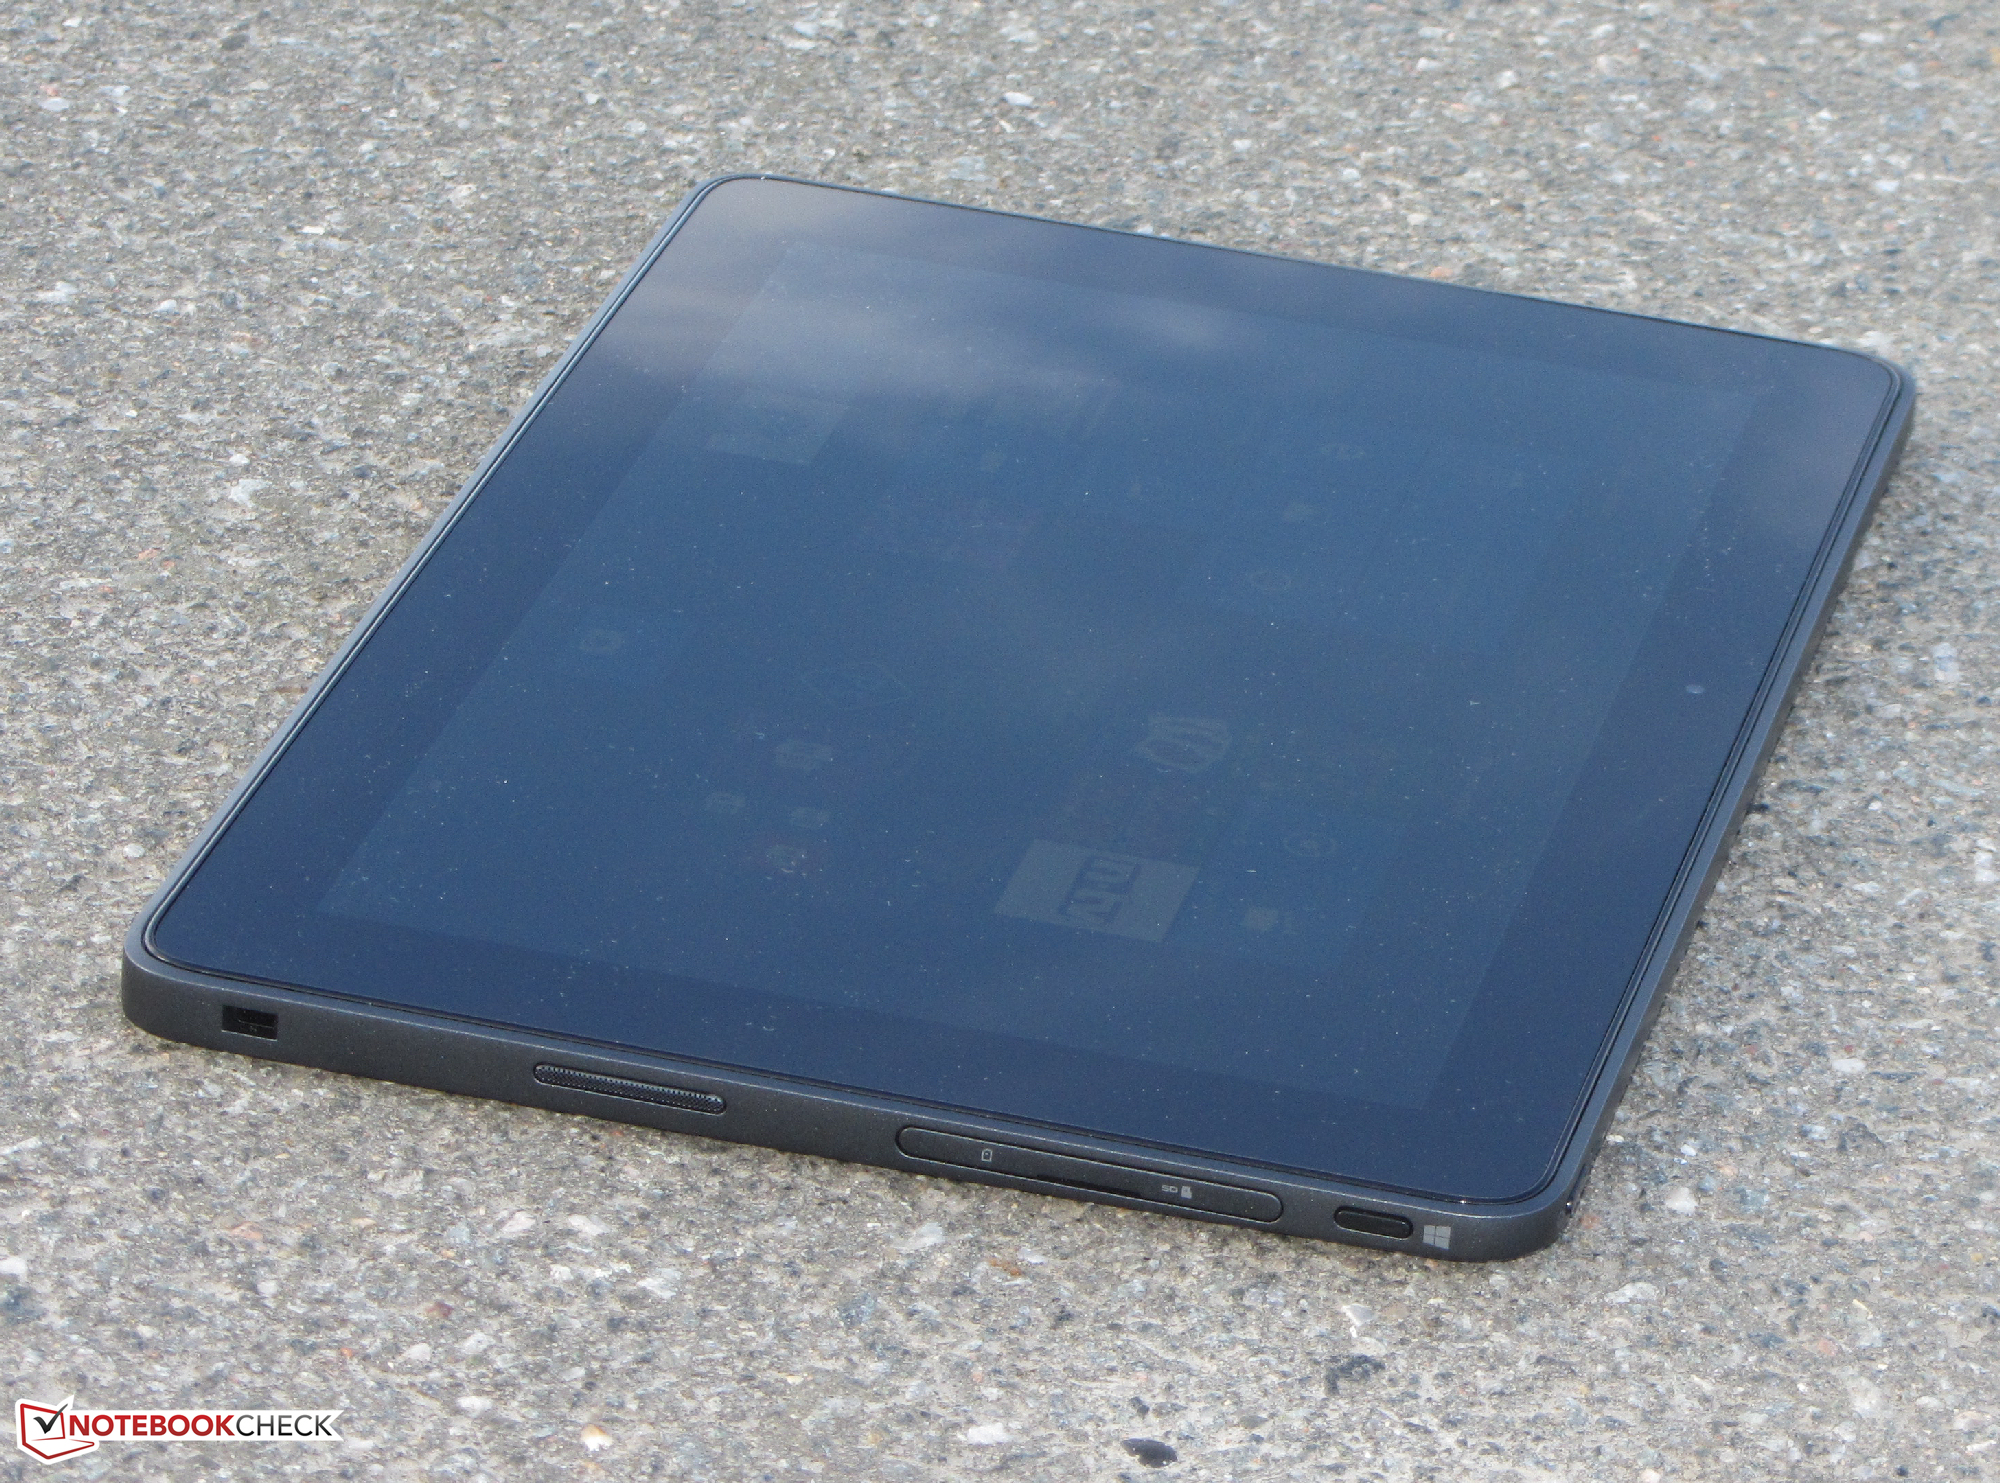
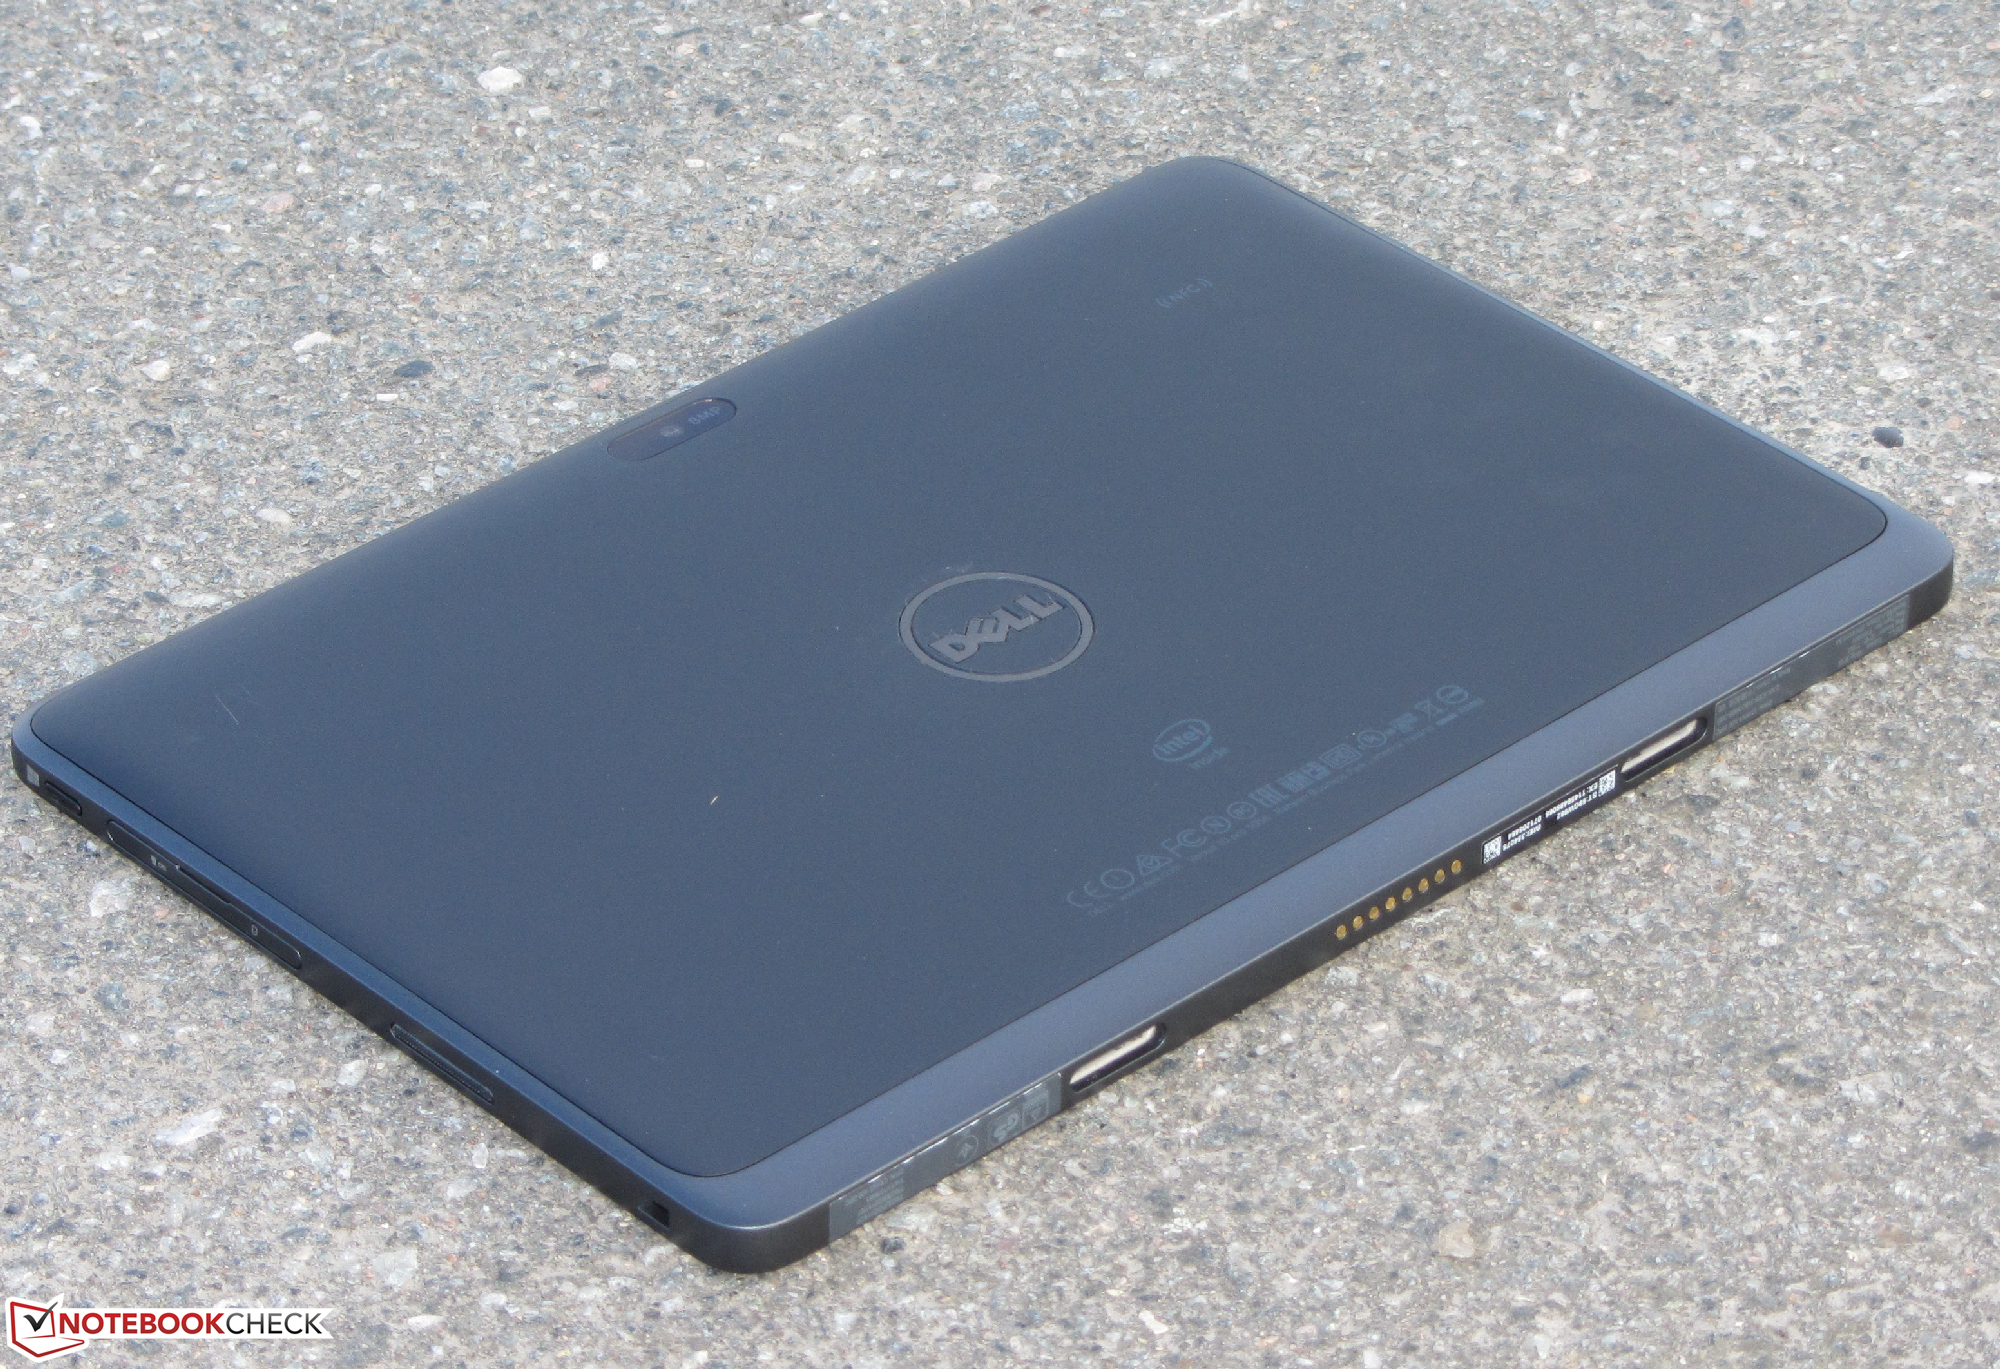
A aparência sóbria não deixa dúvidas de que este é essencialmente um aparelho empresarial. O peso de 662 g é comparativamente pesado. Com o dock de teclado opcional, o Venue chega até quase 1300 g - o mesmo que alguns portáteis e subportáteis similares.
Com um preço de 800 Euros, o Dell Venue 10 Pro não é exatamente uma barganha.
Para os usuários médios de casa, o Venue não é uma oferta muito interessante. O mesmo se aplica para a versão de gama baixa que é vendida por 530 Euros (~$600). O portáteis ou tablets de consumo são uma alternativa mais rentável.
Esta é uma versão reduzida da análise original. Você pode ler a análise completa em inglês aqui.
Dell Venue 10 Pro 5056
- 04/18/2016 v5.1 (old)
Sascha Mölck
Price comparison
