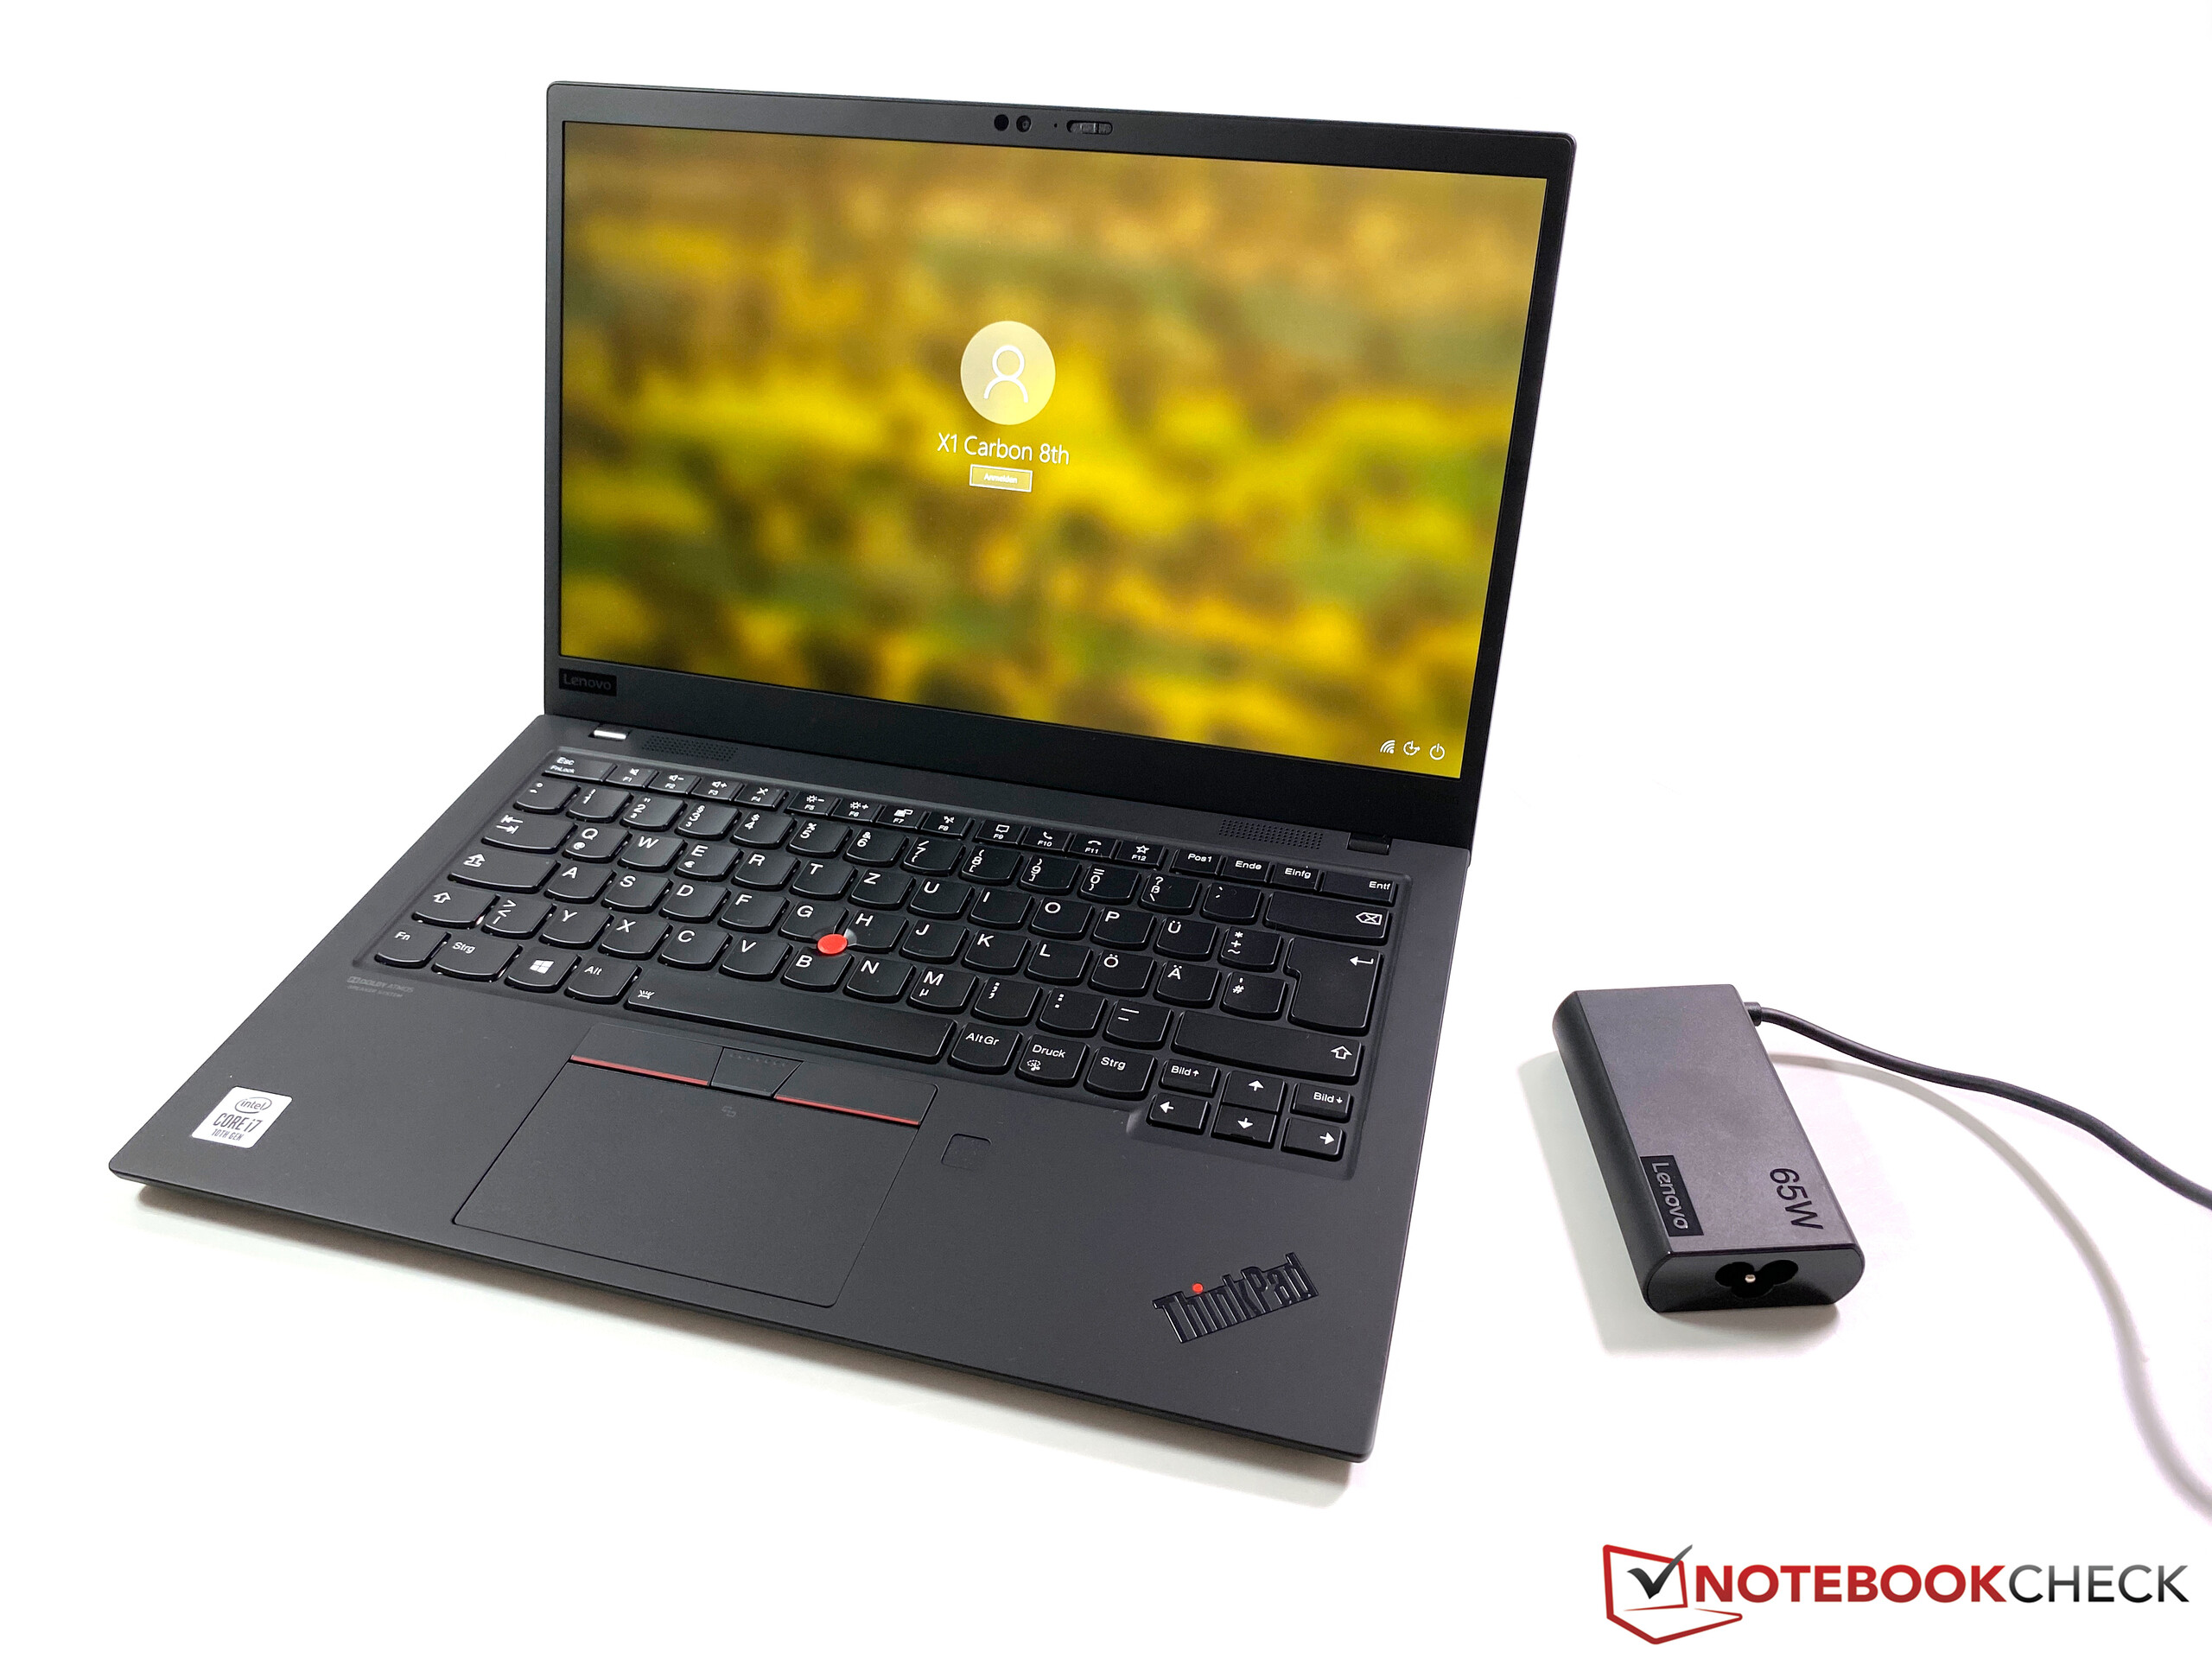
Breve Análise do ThinkPad X1 Carbon 2020: Portátil empresarial familiar com um novo adaptador de energia
Avaliação | Data | Modelo | Peso | Altura | Size | Resolução | Preço |
|---|---|---|---|---|---|---|---|
| 90.2 % v7 (old) | 07/2020 | Lenovo ThinkPad X1 Carbon 2020-20UAS04T00 i7-10510U, UHD Graphics 620 | 1.1 kg | 14.9 mm | 14.00" | 1920x1080 | |
| 90.5 % v7 (old) | 02/2019 | HP Elitebook x360 1040 G5 i7-8650U, UHD Graphics 620 | 1.4 kg | 16.9 mm | 14.00" | 1920x1080 | |
| 92.1 % v7 (old) | 06/2020 | Apple MacBook Pro 13 2020 2GHz i5 10th-Gen i5-1038NG7, Iris Plus Graphics G7 (Ice Lake 64 EU) | 1.4 kg | 15.6 mm | 13.30" | 2560x1600 | |
| 87.2 % v7 (old) | 09/2019 | Dell Latitude 7400-8N6DH i7-8665U, UHD Graphics 620 | 1.5 kg | 18.9 mm | 14.00" | 1920x1080 | |
| 88.5 % v7 (old) | 03/2020 | Lenovo ThinkPad X1 Carbon G7 20R1-000YUS i7-10510U, UHD Graphics 620 | 1.2 kg | 15.4 mm | 14.00" | 3840x2160 |


| |||||||||||||||||||||||||
iluminação: 90 %
iluminação com acumulador: 421 cd/m²
Contraste: 1563:1 (Preto: 0.27 cd/m²)
ΔE ColorChecker Calman: 4.7 | ∀{0.5-29.43 Ø4.71}
calibrated: 2
ΔE Greyscale Calman: 6.4 | ∀{0.09-98 Ø4.96}
91.5% sRGB (Argyll 1.6.3 3D)
59.5% AdobeRGB 1998 (Argyll 1.6.3 3D)
67.1% AdobeRGB 1998 (Argyll 3D)
91.6% sRGB (Argyll 3D)
68.9% Display P3 (Argyll 3D)
Gamma: 2.12
CCT: 7106 K
| Lenovo ThinkPad X1 Carbon 2020-20UAS04T00 BOE NE140FHM-N61, IPS, 1920x1080, 14" | HP Elitebook x360 1040 G5 AU Optronics AUO533D, IPS, 1920x1080, 14" | Apple MacBook Pro 13 2020 2GHz i5 10th-Gen APPA03D, IPS, 2560x1600, 13.3" | Dell Latitude 7400-8N6DH AU Optronics B140HAN, IPS, 1920x1080, 14" | Lenovo ThinkPad X1 Carbon G7 20R1-000YUS BOE NV140QUM-N53, IPS, 3840x2160, 14" | |
|---|---|---|---|---|---|
| Display | -2% | 27% | 0% | 18% | |
| Display P3 Coverage (%) | 68.9 | 64.3 -7% | 98.8 43% | 66.1 -4% | 83 20% |
| sRGB Coverage (%) | 91.6 | 94.1 3% | 99.9 9% | 95.3 4% | 99.7 9% |
| AdobeRGB 1998 Coverage (%) | 67.1 | 65.5 -2% | 86.4 29% | 67.5 1% | 83.1 24% |
| Response Times | -11% | 11% | -10% | 9% | |
| Response Time Grey 50% / Grey 80% * (ms) | 64.8 ? | 70.8 ? -9% | 46 ? 29% | 62 ? 4% | 49.2 ? 24% |
| Response Time Black / White * (ms) | 30.4 ? | 34.4 ? -13% | 32.4 ? -7% | 37.6 ? -24% | 32.2 ? -6% |
| PWM Frequency (Hz) | 2404 ? | 735 ? | 113600 ? | 201.6 ? | |
| Screen | 12% | 29% | 5% | -13% | |
| Brightness middle (cd/m²) | 422 | 416.3 -1% | 512 21% | 289 -32% | 532 26% |
| Brightness (cd/m²) | 395 | 400 1% | 491 24% | 286 -28% | 513 30% |
| Brightness Distribution (%) | 90 | 89 -1% | 91 1% | 91 1% | 90 0% |
| Black Level * (cd/m²) | 0.27 | 0.29 -7% | 0.32 -19% | 0.16 41% | 0.41 -52% |
| Contrast (:1) | 1563 | 1436 -8% | 1600 2% | 1806 16% | 1298 -17% |
| Colorchecker dE 2000 * | 4.7 | 2.69 43% | 1.7 64% | 4.7 -0% | 6.88 -46% |
| Colorchecker dE 2000 max. * | 10 | 4.95 50% | 3.4 66% | 8.7 13% | 12.65 -27% |
| Colorchecker dE 2000 calibrated * | 2 | 2.13 -7% | 1 50% | 1.3 35% | 2.52 -26% |
| Greyscale dE 2000 * | 6.4 | 2.9 55% | 1.9 70% | 6.4 -0% | 10.5 -64% |
| Gamma | 2.12 104% | 2.4 92% | 2.19 100% | 2.54 87% | 1.98 111% |
| CCT | 7106 91% | 6623 98% | 6817 95% | 5977 109% | 7394 88% |
| Color Space (Percent of AdobeRGB 1998) (%) | 59.5 | 60.1 1% | 77.4 30% | 61.2 3% | 74.1 25% |
| Color Space (Percent of sRGB) (%) | 91.5 | 94.5 3% | 99.9 9% | 95.1 4% | 99.7 9% |
| Média Total (Programa/Configurações) | -0% /
6% | 22% /
26% | -2% /
2% | 5% /
-4% |
* ... menor é melhor
Exibir tempos de resposta
| ↔ Tempo de resposta preto para branco | ||
|---|---|---|
| 30.4 ms ... ascensão ↗ e queda ↘ combinadas | ↗ 10.8 ms ascensão | 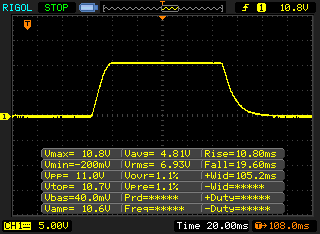 |
| ↘ 19.6 ms queda | ||
| A tela mostra taxas de resposta lentas em nossos testes e será insatisfatória para os jogadores. Em comparação, todos os dispositivos testados variam de 0.1 (mínimo) a 240 (máximo) ms. » 82 % de todos os dispositivos são melhores. Isso significa que o tempo de resposta medido é pior que a média de todos os dispositivos testados (19.8 ms). | ||
| ↔ Tempo de resposta 50% cinza a 80% cinza | ||
| 64.8 ms ... ascensão ↗ e queda ↘ combinadas | ↗ 30.8 ms ascensão | 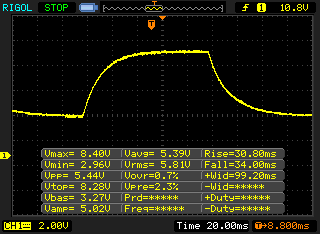 |
| ↘ 34 ms queda | ||
| A tela mostra taxas de resposta lentas em nossos testes e será insatisfatória para os jogadores. Em comparação, todos os dispositivos testados variam de 0.165 (mínimo) a 636 (máximo) ms. » 98 % de todos os dispositivos são melhores. Isso significa que o tempo de resposta medido é pior que a média de todos os dispositivos testados (31 ms). | ||
Cintilação da tela / PWM (modulação por largura de pulso)
| Tela tremeluzindo/PWM detectado | 2404 Hz | ≤ 50 % configuração de brilho | 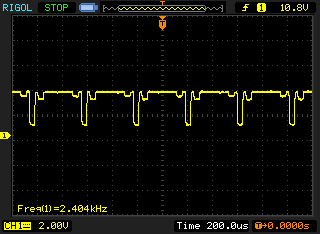 |
A luz de fundo da tela pisca em 2404 Hz (pior caso, por exemplo, utilizando PWM) Cintilação detectada em uma configuração de brilho de 50 % e abaixo. Não deve haver cintilação ou PWM acima desta configuração de brilho. A frequência de 2404 Hz é bastante alta, então a maioria dos usuários sensíveis ao PWM não deve notar nenhuma oscilação. [pwm_comparison] Em comparação: 52 % de todos os dispositivos testados não usam PWM para escurecer a tela. Se PWM foi detectado, uma média de 7757 (mínimo: 5 - máximo: 343500) Hz foi medida. | |||
Cinebench R15: CPU Single 64Bit | CPU Multi 64Bit
Blender: v2.79 BMW27 CPU
7-Zip 18.03: 7z b 4 -mmt1 | 7z b 4
Geekbench 5.5: Single-Core | Multi-Core
HWBOT x265 Benchmark v2.2: 4k Preset
LibreOffice : 20 Documents To PDF
R Benchmark 2.5: Overall mean
| Cinebench R20 / CPU (Single Core) | |
| Média da turma Subnotebook (128 - 832, n=56, últimos 2 anos) | |
| Lenovo ThinkPad X1 Carbon G7 20R1-000YUS | |
| Dell Latitude 7400-8N6DH | |
| Lenovo ThinkPad X1 Carbon 2020-20UAS04T00 | |
| Apple MacBook Pro 13 2020 2GHz i5 10th-Gen | |
| Média Intel Core i7-10510U (362 - 497, n=37) | |
| Cinebench R20 / CPU (Multi Core) | |
| Média da turma Subnotebook (579 - 8541, n=56, últimos 2 anos) | |
| Apple MacBook Pro 13 2020 2GHz i5 10th-Gen | |
| Lenovo ThinkPad X1 Carbon G7 20R1-000YUS | |
| Dell Latitude 7400-8N6DH | |
| Lenovo ThinkPad X1 Carbon 2020-20UAS04T00 | |
| Média Intel Core i7-10510U (1015 - 1897, n=38) | |
| Cinebench R15 / CPU Single 64Bit | |
| Média da turma Subnotebook (72.4 - 322, n=56, últimos 2 anos) | |
| Lenovo ThinkPad X1 Carbon 2020-20UAS04T00 | |
| Lenovo ThinkPad X1 Carbon G7 20R1-000YUS | |
| Dell Latitude 7400-8N6DH | |
| Média Intel Core i7-10510U (113 - 202, n=42) | |
| HP Elitebook x360 1040 G5 | |
| Apple MacBook Pro 13 2020 2GHz i5 10th-Gen | |
| Cinebench R15 / CPU Multi 64Bit | |
| Média da turma Subnotebook (327 - 3345, n=56, últimos 2 anos) | |
| Lenovo ThinkPad X1 Carbon G7 20R1-000YUS | |
| Apple MacBook Pro 13 2020 2GHz i5 10th-Gen | |
| Lenovo ThinkPad X1 Carbon 2020-20UAS04T00 | |
| Dell Latitude 7400-8N6DH | |
| Média Intel Core i7-10510U (482 - 856, n=45) | |
| HP Elitebook x360 1040 G5 | |
| Blender / v2.79 BMW27 CPU | |
| Média Intel Core i7-10510U (628 - 1051, n=31) | |
| Dell Latitude 7400-8N6DH | |
| Lenovo ThinkPad X1 Carbon 2020-20UAS04T00 | |
| Média da turma Subnotebook (159 - 2271, n=57, últimos 2 anos) | |
| Apple MacBook Pro 13 2020 2GHz i5 10th-Gen | |
| 7-Zip 18.03 / 7z b 4 -mmt1 | |
| Média da turma Subnotebook (2643 - 6699, n=58, últimos 2 anos) | |
| Dell Latitude 7400-8N6DH | |
| Média Intel Core i7-10510U (3747 - 4981, n=31) | |
| Lenovo ThinkPad X1 Carbon 2020-20UAS04T00 | |
| Apple MacBook Pro 13 2020 2GHz i5 10th-Gen | |
| 7-Zip 18.03 / 7z b 4 | |
| Média da turma Subnotebook (11668 - 77867, n=56, últimos 2 anos) | |
| Apple MacBook Pro 13 2020 2GHz i5 10th-Gen | |
| Lenovo ThinkPad X1 Carbon 2020-20UAS04T00 | |
| Dell Latitude 7400-8N6DH | |
| Média Intel Core i7-10510U (12196 - 21298, n=31) | |
| Geekbench 5.5 / Single-Core | |
| Média da turma Subnotebook (726 - 2224, n=48, últimos 2 anos) | |
| Apple MacBook Pro 13 2020 2GHz i5 10th-Gen | |
| Lenovo ThinkPad X1 Carbon 2020-20UAS04T00 | |
| Média Intel Core i7-10510U (977 - 1287, n=31) | |
| Geekbench 5.5 / Multi-Core | |
| Média da turma Subnotebook (2557 - 17218, n=48, últimos 2 anos) | |
| Apple MacBook Pro 13 2020 2GHz i5 10th-Gen | |
| Lenovo ThinkPad X1 Carbon 2020-20UAS04T00 | |
| Média Intel Core i7-10510U (2474 - 4484, n=31) | |
| HWBOT x265 Benchmark v2.2 / 4k Preset | |
| Média da turma Subnotebook (0.97 - 25.1, n=56, últimos 2 anos) | |
| Apple MacBook Pro 13 2020 2GHz i5 10th-Gen | |
| Lenovo ThinkPad X1 Carbon 2020-20UAS04T00 | |
| Média Intel Core i7-10510U (3.41 - 6.04, n=31) | |
| Dell Latitude 7400-8N6DH | |
| LibreOffice / 20 Documents To PDF | |
| Apple MacBook Pro 13 2020 2GHz i5 10th-Gen | |
| Média Intel Core i7-10510U (50.7 - 77.8, n=27) | |
| Média da turma Subnotebook (39.9 - 220, n=55, últimos 2 anos) | |
| Lenovo ThinkPad X1 Carbon 2020-20UAS04T00 | |
| R Benchmark 2.5 / Overall mean | |
| Apple MacBook Pro 13 2020 2GHz i5 10th-Gen | |
| Média Intel Core i7-10510U (0.637 - 0.81, n=28) | |
| Lenovo ThinkPad X1 Carbon 2020-20UAS04T00 | |
| Média da turma Subnotebook (0.4024 - 1.456, n=57, últimos 2 anos) | |
* ... menor é melhor
| PCMark 8 Home Score Accelerated v2 | 4251 pontos | |
| PCMark 8 Creative Score Accelerated v2 | 5447 pontos | |
| PCMark 8 Work Score Accelerated v2 | 5296 pontos | |
| PCMark 10 Score | 4527 pontos | |
Ajuda | ||
| DPC Latencies / LatencyMon - interrupt to process latency (max), Web, Youtube, Prime95 | |
| Lenovo ThinkPad X1 Carbon 2020-20UAS04T00 | |
* ... menor é melhor
| Lenovo ThinkPad X1 Carbon 2020-20UAS04T00 Samsung SSD PM981a MZVLB512HBJQ | HP Elitebook x360 1040 G5 Samsung SSD PM981 MZVLB512HAJQ | Apple MacBook Pro 13 2020 2GHz i5 10th-Gen Apple SSD SM0512F | Dell Latitude 7400-8N6DH Samsung SSD PM981 MZVLB512HAJQ | Lenovo ThinkPad X1 Carbon G7 20R1-000YUS WDC PC SN730 SDBPNTY-512G | Média Samsung SSD PM981a MZVLB512HBJQ | |
|---|---|---|---|---|---|---|
| CrystalDiskMark 5.2 / 6 | -8% | -39% | -12% | -1% | 2% | |
| Write 4K (MB/s) | 185 | 122.7 -34% | 28.16 -85% | 118.6 -36% | 151.5 -18% | 140.8 ? -24% |
| Read 4K (MB/s) | 50.6 | 46.57 -8% | 17.5 -65% | 44.68 -12% | 45.83 -9% | 48.6 ? -4% |
| Write Seq (MB/s) | 1543 | 1725 12% | 1195 -23% | 1866 21% | 2060 34% | 2106 ? 36% |
| Read Seq (MB/s) | 1509 | 2392 59% | 1470 -3% | 2173 44% | 1973 31% | 2099 ? 39% |
| Write 4K Q32T1 (MB/s) | 488.8 | 470.6 -4% | 205 -58% | 330.9 -32% | 489.8 0% | 451 ? -8% |
| Read 4K Q32T1 (MB/s) | 579 | 313.2 -46% | 692 20% | 343.1 -41% | 386.2 -33% | 482 ? -17% |
| Write Seq Q32T1 (MB/s) | 2986 | 1869 -37% | 1475 -51% | 1927 -35% | 2703 -9% | 2903 ? -3% |
| Read Seq Q32T1 (MB/s) | 3555 | 3380 -5% | 1920 -46% | 3528 -1% | 3376 -5% | 3511 ? -1% |
| AS SSD | -24% | -127% | -31% | -49% | -21% | |
| Seq Read (MB/s) | 2659 | 1816 -32% | 1300 -51% | 2381 -10% | 1786 -33% | 2412 ? -9% |
| Seq Write (MB/s) | 2551 | 1270 -50% | 1518 -40% | 1290 -49% | 1259 -51% | 1983 ? -22% |
| 4K Read (MB/s) | 56.4 | 46.25 -18% | 14.09 -75% | 52 -8% | 45.86 -19% | 53.1 ? -6% |
| 4K Write (MB/s) | 158 | 104.1 -34% | 24.25 -85% | 134.8 -15% | 147.9 -6% | 131.1 ? -17% |
| 4K-64 Read (MB/s) | 1317 | 1342 2% | 725 -45% | 530 -60% | 885 -33% | 1201 ? -9% |
| 4K-64 Write (MB/s) | 1786 | 1209 -32% | 169.6 -91% | 1177 -34% | 950 -47% | 1726 ? -3% |
| Access Time Read * (ms) | 0.047 | 0.043 9% | 0.172 -266% | 0.05 -6% | 0.058 -23% | 0.05525 ? -18% |
| Access Time Write * (ms) | 0.024 | 0.035 -46% | 0.155 -546% | 0.032 -33% | 0.074 -208% | 0.05394 ? -125% |
| Score Read (Points) | 1640 | 1569 -4% | 869 -47% | 820 -50% | 1110 -32% | 1495 ? -9% |
| Score Write (Points) | 2199 | 1440 -35% | 346 -84% | 1441 -34% | 1224 -44% | 2055 ? -7% |
| Score Total (Points) | 4682 | 3790 -19% | 1667 -64% | 2652 -43% | 2885 -38% | 4303 ? -8% |
| Copy ISO MB/s (MB/s) | 2034 | 1719 | 1384 | 1894 ? | ||
| Copy Program MB/s (MB/s) | 450.3 | 499.6 | 525 | 539 ? | ||
| Copy Game MB/s (MB/s) | 1024 | 1091 | 1008 | 1193 ? | ||
| Média Total (Programa/Configurações) | -16% /
-17% | -83% /
-90% | -22% /
-23% | -25% /
-29% | -10% /
-11% |
* ... menor é melhor

Dauerleistung Lesen: DiskSpd Read Loop, Queue Depth 8
| 3DMark 11 Performance | 2240 pontos | |
| 3DMark Ice Storm Standard Score | 71820 pontos | |
| 3DMark Cloud Gate Standard Score | 9816 pontos | |
| 3DMark Fire Strike Score | 1239 pontos | |
| 3DMark Time Spy Score | 497 pontos | |
Ajuda | ||
| baixo | média | alto | ultra | 4K | |
|---|---|---|---|---|---|
| The Witcher 3 (2015) | 18.2 | 12.1 | |||
| Dota 2 Reborn (2015) | 85.8 | 49.6 | 23 | 20.2 | 7.3 |
| X-Plane 11.11 (2018) | 13.9 | 10.3 | 10.9 | 6.59 | |
| Far Cry 5 (2018) | 16 | ||||
| F1 2019 (2019) | 30 | 12 |
Barulho
| Ocioso |
| 29.5 / 29.5 / 29.5 dB |
| Carga |
| 31.6 / 33.9 dB |
 | ||
30 dB silencioso 40 dB(A) audível 50 dB(A) ruidosamente alto |
||
min: | ||
| Lenovo ThinkPad X1 Carbon 2020-20UAS04T00 UHD Graphics 620, i7-10510U, Samsung SSD PM981a MZVLB512HBJQ | HP Elitebook x360 1040 G5 UHD Graphics 620, i7-8650U, Samsung SSD PM981 MZVLB512HAJQ | Apple MacBook Pro 13 2020 2GHz i5 10th-Gen Iris Plus Graphics G7 (Ice Lake 64 EU), i5-1038NG7, Apple SSD SM0512F | Dell Latitude 7400-8N6DH UHD Graphics 620, i7-8665U, Samsung SSD PM981 MZVLB512HAJQ | Lenovo ThinkPad X1 Carbon G7 20R1-000YUS UHD Graphics 620, i7-10510U, WDC PC SN730 SDBPNTY-512G | Lenovo ThinkPad X1 Carbon 2019-20QE000VGE UHD Graphics 620, i7-8665U, WDC PC SN720 SDAQNTW-512G | |
|---|---|---|---|---|---|---|
| Noise | 1% | -6% | 0% | -2% | 3% | |
| desligado / ambiente * (dB) | 29.5 | 28.3 4% | 29.6 -0% | 28.6 3% | 28.2 4% | 28.4 4% |
| Idle Minimum * (dB) | 29.5 | 28.3 4% | 29.6 -0% | 28.6 3% | 28.2 4% | 28.4 4% |
| Idle Average * (dB) | 29.5 | 28.3 4% | 29.6 -0% | 28.6 3% | 28.2 4% | 28.4 4% |
| Idle Maximum * (dB) | 29.5 | 28.3 4% | 29.6 -0% | 29.1 1% | 29.4 -0% | 28.6 3% |
| Load Average * (dB) | 31.6 | 32.6 -3% | 34.4 -9% | 31.5 -0% | 31.5 -0% | 31.5 -0% |
| Load Maximum * (dB) | 33.9 | 36.6 -8% | 42.1 -24% | 36.9 -9% | 41.2 -22% | 33.1 2% |
| Witcher 3 ultra * (dB) | 36.1 |
* ... menor é melhor
(-) A temperatura máxima no lado superior é 45.2 °C / 113 F, em comparação com a média de 35.9 °C / 97 F , variando de 21.4 a 59 °C para a classe Subnotebook.
(-) A parte inferior aquece até um máximo de 45.7 °C / 114 F, em comparação com a média de 39.2 °C / 103 F
(+) Em uso inativo, a temperatura média para o lado superior é 24.1 °C / 75 F, em comparação com a média do dispositivo de 30.8 °C / ### class_avg_f### F.
(+) Os apoios para as mãos e o touchpad são mais frios que a temperatura da pele, com um máximo de 28.8 °C / 83.8 F e, portanto, são frios ao toque.
(±) A temperatura média da área do apoio para as mãos de dispositivos semelhantes foi 28.2 °C / 82.8 F (-0.6 °C / -1 F).
| desligado | |
| Ocioso | |
| Carga |
|
Key:
min: | |
| Lenovo ThinkPad X1 Carbon 2020-20UAS04T00 i7-10510U, UHD Graphics 620, Samsung SSD PM981a MZVLB512HBJQ, IPS, 1920x1080, 14" | HP Elitebook x360 1040 G5 i7-8650U, UHD Graphics 620, Samsung SSD PM981 MZVLB512HAJQ, IPS, 1920x1080, 14" | Apple MacBook Pro 13 2020 2GHz i5 10th-Gen i5-1038NG7, Iris Plus Graphics G7 (Ice Lake 64 EU), Apple SSD SM0512F, IPS, 2560x1600, 13.3" | Dell Latitude 7400-8N6DH i7-8665U, UHD Graphics 620, Samsung SSD PM981 MZVLB512HAJQ, IPS, 1920x1080, 14" | Lenovo ThinkPad X1 Carbon G7 20R1-000YUS i7-10510U, UHD Graphics 620, WDC PC SN730 SDBPNTY-512G, IPS, 3840x2160, 14" | Média Intel UHD Graphics 620 | Média da turma Subnotebook | |
|---|---|---|---|---|---|---|---|
| Power Consumption | 1% | -22% | -6% | -31% | 0% | -5% | |
| Idle Minimum * (Watt) | 2.96 | 2.7 9% | 3.8 -28% | 3.9 -32% | 3.5 -18% | 3.81 ? -29% | 3.73 ? -26% |
| Idle Average * (Watt) | 5.9 | 6.5 -10% | 8.6 -46% | 6.1 -3% | 10.8 -83% | 6.94 ? -18% | 6.51 ? -10% |
| Idle Maximum * (Watt) | 9.1 | 11.5 -26% | 10.3 -13% | 8.2 10% | 12.5 -37% | 8.75 ? 4% | 7.88 ? 13% |
| Load Average * (Watt) | 42.1 | 38.7 8% | 52.1 -24% | 41 3% | 47.2 -12% | 35 ? 17% | 42.3 ? -0% |
| Load Maximum * (Watt) | 65.1 | 50.5 22% | 65.2 -0% | 69.7 -7% | 68.8 -6% | 47.5 ? 27% | 64.8 ? -0% |
| Witcher 3 ultra * (Watt) | 48.2 |
* ... menor é melhor
| Lenovo ThinkPad X1 Carbon 2020-20UAS04T00 i7-10510U, UHD Graphics 620, 51 Wh | HP Elitebook x360 1040 G5 i7-8650U, UHD Graphics 620, 56 Wh | Apple MacBook Pro 13 2020 2GHz i5 10th-Gen i5-1038NG7, Iris Plus Graphics G7 (Ice Lake 64 EU), 58 Wh | Dell Latitude 7400-8N6DH i7-8665U, UHD Graphics 620, 60 Wh | Lenovo ThinkPad X1 Carbon G7 20R1-000YUS i7-10510U, UHD Graphics 620, 51 Wh | Lenovo ThinkPad X1 Carbon 2019-20QES01L00 i7-8565U, UHD Graphics 620, 51 Wh | Média da turma Subnotebook | |
|---|---|---|---|---|---|---|---|
| Duração da bateria | 49% | 5% | 26% | -1% | -12% | 28% | |
| H.264 (h) | 12.8 | 11.5 -10% | 14.4 13% | 11.5 -10% | 15.3 ? 20% | ||
| WiFi v1.3 (h) | 10.1 | 10.4 3% | 12.1 20% | 11.6 15% | 10 -1% | 9.4 -7% | 14 ? 39% |
| Load (h) | 1.6 | 3.1 94% | 2.4 50% | 1.3 -19% | 1.998 ? 25% | ||
| Reader / Idle (h) | 27.9 | 28.6 ? |
Pro
Contra
Veredicto - Pequenas atualizações sem benefícios reais
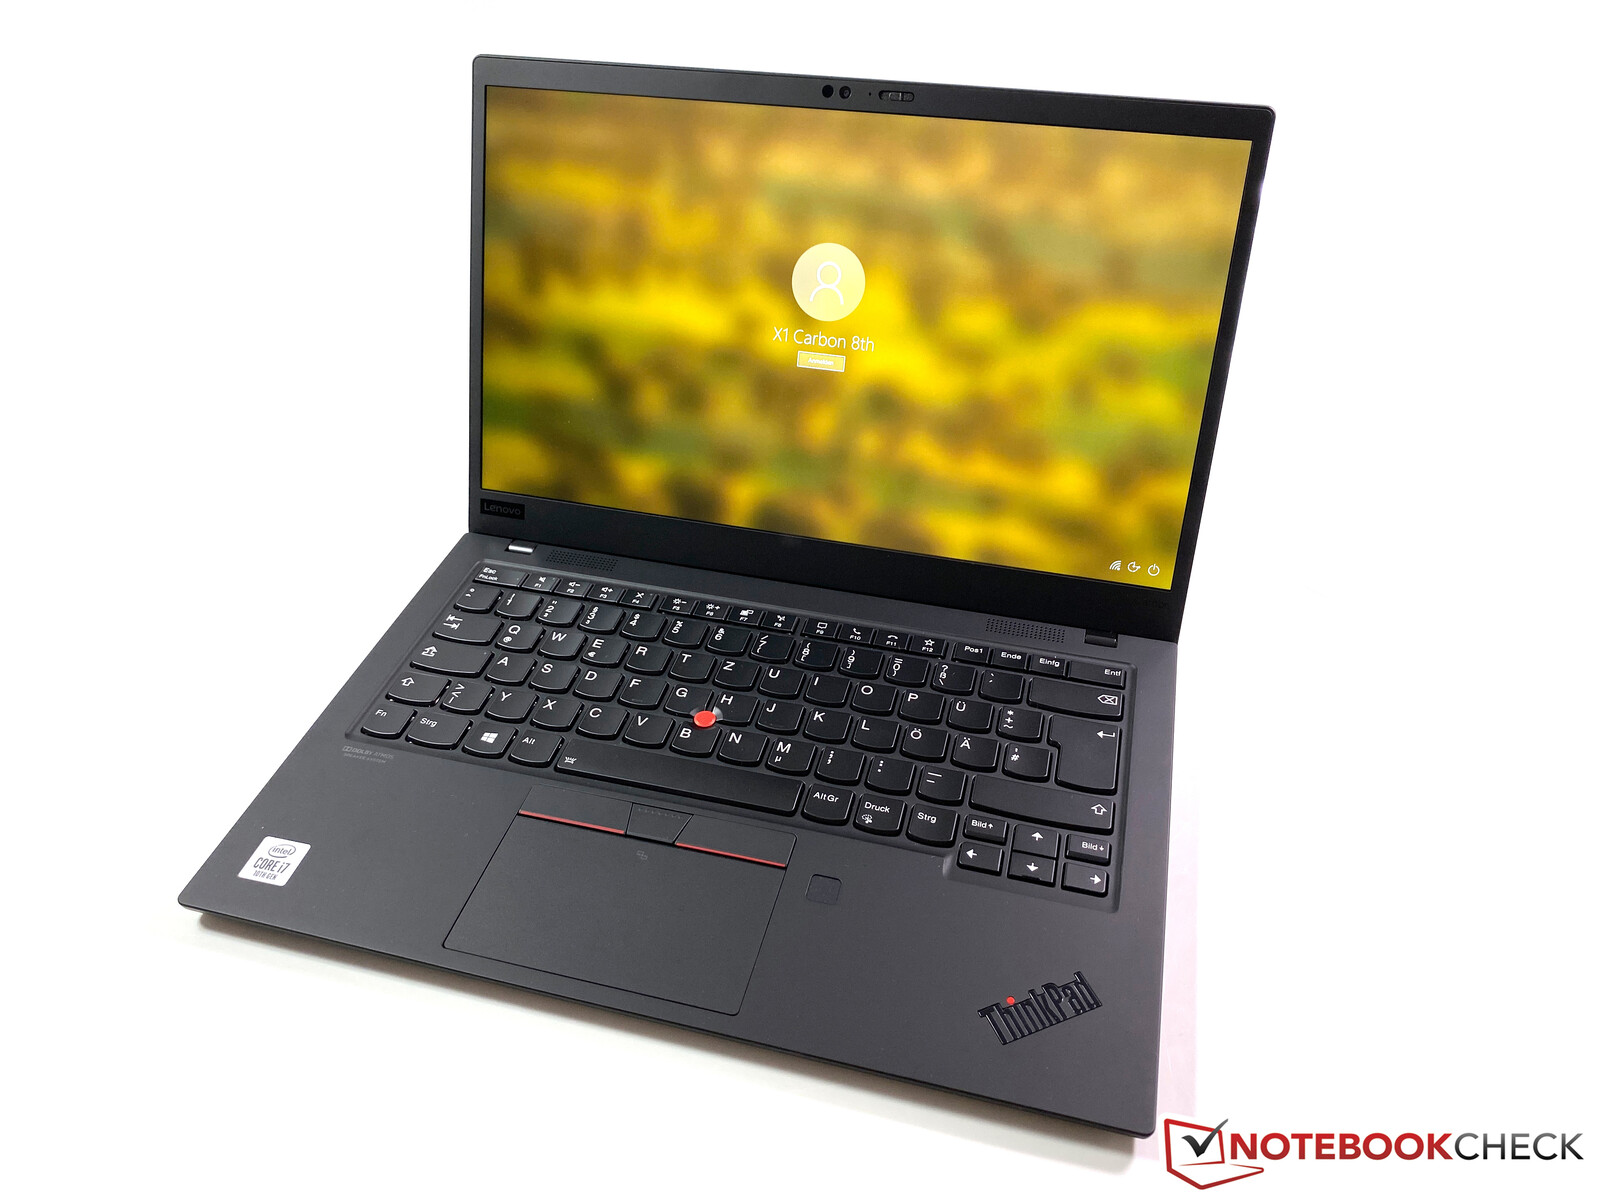
Depois que o ThinkPad X1 Carbon recebeu uma grande atualização no ano passado, os clientes só recebem uma pequena atualização desta vez. Algumas regiões já têm o processador Comet Lake na geração G7 de 2019; a 8ª geração do X1 Carbon agora usa novos processadores em todas as regiões. Entretanto, as diferenças em termos de processador, assim como o desempenho gráfico, são basicamente inexistentes e não justificam uma atualização. A única vantagem real é o novo módulo Wi-Fi 6.
Embora não haja grandes atualizações, o ThinkPad X1 Carbon ainda é um portátil empresarial muito bom com um chassi extremamente leve e robusto. Entretanto, ainda existem os mesmos problemas como a loteria para os painéis para as telas LowPower de 1080p. O teclado também é um pouco pior desde a atualização do chassi no ano passado. Esta é uma queixa de alto nível, mas o carro-chefe ThinkPad não oferece mais o melhor teclado; máquinas mais grossas (como a série T) têm uma vantagem a este respeito.
A Lenovo não usa processadores AMD para a série X1, portanto a mudança para a 8ª geração é apenas uma pequena atualização. Ainda é um portátil empresarial muito bom, mas o novo ThinkPad T14s da Lenovo (incluindo os SoCs AMD) poderia ser o maior concorrente.
Então vale a pena atualizar? As únicas vantagens reais em comparação com o modelo 2019 são o módulo Wi-Fi 6, bem como o adaptador de energia ligeiramente menor, mas isto dificilmente justifica uma atualização. Também estamos ansiosos para colocar nossas mãos nos novos ThinkPad T14s. Recebe um novo chassi e deve estar ainda mais próximo do X1 Carbon, mas a Lenovo também venderá modelos com CPUs AMD, além de SKUs Intel. Se olharmos para os primeiros resultados do ThinkPad E15 com a CPU AMD 4000 econômico, a AMD T14s deve oferecer muito mais desempenho do que o X1 Carbon.
Lenovo ThinkPad X1 Carbon 2020-20UAS04T00
- 07/01/2020 v7 (old)
Andreas Osthoff
Price comparison
