Breve Análise do Portátil Dell Latitude 7400: Mesmo a gama alta não está livre de fraquezas
| SD Card Reader | |
| average JPG Copy Test (av. of 3 runs) | |
| Dell Latitude 7400-8N6DH (Toshiba Exceria Pro M501 64 GB UHS-II) | |
| Dell Latitude 7400 2-in-1 (Toshiba Exceria Pro M501 UHS-II) | |
| Dell Latitude 7490 (Toshiba Exceria Pro M501 UHS-II) | |
| Lenovo ThinkPad T495s-20QKS01E00 (Toshiba Exceria Pro M501 64 GB UHS-II) | |
| Lenovo ThinkPad T490s-20NYS02A00 (Toshiba Exceria Pro M501) | |
| Toshiba Tecra X40-E-10W (Toshiba Exceria Pro M501 microSDXC 64GB) | |
| Média da turma Office (19.8 - 198.5, n=22, últimos 2 anos) | |
| maximum AS SSD Seq Read Test (1GB) | |
| Dell Latitude 7400 2-in-1 (Toshiba Exceria Pro M501 UHS-II) | |
| Dell Latitude 7400-8N6DH (Toshiba Exceria Pro M501 64 GB UHS-II) | |
| Dell Latitude 7490 (Toshiba Exceria Pro M501 UHS-II) | |
| Lenovo ThinkPad T495s-20QKS01E00 (Toshiba Exceria Pro M501 64 GB UHS-II) | |
| Lenovo ThinkPad T490s-20NYS02A00 (Toshiba Exceria Pro M501) | |
| Toshiba Tecra X40-E-10W (Toshiba Exceria Pro M501 microSDXC 64GB) | |
| Média da turma Office (27.4 - 249, n=21, últimos 2 anos) | |
| |||||||||||||||||||||||||
iluminação: 91 %
iluminação com acumulador: 290 cd/m²
Contraste: 1806:1 (Preto: 0.16 cd/m²)
ΔE ColorChecker Calman: 4.7 | ∀{0.5-29.43 Ø4.71}
calibrated: 1.3
ΔE Greyscale Calman: 6.4 | ∀{0.09-98 Ø4.96}
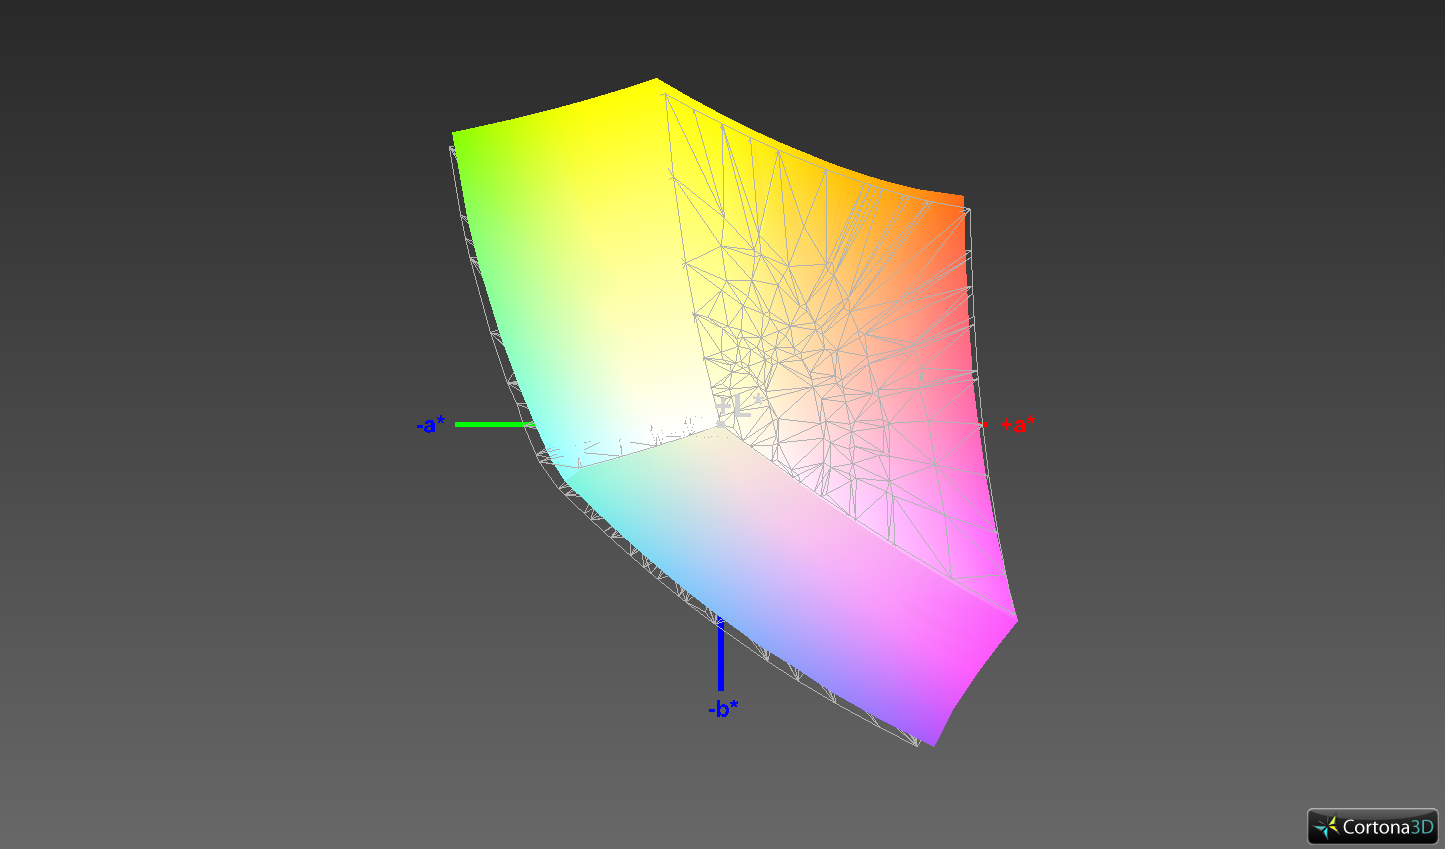
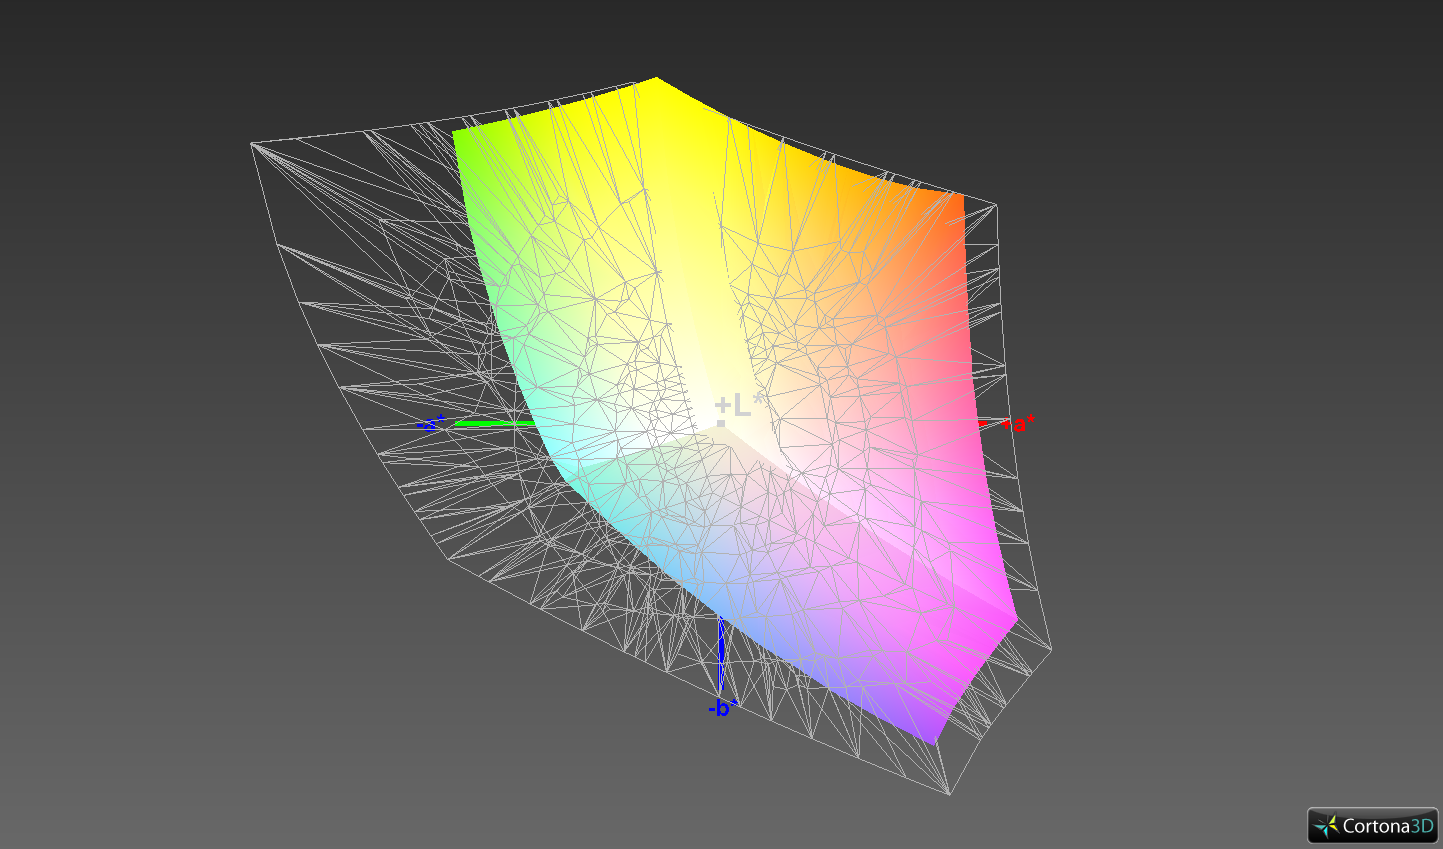
95.1% sRGB (Argyll 1.6.3 3D)
61.2% AdobeRGB 1998 (Argyll 1.6.3 3D)
67.5% AdobeRGB 1998 (Argyll 3D)
95.3% sRGB (Argyll 3D)
66.1% Display P3 (Argyll 3D)
Gamma: 2.54
CCT: 5977 K
| Dell Latitude 7400-8N6DH IPS, 1920x1080, 14" | Dell Latitude 7490 IPS, 1920x1080, 14" | Lenovo ThinkPad X1 Carbon 2019-20QES01L00 IPS, 1920x1080, 14" | HP EliteBook 745 G5 3UN74EA IPS LED, 1920x1080, 14" | HP EliteBook 840 G5-3JX61EA IPS, 1920x1080, 14" | Lenovo ThinkPad T490s-20NYS02A00 IPS, 1920x1080, 14" | Toshiba Tecra X40-E-10W IPS, 1920x1080, 14" | Lenovo ThinkPad X1 Carbon 2019-20QE000VGE IPS, 2560x1440, 14" | |
|---|---|---|---|---|---|---|---|---|
| Display | 1% | -1% | -8% | -8% | 2% | -38% | 7% | |
| Display P3 Coverage (%) | 66.1 | 66.6 1% | 64.5 -2% | 61.3 -7% | 61 -8% | 67.1 2% | 40.55 -39% | 72.5 10% |
| sRGB Coverage (%) | 95.3 | 96.8 2% | 95.8 1% | 87.6 -8% | 87.7 -8% | 97.6 2% | 61 -36% | 97.8 3% |
| AdobeRGB 1998 Coverage (%) | 67.5 | 67.9 1% | 65.7 -3% | 62.3 -8% | 62.1 -8% | 68.5 1% | 41.9 -38% | 73.8 9% |
| Response Times | 24% | 28% | 39% | 39% | -1% | 53% | 41% | |
| Response Time Grey 50% / Grey 80% * (ms) | 62 ? | 41.6 ? 33% | 44.8 ? 28% | 35 ? 44% | 33 ? 47% | 61.6 ? 1% | 22 ? 65% | 33.6 ? 46% |
| Response Time Black / White * (ms) | 37.6 ? | 32 ? 15% | 27.6 ? 27% | 25 ? 34% | 26 ? 31% | 38.8 ? -3% | 22 ? 41% | 24 ? 36% |
| PWM Frequency (Hz) | 3125 ? | 21000 ? | ||||||
| Screen | -14% | 3% | 6% | -7% | 13% | -10% | -17% | |
| Brightness middle (cd/m²) | 289 | 308.6 7% | 381 32% | 421 46% | 655 127% | 391 35% | 266 -8% | 338 17% |
| Brightness (cd/m²) | 286 | 294 3% | 375 31% | 398 39% | 630 120% | 389 36% | 244 -15% | 315 10% |
| Brightness Distribution (%) | 91 | 89 -2% | 94 3% | 86 -5% | 93 2% | 87 -4% | 86 -5% | 88 -3% |
| Black Level * (cd/m²) | 0.16 | 0.23 -44% | 0.24 -50% | 0.27 -69% | 0.56 -250% | 0.23 -44% | 0.2 -25% | 0.43 -169% |
| Contrast (:1) | 1806 | 1342 -26% | 1588 -12% | 1559 -14% | 1170 -35% | 1700 -6% | 1330 -26% | 786 -56% |
| Colorchecker dE 2000 * | 4.7 | 6.07 -29% | 4.6 2% | 4.08 13% | 3.27 30% | 3.4 28% | 4.61 2% | 4 15% |
| Colorchecker dE 2000 max. * | 8.7 | 10.58 -22% | 8.5 2% | 7.48 14% | 5.92 32% | 4.7 46% | 7.46 14% | 7.9 9% |
| Colorchecker dE 2000 calibrated * | 1.3 | 1.67 -28% | 1.2 8% | 3.22 -148% | 1.1 15% | 1.7 -31% | ||
| Greyscale dE 2000 * | 6.4 | 7.3 -14% | 5.1 20% | 2.92 54% | 2.85 55% | 4 37% | 4.31 33% | 6.2 3% |
| Gamma | 2.54 87% | 2.061 107% | 2.52 87% | 2.32 95% | 2.45 90% | 2.49 88% | 2.54 87% | 2.13 103% |
| CCT | 5977 109% | 7269 89% | 7052 92% | 7043 92% | 6065 107% | 6809 95% | 6848 95% | 6787 96% |
| Color Space (Percent of AdobeRGB 1998) (%) | 61.2 | 62 1% | 60.7 -1% | 57 -7% | 57 -7% | 62.4 2% | 39 -36% | 68.1 11% |
| Color Space (Percent of sRGB) (%) | 95.1 | 97 2% | 95.7 1% | 87 -9% | 88 -7% | 97.4 2% | 61 -36% | 97.8 3% |
| Média Total (Programa/Configurações) | 4% /
-6% | 10% /
5% | 12% /
8% | 8% /
-2% | 5% /
9% | 2% /
-7% | 10% /
-5% |
* ... menor é melhor
Exibir tempos de resposta
| ↔ Tempo de resposta preto para branco | ||
|---|---|---|
| 37.6 ms ... ascensão ↗ e queda ↘ combinadas | ↗ 21.2 ms ascensão | 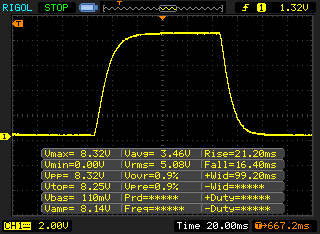 |
| ↘ 16.4 ms queda | ||
| A tela mostra taxas de resposta lentas em nossos testes e será insatisfatória para os jogadores. Em comparação, todos os dispositivos testados variam de 0.1 (mínimo) a 240 (máximo) ms. » 95 % de todos os dispositivos são melhores. Isso significa que o tempo de resposta medido é pior que a média de todos os dispositivos testados (19.8 ms). | ||
| ↔ Tempo de resposta 50% cinza a 80% cinza | ||
| 62 ms ... ascensão ↗ e queda ↘ combinadas | ↗ 29.6 ms ascensão | 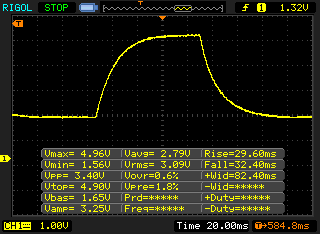 |
| ↘ 32.4 ms queda | ||
| A tela mostra taxas de resposta lentas em nossos testes e será insatisfatória para os jogadores. Em comparação, todos os dispositivos testados variam de 0.165 (mínimo) a 636 (máximo) ms. » 97 % de todos os dispositivos são melhores. Isso significa que o tempo de resposta medido é pior que a média de todos os dispositivos testados (30.9 ms). | ||
Cintilação da tela / PWM (modulação por largura de pulso)
| Tela tremeluzindo / PWM não detectado | 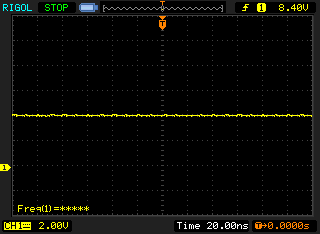 | ||
[pwm_comparison] Em comparação: 52 % de todos os dispositivos testados não usam PWM para escurecer a tela. Se PWM foi detectado, uma média de 7744 (mínimo: 5 - máximo: 343500) Hz foi medida. | |||

| Geekbench 3 | |
| 32 Bit Multi-Core Score | |
| Dell Latitude 7400-8N6DH | |
| Média Intel Core i7-8665U (n=1) | |
| HP EliteBook 840 G5-3JX61EA | |
| Toshiba Tecra X40-E-10W | |
| 32 Bit Single-Core Score | |
| HP EliteBook 840 G5-3JX61EA | |
| Dell Latitude 7400-8N6DH | |
| Média Intel Core i7-8665U (n=1) | |
| Toshiba Tecra X40-E-10W | |
| Mozilla Kraken 1.1 - Total | |
| HP EliteBook 745 G5 3UN74EA (Edge) | |
| Lenovo ThinkPad T495s-20QKS01E00 (Edge 44.18362.1.0) | |
| Dell Latitude 7490 (Microsoft Edge 42.17134.1.0) | |
| Lenovo ThinkPad T490s-20NYS02A00 (Edge 44) | |
| Dell Latitude 7400 2-in-1 (Microsoft Edge 44.18362.1.0) | |
| Lenovo ThinkPad X1 Carbon 2019-20QE000VGE (Edge 44.18362.1.0) | |
| Média Intel Core i7-8665U (1016 - 1136, n=4) | |
| Dell Latitude 7400-8N6DH (Edge 44) | |
| Média da turma Office (391 - 1297, n=78, últimos 2 anos) | |
| Octane V2 - Total Score | |
| Média da turma Office (49011 - 126830, n=20, últimos 2 anos) | |
| Dell Latitude 7400-8N6DH (Edge 44) | |
| Média Intel Core i7-8665U (30142 - 36667, n=4) | |
| Lenovo ThinkPad X1 Carbon 2019-20QE000VGE (Edge 44.18362.1.0) | |
| Lenovo ThinkPad T490s-20NYS02A00 (Edge 44) | |
| Dell Latitude 7400 2-in-1 (Microsoft Edge 44.18362.1.0) | |
| Dell Latitude 7490 (Microsoft Edge 42.17134.1.0) | |
| Lenovo ThinkPad T495s-20QKS01E00 (Edge 44.18362.1.0) | |
| HP EliteBook 745 G5 3UN74EA (Edge) | |
| JetStream 1.1 - 1.1 Total | |
| Lenovo ThinkPad X1 Carbon 2019-20QE000VGE (Edge 44.18362.1.0) | |
| Média Intel Core i7-8665U (242 - 290, n=4) | |
| HP EliteBook 840 G5-3JX61EA (Edge 42) | |
| Dell Latitude 7400-8N6DH (Edge 44) | |
| Toshiba Tecra X40-E-10W (Edge 42) | |
| Dell Latitude 7490 (Microsoft Edge 42.17134.1.0) | |
| Lenovo ThinkPad T495s-20QKS01E00 (Edge 44.18362.1.0) | |
| HP EliteBook 745 G5 3UN74EA (Edge) | |
* ... menor é melhor
| PCMark 8 Home Score Accelerated v2 | 3547 pontos | |
| PCMark 8 Creative Score Accelerated v2 | 3715 pontos | |
| PCMark 8 Work Score Accelerated v2 | 5195 pontos | |
| PCMark 10 Score | 4094 pontos | |
Ajuda | ||

| Dell Latitude 7400-8N6DH Samsung SSD PM981 MZVLB512HAJQ | Lenovo ThinkPad X1 Carbon 2019-20QE000VGE WDC PC SN720 SDAQNTW-512G | HP EliteBook 745 G5 3UN74EA Toshiba XG5 KXG50ZNV256G | HP EliteBook 840 G5-3JX61EA Toshiba KXG50ZNV1T02 | Toshiba Tecra X40-E-10W Samsung PM961 MZVLW256HEHP | Dell Latitude 7490 Toshiba KSG60ZMV256G | Lenovo ThinkPad T490s-20NYS02A00 Intel SSD Pro 7600p SSDPEKKF512G8L | Média Samsung SSD PM981 MZVLB512HAJQ | |
|---|---|---|---|---|---|---|---|---|
| CrystalDiskMark 5.2 / 6 | 26% | -32% | -20% | -23% | -60% | -9% | 2% | |
| Write 4K (MB/s) | 118.6 | 196.9 66% | 119.5 1% | 96.1 -19% | 100.1 -16% | 79.4 -33% | 122 3% | 126.7 ? 7% |
| Read 4K (MB/s) | 44.68 | 51.3 15% | 31.9 -29% | 31.12 -30% | 40.03 -10% | 27.37 -39% | 45.56 2% | 44 ? -2% |
| Write Seq (MB/s) | 1866 | 1715 -8% | 351.1 -81% | 919 -51% | 1259 -33% | 343.9 -82% | 1497 -20% | 1617 ? -13% |
| Read Seq (MB/s) | 2173 | 2464 13% | 1665 -23% | 2089 -4% | 1296 -40% | 472.7 -78% | 2385 10% | 1716 ? -21% |
| Write 4K Q32T1 (MB/s) | 330.9 | 429.1 30% | 268.4 -19% | 425.6 29% | 228.1 -31% | 206 -38% | 240.9 -27% | 413 ? 25% |
| Read 4K Q32T1 (MB/s) | 343.1 | 542 58% | 333.1 -3% | 275.3 -20% | 292.9 -15% | 188.3 -45% | 338 -1% | 420 ? 22% |
| Write Seq Q32T1 (MB/s) | 1927 | 2521 31% | 351.8 -82% | 958 -50% | 1286 -33% | 343.3 -82% | 1528 -21% | 2076 ? 8% |
| Read Seq Q32T1 (MB/s) | 3528 | 3481 -1% | 2705 -23% | 3118 -12% | 3411 -3% | 533 -85% | 2915 -17% | 3130 ? -11% |
| 3DMark 06 Standard Score | 11053 pontos | |
| 3DMark 11 Performance | 1979 pontos | |
| 3DMark Ice Storm Standard Score | 61551 pontos | |
| 3DMark Cloud Gate Standard Score | 8736 pontos | |
| 3DMark Fire Strike Score | 1075 pontos | |
| 3DMark Time Spy Score | 448 pontos | |
Ajuda | ||
| baixo | média | alto | ultra | |
|---|---|---|---|---|
| Tomb Raider (2013) | 87.8 | 44.3 | 27 | 12.5 |
| BioShock Infinite (2013) | 60.9 | 34.3 | 26.7 | 8.5 |
| The Witcher 3 (2015) | 15.8 | 9.3 | 5.4 | 3 |
| Dota 2 Reborn (2015) | 73 | 42.9 | 19.5 | 17.3 |
| X-Plane 11.11 (2018) | 23.1 | 15 | 13.4 |
| BioShock Infinite - 1280x720 Very Low Preset | |
| Lenovo ThinkPad T495s-20QKS01E00 | |
| HP EliteBook 745 G5 3UN74EA | |
| Dell Latitude 7400-8N6DH (Dual-Channel) | |
| HP EliteBook 840 G5-3JX61EA | |
| Dell Latitude 7400-8N6DH | |
| Média Intel UHD Graphics 620 (18.3 - 90.2, n=187) | |
| Lenovo ThinkPad T490s-20NYS02A00 | |
| Lenovo ThinkPad X1 Carbon 2019-20QE000VGE | |
| Dell Latitude 7400 2-in-1 | |
| Dell Latitude 7490 | |
| Toshiba Tecra X40-E-10W | |
| Tomb Raider - 1024x768 Low Preset | |
| Dell Latitude 7400-8N6DH | |
| Média Intel UHD Graphics 620 (24.3 - 114.4, n=18) | |
Barulho
| Ocioso |
| 28.6 / 28.6 / 29.1 dB |
| Carga |
| 31.5 / 36.9 dB |
 | ||
30 dB silencioso 40 dB(A) audível 50 dB(A) ruidosamente alto |
||
min: | ||
| Dell Latitude 7400-8N6DH i7-8665U, UHD Graphics 620 | Dell Latitude 7490 i5-8350U, UHD Graphics 620 | Lenovo ThinkPad X1 Carbon 2019-20QE000VGE i7-8665U, UHD Graphics 620 | HP EliteBook 745 G5 3UN74EA R7 2700U, Vega 10 | HP EliteBook 840 G5-3JX61EA i5-8550U, UHD Graphics 620 | Toshiba Tecra X40-E-10W i5-8250U, UHD Graphics 620 | Lenovo ThinkPad T490s-20NYS02A00 i5-8265U, UHD Graphics 620 | |
|---|---|---|---|---|---|---|---|
| Noise | 0% | 3% | -6% | -4% | -13% | -2% | |
| desligado / ambiente * (dB) | 28.6 | 28.2 1% | 28.4 1% | 30.5 -7% | 30.3 -6% | 30.5 -7% | 29.4 -3% |
| Idle Minimum * (dB) | 28.6 | 28.2 1% | 28.4 1% | 30.5 -7% | 30.3 -6% | 30.5 -7% | 29.4 -3% |
| Idle Average * (dB) | 28.6 | 28.2 1% | 28.4 1% | 30.5 -7% | 30.3 -6% | 30.5 -7% | 29.4 -3% |
| Idle Maximum * (dB) | 29.1 | 28.7 1% | 28.6 2% | 30.5 -5% | 30.3 -4% | 31.2 -7% | 30.9 -6% |
| Load Average * (dB) | 31.5 | 29.9 5% | 31.5 -0% | 36 -14% | 33.8 -7% | 43.9 -39% | 33.3 -6% |
| Load Maximum * (dB) | 36.9 | 40.2 -9% | 33.1 10% | 36 2% | 33.8 8% | 40.1 -9% | 33.3 10% |
* ... menor é melhor
(±) A temperatura máxima no lado superior é 42.4 °C / 108 F, em comparação com a média de 34.3 °C / 94 F , variando de 21.2 a 62.5 °C para a classe Office.
(-) A parte inferior aquece até um máximo de 47.1 °C / 117 F, em comparação com a média de 36.8 °C / 98 F
(+) Em uso inativo, a temperatura média para o lado superior é 23.9 °C / 75 F, em comparação com a média do dispositivo de 29.5 °C / ### class_avg_f### F.
(+) Os apoios para as mãos e o touchpad são mais frios que a temperatura da pele, com um máximo de 30.7 °C / 87.3 F e, portanto, são frios ao toque.
(-) A temperatura média da área do apoio para as mãos de dispositivos semelhantes foi 27.6 °C / 81.7 F (-3.1 °C / -5.6 F).
| Dell Latitude 7400-8N6DH i7-8665U, UHD Graphics 620 | Dell Latitude 7490 i5-8350U, UHD Graphics 620 | Lenovo ThinkPad X1 Carbon 2019-20QE000VGE i7-8665U, UHD Graphics 620 | HP EliteBook 745 G5 3UN74EA R7 2700U, Vega 10 | HP EliteBook 840 G5-3JX61EA i5-8550U, UHD Graphics 620 | Toshiba Tecra X40-E-10W i5-8250U, UHD Graphics 620 | Lenovo ThinkPad T490s-20NYS02A00 i5-8265U, UHD Graphics 620 | |
|---|---|---|---|---|---|---|---|
| Heat | -23% | -2% | -2% | 18% | -6% | 0% | |
| Maximum Upper Side * (°C) | 42.4 | 45.2 -7% | 47.9 -13% | 38.4 9% | 33.4 21% | 44 -4% | 43.3 -2% |
| Maximum Bottom * (°C) | 47.1 | 51.6 -10% | 45.9 3% | 35.8 24% | 32.7 31% | 47.2 -0% | 45.1 4% |
| Idle Upper Side * (°C) | 24.5 | 31.8 -30% | 24.6 -0% | 29.8 -22% | 22.2 9% | 27.3 -11% | 25 -2% |
| Idle Bottom * (°C) | 25.2 | 36 -43% | 24.4 3% | 29.7 -18% | 22.3 12% | 27.8 -10% | 25 1% |
* ... menor é melhor
Dell Latitude 7400-8N6DH análise de áudio
(±) | o volume do alto-falante é médio, mas bom (###valor### dB)
Graves 100 - 315Hz
(-) | quase nenhum baixo - em média 16.5% menor que a mediana
(±) | a linearidade dos graves é média (8% delta para a frequência anterior)
Médios 400 - 2.000 Hz
(+) | médios equilibrados - apenas 2.5% longe da mediana
(±) | a linearidade dos médios é média (7% delta para frequência anterior)
Altos 2 - 16 kHz
(±) | máximos mais altos - em média 5.2% maior que a mediana
(±) | a linearidade dos máximos é média (7.2% delta para frequência anterior)
Geral 100 - 16.000 Hz
(±) | a linearidade do som geral é média (17.7% diferença em relação à mediana)
Comparado com a mesma classe
» 29% de todos os dispositivos testados nesta classe foram melhores, 6% semelhantes, 65% piores
» O melhor teve um delta de 7%, a média foi 21%, o pior foi 53%
Comparado com todos os dispositivos testados
» 35% de todos os dispositivos testados foram melhores, 8% semelhantes, 56% piores
» O melhor teve um delta de 4%, a média foi 23%, o pior foi 134%
Lenovo ThinkPad X1 Carbon 2019-20QE000VGE análise de áudio
(±) | o volume do alto-falante é médio, mas bom (###valor### dB)
Graves 100 - 315Hz
(±) | graves reduzidos - em média 11.2% menor que a mediana
(±) | a linearidade dos graves é média (7.1% delta para a frequência anterior)
Médios 400 - 2.000 Hz
(±) | médios mais altos - em média 5.1% maior que a mediana
(+) | médios são lineares (5.4% delta para frequência anterior)
Altos 2 - 16 kHz
(+) | agudos equilibrados - apenas 2.9% longe da mediana
(±) | a linearidade dos máximos é média (9.1% delta para frequência anterior)
Geral 100 - 16.000 Hz
(±) | a linearidade do som geral é média (16.7% diferença em relação à mediana)
Comparado com a mesma classe
» 22% de todos os dispositivos testados nesta classe foram melhores, 7% semelhantes, 71% piores
» O melhor teve um delta de 7%, a média foi 21%, o pior foi 53%
Comparado com todos os dispositivos testados
» 29% de todos os dispositivos testados foram melhores, 7% semelhantes, 64% piores
» O melhor teve um delta de 4%, a média foi 23%, o pior foi 134%
| desligado | |
| Ocioso | |
| Carga |
|
Key:
min: | |
| Dell Latitude 7400-8N6DH i7-8665U, UHD Graphics 620 | Dell Latitude 7490 i5-8350U, UHD Graphics 620 | Lenovo ThinkPad X1 Carbon 2019-20QE000VGE i7-8665U, UHD Graphics 620 | HP EliteBook 745 G5 3UN74EA R7 2700U, Vega 10 | HP EliteBook 840 G5-3JX61EA i5-8550U, UHD Graphics 620 | Toshiba Tecra X40-E-10W i5-8250U, UHD Graphics 620 | Lenovo ThinkPad T490s-20NYS02A00 i5-8265U, UHD Graphics 620 | |
|---|---|---|---|---|---|---|---|
| Power Consumption | 30% | 3% | -6% | -1% | 4% | 10% | |
| Idle Minimum * (Watt) | 3.9 | 2 49% | 3 23% | 4.9 -26% | 3.8 3% | 4.5 -15% | 2.62 33% |
| Idle Average * (Watt) | 6.1 | 4.7 23% | 6.3 -3% | 8.1 -33% | 8.3 -36% | 8.2 -34% | 5.16 15% |
| Idle Maximum * (Watt) | 8.2 | 5.7 30% | 8.9 -9% | 10.6 -29% | 10.7 -30% | 9.3 -13% | 8.7 -6% |
| Load Average * (Watt) | 41 | 38.4 6% | 40.8 -0% | 32.2 21% | 35.5 13% | 30.4 26% | 40 2% |
| Load Maximum * (Watt) | 69.7 | 38.9 44% | 67.5 3% | 42.3 39% | 37 47% | 30.4 56% | 64 8% |
* ... menor é melhor
| Dell Latitude 7400-8N6DH i7-8665U, UHD Graphics 620, 60 Wh | Lenovo ThinkPad X1 Carbon 2019-20QE000VGE i7-8665U, UHD Graphics 620, 51 Wh | HP EliteBook 745 G5 3UN74EA R7 2700U, Vega 10, 50 Wh | HP EliteBook 840 G5-3JX61EA i5-8550U, UHD Graphics 620, 50 Wh | Toshiba Tecra X40-E-10W i5-8250U, UHD Graphics 620, 48 Wh | Dell Latitude 7490 i5-8350U, UHD Graphics 620, 60 Wh | Dell Latitude 7400 2-in-1 i7-8665U, UHD Graphics 620, 78 Wh | Lenovo ThinkPad X1 Carbon 2019-20QES01L00 i7-8565U, UHD Graphics 620, 51 Wh | Lenovo ThinkPad T490s-20NYS02A00 i5-8265U, UHD Graphics 620, 57 Wh | Lenovo ThinkPad T495s-20QKS01E00 R7 PRO 3700U, Vega 10, 57 Wh | Média da turma Office | |
|---|---|---|---|---|---|---|---|---|---|---|---|
| Duração da bateria | -34% | -42% | -36% | -28% | -22% | 5% | -28% | -15% | -8% | -1% | |
| H.264 (h) | 14.4 | 9.8 -32% | 7.1 -51% | 11.5 -20% | 13.9 -3% | 12.5 -13% | 15.4 ? 7% | ||||
| WiFi v1.3 (h) | 11.6 | 8.2 -29% | 6.6 -43% | 7.4 -36% | 8.3 -28% | 9.1 -22% | 12.2 5% | 9.4 -19% | 10.1 -13% | 11.3 -3% | 13.2 ? 14% |
| Load (h) | 2.4 | 1.4 -42% | 1.6 -33% | 1.3 -46% | 1.7 -29% | 1.808 ? -25% | |||||
| Reader / Idle (h) | 10.7 | 22.2 ? |
Pro
Contra
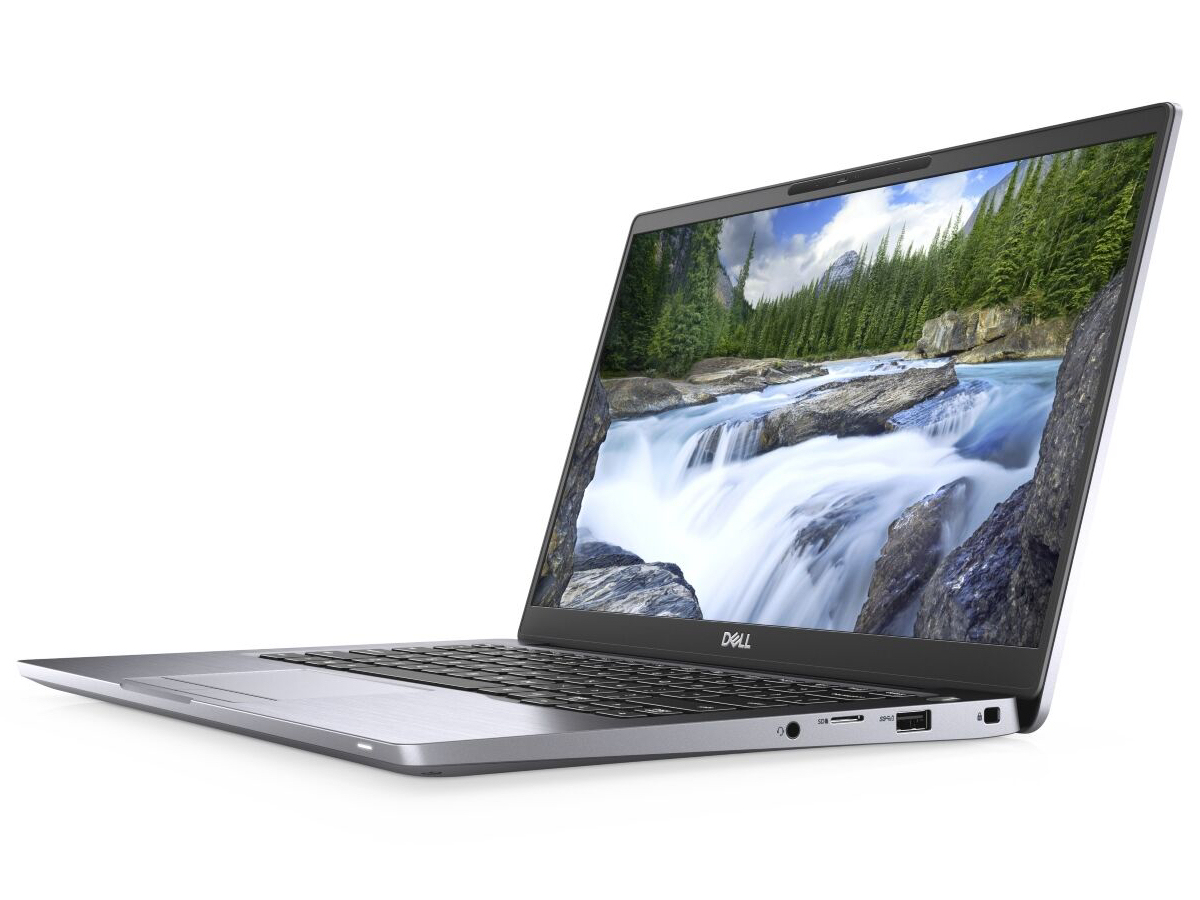
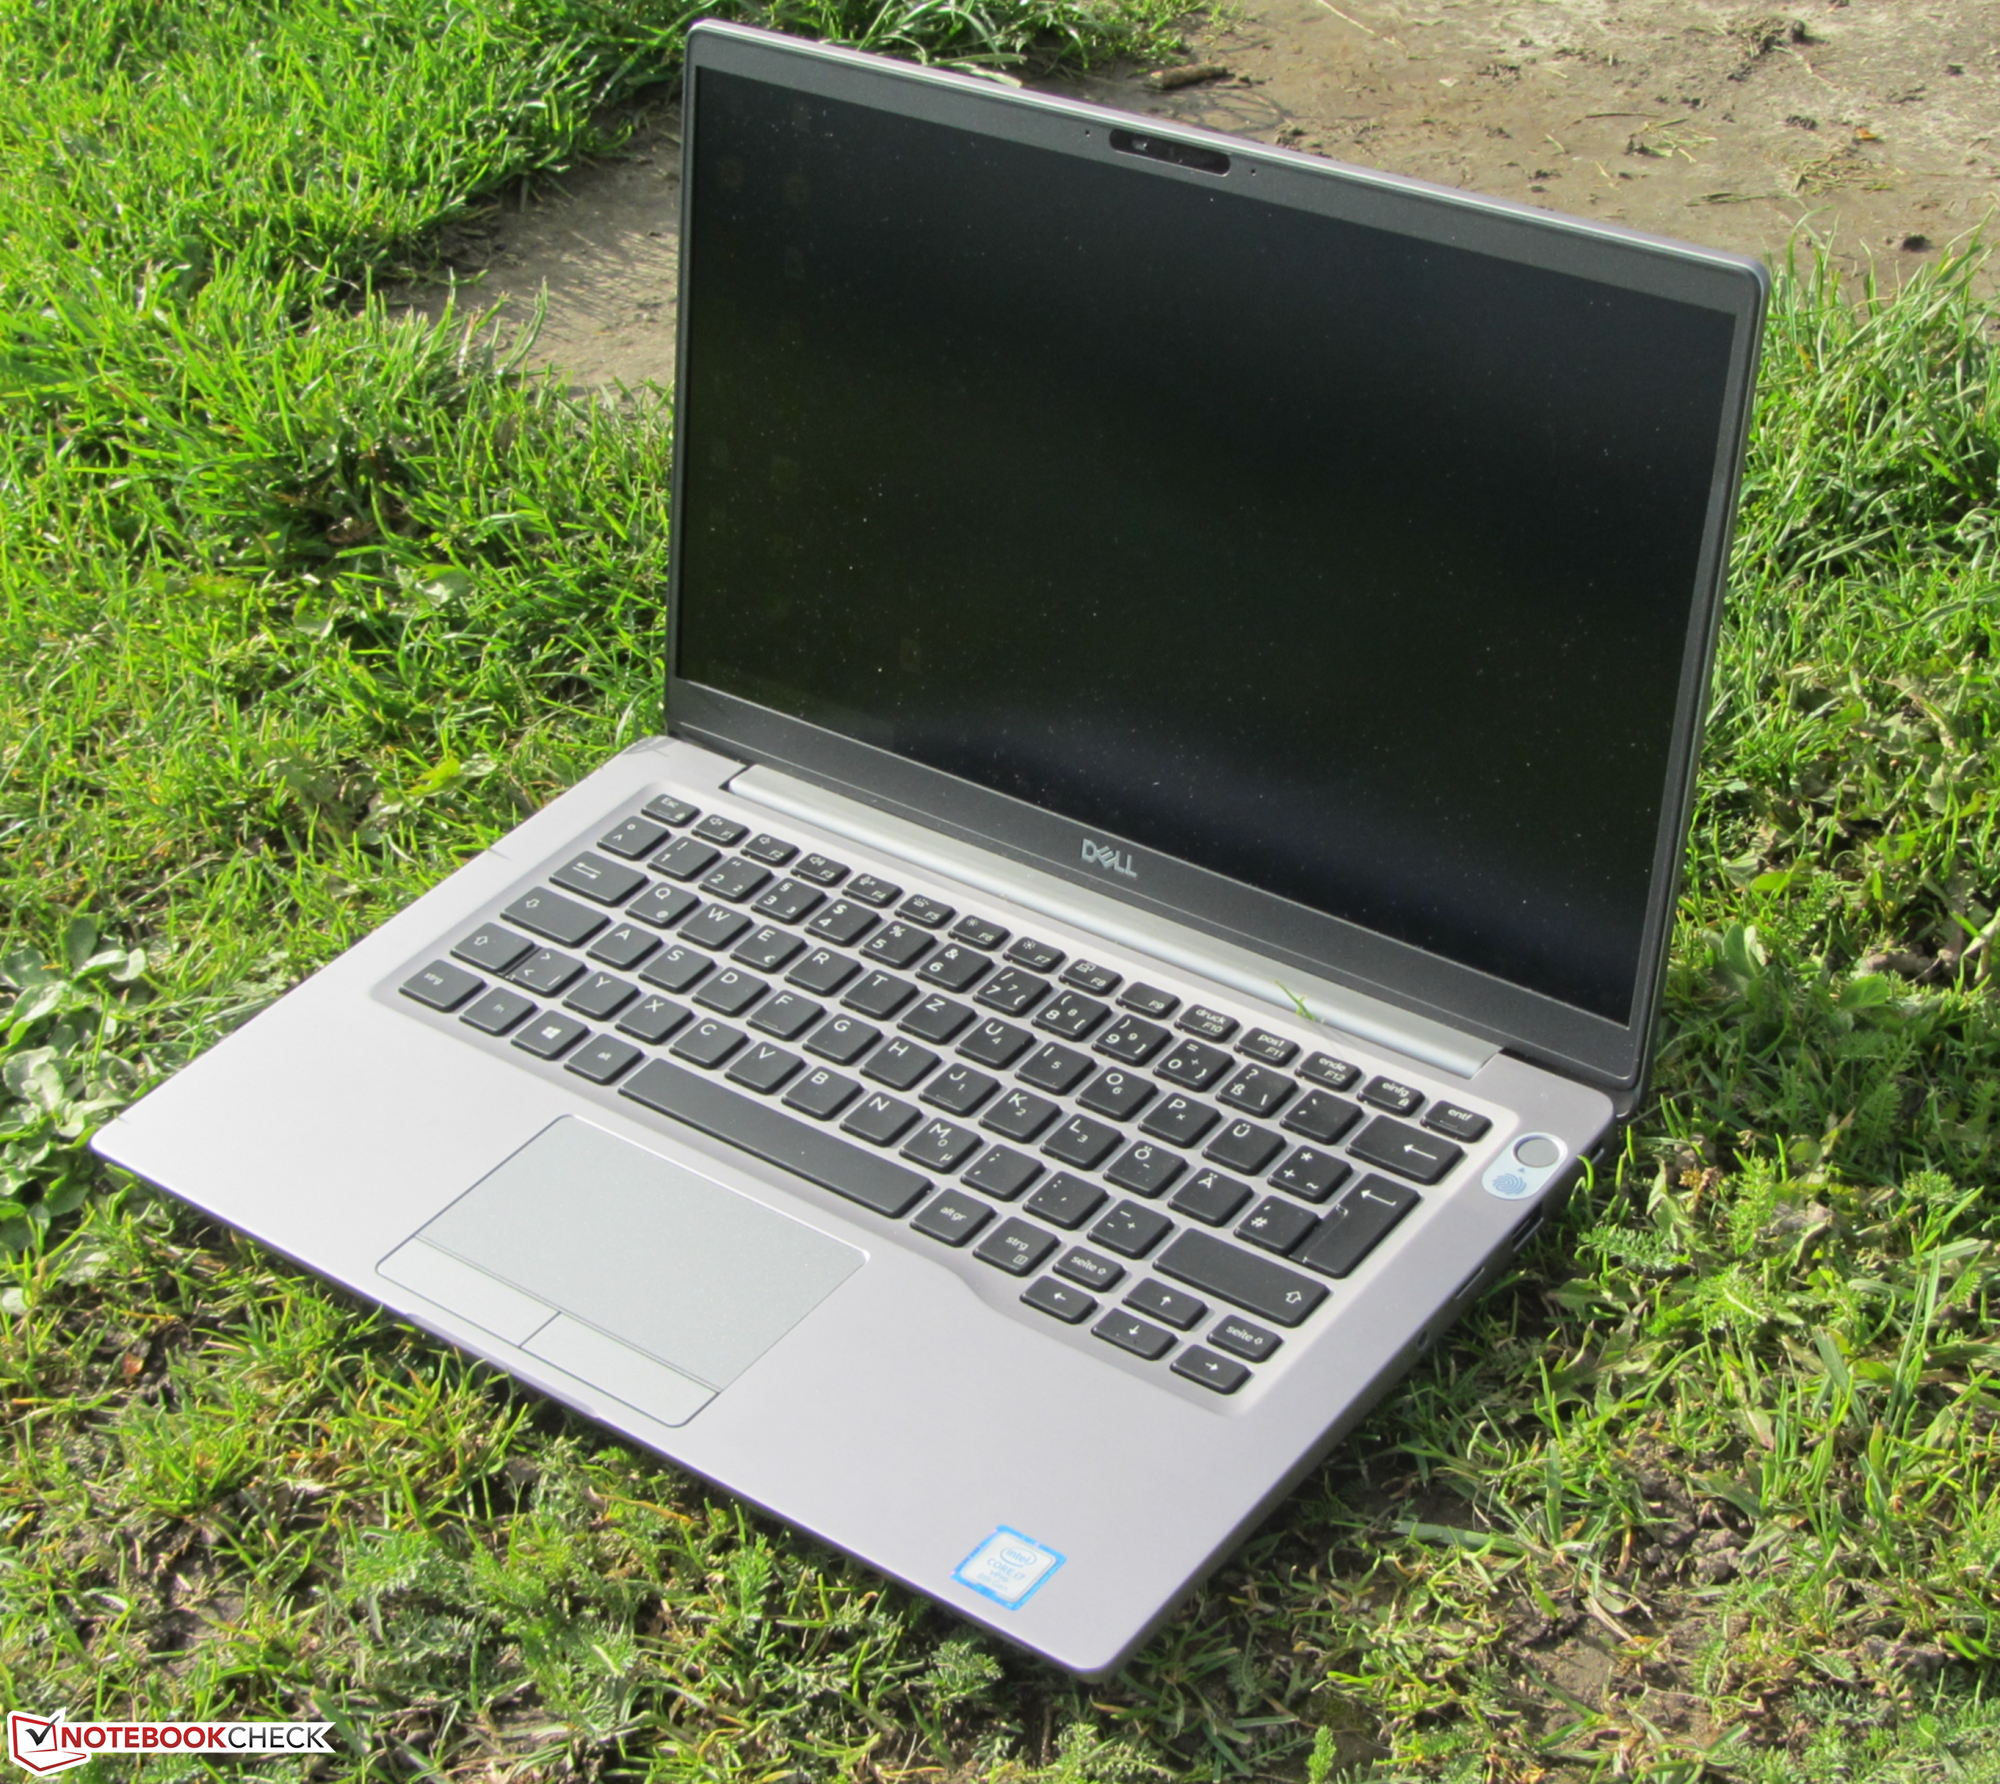
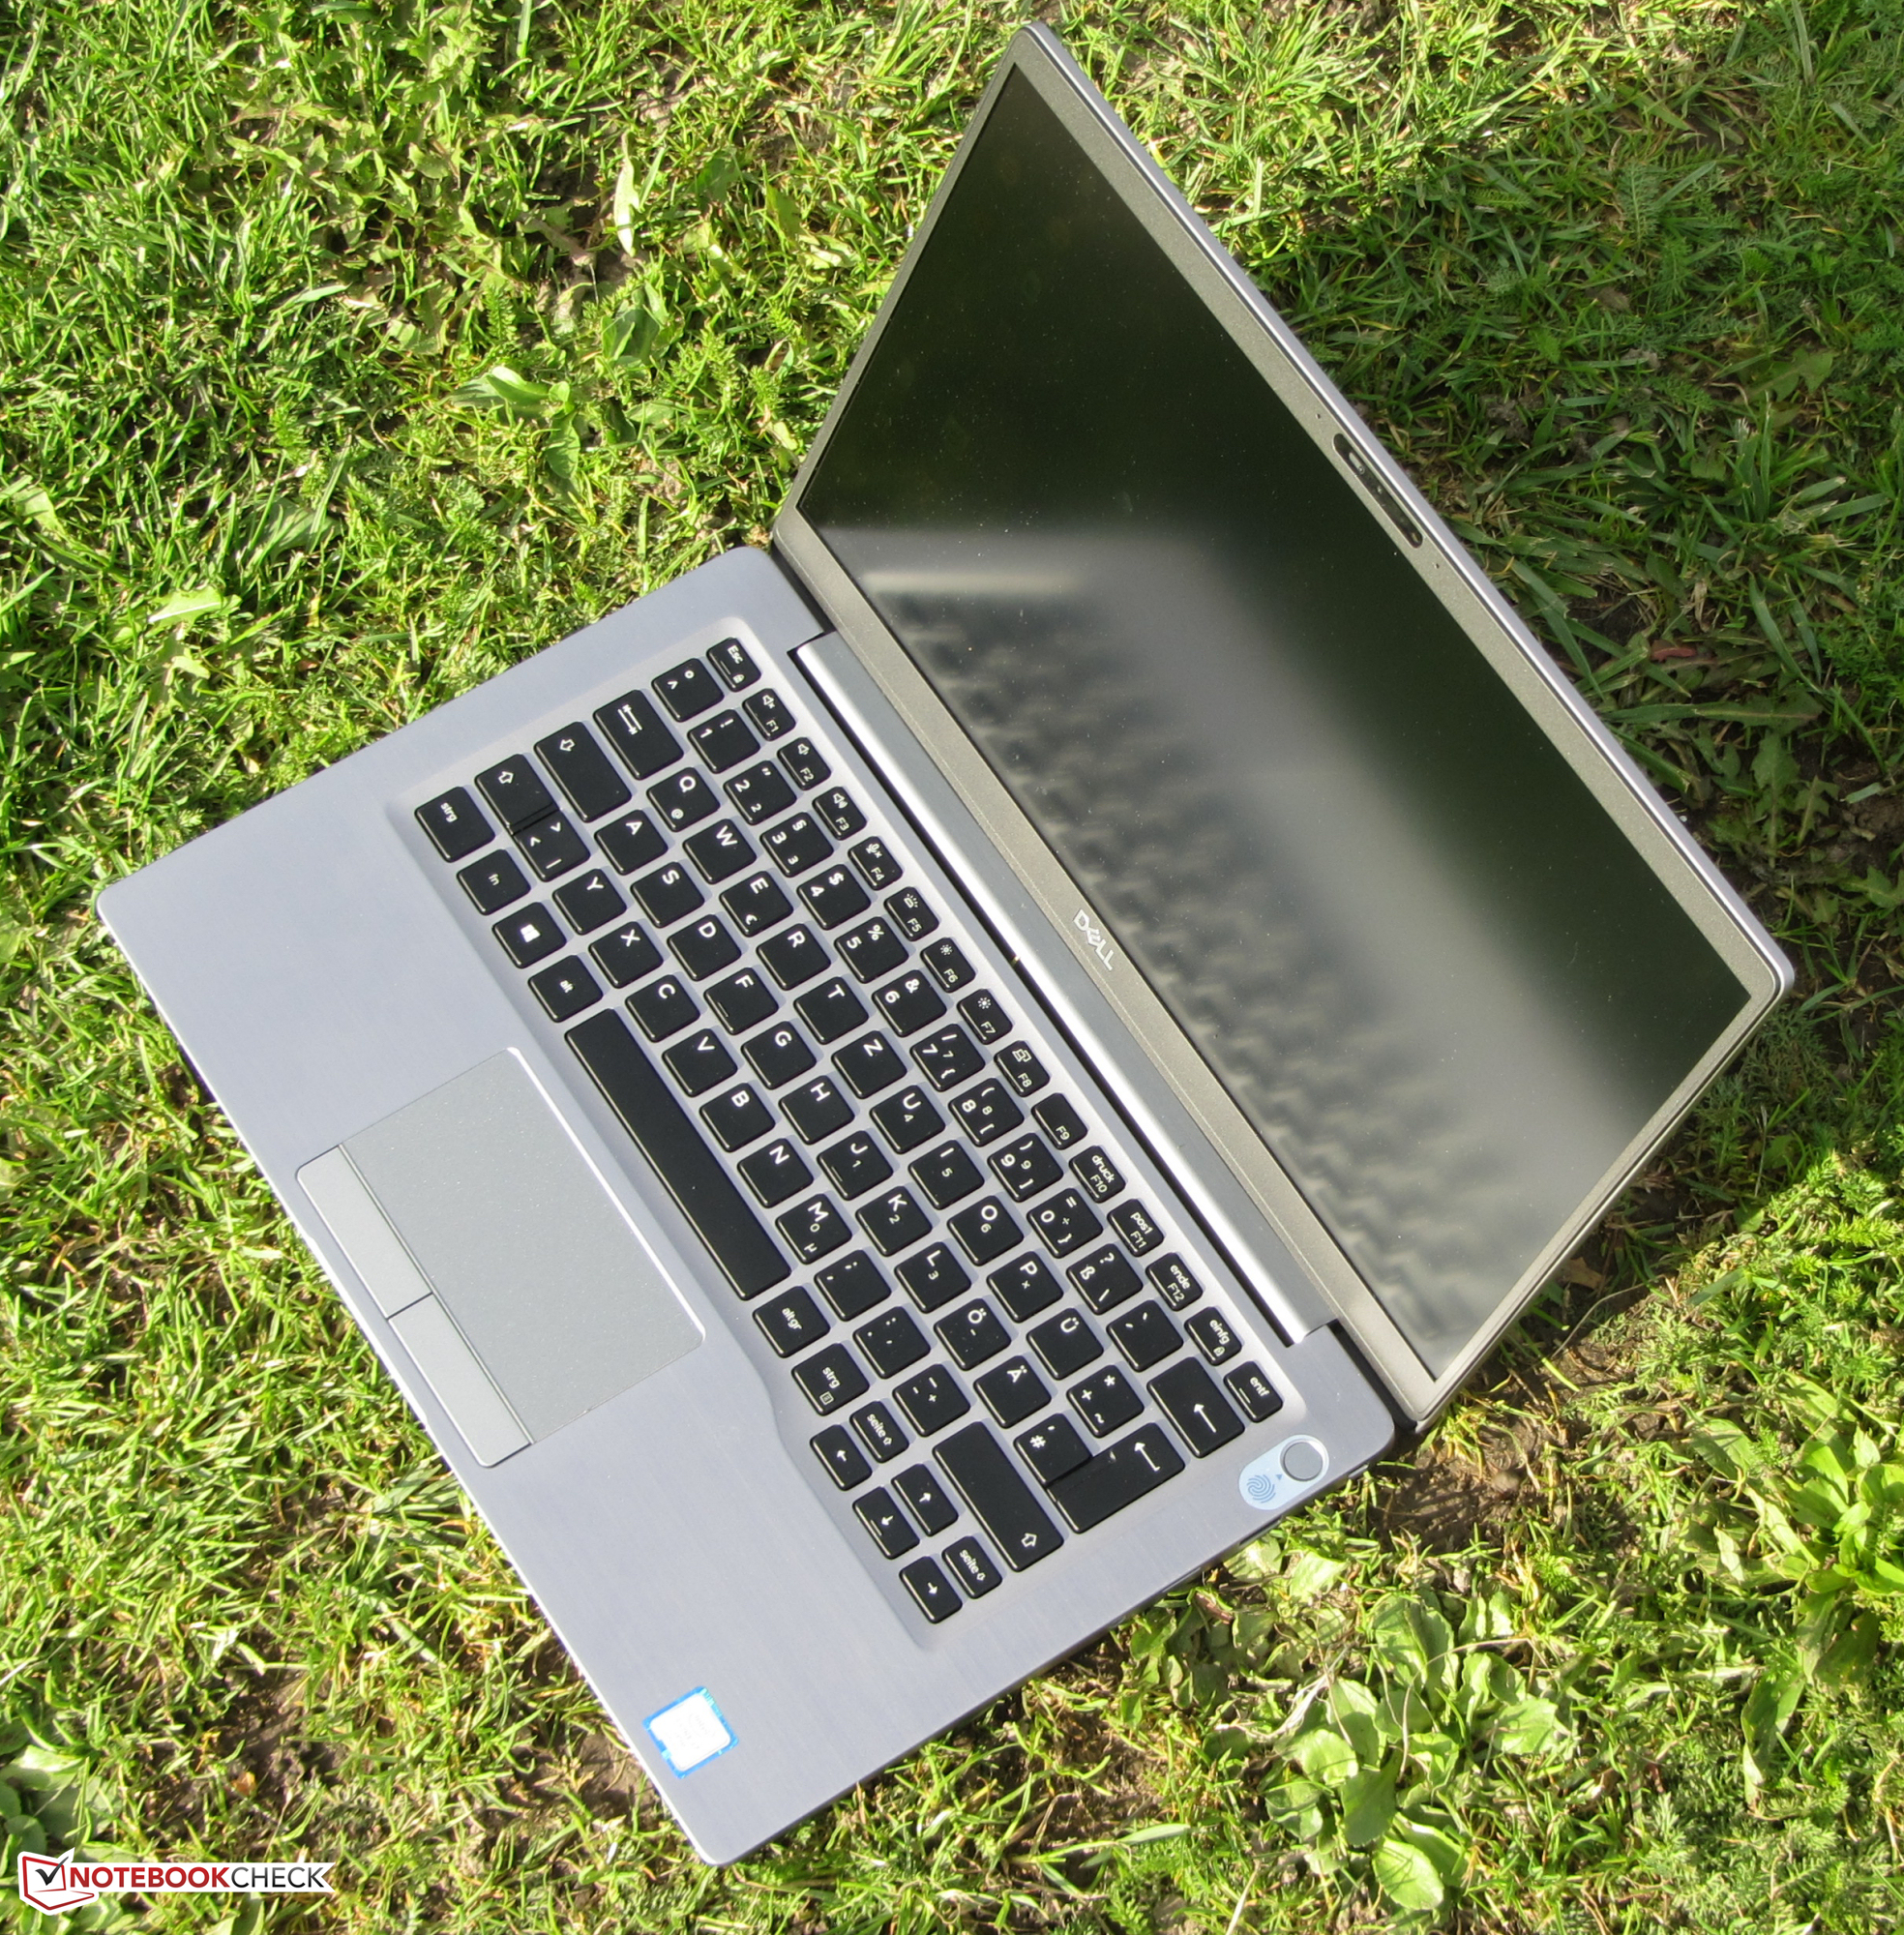
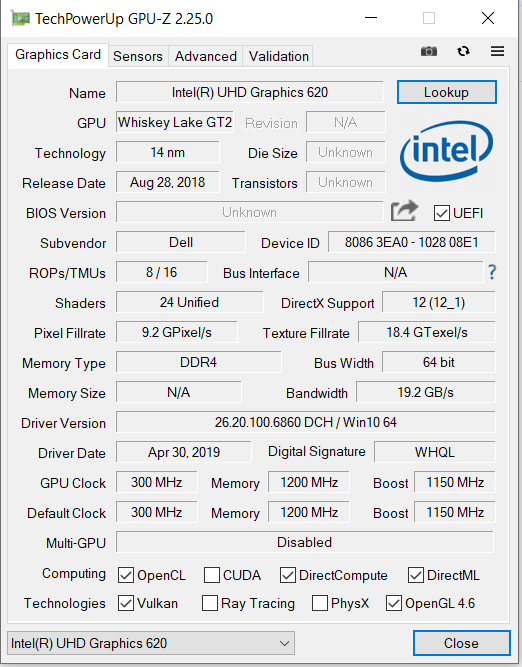
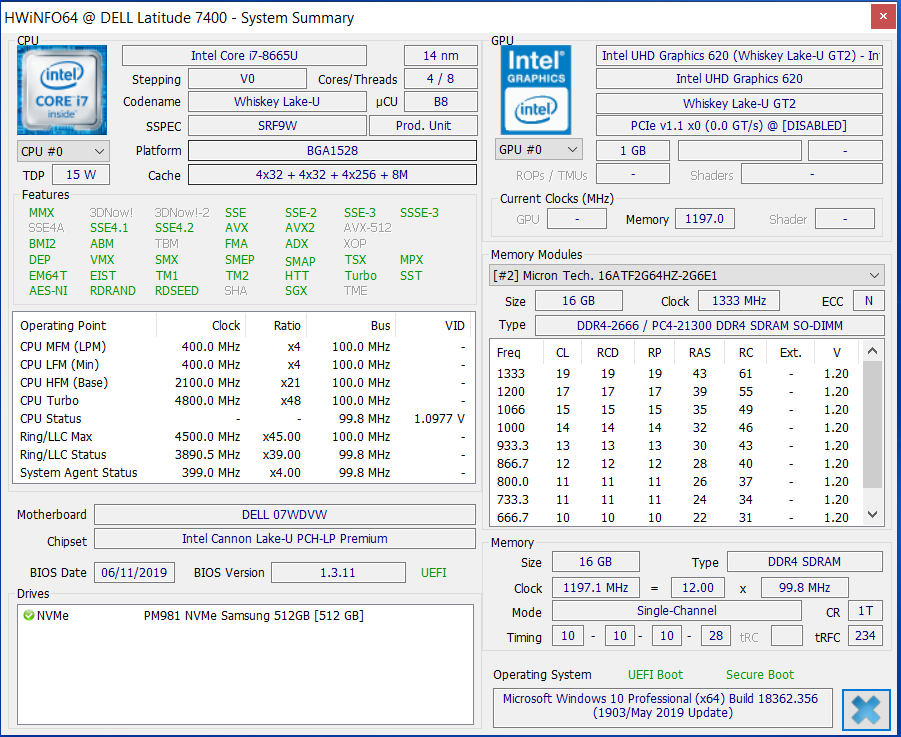
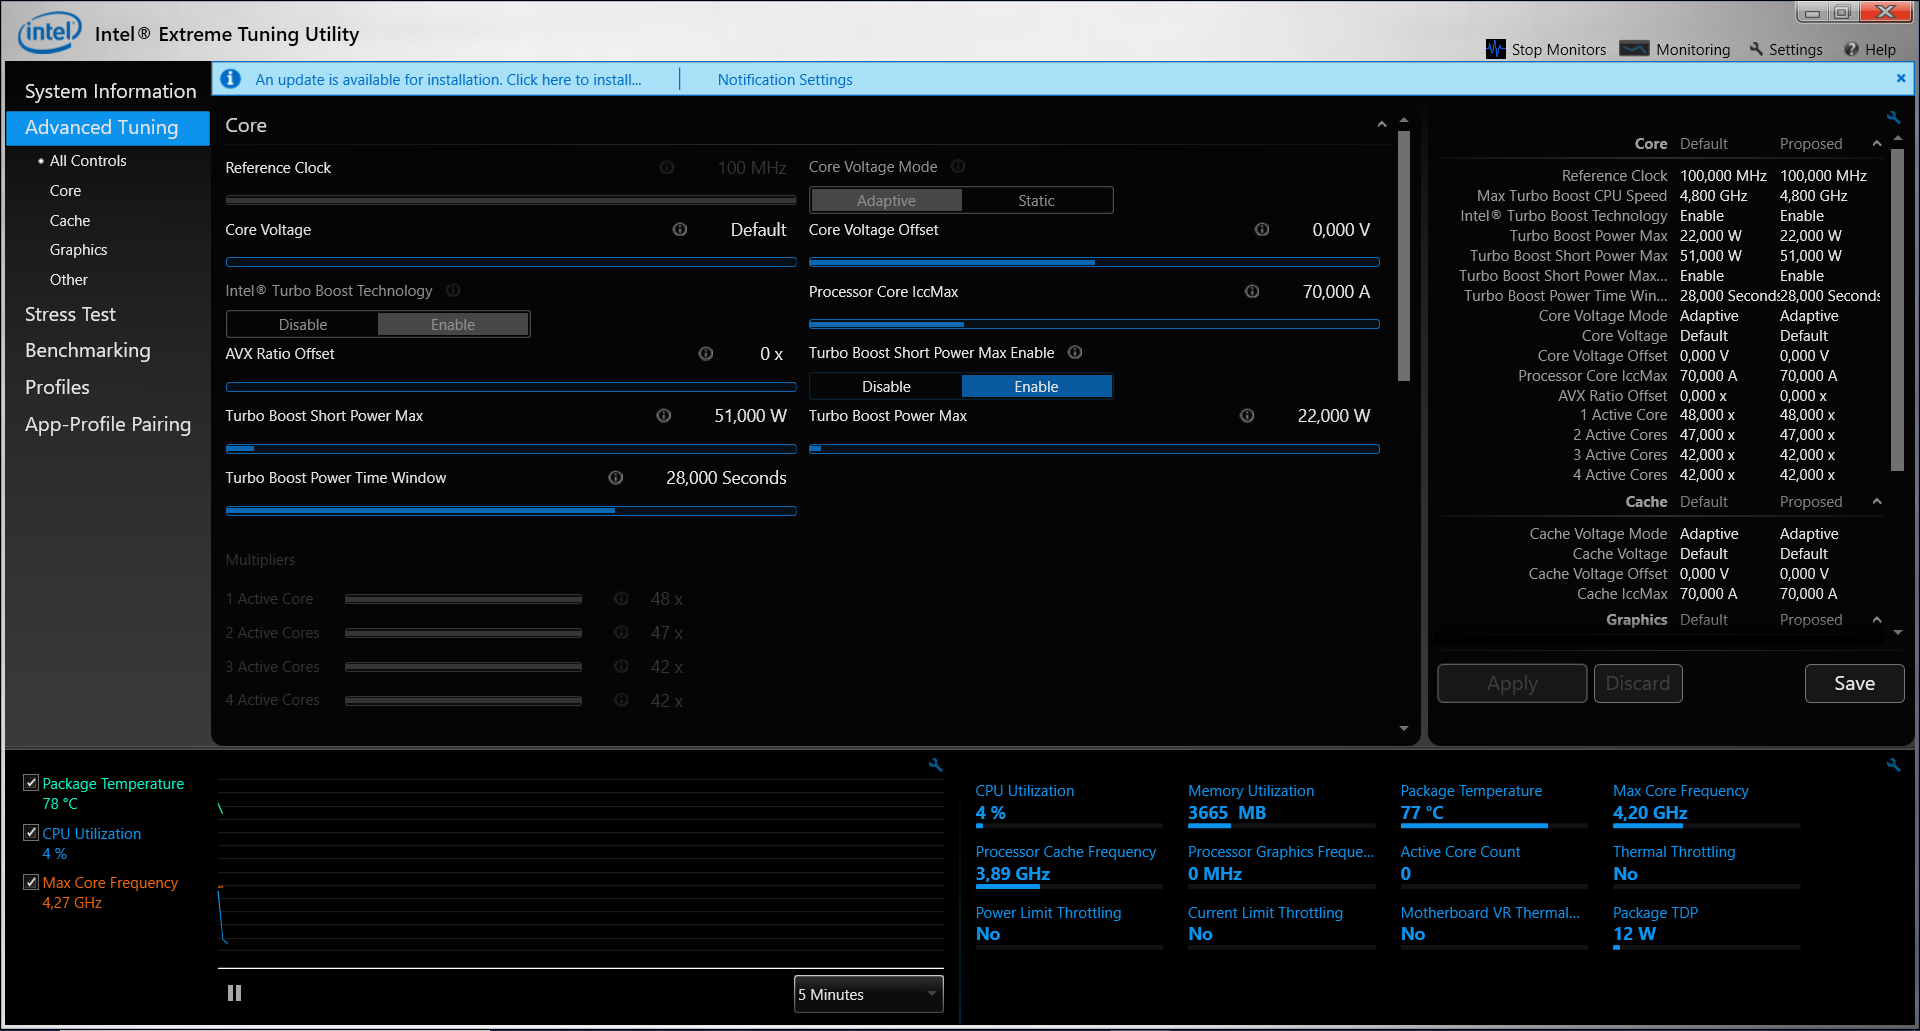
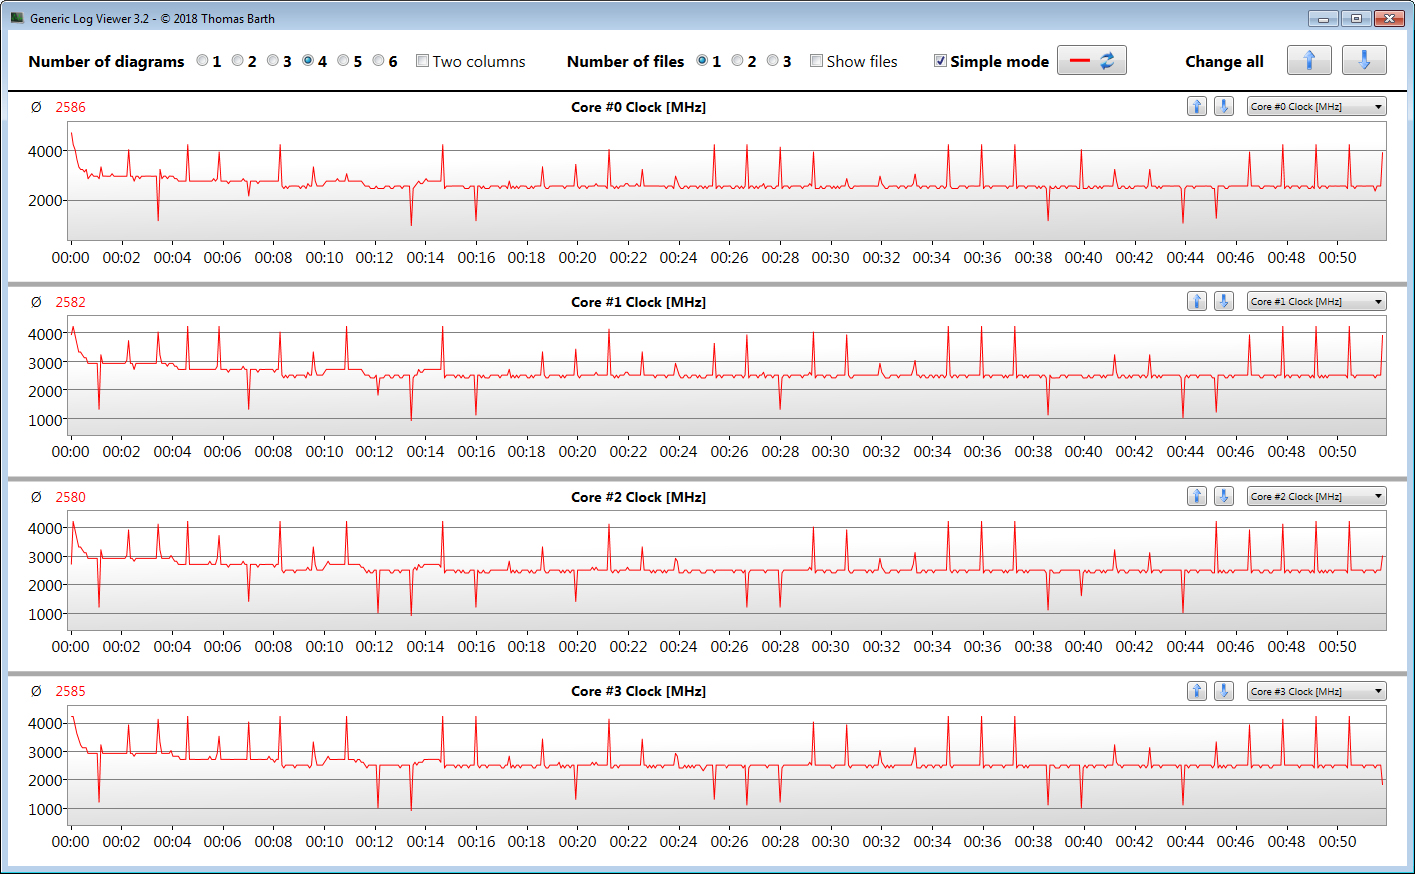
O Dell Latitude 7400 é um pouco mais compacto e mais leve que o seu predecessor. O dispositivo ganha atratividade devido à sua tela com marcos estreitos. As entranhas estão em conformidade com as últimas tendências do setor. Um processador quad-core Whiskey Lake fornece energia computacional suficiente para aplicativos de Office e de Internet. No entanto, todo o seu potencial só pode ser desbloqueado no modo de CA. No modo bateria, a CPU mal usa seu turbo, se é que chega a fazê-lo. Esse é o preço que você paga pela boa duração da bateria.
Com o Latitude 7400, a Dell fornece um portátil comercial de gama alta que não está isento de fraquezas.
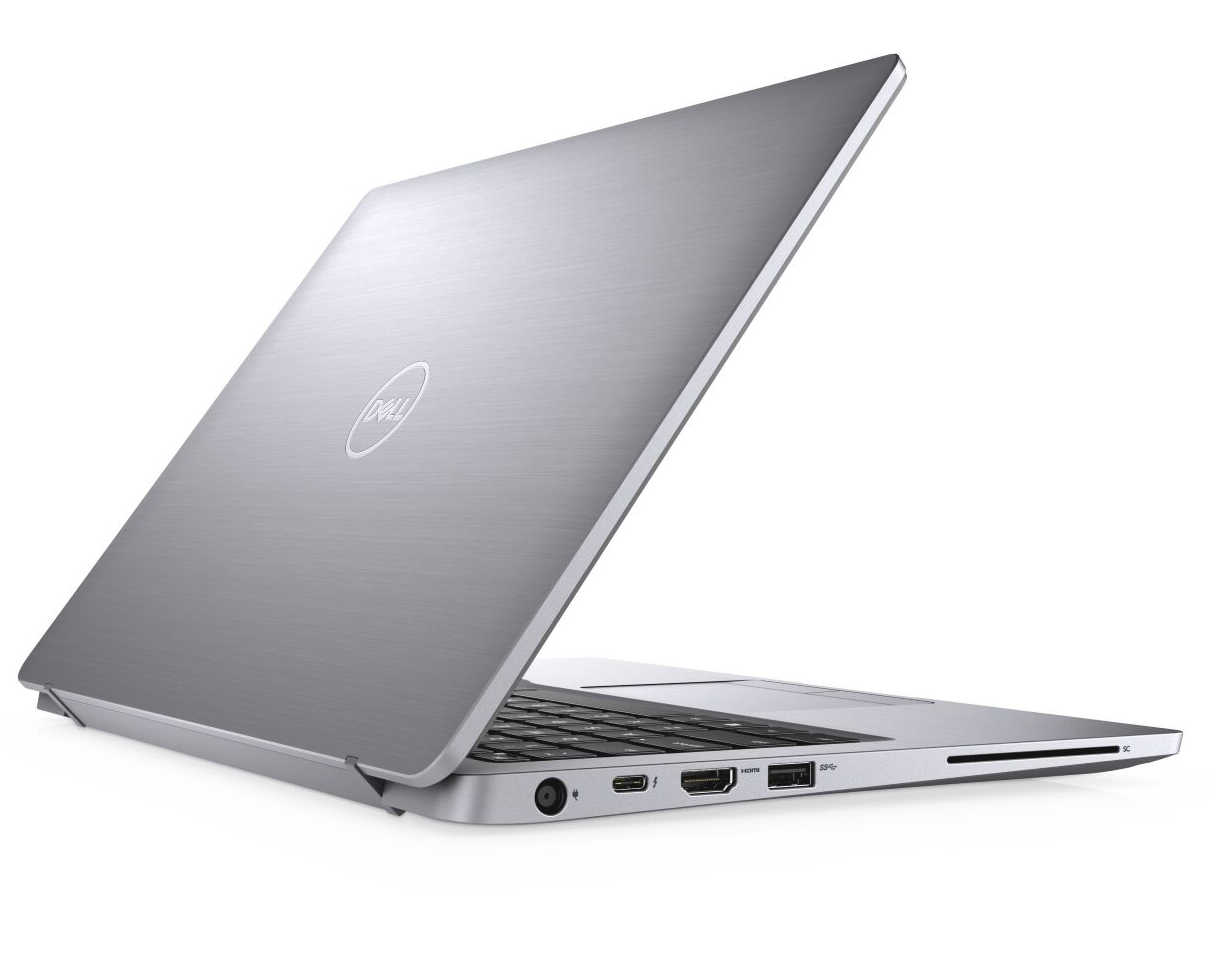
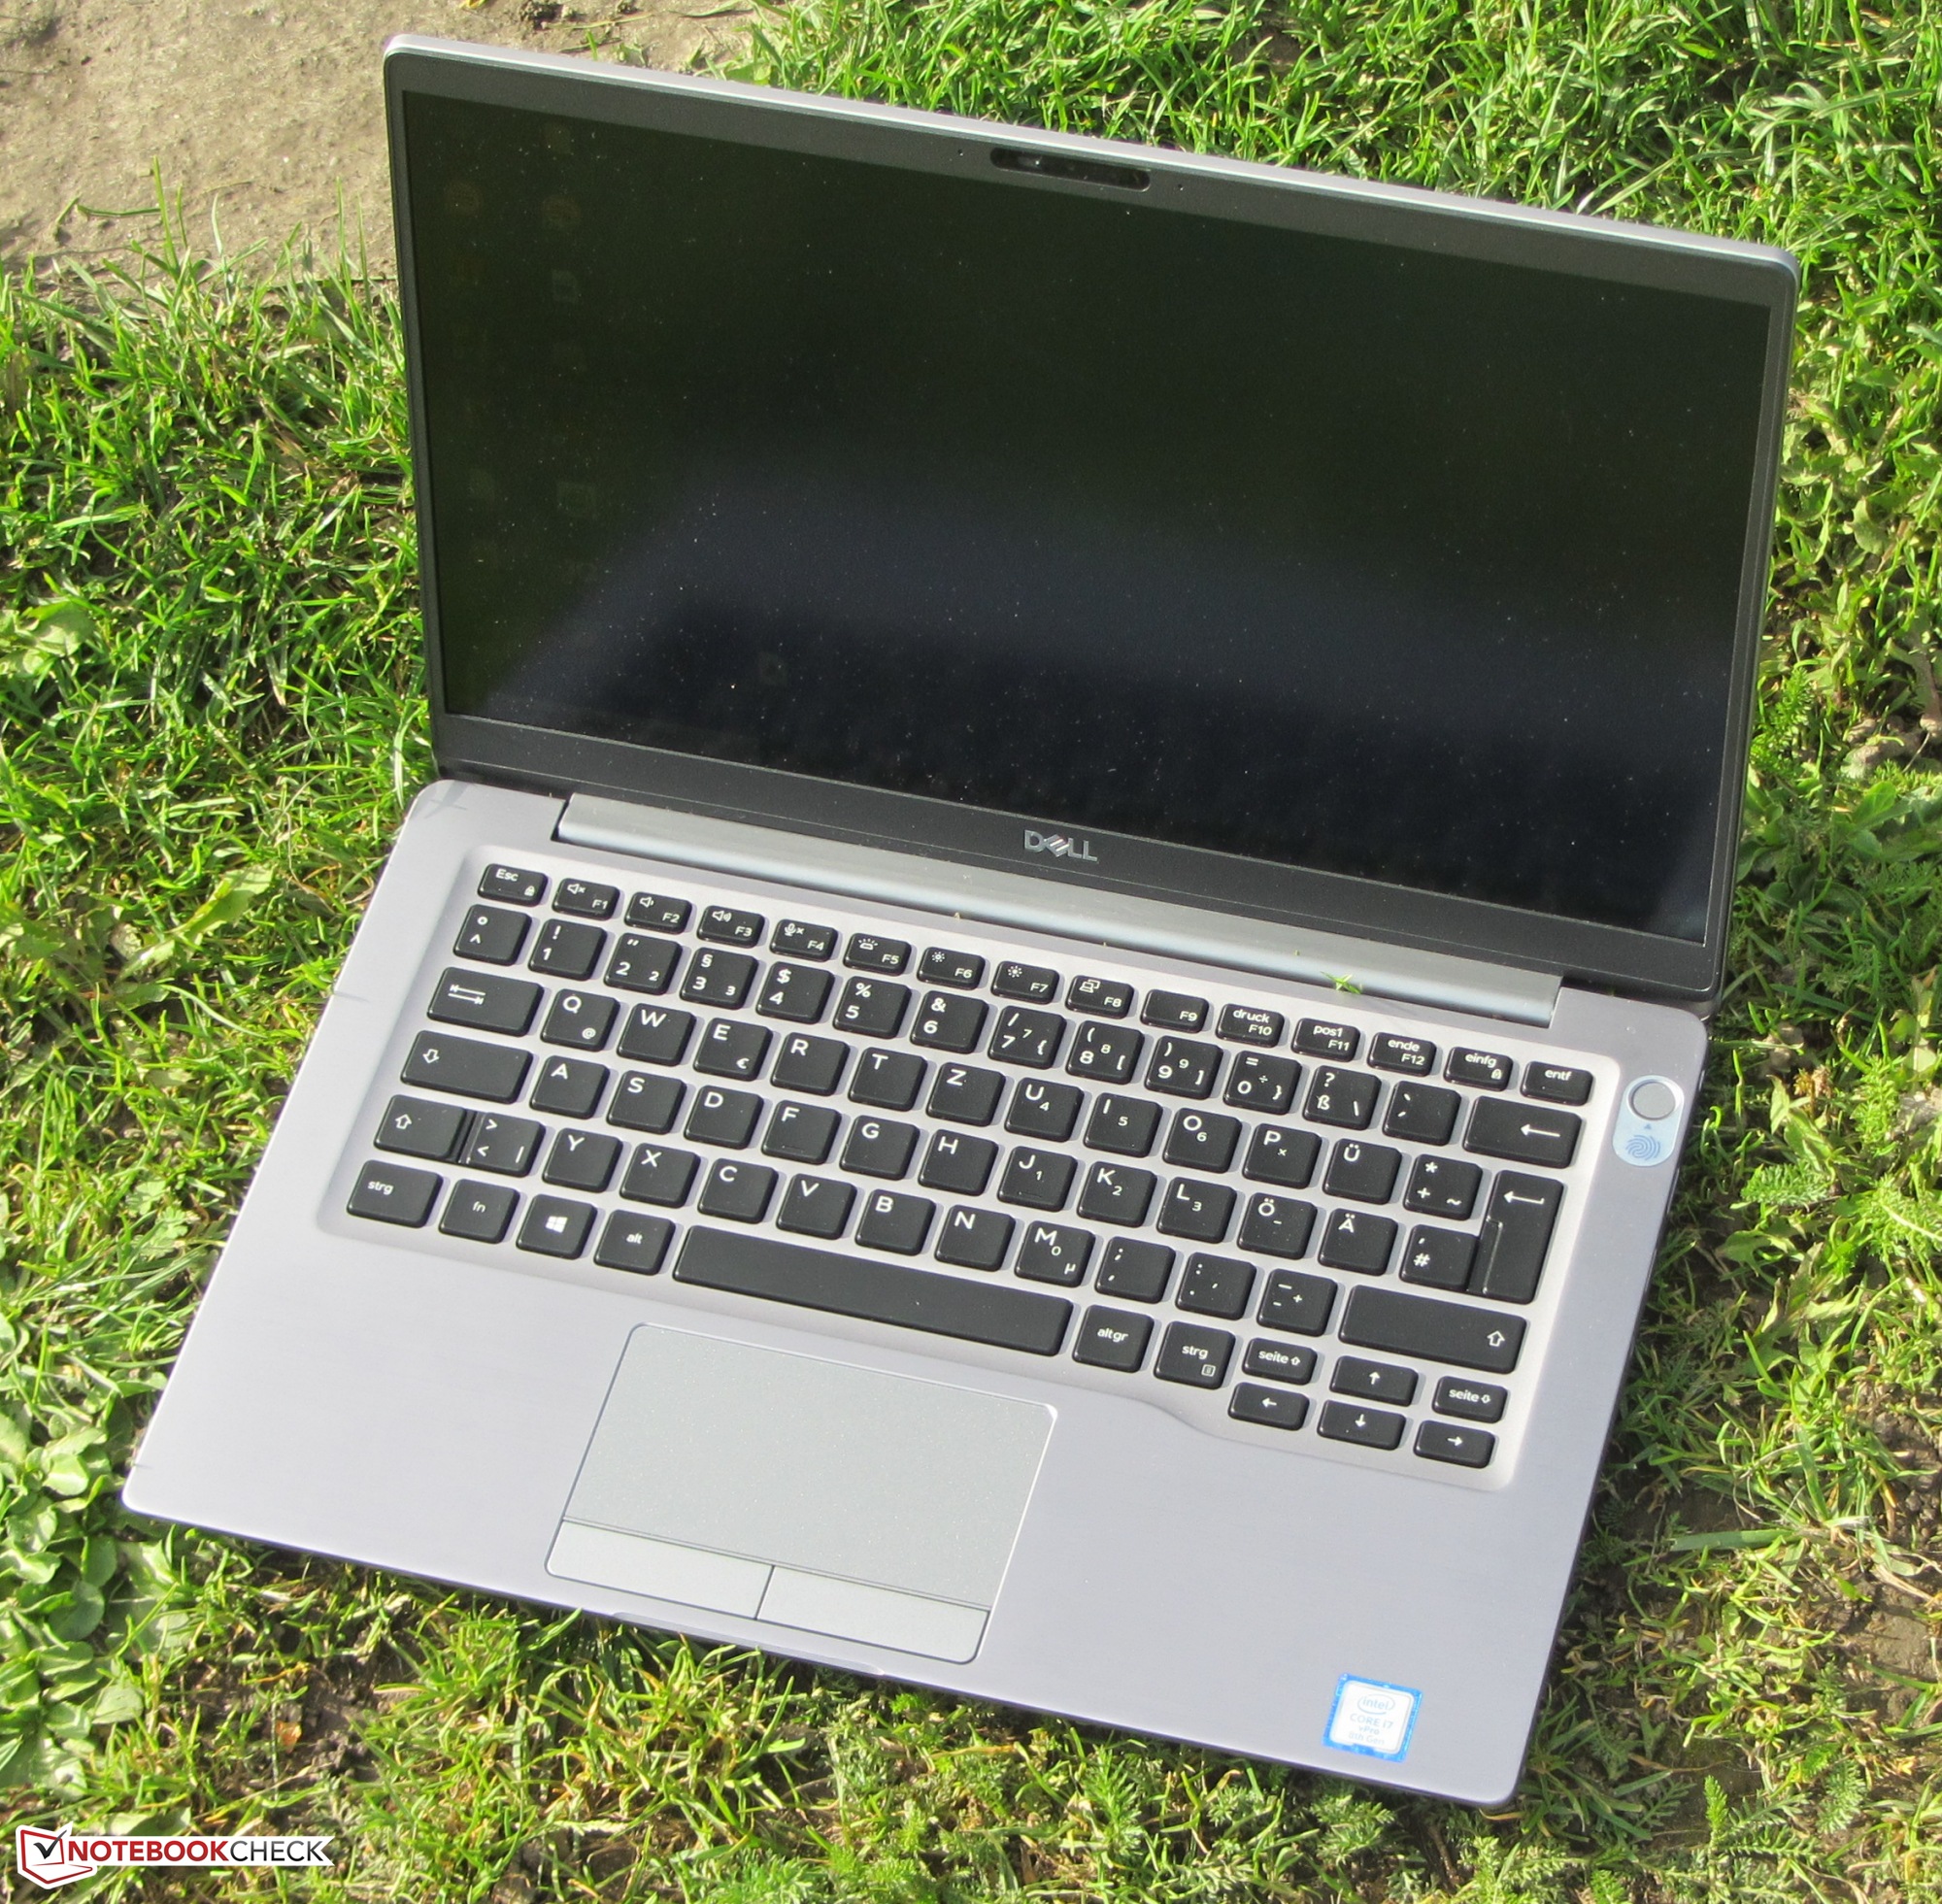
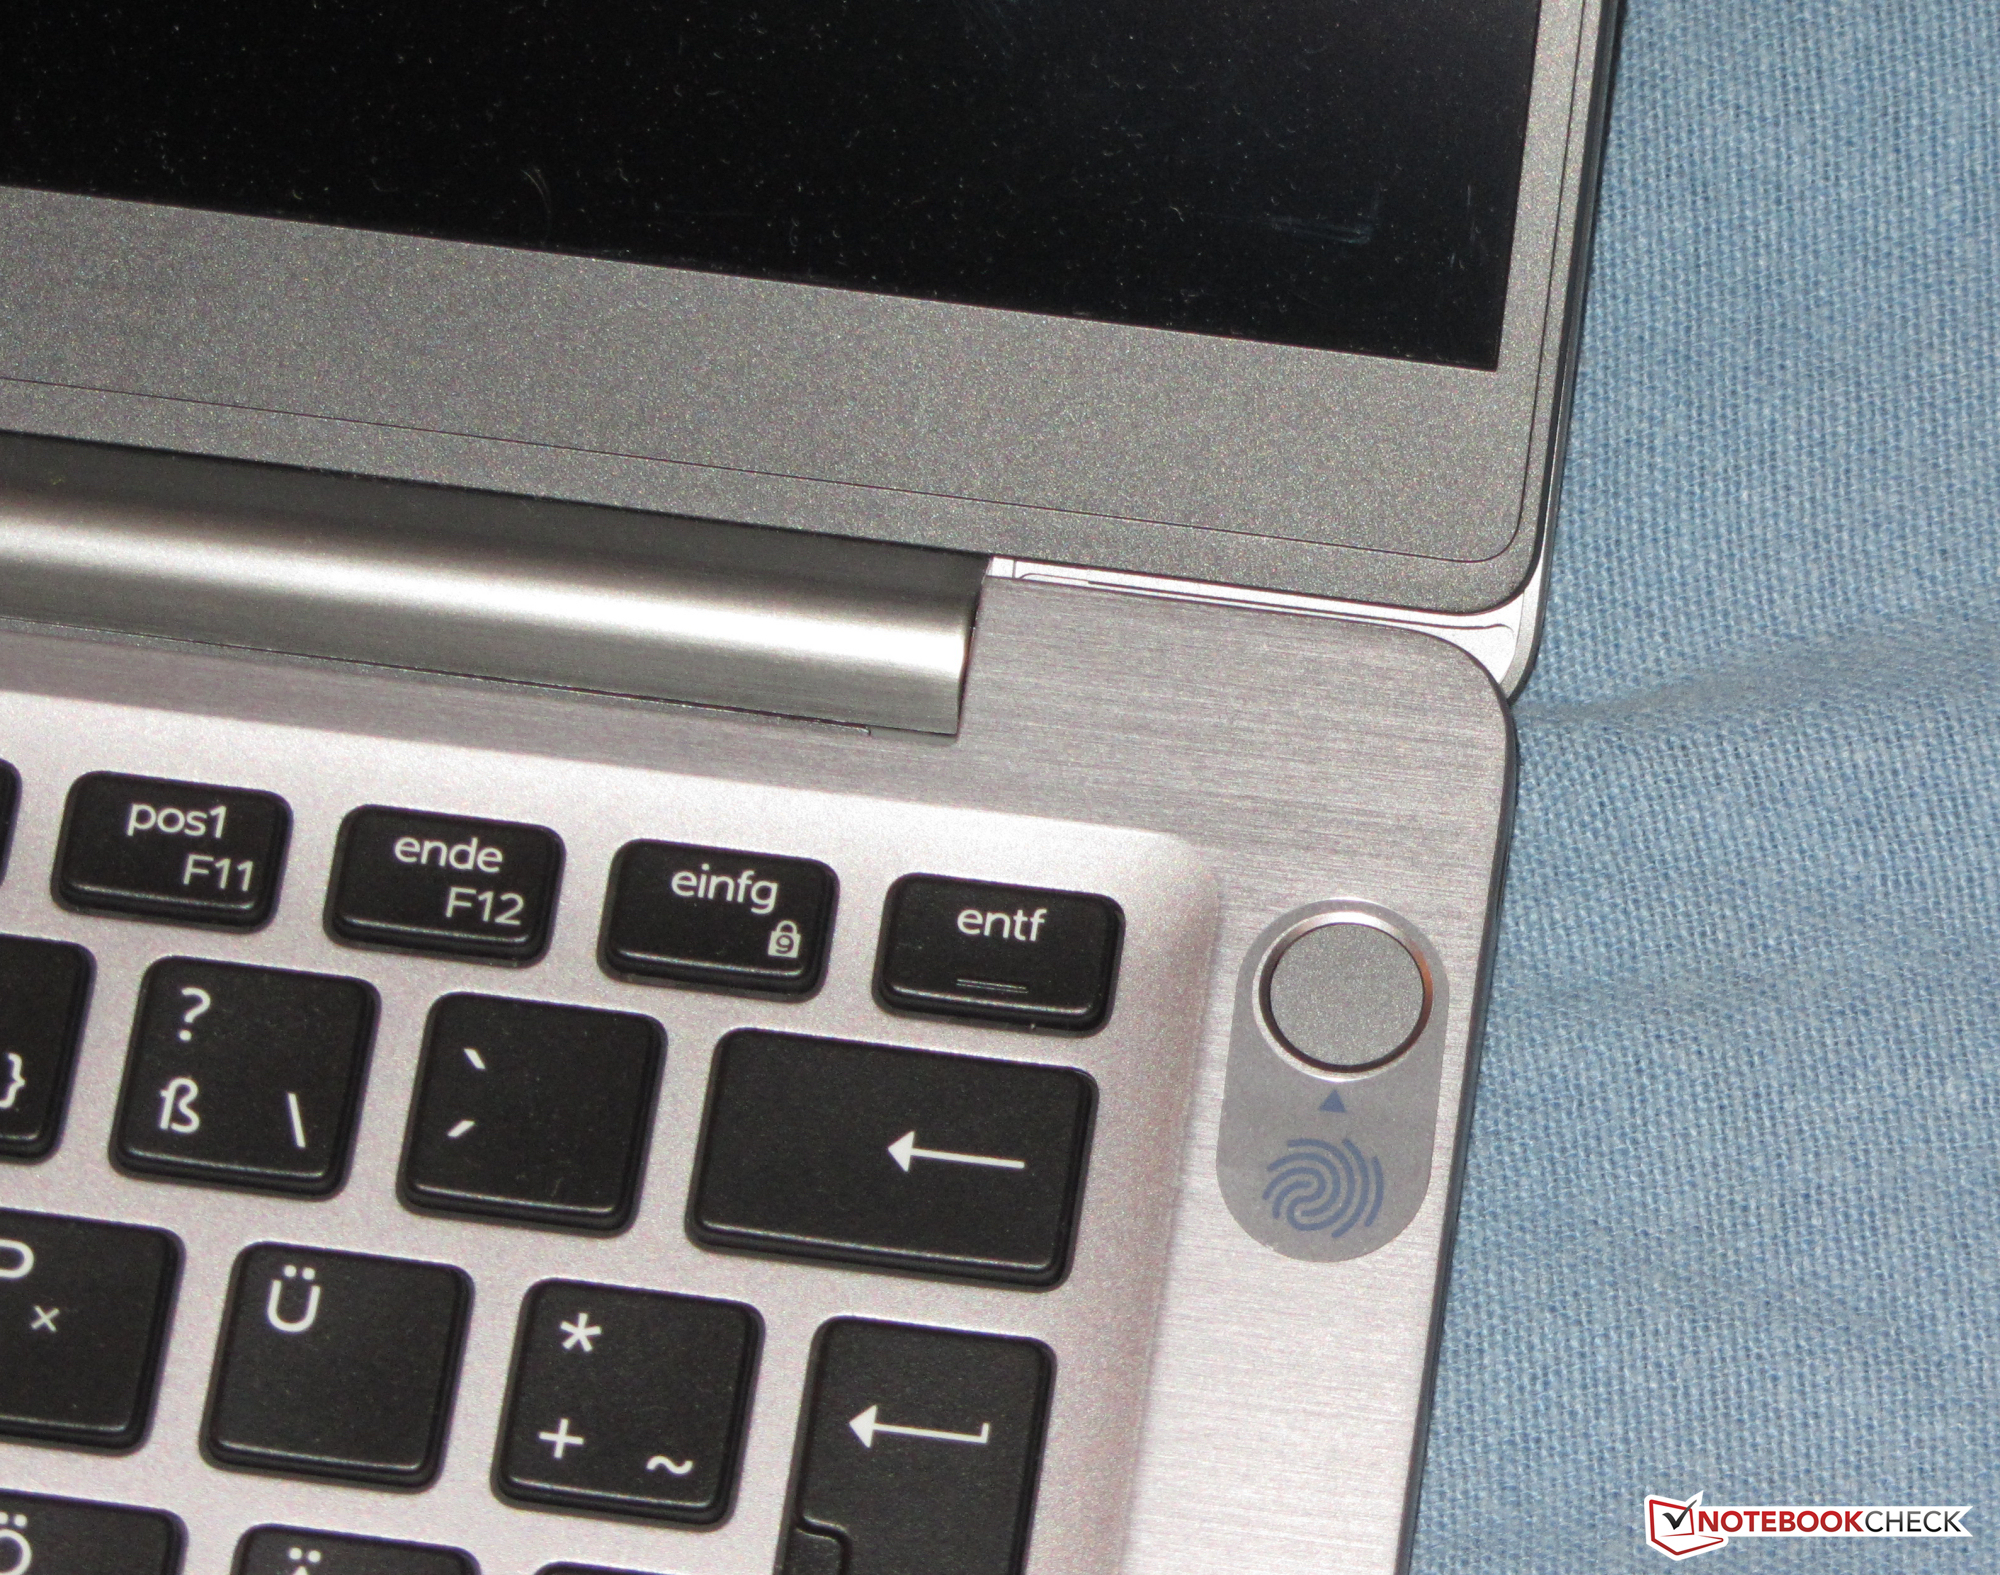
Um veloz SSD NVMe garante um sistema ágil. É possível substituir o SSD No entanto, para isso, a carcaça teria que ser aberta. Um destaque do portátil, em nossa opinião, é o teclado. Este é um dos melhores teclados que vimos até agora. Obviamente, uma iluminação por tecla (dois níveis) está a bordo.
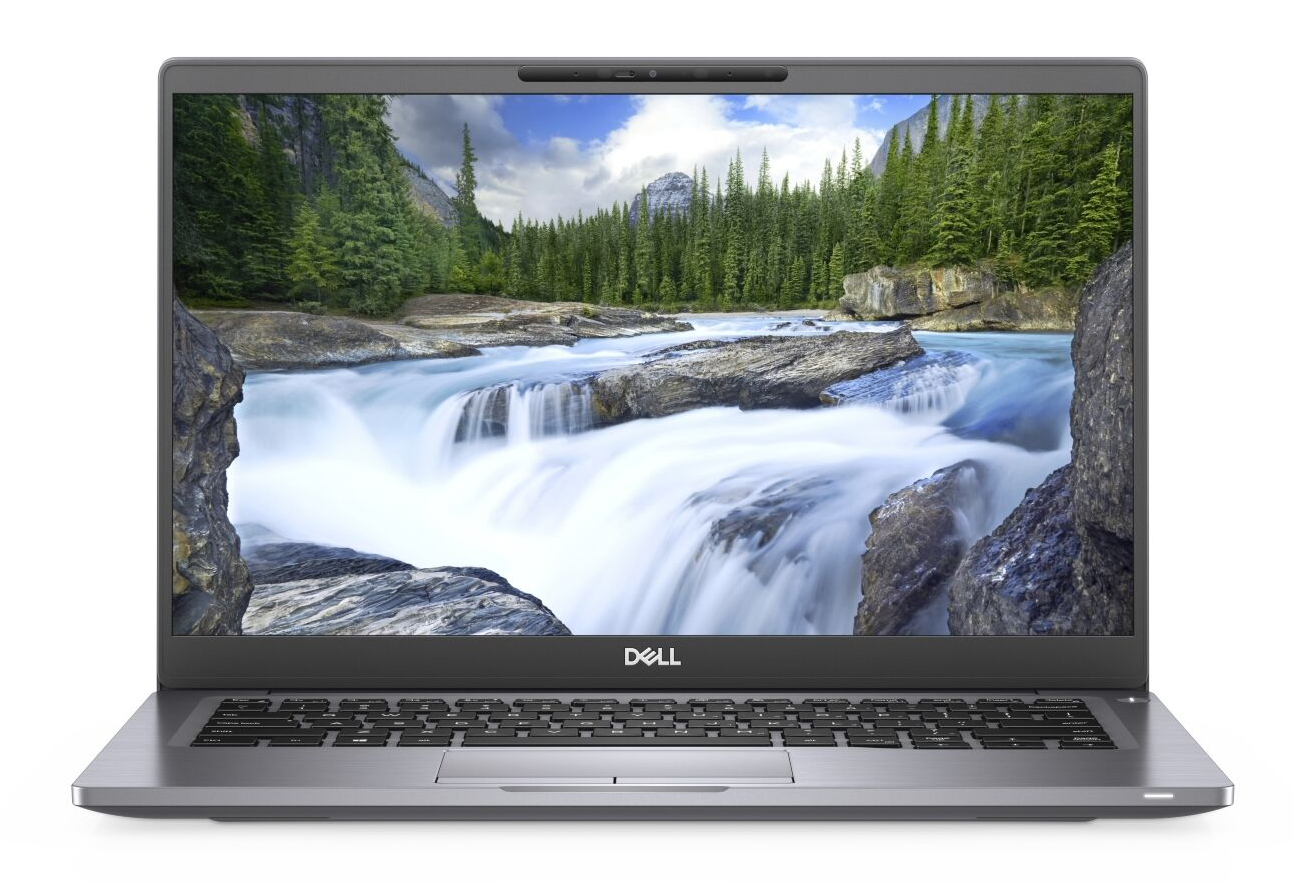
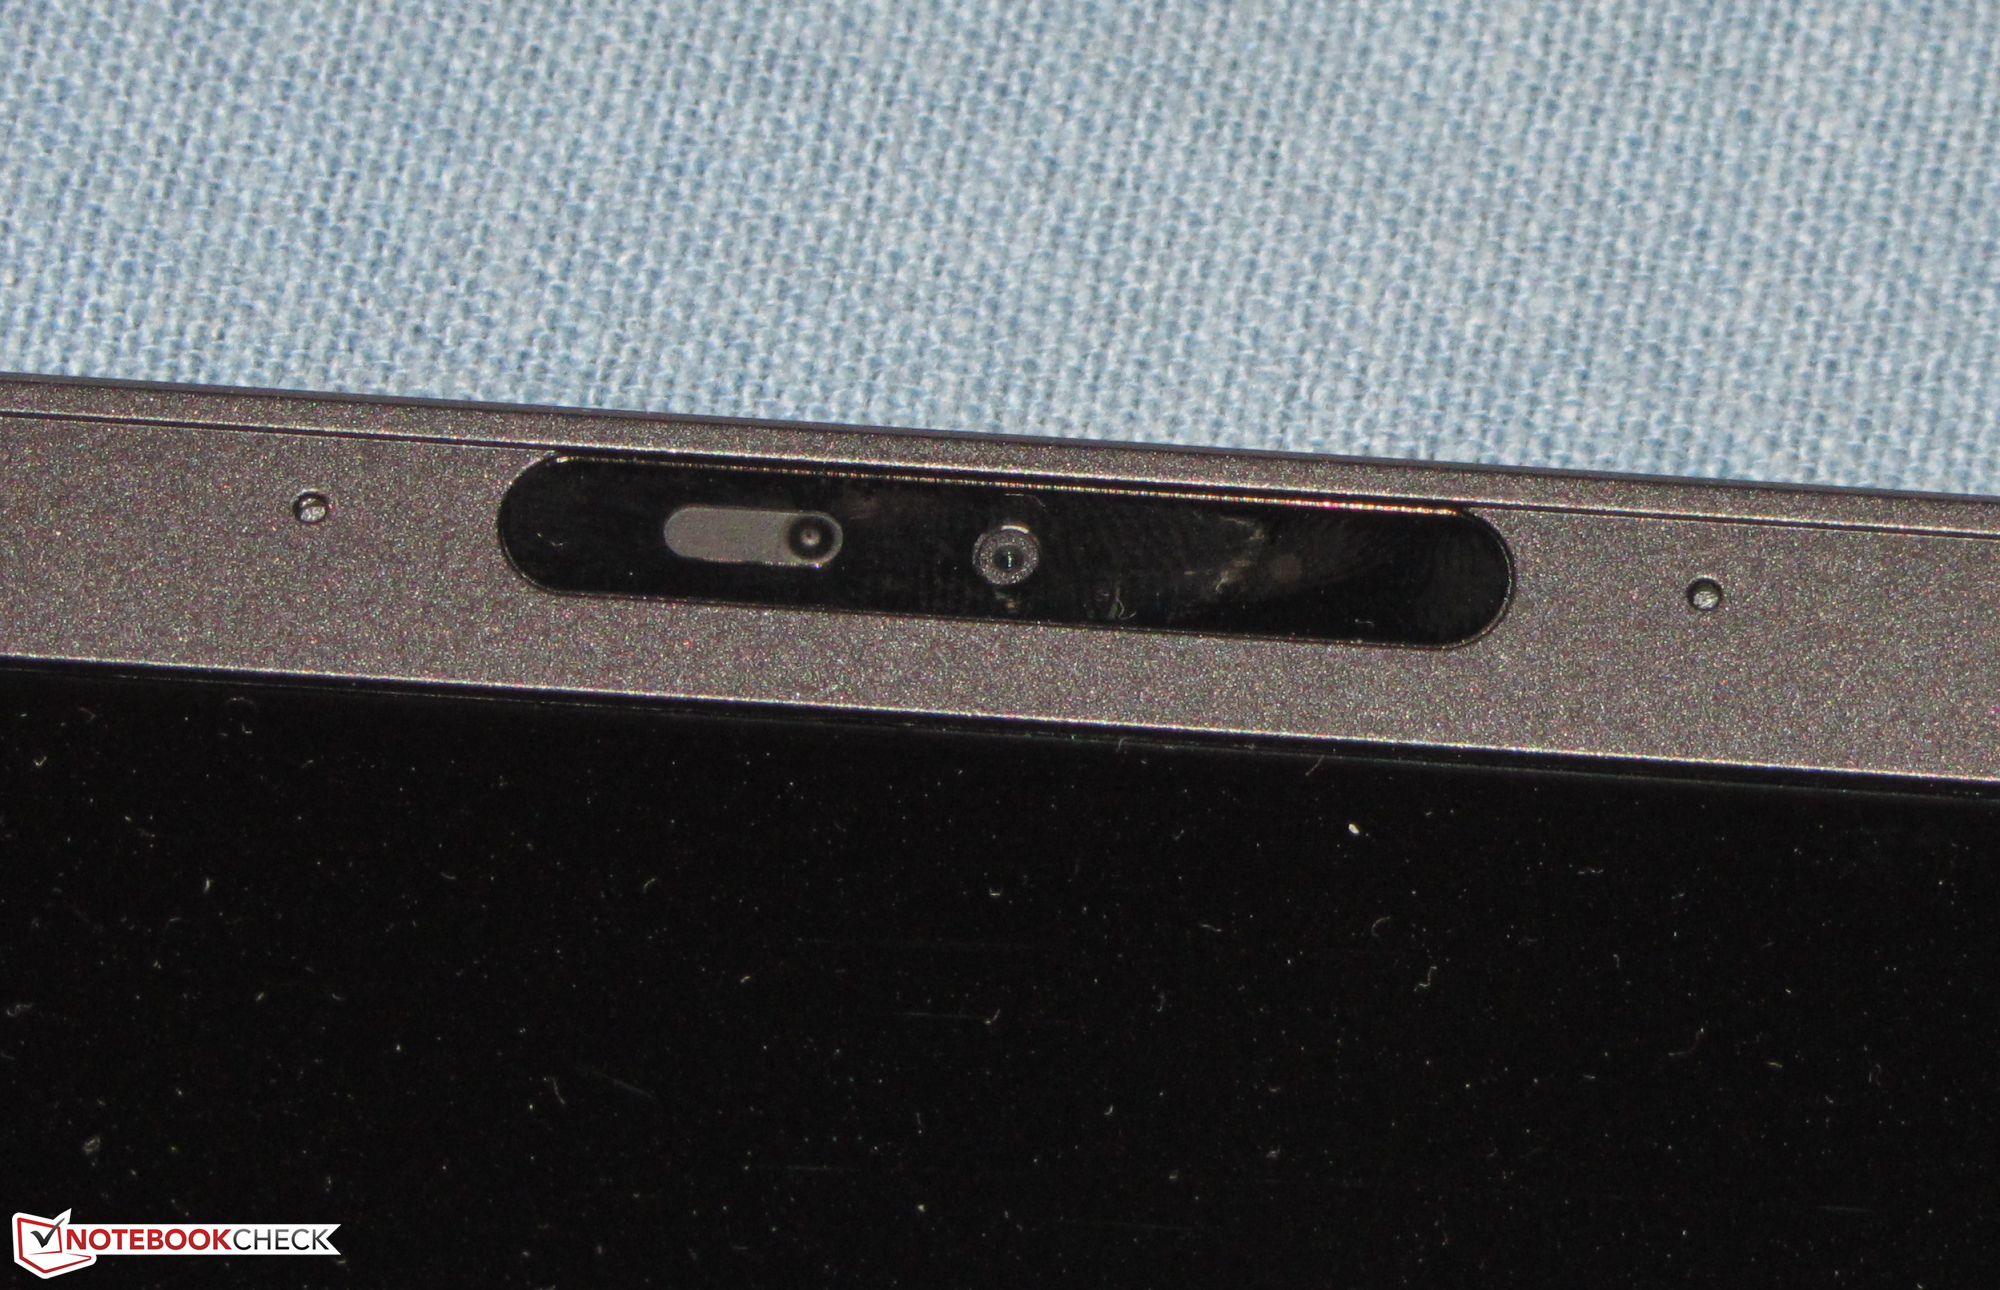
a tela IPS mate ganha pontos com ângulos de visão estáveis, bom contraste, uma representação de cores decente de fábrica e uma boa cobertura do espaço de cores. O brilho da tela é bom, mas deveria ser melhor para um portátil nessa faixa de preço. Assim, o portátil não pode realmente ser usado em exteriores.
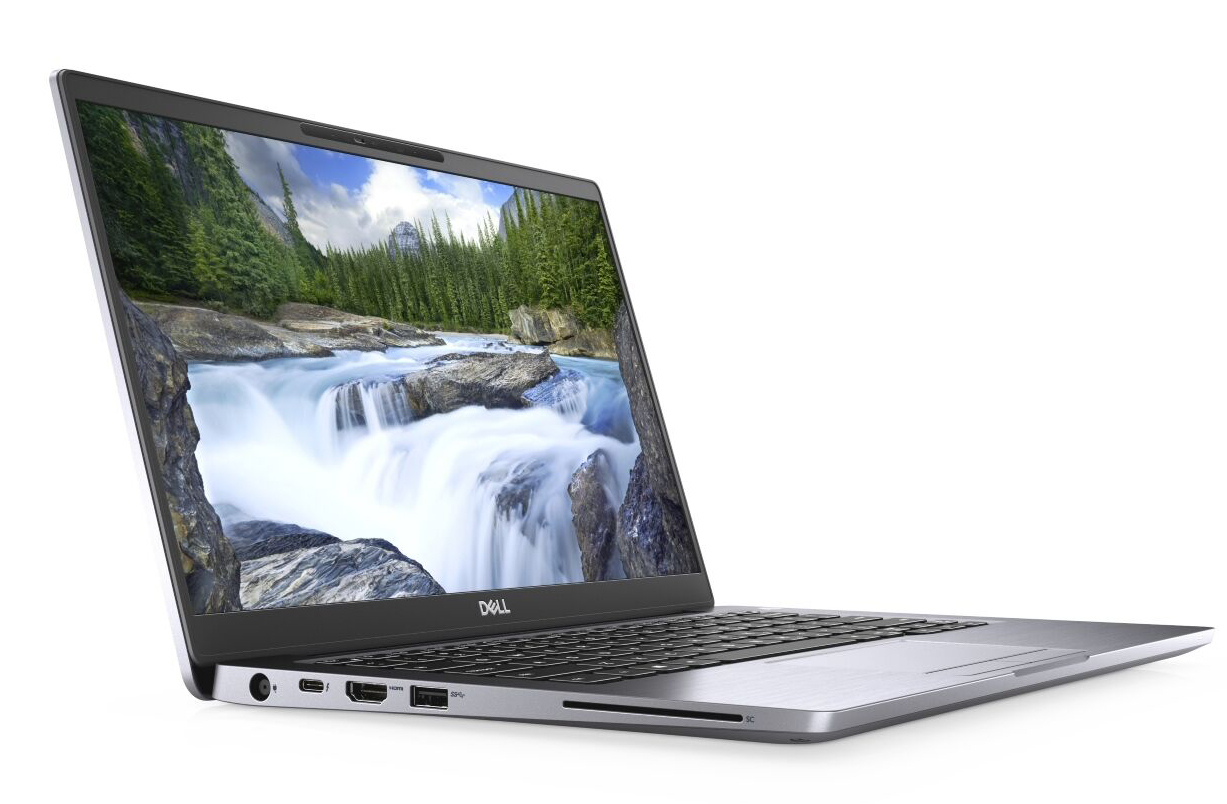
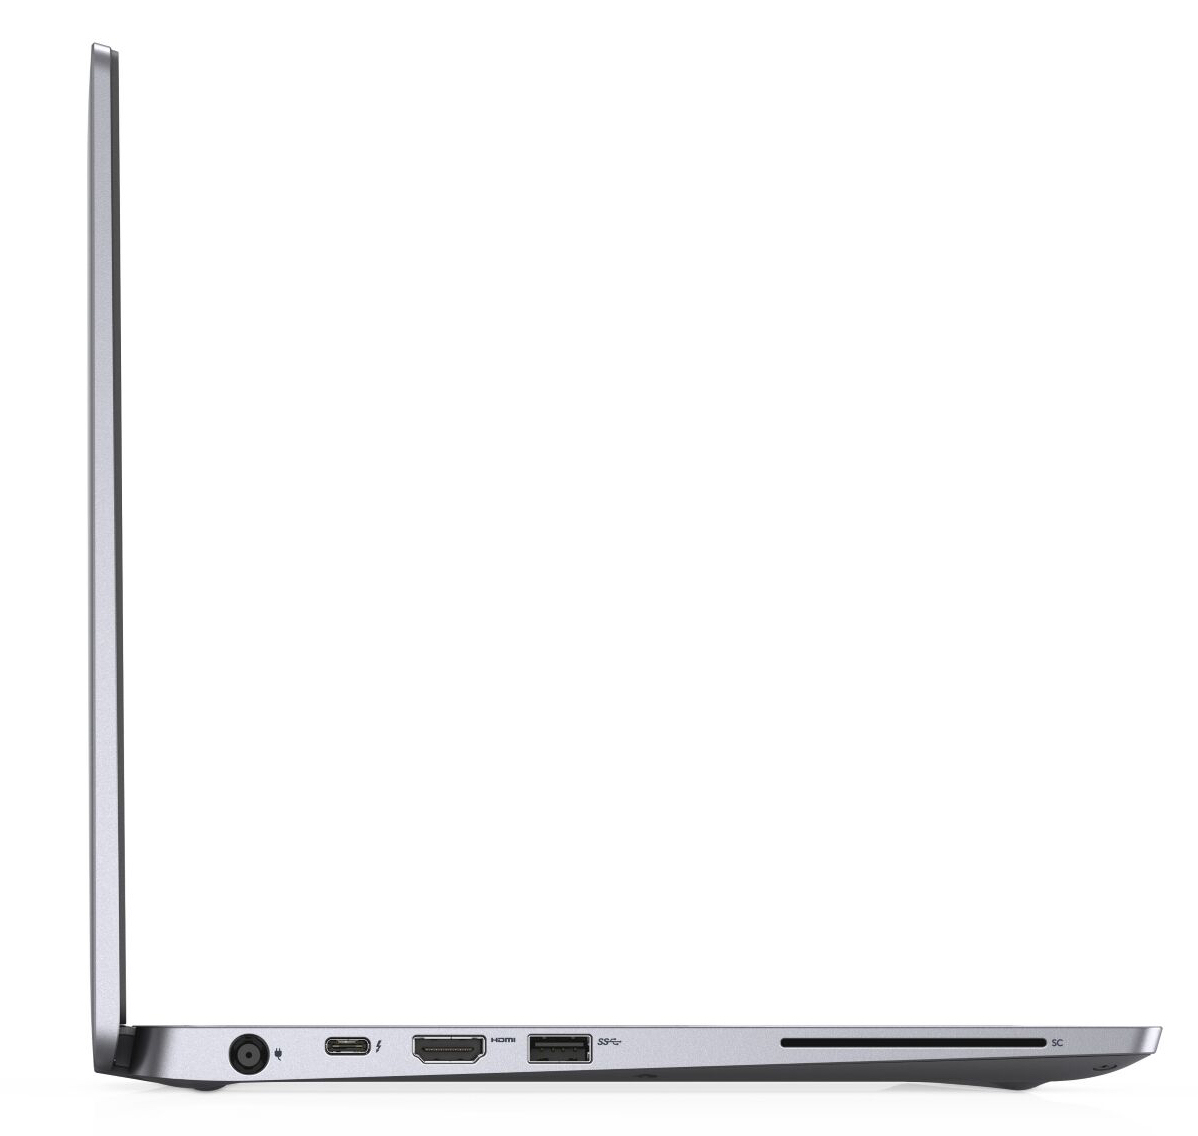
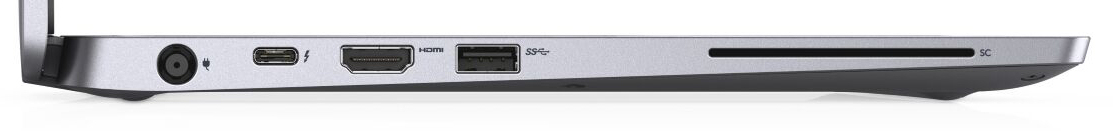
A porta Thunderbolt 3 permite a conexão de soluções docking e/ou uma GPU externa poderosa. Obviamente, a porta suporta Power Delivery 3.0 e DisplayPort sobre USB-C (isso requer um adaptador separado). Infelizmente, o ventilador emite um assobio.
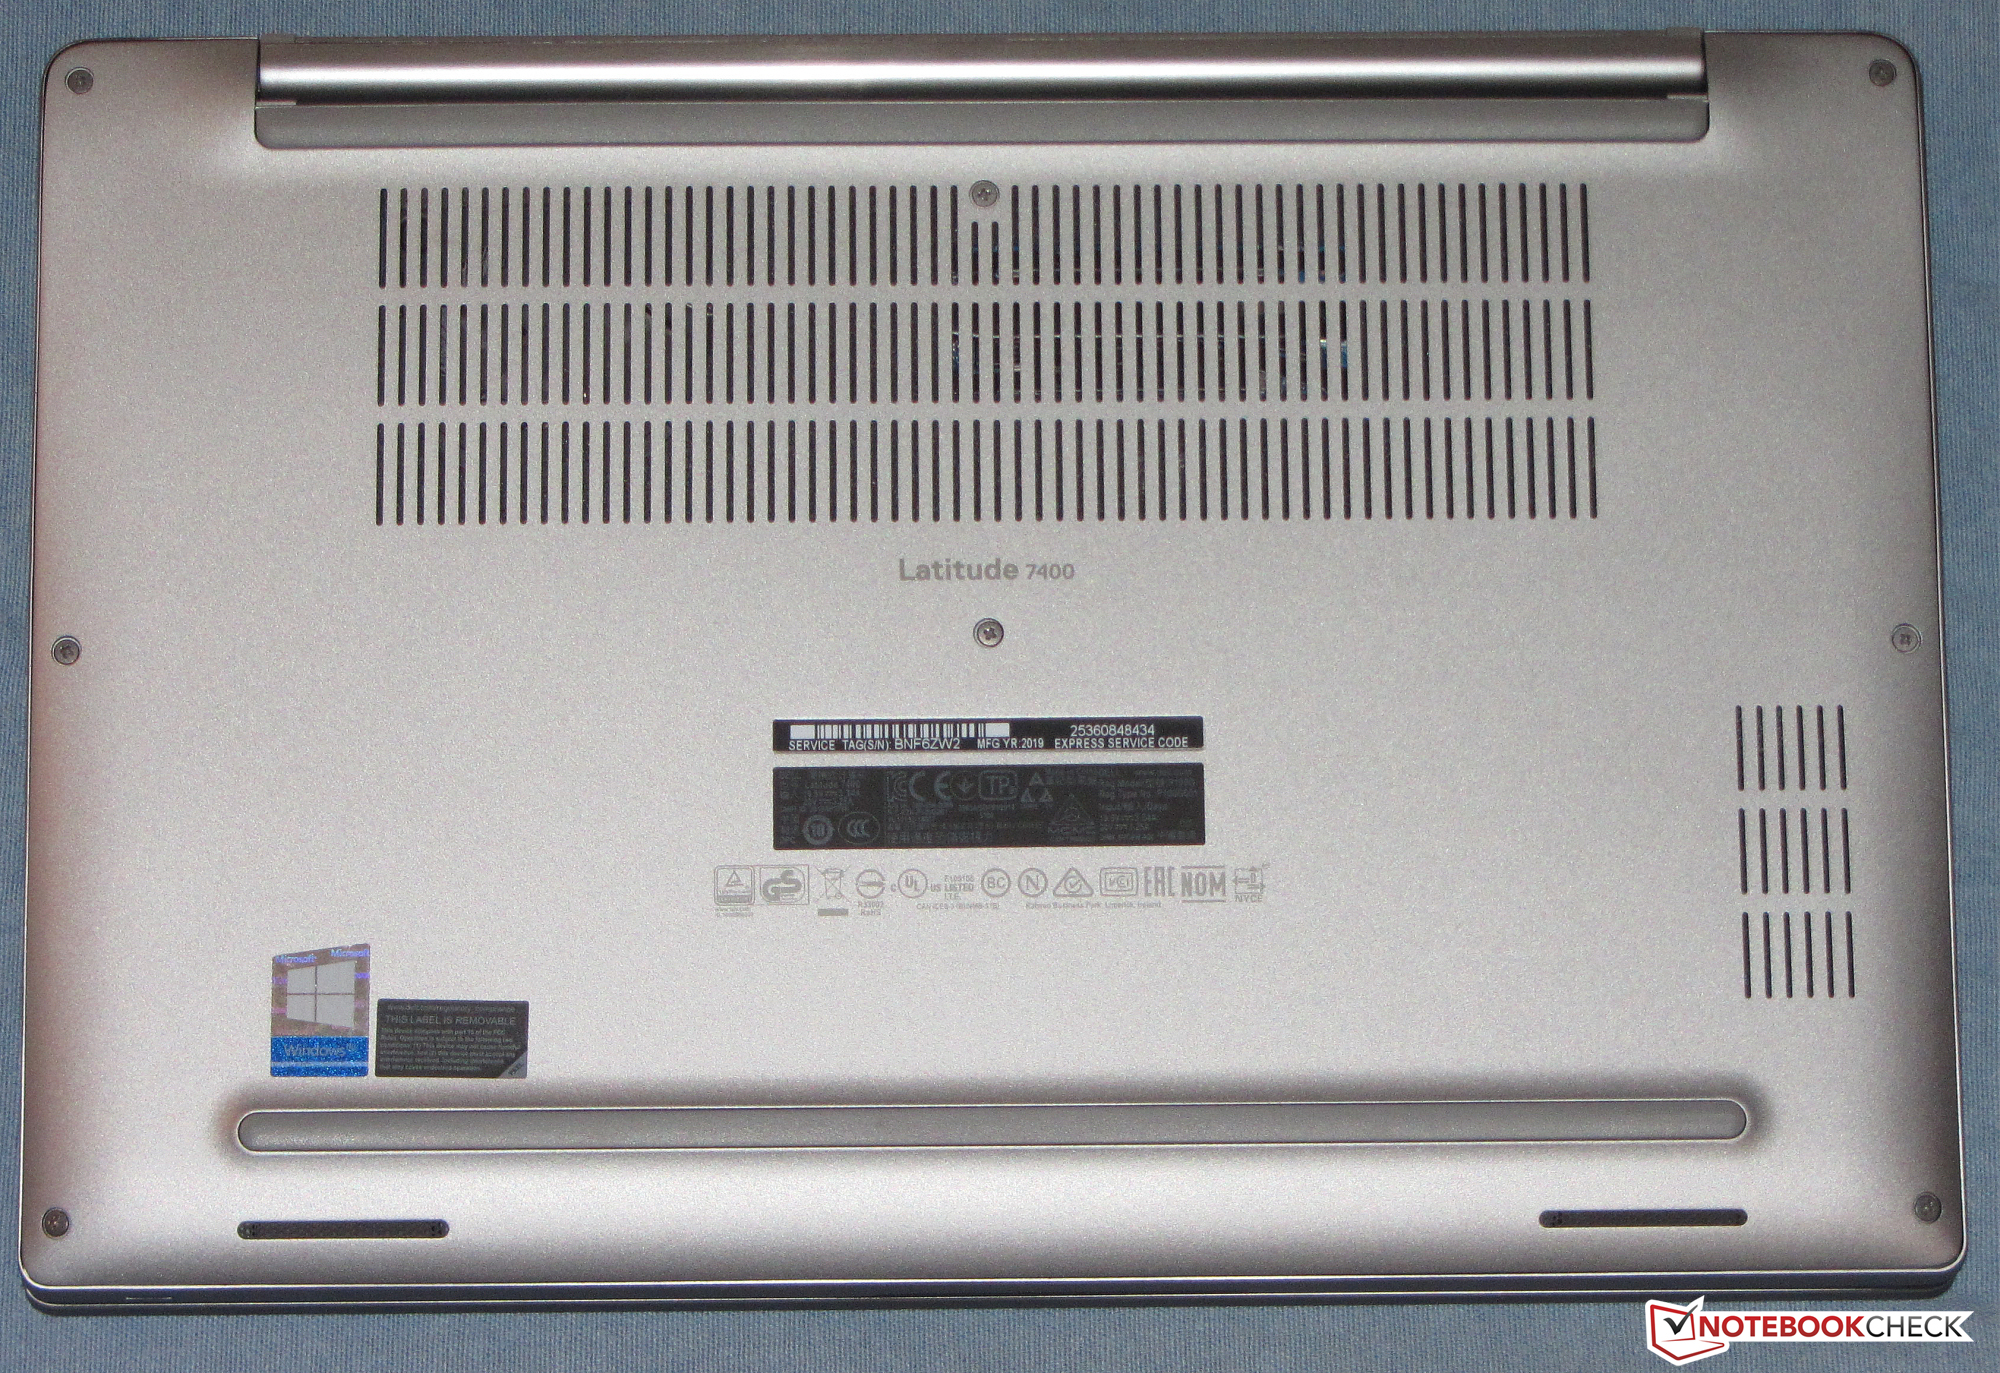
Dell Latitude 7400-8N6DH
- 09/19/2019 v7 (old)
Sascha Mölck