Breve Análise do MacBook Pro 13 2020: O subportátil da Apple somente recebe a atualização obrigatória
Avaliação | Data | Modelo | Peso | Altura | Size | Resolução | Preço |
|---|---|---|---|---|---|---|---|
| 92.1 % v7 (old) | 06/2020 | Apple MacBook Pro 13 2020 2GHz i5 10th-Gen i5-1038NG7, Iris Plus Graphics G7 (Ice Lake 64 EU) | 1.4 kg | 15.6 mm | 13.30" | 2560x1600 | |
| 90.7 % v7 (old) | 10/2019 | Apple MacBook Pro 13 2019 i5 4TB3 i5-8279U, Iris Plus Graphics 655 | 1.4 kg | 14.9 mm | 13.30" | 2560x1600 | |
| 87 % v7 (old) | 02/2020 | Acer Swift 3 SF313-52-71Y7 i7-1065G7, Iris Plus Graphics G7 (Ice Lake 64 EU) | 1.2 kg | 16.6 mm | 13.50" | 2256x1504 | |
| 88 % v7 (old) | 05/2020 | Dell XPS 13 9300 4K UHD i7-1065G7, Iris Plus Graphics G7 (Ice Lake 64 EU) | 1.2 kg | 14.8 mm | 13.40" | 3840x2400 | |
| 88.4 % v7 (old) | 12/2019 | HP Spectre x360 13-aw0013dx i7-1065G7, Iris Plus Graphics G7 (Ice Lake 64 EU) | 1.2 kg | 16.9 mm | 13.30" | 1920x1080 | |
| 84 % v7 (old) | 03/2020 | Microsoft Surface Laptop 3 13 Core i5-1035G7 i5-1035G7, Iris Plus Graphics G7 (Ice Lake 64 EU) | 1.3 kg | 14.5 mm | 13.50" | 2256x1504 |

, i5-1038NG7, Apple SSD SM0512F")
, i5-1038NG7, Apple SSD SM0512F")
| |||||||||||||||||||||||||
iluminação: 91 %
iluminação com acumulador: 510 cd/m²
Contraste: 1600:1 (Preto: 0.32 cd/m²)
ΔE ColorChecker Calman: 1.7 | ∀{0.5-29.43 Ø4.71}
calibrated: 1
ΔE Greyscale Calman: 1.9 | ∀{0.09-98 Ø4.96}
99.9% sRGB (Argyll 1.6.3 3D)
77.4% AdobeRGB 1998 (Argyll 1.6.3 3D)
86.4% AdobeRGB 1998 (Argyll 3D)
99.9% sRGB (Argyll 3D)
98.8% Display P3 (Argyll 3D)
Gamma: 2.19
CCT: 6817 K
| Apple MacBook Pro 13 2020 2GHz i5 10th-Gen APPA03D, IPS, 2560x1600, 13.3" | Apple MacBook Pro 13 2019 i5 4TB3 APPA03E, IPS, 2560x1600, 13.3" | Acer Swift 3 SF313-52-71Y7 BOE, NE135FBM-N41, IPS, 2256x1504, 13.5" | Dell XPS 13 9300 4K UHD Sharp LQ134R1, IPS, 3840x2400, 13.4" | HP Spectre x360 13-aw0013dx AU Optronics AUO5E2D, IPS, 1920x1080, 13.3" | Microsoft Surface Laptop 3 13 Core i5-1035G7 Sharp LQ135P1JX51, IPS, 2256x1504, 13.5" | |
|---|---|---|---|---|---|---|
| Display | 1% | -16% | -22% | -16% | -19% | |
| Display P3 Coverage (%) | 98.8 | 98.7 0% | 70.1 -29% | 64.5 -35% | 69.6 -30% | 65.7 -34% |
| sRGB Coverage (%) | 99.9 | 100 0% | 99.8 0% | 91.4 -9% | 98.9 -1% | 98.6 -1% |
| AdobeRGB 1998 Coverage (%) | 86.4 | 87.7 2% | 71.2 -18% | 66.6 -23% | 71.5 -17% | 67.8 -22% |
| Response Times | 8% | -8% | 16% | -23% | -29% | |
| Response Time Grey 50% / Grey 80% * (ms) | 46 ? | 43.2 ? 6% | 55 ? -20% | 41.6 ? 10% | 60.8 ? -32% | 59.2 ? -29% |
| Response Time Black / White * (ms) | 32.4 ? | 29.6 ? 9% | 31 ? 4% | 25.6 ? 21% | 36.8 ? -14% | 41.6 ? -28% |
| PWM Frequency (Hz) | 113600 ? | 208 ? | 21740 ? | |||
| Screen | -14% | -38% | -49% | -58% | 2% | |
| Brightness middle (cd/m²) | 512 | 518 1% | 474 -7% | 414 -19% | 447.4 -13% | 403.4 -21% |
| Brightness (cd/m²) | 491 | 480 -2% | 426 -13% | 401 -18% | 420 -14% | 397 -19% |
| Brightness Distribution (%) | 91 | 87 -4% | 82 -10% | 94 3% | 85 -7% | 89 -2% |
| Black Level * (cd/m²) | 0.32 | 0.34 -6% | 0.29 9% | 0.28 12% | 0.31 3% | 0.34 -6% |
| Contrast (:1) | 1600 | 1524 -5% | 1634 2% | 1479 -8% | 1443 -10% | 1186 -26% |
| Colorchecker dE 2000 * | 1.7 | 1.5 12% | 2.38 -40% | 3.06 -80% | 4.23 -149% | 0.94 45% |
| Colorchecker dE 2000 max. * | 3.4 | 2.8 18% | 5.88 -73% | 6.5 -91% | 9.34 -175% | 2.92 14% |
| Colorchecker dE 2000 calibrated * | 1 | 2.6 -160% | 2.69 -169% | 3.5 -250% | 1.32 -32% | 0.99 1% |
| Greyscale dE 2000 * | 1.9 | 2 -5% | 3.75 -97% | 3 -58% | 6.1 -221% | 0.9 53% |
| Gamma | 2.19 100% | 2.22 99% | 2.37 93% | 2.42 91% | 2.11 104% | 2.13 103% |
| CCT | 6817 95% | 6898 94% | 6466 101% | 6840 95% | 6136 106% | 6620 98% |
| Color Space (Percent of AdobeRGB 1998) (%) | 77.4 | 78.4 1% | 65 -16% | 61.1 -21% | 64.8 -16% | 62.3 -20% |
| Color Space (Percent of sRGB) (%) | 99.9 | 99.9 0% | 100 0% | 91.4 -9% | 98.9 -1% | 98.7 -1% |
| Média Total (Programa/Configurações) | -2% /
-8% | -21% /
-30% | -18% /
-36% | -32% /
-46% | -15% /
-6% |
* ... menor é melhor
Exibir tempos de resposta
| ↔ Tempo de resposta preto para branco | ||
|---|---|---|
| 32.4 ms ... ascensão ↗ e queda ↘ combinadas | ↗ 18.4 ms ascensão | 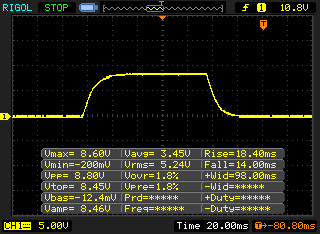 |
| ↘ 14 ms queda | ||
| A tela mostra taxas de resposta lentas em nossos testes e será insatisfatória para os jogadores. Em comparação, todos os dispositivos testados variam de 0.1 (mínimo) a 240 (máximo) ms. » 88 % de todos os dispositivos são melhores. Isso significa que o tempo de resposta medido é pior que a média de todos os dispositivos testados (19.8 ms). | ||
| ↔ Tempo de resposta 50% cinza a 80% cinza | ||
| 46 ms ... ascensão ↗ e queda ↘ combinadas | ↗ 22 ms ascensão | 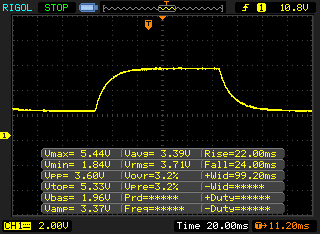 |
| ↘ 24 ms queda | ||
| A tela mostra taxas de resposta lentas em nossos testes e será insatisfatória para os jogadores. Em comparação, todos os dispositivos testados variam de 0.165 (mínimo) a 636 (máximo) ms. » 79 % de todos os dispositivos são melhores. Isso significa que o tempo de resposta medido é pior que a média de todos os dispositivos testados (31 ms). | ||
Cintilação da tela / PWM (modulação por largura de pulso)
| Tela tremeluzindo/PWM detectado | 113600 Hz | ≤ 75 % configuração de brilho | 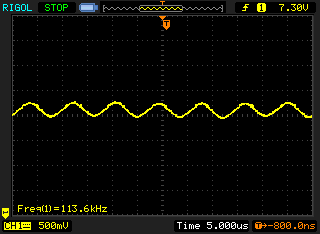 |
A luz de fundo da tela pisca em 113600 Hz (pior caso, por exemplo, utilizando PWM) Cintilação detectada em uma configuração de brilho de 75 % e abaixo. Não deve haver cintilação ou PWM acima desta configuração de brilho. A frequência de 113600 Hz é bastante alta, então a maioria dos usuários sensíveis ao PWM não deve notar nenhuma oscilação. [pwm_comparison] Em comparação: 52 % de todos os dispositivos testados não usam PWM para escurecer a tela. Se PWM foi detectado, uma média de 7757 (mínimo: 5 - máximo: 343500) Hz foi medida. | |||
Cinebench R15: CPU Single 64Bit | CPU Multi 64Bit
Blender: v2.79 BMW27 CPU
7-Zip 18.03: 7z b 4 -mmt1 | 7z b 4
Geekbench 5.5: Single-Core | Multi-Core
HWBOT x265 Benchmark v2.2: 4k Preset
LibreOffice : 20 Documents To PDF
R Benchmark 2.5: Overall mean
| Cinebench R20 / CPU (Single Core) | |
| Média da turma Subnotebook (128 - 832, n=57, últimos 2 anos) | |
| Acer Swift 3 SF314-42-R4XJ | |
| Dell XPS 13 9300 4K UHD | |
| Acer Swift 3 SF313-52-71Y7 | |
| Microsoft Surface Laptop 3 13 Core i5-1035G7 | |
| Apple MacBook Pro 13 2020 2GHz i5 10th-Gen | |
| Média Intel Core i5-1038NG7 (n=1) | |
| Apple MacBook Pro 13 2019 i5 4TB3 | |
| HP Spectre x360 13-aw0013dx | |
| Cinebench R20 / CPU (Multi Core) | |
| Média da turma Subnotebook (579 - 8541, n=57, últimos 2 anos) | |
| Acer Swift 3 SF314-42-R4XJ | |
| Apple MacBook Pro 13 2020 2GHz i5 10th-Gen | |
| Média Intel Core i5-1038NG7 (n=1) | |
| Apple MacBook Pro 13 2019 i5 4TB3 | |
| HP Spectre x360 13-aw0013dx | |
| Microsoft Surface Laptop 3 13 Core i5-1035G7 | |
| Dell XPS 13 9300 4K UHD | |
| Acer Swift 3 SF313-52-71Y7 | |
| Cinebench R15 / CPU Single 64Bit | |
| Média da turma Subnotebook (72.4 - 322, n=57, últimos 2 anos) | |
| Dell XPS 13 9300 4K UHD | |
| Acer Swift 3 SF314-42-R4XJ | |
| HP Spectre x360 13-aw0013dx | |
| Acer Swift 3 SF313-52-71Y7 | |
| Microsoft Surface Laptop 3 13 Core i5-1035G7 | |
| Apple MacBook Pro 13 2019 i5 4TB3 | |
| Apple MacBook Pro 13 2019 i5 4TB3 | |
| Apple MacBook Pro 13 2020 2GHz i5 10th-Gen | |
| Média Intel Core i5-1038NG7 (n=1) | |
| Cinebench R15 / CPU Multi 64Bit | |
| Média da turma Subnotebook (327 - 3345, n=57, últimos 2 anos) | |
| Acer Swift 3 SF314-42-R4XJ | |
| Apple MacBook Pro 13 2020 2GHz i5 10th-Gen | |
| Média Intel Core i5-1038NG7 (n=1) | |
| Dell XPS 13 9300 4K UHD | |
| Apple MacBook Pro 13 2019 i5 4TB3 | |
| Apple MacBook Pro 13 2019 i5 4TB3 | |
| Microsoft Surface Laptop 3 13 Core i5-1035G7 | |
| HP Spectre x360 13-aw0013dx | |
| Acer Swift 3 SF313-52-71Y7 | |
| Blender / v2.79 BMW27 CPU | |
| Acer Swift 3 SF313-52-71Y7 | |
| Microsoft Surface Laptop 3 13 Core i5-1035G7 | |
| Dell XPS 13 9300 4K UHD | |
| Apple MacBook Pro 13 2019 i5 4TB3 | |
| Acer Swift 3 SF314-42-R4XJ | |
| Média da turma Subnotebook (159 - 2271, n=58, últimos 2 anos) | |
| Apple MacBook Pro 13 2020 2GHz i5 10th-Gen | |
| Média Intel Core i5-1038NG7 (n=1) | |
| 7-Zip 18.03 / 7z b 4 -mmt1 | |
| Média da turma Subnotebook (2643 - 6699, n=59, últimos 2 anos) | |
| Dell XPS 13 9300 4K UHD | |
| Acer Swift 3 SF313-52-71Y7 | |
| Acer Swift 3 SF314-42-R4XJ | |
| Apple MacBook Pro 13 2019 i5 4TB3 | |
| Microsoft Surface Laptop 3 13 Core i5-1035G7 | |
| Apple MacBook Pro 13 2020 2GHz i5 10th-Gen | |
| Média Intel Core i5-1038NG7 (n=1) | |
| 7-Zip 18.03 / 7z b 4 | |
| Média da turma Subnotebook (11668 - 77867, n=57, últimos 2 anos) | |
| Acer Swift 3 SF314-42-R4XJ | |
| Apple MacBook Pro 13 2019 i5 4TB3 | |
| Dell XPS 13 9300 4K UHD | |
| Apple MacBook Pro 13 2020 2GHz i5 10th-Gen | |
| Média Intel Core i5-1038NG7 (n=1) | |
| Microsoft Surface Laptop 3 13 Core i5-1035G7 | |
| Acer Swift 3 SF313-52-71Y7 | |
| Geekbench 5.5 / Single-Core | |
| Média da turma Subnotebook (726 - 2224, n=48, últimos 2 anos) | |
| Dell XPS 13 9300 4K UHD | |
| Acer Swift 3 SF313-52-71Y7 | |
| Apple MacBook Pro 13 2020 2GHz i5 10th-Gen | |
| Média Intel Core i5-1038NG7 (n=1) | |
| Acer Swift 3 SF314-42-R4XJ | |
| Geekbench 5.5 / Multi-Core | |
| Média da turma Subnotebook (2557 - 17218, n=48, últimos 2 anos) | |
| Dell XPS 13 9300 4K UHD | |
| Acer Swift 3 SF314-42-R4XJ | |
| Apple MacBook Pro 13 2020 2GHz i5 10th-Gen | |
| Média Intel Core i5-1038NG7 (n=1) | |
| Acer Swift 3 SF313-52-71Y7 | |
| HWBOT x265 Benchmark v2.2 / 4k Preset | |
| Média da turma Subnotebook (0.97 - 25.1, n=57, últimos 2 anos) | |
| Acer Swift 3 SF314-42-R4XJ | |
| Dell XPS 13 9300 4K UHD | |
| Apple MacBook Pro 13 2019 i5 4TB3 | |
| Apple MacBook Pro 13 2020 2GHz i5 10th-Gen | |
| Média Intel Core i5-1038NG7 (n=1) | |
| Acer Swift 3 SF313-52-71Y7 | |
| Microsoft Surface Laptop 3 13 Core i5-1035G7 | |
| LibreOffice / 20 Documents To PDF | |
| Apple MacBook Pro 13 2020 2GHz i5 10th-Gen | |
| Média Intel Core i5-1038NG7 (n=1) | |
| Dell XPS 13 9300 4K UHD | |
| Acer Swift 3 SF314-42-R4XJ | |
| Média da turma Subnotebook (39.9 - 220, n=56, últimos 2 anos) | |
| R Benchmark 2.5 / Overall mean | |
| Apple MacBook Pro 13 2020 2GHz i5 10th-Gen | |
| Média Intel Core i5-1038NG7 (n=1) | |
| Acer Swift 3 SF313-52-71Y7 | |
| Dell XPS 13 9300 4K UHD | |
| Acer Swift 3 SF314-42-R4XJ | |
| Média da turma Subnotebook (0.4024 - 1.456, n=58, últimos 2 anos) | |
* ... menor é melhor
| PCMark 8 Home Score Accelerated v2 | 3928 pontos | |
| PCMark 8 Creative Score Accelerated v2 | 5715 pontos | |
| PCMark 8 Work Score Accelerated v2 | 2407 pontos | |
| PCMark 10 Score | 3222 pontos | |
Ajuda | ||

| 3DMark 06 Standard Score | 17100 pontos | |
| 3DMark 11 Performance | 4683 pontos | |
| 3DMark Ice Storm Standard Score | 56619 pontos | |
| 3DMark Cloud Gate Standard Score | 12647 pontos | |
| 3DMark Fire Strike Score | 2680 pontos | |
| 3DMark Fire Strike Extreme Score | 1329 pontos | |
| 3DMark Time Spy Score | 932 pontos | |
Ajuda | ||
| baixo | média | alto | ultra | |
|---|---|---|---|---|
| The Witcher 3 (2015) | 54.2 | 33.1 | 18 | |
| Dota 2 Reborn (2015) | 94.7 | 62.8 | 38.5 | 35.7 |
| X-Plane 11.11 (2018) | 25.9 | 11.7 | 10.9 | |
| Far Cry 5 (2018) | 26 | 12 | ||
| F1 2019 (2019) | 62 | 27 | 25 | 21 |
Barulho
| Ocioso |
| 29.6 / 29.6 / 29.6 dB |
| Carga |
| 34.4 / 42.1 dB |
 | ||
30 dB silencioso 40 dB(A) audível 50 dB(A) ruidosamente alto |
||
min: | ||
| Apple MacBook Pro 13 2020 2GHz i5 10th-Gen Iris Plus Graphics G7 (Ice Lake 64 EU), i5-1038NG7, Apple SSD SM0512F | Apple MacBook Pro 13 2019 i5 4TB3 Iris Plus Graphics 655, i5-8279U, Apple SSD AP0512 | Acer Swift 3 SF313-52-71Y7 Iris Plus Graphics G7 (Ice Lake 64 EU), i7-1065G7, Intel SSD 660p 1TB SSDPEKNW010T8 | Dell XPS 13 9300 4K UHD Iris Plus Graphics G7 (Ice Lake 64 EU), i7-1065G7, Intel SSDPEMKF512G8 NVMe SSD | HP Spectre x360 13-aw0013dx Iris Plus Graphics G7 (Ice Lake 64 EU), i7-1065G7, Intel Optane Memory H10 with Solid State Storage 32GB + 512GB HBRPEKNX0202A(L/H) | Microsoft Surface Laptop 3 13 Core i5-1035G7 Iris Plus Graphics G7 (Ice Lake 64 EU), i5-1035G7, SK hynix BC501 HFM256GDGTNG | |
|---|---|---|---|---|---|---|
| Noise | 2% | 4% | 0% | 7% | 4% | |
| desligado / ambiente * (dB) | 29.6 | 29 2% | 30.3 -2% | 29 2% | 28.5 4% | 28.5 4% |
| Idle Minimum * (dB) | 29.6 | 29 2% | 30.3 -2% | 29 2% | 28.5 4% | 28.5 4% |
| Idle Average * (dB) | 29.6 | 29 2% | 30.3 -2% | 29 2% | 28.5 4% | 28.5 4% |
| Idle Maximum * (dB) | 29.6 | 29 2% | 30.3 -2% | 29 2% | 28.5 4% | 28.5 4% |
| Load Average * (dB) | 34.4 | 33.9 1% | 31.7 8% | 33.5 3% | 28.5 17% | 28.5 17% |
| Witcher 3 ultra * (dB) | 36.1 | 40.5 -12% | 35.3 2% | 40.4 -12% | ||
| Load Maximum * (dB) | 42.1 | 41.8 1% | 32.7 22% | 40.5 4% | 35.3 16% | 40.4 4% |
* ... menor é melhor
(±) A temperatura máxima no lado superior é 40.7 °C / 105 F, em comparação com a média de 35.9 °C / 97 F , variando de 21.4 a 59 °C para a classe Subnotebook.
(+) A parte inferior aquece até um máximo de 39.4 °C / 103 F, em comparação com a média de 39.2 °C / 103 F
(+) Em uso inativo, a temperatura média para o lado superior é 24.2 °C / 76 F, em comparação com a média do dispositivo de 30.8 °C / ### class_avg_f### F.
(+) Os apoios para as mãos e o touchpad são mais frios que a temperatura da pele, com um máximo de 27 °C / 80.6 F e, portanto, são frios ao toque.
(±) A temperatura média da área do apoio para as mãos de dispositivos semelhantes foi 28.2 °C / 82.8 F (+1.2 °C / 2.2 F).
Apple MacBook Pro 13 2020 2GHz i5 10th-Gen análise de áudio
(±) | o volume do alto-falante é médio, mas bom (###valor### dB)
Graves 100 - 315Hz
(±) | graves reduzidos - em média 8.7% menor que a mediana
(+) | o baixo é linear (5.7% delta para a frequência anterior)
Médios 400 - 2.000 Hz
(+) | médios equilibrados - apenas 2% longe da mediana
(+) | médios são lineares (3.4% delta para frequência anterior)
Altos 2 - 16 kHz
(+) | agudos equilibrados - apenas 3.4% longe da mediana
(+) | os máximos são lineares (4.2% delta da frequência anterior)
Geral 100 - 16.000 Hz
(+) | o som geral é linear (11.7% diferença em relação à mediana)
Comparado com a mesma classe
» 13% de todos os dispositivos testados nesta classe foram melhores, 3% semelhantes, 83% piores
» O melhor teve um delta de 5%, a média foi 18%, o pior foi 53%
Comparado com todos os dispositivos testados
» 8% de todos os dispositivos testados foram melhores, 3% semelhantes, 89% piores
» O melhor teve um delta de 4%, a média foi 23%, o pior foi 134%
Microsoft Surface Laptop 3 13 Core i5-1035G7 análise de áudio
(±) | o volume do alto-falante é médio, mas bom (###valor### dB)
Graves 100 - 315Hz
(+) | bons graves - apenas 4.2% longe da mediana
(±) | a linearidade dos graves é média (10.5% delta para a frequência anterior)
Médios 400 - 2.000 Hz
(+) | médios equilibrados - apenas 3.6% longe da mediana
(±) | a linearidade dos médios é média (7.1% delta para frequência anterior)
Altos 2 - 16 kHz
(+) | agudos equilibrados - apenas 1.8% longe da mediana
(+) | os máximos são lineares (6.5% delta da frequência anterior)
Geral 100 - 16.000 Hz
(+) | o som geral é linear (11.4% diferença em relação à mediana)
Comparado com a mesma classe
» 3% de todos os dispositivos testados nesta classe foram melhores, 2% semelhantes, 95% piores
» O melhor teve um delta de 7%, a média foi 21%, o pior foi 53%
Comparado com todos os dispositivos testados
» 7% de todos os dispositivos testados foram melhores, 2% semelhantes, 90% piores
» O melhor teve um delta de 4%, a média foi 23%, o pior foi 134%
| desligado | |
| Ocioso | |
| Carga |
|
Key:
min: | |
| Apple MacBook Pro 13 2020 2GHz i5 10th-Gen i5-1038NG7, Iris Plus Graphics G7 (Ice Lake 64 EU), Apple SSD SM0512F, IPS, 2560x1600, 13.3" | Apple MacBook Pro 13 2019 i5 4TB3 i5-8279U, Iris Plus Graphics 655, Apple SSD AP0512, IPS, 2560x1600, 13.3" | Acer Swift 3 SF313-52-71Y7 i7-1065G7, Iris Plus Graphics G7 (Ice Lake 64 EU), Intel SSD 660p 1TB SSDPEKNW010T8, IPS, 2256x1504, 13.5" | Dell XPS 13 9300 4K UHD i7-1065G7, Iris Plus Graphics G7 (Ice Lake 64 EU), Intel SSDPEMKF512G8 NVMe SSD, IPS, 3840x2400, 13.4" | HP Spectre x360 13-aw0013dx i7-1065G7, Iris Plus Graphics G7 (Ice Lake 64 EU), Intel Optane Memory H10 with Solid State Storage 32GB + 512GB HBRPEKNX0202A(L/H), IPS, 1920x1080, 13.3" | Microsoft Surface Laptop 3 13 Core i5-1035G7 i5-1035G7, Iris Plus Graphics G7 (Ice Lake 64 EU), SK hynix BC501 HFM256GDGTNG, IPS, 2256x1504, 13.5" | Média Intel Iris Plus Graphics G7 (Ice Lake 64 EU) | Média da turma Subnotebook | |
|---|---|---|---|---|---|---|---|---|
| Power Consumption | 15% | 49% | 4% | 25% | 10% | 14% | 14% | |
| Idle Minimum * (Watt) | 3.8 | 2.2 42% | 1.8 53% | 5.3 -39% | 3.9 -3% | 4.4 -16% | 3.91 ? -3% | 3.76 ? 1% |
| Idle Average * (Watt) | 8.6 | 7.2 16% | 4.6 47% | 7.8 9% | 6.3 27% | 7.5 13% | 7.33 ? 15% | 6.54 ? 24% |
| Idle Maximum * (Watt) | 10.3 | 8.2 20% | 6.1 41% | 9.8 5% | 6.8 34% | 7.8 24% | 9.16 ? 11% | 7.89 ? 23% |
| Load Average * (Watt) | 52.1 | 54 -4% | 27.4 47% | 46 12% | 32.6 37% | 41.9 20% | 39.2 ? 25% | 42 ? 19% |
| Witcher 3 ultra * (Watt) | 48.2 | 43 11% | 25.6 47% | 40.8 15% | ||||
| Load Maximum * (Watt) | 65.2 | 63.9 2% | 27 59% | 48.3 26% | 59 10% | 63.9 2% | 49.8 ? 24% | 64.8 ? 1% |
* ... menor é melhor
| Apple MacBook Pro 13 2020 2GHz i5 10th-Gen i5-1038NG7, Iris Plus Graphics G7 (Ice Lake 64 EU), 58 Wh | Apple MacBook Pro 13 2019 i5 4TB3 i5-8279U, Iris Plus Graphics 655, 58 Wh | Acer Swift 3 SF313-52-71Y7 i7-1065G7, Iris Plus Graphics G7 (Ice Lake 64 EU), 54.5 Wh | Dell XPS 13 9300 4K UHD i7-1065G7, Iris Plus Graphics G7 (Ice Lake 64 EU), 52 Wh | HP Spectre x360 13-aw0013dx i7-1065G7, Iris Plus Graphics G7 (Ice Lake 64 EU), 60 Wh | Microsoft Surface Laptop 3 13 Core i5-1035G7 i5-1035G7, Iris Plus Graphics G7 (Ice Lake 64 EU), 45 Wh | Média da turma Subnotebook | |
|---|---|---|---|---|---|---|---|
| Duração da bateria | -1% | -12% | -6% | -18% | -31% | 25% | |
| H.264 (h) | 11.5 | 12 4% | 10.5 -9% | 15.4 ? 34% | |||
| WiFi v1.3 (h) | 12.1 | 11.5 -5% | 10.3 -15% | 11.4 -6% | 9.9 -18% | 8.3 -31% | 14 ? 16% |
Pro
Contra
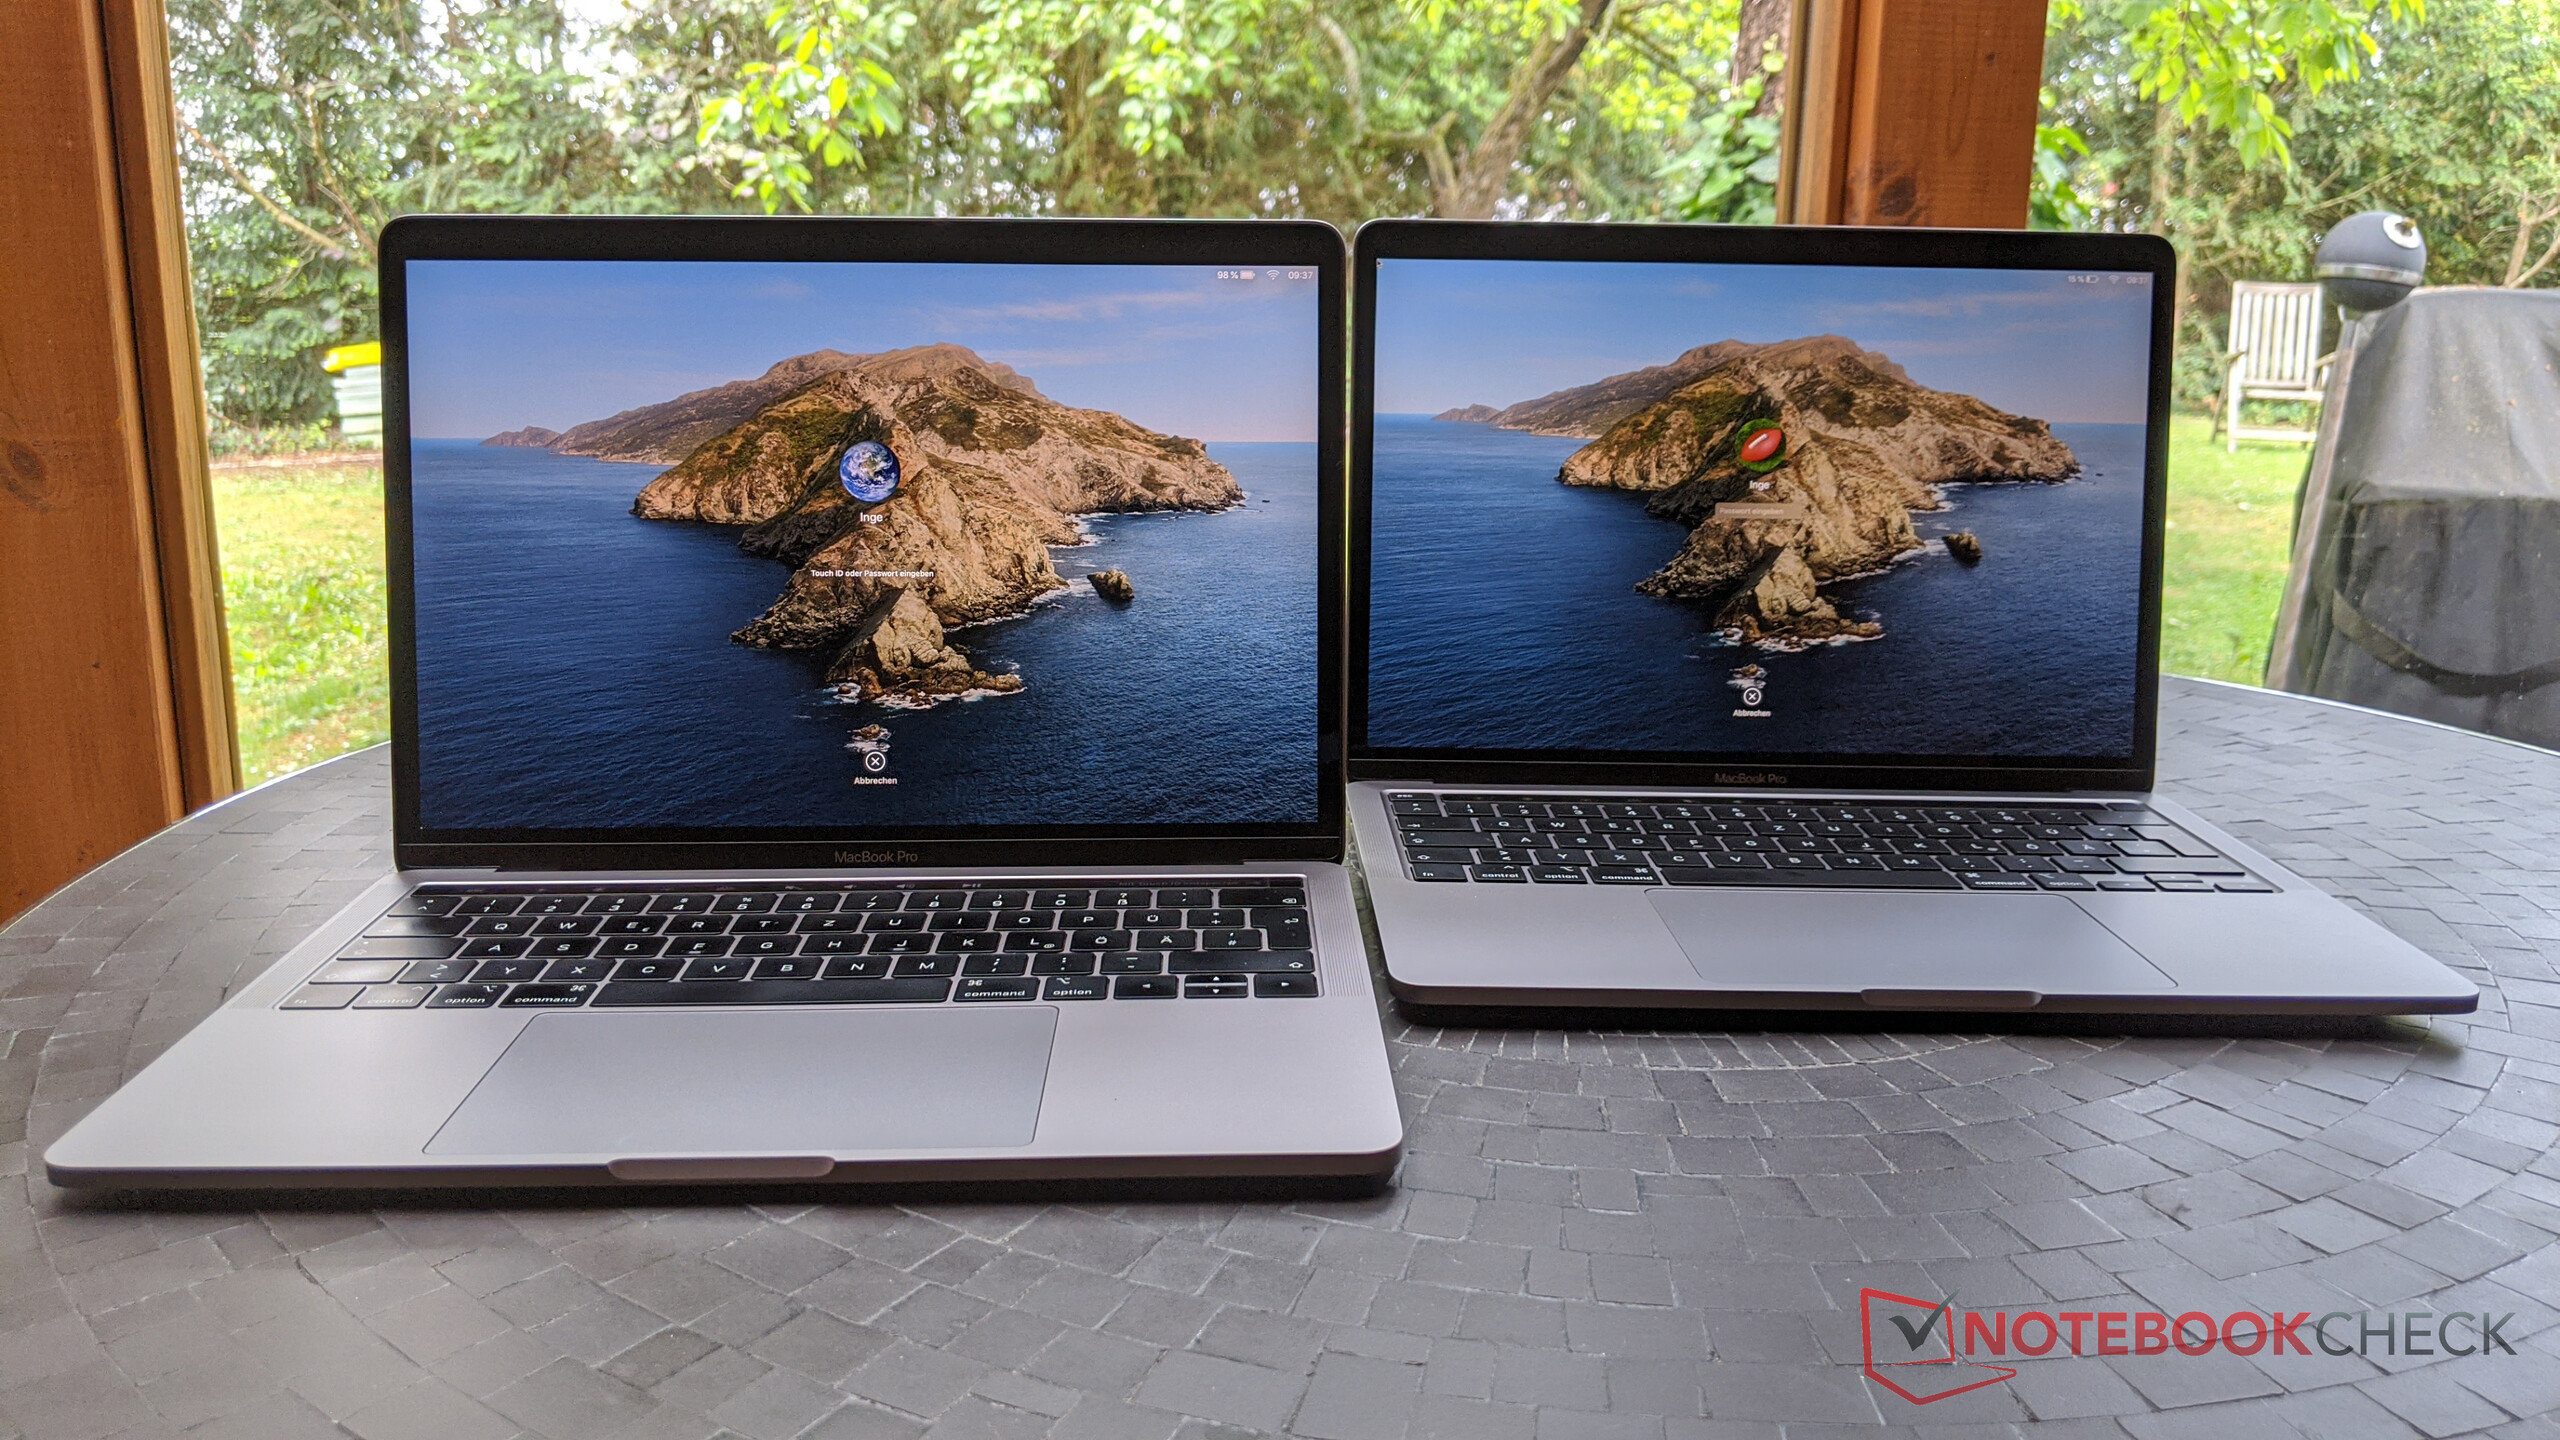
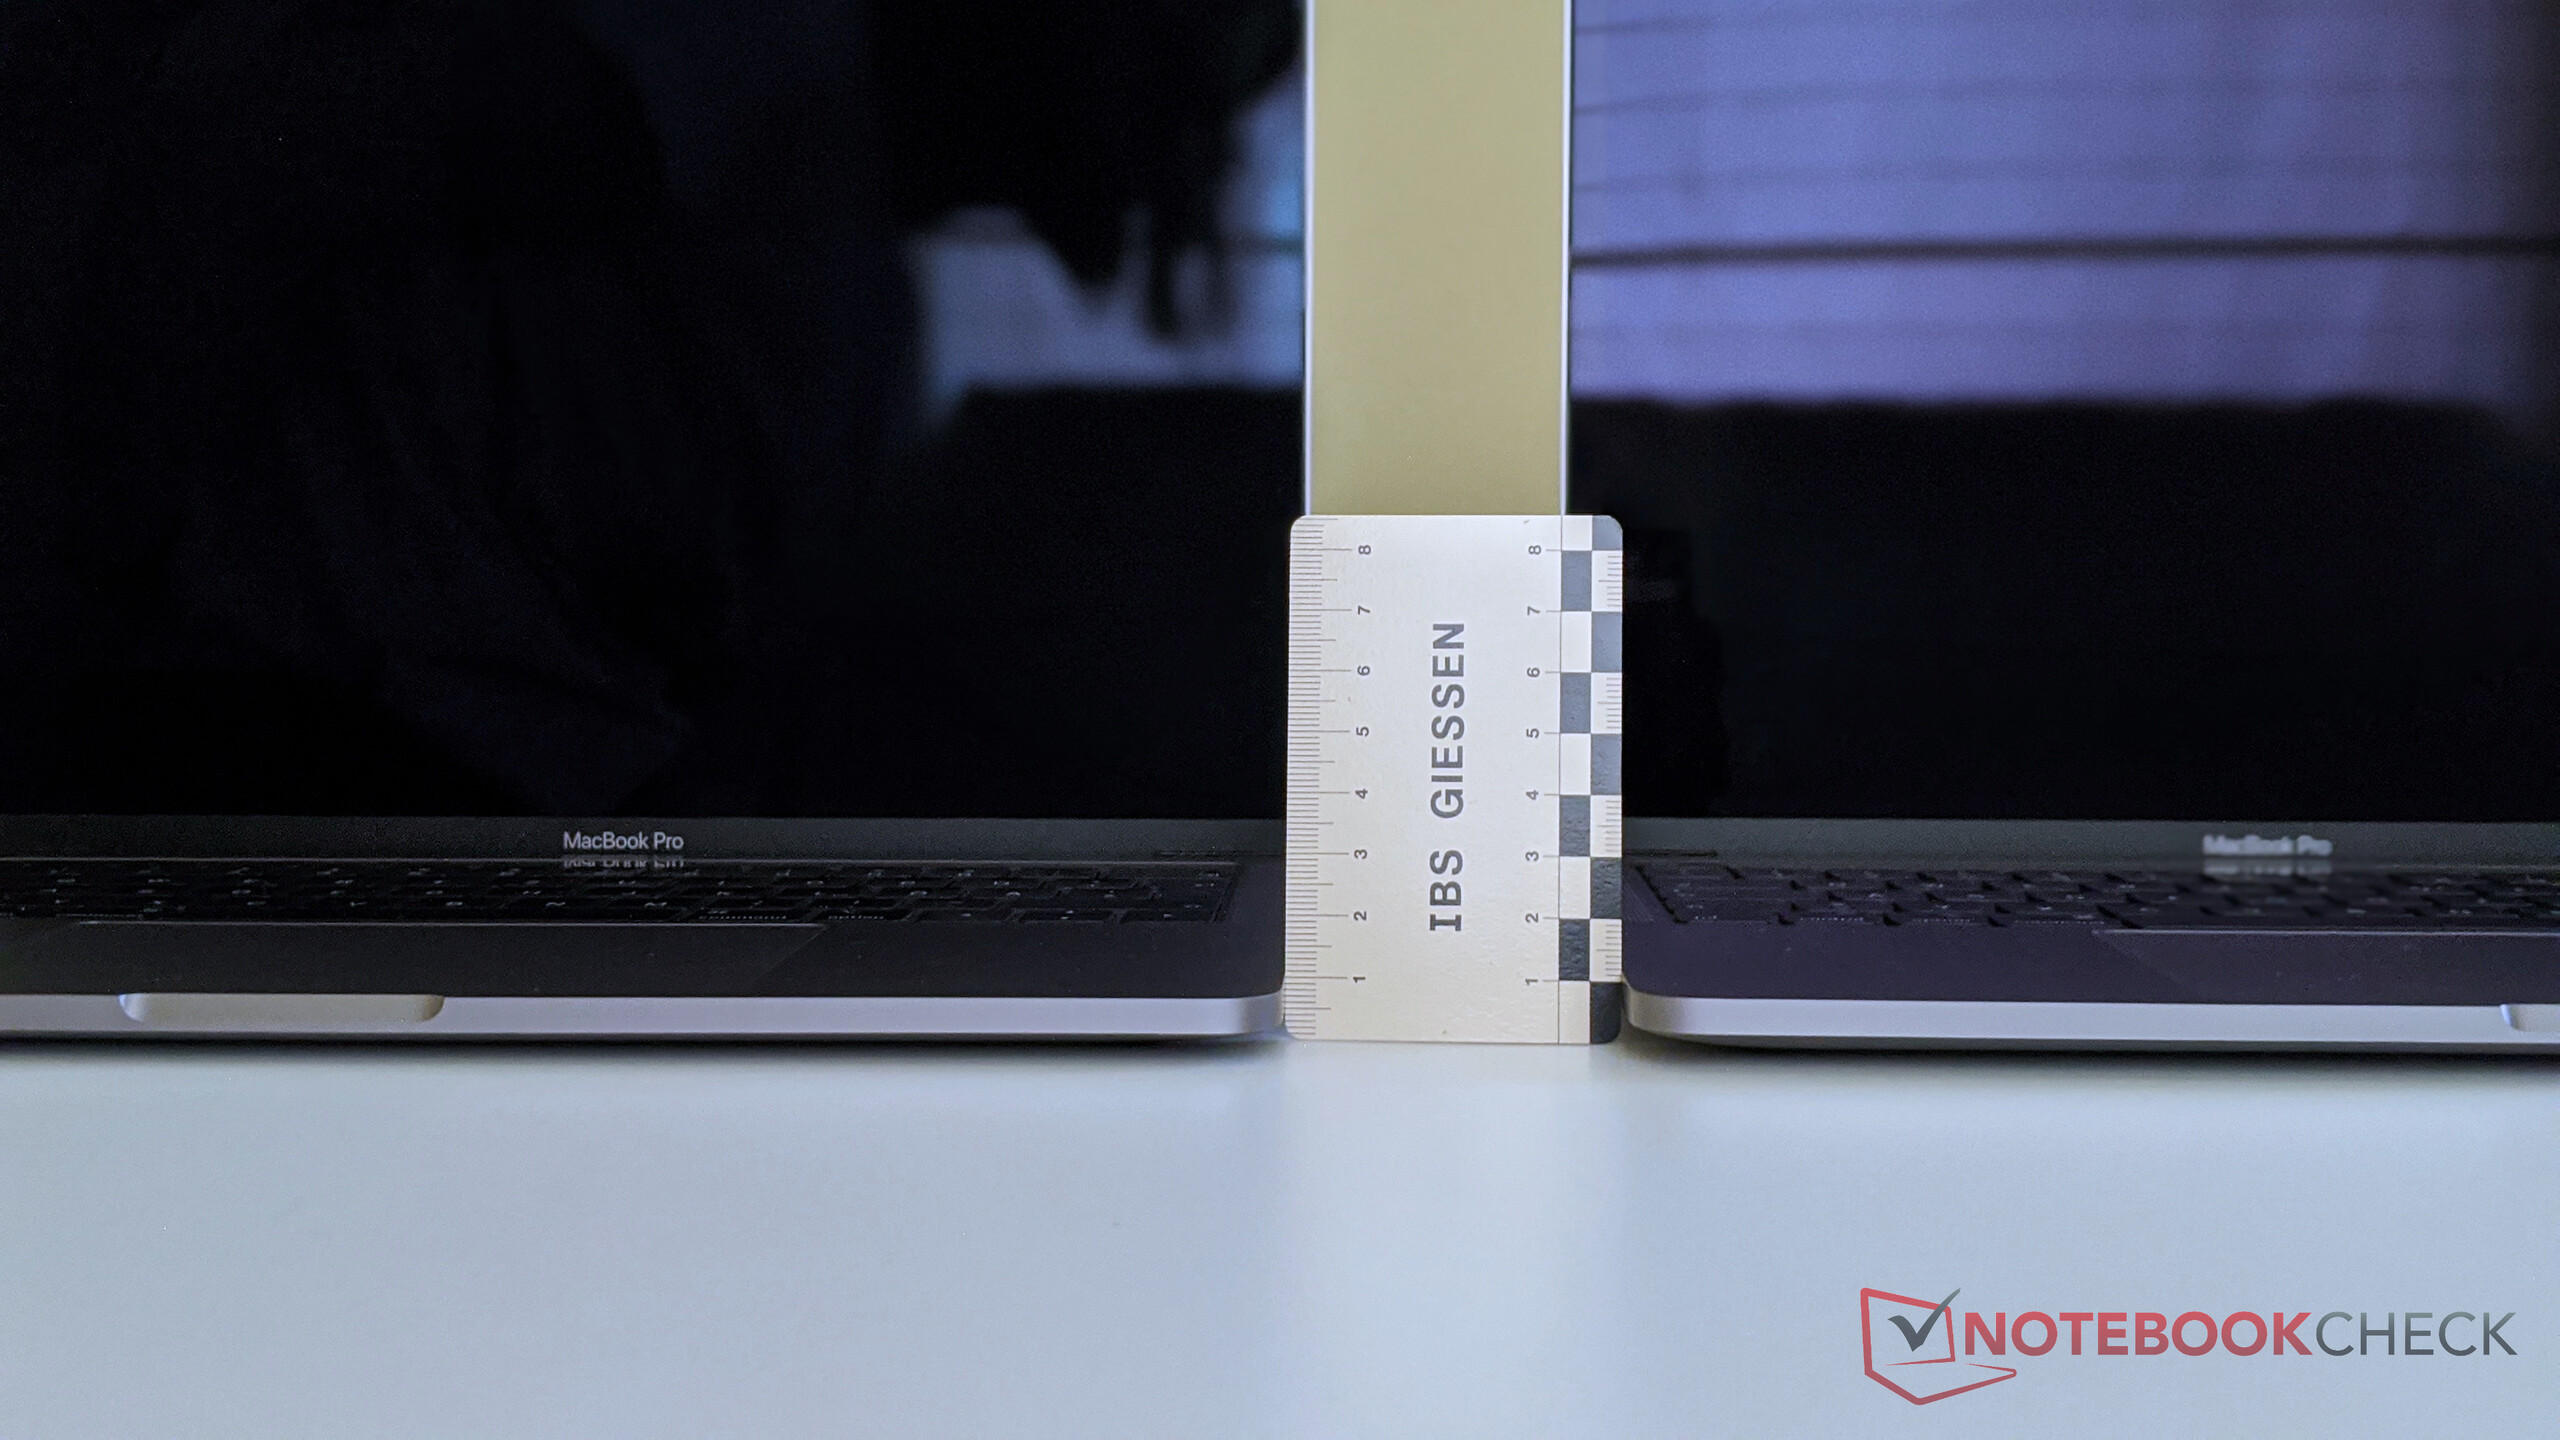
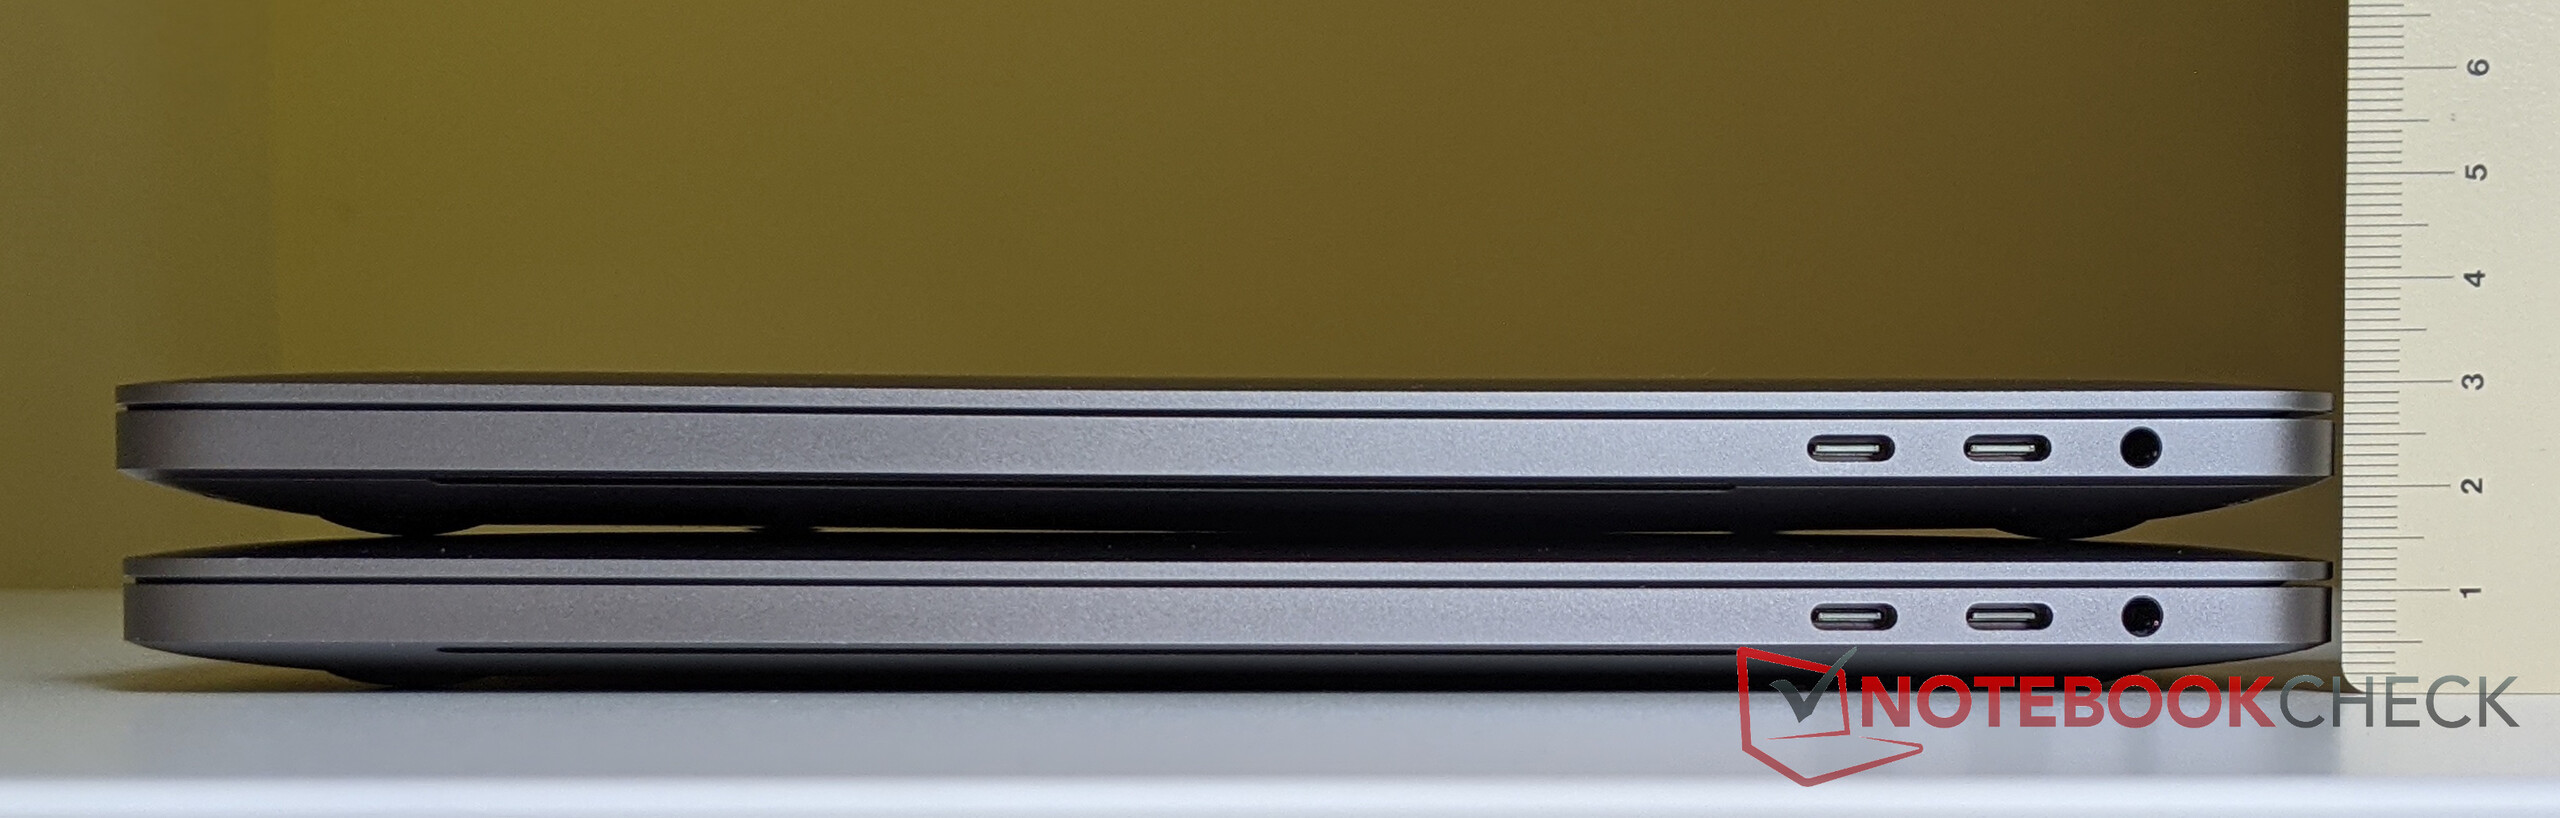
Veredicto – O MacBook Pro 13 é melhor com o novo teclado

O MacBook Pro 13 2020 é praticamente uma atualização obrigatória, porque foi o último MacBook com o velho teclado borboleta depois do MacBook Pro 16 e do MacBook Air já receberam uma atualização. Para ser honestos, a mudança para o processador Ice Lake não é realmente perceptível para o usuário. Você recebe mais desempenho da GPU, mas o desempenho da CPU permanece praticamente inalterado. Você pode ver claramente o problema da Intel quando compara os resultados com os novos processadores AMD Renoir.
No entanto, o MacBook Pro 13 ainda tem uma vantagem sobre muitos outros subportáteis no que diz respeito ao desempenho, porque não há uma grande queda mesmo sob cargas de trabalho contínuas O novo teclado Magic com as teclas com deslocamento maior provavelmente irão atrair mais clientes. Se você evitou um novo MacBook por causa do teclado, você deve definitivamente testar o novo modelo.
O MacBook Pro 13 com o novo teclado deve agradar a mais clientes e é também um produto melhor, em geral, do que o anterior. No entanto, você tem que pagar muito dinheiro e aceitar a miserável reparabilidade.
Para ser honestos, esperávamos mais, antes do lançamento (especialmente a mudança para o rumorado MacBook Pro 14) e não houve avanços/inovações reais nos últimos dois anos, mas o MacBook Pro 13 é um portátil muito bom. O ótimo chassi monobloco e a excelente tela ainda são dois destaques. A pontuação também se beneficia do novo teclado melhorado, mas tudo isso vem a um preço íngreme, pois nossa unidade de teste é muito cara, com 2.129 Euros (~$2.382).
Apple MacBook Pro 13 2020 2GHz i5 10th-Gen
- 06/01/2020 v7 (old)
Andreas Osthoff
Price comparison
