Breve Análise do Ultrabook Lenovo ThinkPad 13

Cintilação da tela / PWM (modulação por largura de pulso)
| Tela tremeluzindo / PWM não detectado | ||
[pwm_comparison] Em comparação: 52 % de todos os dispositivos testados não usam PWM para escurecer a tela. Se PWM foi detectado, uma média de 7757 (mínimo: 5 - máximo: 343500) Hz foi medida. | ||
| |||||||||||||||||||||||||
iluminação: 86 %
iluminação com acumulador: 233 cd/m²
Contraste: 1059:1 (Preto: 0.22 cd/m²)
ΔE ColorChecker Calman: 5.41 | ∀{0.5-29.43 Ø4.71}
ΔE Greyscale Calman: 4.15 | ∀{0.09-98 Ø4.96}
57.16% sRGB (Argyll 1.6.3 3D)
36.52% AdobeRGB 1998 (Argyll 1.6.3 3D)
39.66% AdobeRGB 1998 (Argyll 3D)
57.4% sRGB (Argyll 3D)
38.35% Display P3 (Argyll 3D)
Gamma: 2.45
CCT: 6773 K
| Lenovo ThinkPad 13-20GKS01100 1920x1080, LP133WF2-SPL1 | Lenovo ThinkPad T460-20FN003LGE IPS, 1920x1080, Lenovo LEN40A9 / N140HCE-EAA | Acer TravelMate P238-M-5575 TN LED, 1366x768, AU Optronics B133XTN01.6 | Asus Zenbook UX303UA-FN121T TN LED, 1366x768, BOE HF HB133WX1-402 | Acer Aspire S 13 S5-371-71QZ IPS, 1920x1080, AUO B133HAN04.1 | Dell XPS 13-9350 IPS, 1920x1080, SHP1420 | Lenovo ThinkPad T460s-20F9003SGE IPS, 1920x1080, N140HCE-EAA, LEN40A9 | |
|---|---|---|---|---|---|---|---|
| Display | 9% | -3% | 12% | 16% | 8% | ||
| Display P3 Coverage (%) | 38.35 | 42.09 10% | 37.25 -3% | 43.08 12% | 44.53 16% | 41.65 9% | |
| sRGB Coverage (%) | 57.4 | 62 8% | 56.1 -2% | 64.8 13% | 66.8 16% | 61.6 7% | |
| AdobeRGB 1998 Coverage (%) | 39.66 | 43.6 10% | 38.49 -3% | 44.52 12% | 45.97 16% | 43.14 9% | |
| Response Times | 5% | -1% | 46% | -13% | -3% | ||
| Response Time Grey 50% / Grey 80% * (ms) | 43.2 ? | 42.4 ? 2% | 42 ? 3% | 23 ? 47% | 50 ? -16% | 42 ? 3% | |
| Response Time Black / White * (ms) | 26.8 ? | 24.8 ? 7% | 28 ? -4% | 15 ? 44% | 29.6 ? -10% | 29.2 ? -9% | |
| PWM Frequency (Hz) | 192 ? | ||||||
| Screen | -16% | -64% | -4% | 20% | 14% | -8% | |
| Brightness middle (cd/m²) | 233 | 230 -1% | 226 -3% | 203 -13% | 375 61% | 277.5 19% | 226 -3% |
| Brightness (cd/m²) | 227 | 216 -5% | 216 -5% | 193 -15% | 358 58% | 276 22% | 211 -7% |
| Brightness Distribution (%) | 86 | 85 -1% | 91 6% | 84 -2% | 87 1% | 88 2% | 89 3% |
| Black Level * (cd/m²) | 0.22 | 0.26 -18% | 0.49 -123% | 0.49 -123% | 0.39 -77% | 0.191 13% | 0.22 -0% |
| Contrast (:1) | 1059 | 885 -16% | 461 -56% | 414 -61% | 962 -9% | 1453 37% | 1027 -3% |
| Colorchecker dE 2000 * | 5.41 | 7.32 -35% | 13.15 -143% | 3.2 41% | 4.6 15% | 4.88 10% | 6.44 -19% |
| Colorchecker dE 2000 max. * | 13.61 | 18.14 -33% | 21.96 -61% | 4.13 70% | 8.8 35% | 17.18 -26% | |
| Greyscale dE 2000 * | 4.15 | 6.98 -68% | 14.47 -249% | 2.77 33% | 4 4% | 4.26 -3% | 5.87 -41% |
| Gamma | 2.45 90% | 2.5 88% | 2.73 81% | 2.46 89% | 2.34 94% | 2.59 85% | 2.37 93% |
| CCT | 6773 96% | 6683 97% | 19989 33% | 7176 91% | 7304 89% | 6562 99% | 6856 95% |
| Color Space (Percent of AdobeRGB 1998) (%) | 36.52 | 39.97 9% | 36 -1% | 41 12% | 57.9 59% | 41.6 14% | 39.58 8% |
| Color Space (Percent of sRGB) (%) | 57.16 | 61.55 8% | 56 -2% | 65 14% | 88.7 55% | 65.79 15% | 61.15 7% |
| Média Total (Programa/Configurações) | -1% /
-8% | -23% /
-43% | 18% /
6% | 4% /
15% | 15% /
15% | -1% /
-4% |
* ... menor é melhor
Exibir tempos de resposta
| ↔ Tempo de resposta preto para branco | ||
|---|---|---|
| 26.8 ms ... ascensão ↗ e queda ↘ combinadas | ↗ 9.6 ms ascensão | |
| ↘ 17.2 ms queda | ||
| A tela mostra taxas de resposta relativamente lentas em nossos testes e pode ser muito lenta para os jogadores. Em comparação, todos os dispositivos testados variam de 0.1 (mínimo) a 240 (máximo) ms. » 67 % de todos os dispositivos são melhores. Isso significa que o tempo de resposta medido é pior que a média de todos os dispositivos testados (19.8 ms). | ||
| ↔ Tempo de resposta 50% cinza a 80% cinza | ||
| 43.2 ms ... ascensão ↗ e queda ↘ combinadas | ↗ 19.6 ms ascensão | |
| ↘ 23.6 ms queda | ||
| A tela mostra taxas de resposta lentas em nossos testes e será insatisfatória para os jogadores. Em comparação, todos os dispositivos testados variam de 0.165 (mínimo) a 636 (máximo) ms. » 72 % de todos os dispositivos são melhores. Isso significa que o tempo de resposta medido é pior que a média de todos os dispositivos testados (31 ms). | ||
| PCMark 8 Home Score Accelerated v2 | 3024 pontos | |
| PCMark 8 Creative Score Accelerated v2 | 3651 pontos | |
| PCMark 8 Work Score Accelerated v2 | 4041 pontos | |
Ajuda | ||

| Lenovo ThinkPad 13-20GKS01100 Samsung SSD PM871 MZNLN256HCHP | Lenovo ThinkPad T460-20FN003LGE Toshiba HG6 THNSFJ256GCSU | Acer TravelMate P238-M-5575 Samsung SSD PM871 MZNLN256HCHP | Acer Aspire S 13 S5-371-71QZ LiteOn CV1-8B512 | Dell XPS 13-9350 Samsung PM951 NVMe MZ-VLV256D | Lenovo ThinkPad T460s-20F9003SGE Samsung CM871 MZ7LF192HCGS | |
|---|---|---|---|---|---|---|
| CrystalDiskMark 3.0 | -4% | 3% | 7% | 31% | -51% | |
| Write 4k QD32 (MB/s) | 276.2 | 216 -22% | 234.4 -15% | 211.2 -24% | 151.5 -45% | 36.43 -87% |
| Read 4k QD32 (MB/s) | 360.9 | 369.9 2% | 235.6 -35% | 301.3 -17% | 244.7 -32% | 94.9 -74% |
| Write 4k (MB/s) | 68.5 | 72.9 6% | 85.2 24% | 86.8 27% | 113 65% | 35.47 -48% |
| Read 4k (MB/s) | 31.85 | 21.7 -32% | 33.03 4% | 29.69 -7% | 38.52 21% | 5.78 -82% |
| Write 512 (MB/s) | 298.4 | 232.7 -22% | 305.1 2% | 389.7 31% | 308.6 3% | 167.2 -44% |
| Read 512 (MB/s) | 351.6 | 371.3 6% | 459.9 31% | 341.3 -3% | 684 95% | 259.2 -26% |
| Write Seq (MB/s) | 297.8 | 394.4 32% | 307.6 3% | 418.9 41% | 307.7 3% | 171.1 -43% |
| Read Seq (MB/s) | 461.7 | 458.9 -1% | 517 12% | 502 9% | 1097 138% | 446.5 -3% |
| 3DMark 06 Standard Score | 7597 pontos | |
| 3DMark 11 Performance | 1372 pontos | |
| 3DMark Cloud Gate Standard Score | 4922 pontos | |
| 3DMark Fire Strike Score | 678 pontos | |
Ajuda | ||
| baixo | média | alto | ultra | |
|---|---|---|---|---|
| Tomb Raider (2013) | 49.7 | 25.2 | 16.6 | |
| BioShock Infinite (2013) | 35.28 | 20.31 | 16.9 | |
| The Witcher 3 (2015) | 11.89 |
Barulho
| Ocioso |
| 29.1 / 29.1 / 29.1 dB |
| Carga |
| 31.5 / 33.5 dB |
 | ||
30 dB silencioso 40 dB(A) audível 50 dB(A) ruidosamente alto |
||
min: | ||
| Lenovo ThinkPad 13-20GKS01100 6200U, HD Graphics 520 | Lenovo ThinkPad T460-20FN003LGE 6200U, HD Graphics 520 | Acer TravelMate P238-M-5575 6200U, HD Graphics 520 | Asus Zenbook UX303UA-FN121T 6200U, HD Graphics 520 | Acer Aspire S 13 S5-371-71QZ 6500U, HD Graphics 520 | Dell XPS 13-9350 6200U, HD Graphics 520 | Lenovo ThinkPad T460s-20F9003SGE 6200U, HD Graphics 520 | |
|---|---|---|---|---|---|---|---|
| Noise | -4% | -9% | -8% | -8% | 4% | -2% | |
| desligado / ambiente * (dB) | 29.1 | 29 -0% | 31.2 -7% | 31.2 -7% | 29.1 -0% | ||
| Idle Minimum * (dB) | 29.1 | 29 -0% | 31.2 -7% | 32.6 -12% | 31.2 -7% | 28.2 3% | 29.1 -0% |
| Idle Average * (dB) | 29.1 | 29 -0% | 31.2 -7% | 32.7 -12% | 31.2 -7% | 28.3 3% | 29.1 -0% |
| Idle Maximum * (dB) | 29.1 | 29 -0% | 31.2 -7% | 32.7 -12% | 31.5 -8% | 28.4 2% | 29.1 -0% |
| Load Average * (dB) | 31.5 | 34.2 -9% | 35.71 -13% | 33.4 -6% | 35.7 -13% | 30.2 4% | 32.3 -3% |
| Load Maximum * (dB) | 33.5 | 37.8 -13% | 38.1 -14% | 33.4 -0% | 35.8 -7% | 30.2 10% | 36.6 -9% |
* ... menor é melhor
(±) A temperatura máxima no lado superior é 43.7 °C / 111 F, em comparação com a média de 34.3 °C / 94 F , variando de 21.2 a 62.5 °C para a classe Office.
(±) A parte inferior aquece até um máximo de 44.2 °C / 112 F, em comparação com a média de 36.8 °C / 98 F
(+) Em uso inativo, a temperatura média para o lado superior é 28.5 °C / 83 F, em comparação com a média do dispositivo de 29.5 °C / ### class_avg_f### F.
(+) Os apoios para as mãos e o touchpad são mais frios que a temperatura da pele, com um máximo de 26.8 °C / 80.2 F e, portanto, são frios ao toque.
(±) A temperatura média da área do apoio para as mãos de dispositivos semelhantes foi 27.5 °C / 81.5 F (+0.7 °C / 1.3 F).
| Lenovo ThinkPad 13-20GKS01100 6200U, HD Graphics 520 | Lenovo ThinkPad T460-20FN003LGE 6200U, HD Graphics 520 | Acer TravelMate P238-M-5575 6200U, HD Graphics 520 | Asus Zenbook UX303UA-FN121T 6200U, HD Graphics 520 | Acer Aspire S 13 S5-371-71QZ 6500U, HD Graphics 520 | Dell XPS 13-9350 6200U, HD Graphics 520 | Lenovo ThinkPad T460s-20F9003SGE 6200U, HD Graphics 520 | |
|---|---|---|---|---|---|---|---|
| Heat | 7% | 20% | 14% | 8% | 0% | 10% | |
| Maximum Upper Side * (°C) | 43.7 | 37.3 15% | 34.2 22% | 39.7 9% | 38.5 12% | 45.2 -3% | 41.4 5% |
| Maximum Bottom * (°C) | 44.2 | 44.3 -0% | 31 30% | 34.8 21% | 47.7 -8% | 45.2 -2% | 41 7% |
| Idle Upper Side * (°C) | 31.4 | 29 8% | 27.1 14% | 27.4 13% | 27.2 13% | 30.4 3% | 26.7 15% |
| Idle Bottom * (°C) | 32.1 | 30.1 6% | 27.7 14% | 27.7 14% | 27.4 15% | 31.2 3% | 27.8 13% |
* ... menor é melhor
| desligado | |
| Ocioso | |
| Carga |
|
Key:
min: | |
| Lenovo ThinkPad 13-20GKS01100 6200U, HD Graphics 520, 1920x1080 | Lenovo ThinkPad T460-20FN003LGE 6200U, HD Graphics 520, 1920x1080 | Acer TravelMate P238-M-5575 6200U, HD Graphics 520, 1366x768 | Asus Zenbook UX303UA-FN121T 6200U, HD Graphics 520, 1366x768 | Acer Aspire S 13 S5-371-71QZ 6500U, HD Graphics 520, 1920x1080 | Lenovo ThinkPad T460s-20F9003SGE 6200U, HD Graphics 520, 1920x1080 | |
|---|---|---|---|---|---|---|
| Power Consumption | -14% | -2% | -12% | -20% | -14% | |
| Idle Minimum * (Watt) | 3.1 | 3.5 -13% | 3.2 -3% | 4.2 -35% | 4.1 -32% | 3.7 -19% |
| Idle Average * (Watt) | 5.5 | 6.7 -22% | 5.5 -0% | 6.2 -13% | 6.7 -22% | 6.8 -24% |
| Idle Maximum * (Watt) | 6 | 7.3 -22% | 6 -0% | 6.4 -7% | 7.4 -23% | 7.3 -22% |
| Load Average * (Watt) | 25.8 | 28.2 -9% | 29.5 -14% | 29 -12% | 32.4 -26% | 26.3 -2% |
| Load Maximum * (Watt) | 33.6 | 34.6 -3% | 30.9 8% | 31 8% | 32.4 4% | 34.6 -3% |
* ... menor é melhor
| Lenovo ThinkPad 13-20GKS01100 42 Wh | Lenovo ThinkPad T460-20FN003LGE 46 Wh | Acer TravelMate P238-M-5575 49.7 Wh | Asus Zenbook UX303UA-FN121T 50 Wh | Acer Aspire S 13 S5-371-71QZ 45 Wh | Dell XPS 13-9350 56 Wh | Lenovo ThinkPad T460s-20F9003SGE 49 Wh | |
|---|---|---|---|---|---|---|---|
| Duração da bateria | -7% | 33% | 18% | 4% | 6% | 1% | |
| Reader / Idle (h) | 15.7 | 15.9 1% | 21.5 37% | 17.1 9% | 13 -17% | 15.3 -3% | |
| H.264 (h) | 7.8 | 8.5 9% | 9.3 19% | 8.9 14% | |||
| WiFi v1.3 (h) | 6.2 | 5.6 -10% | 10.1 63% | 7.3 18% | 7.9 27% | 7.5 21% | 6.6 6% |
| Load (h) | 2.2 | 1.6 -27% | 2.5 14% | 1.7 -23% | 2.5 14% | 1.9 -14% |
Pro
Contra
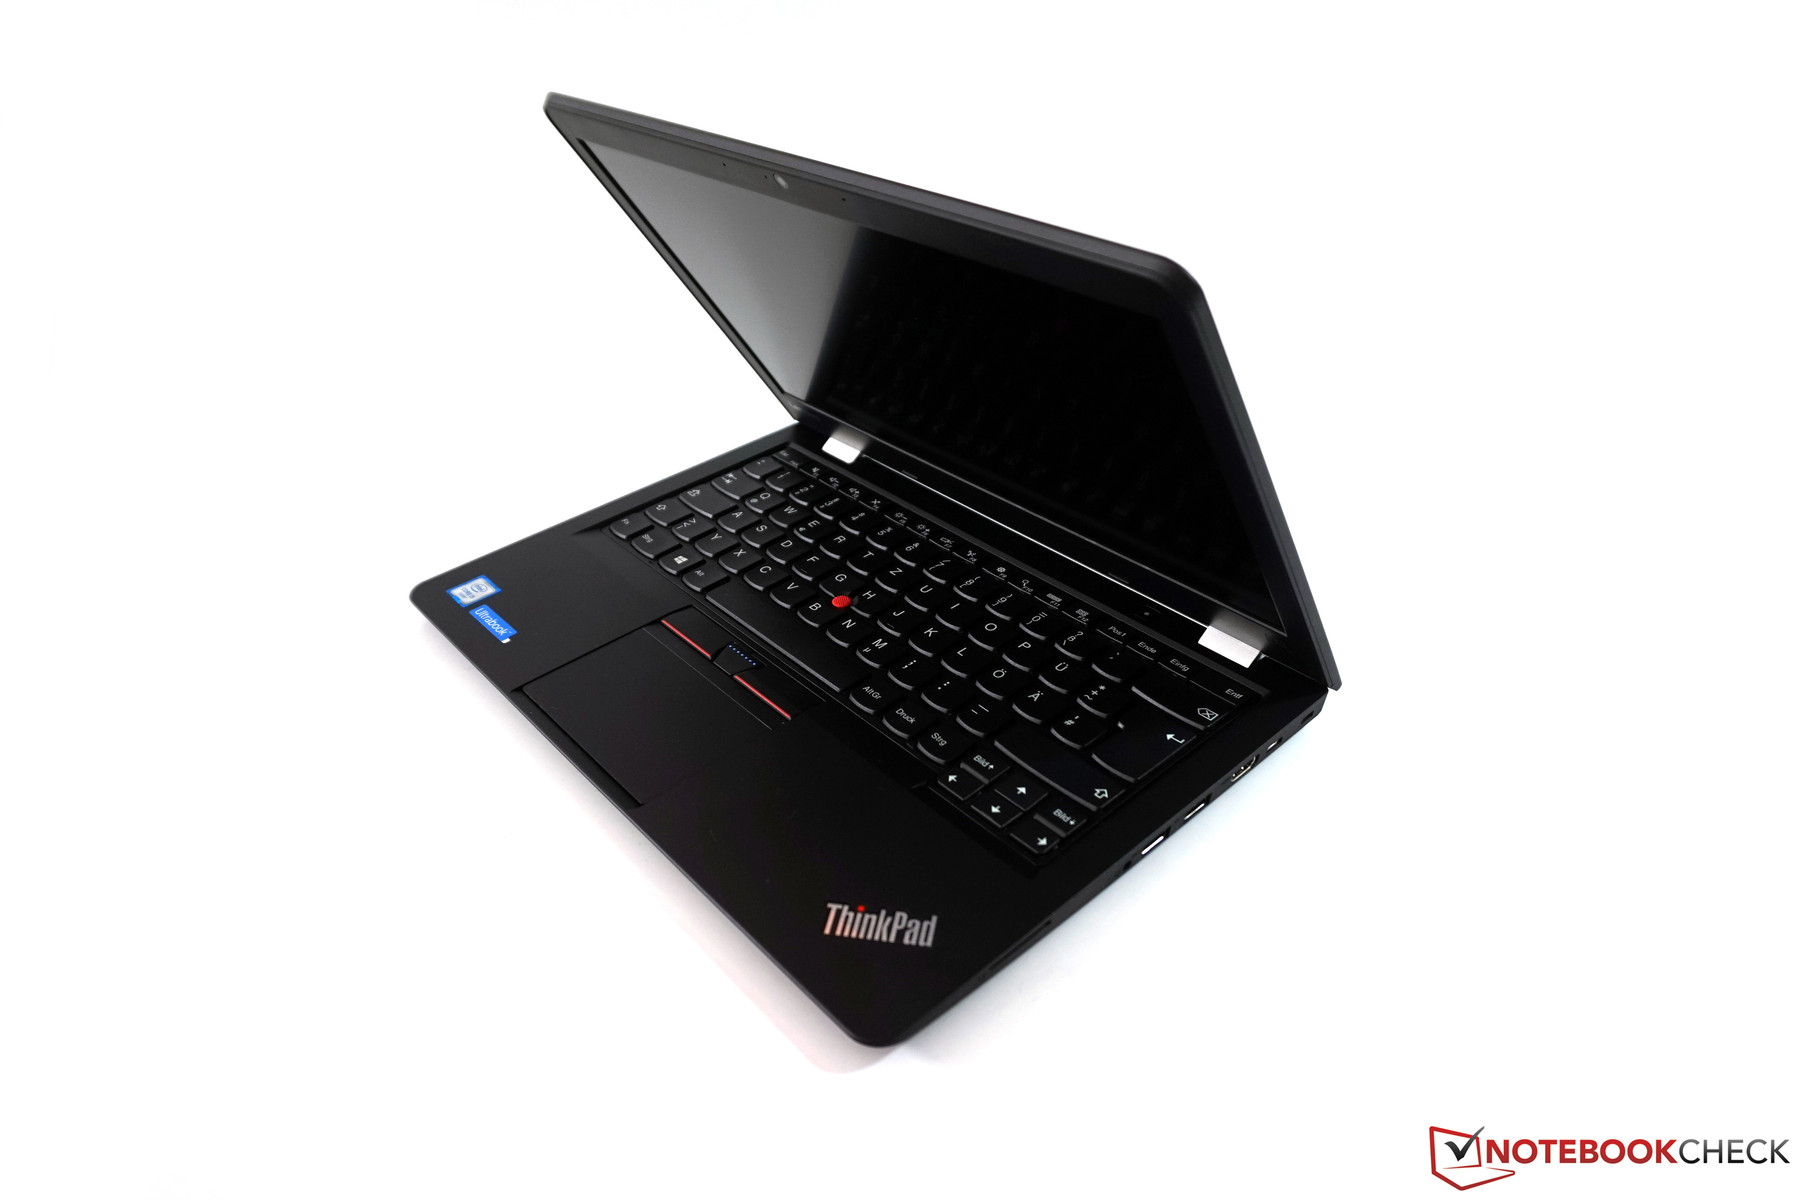
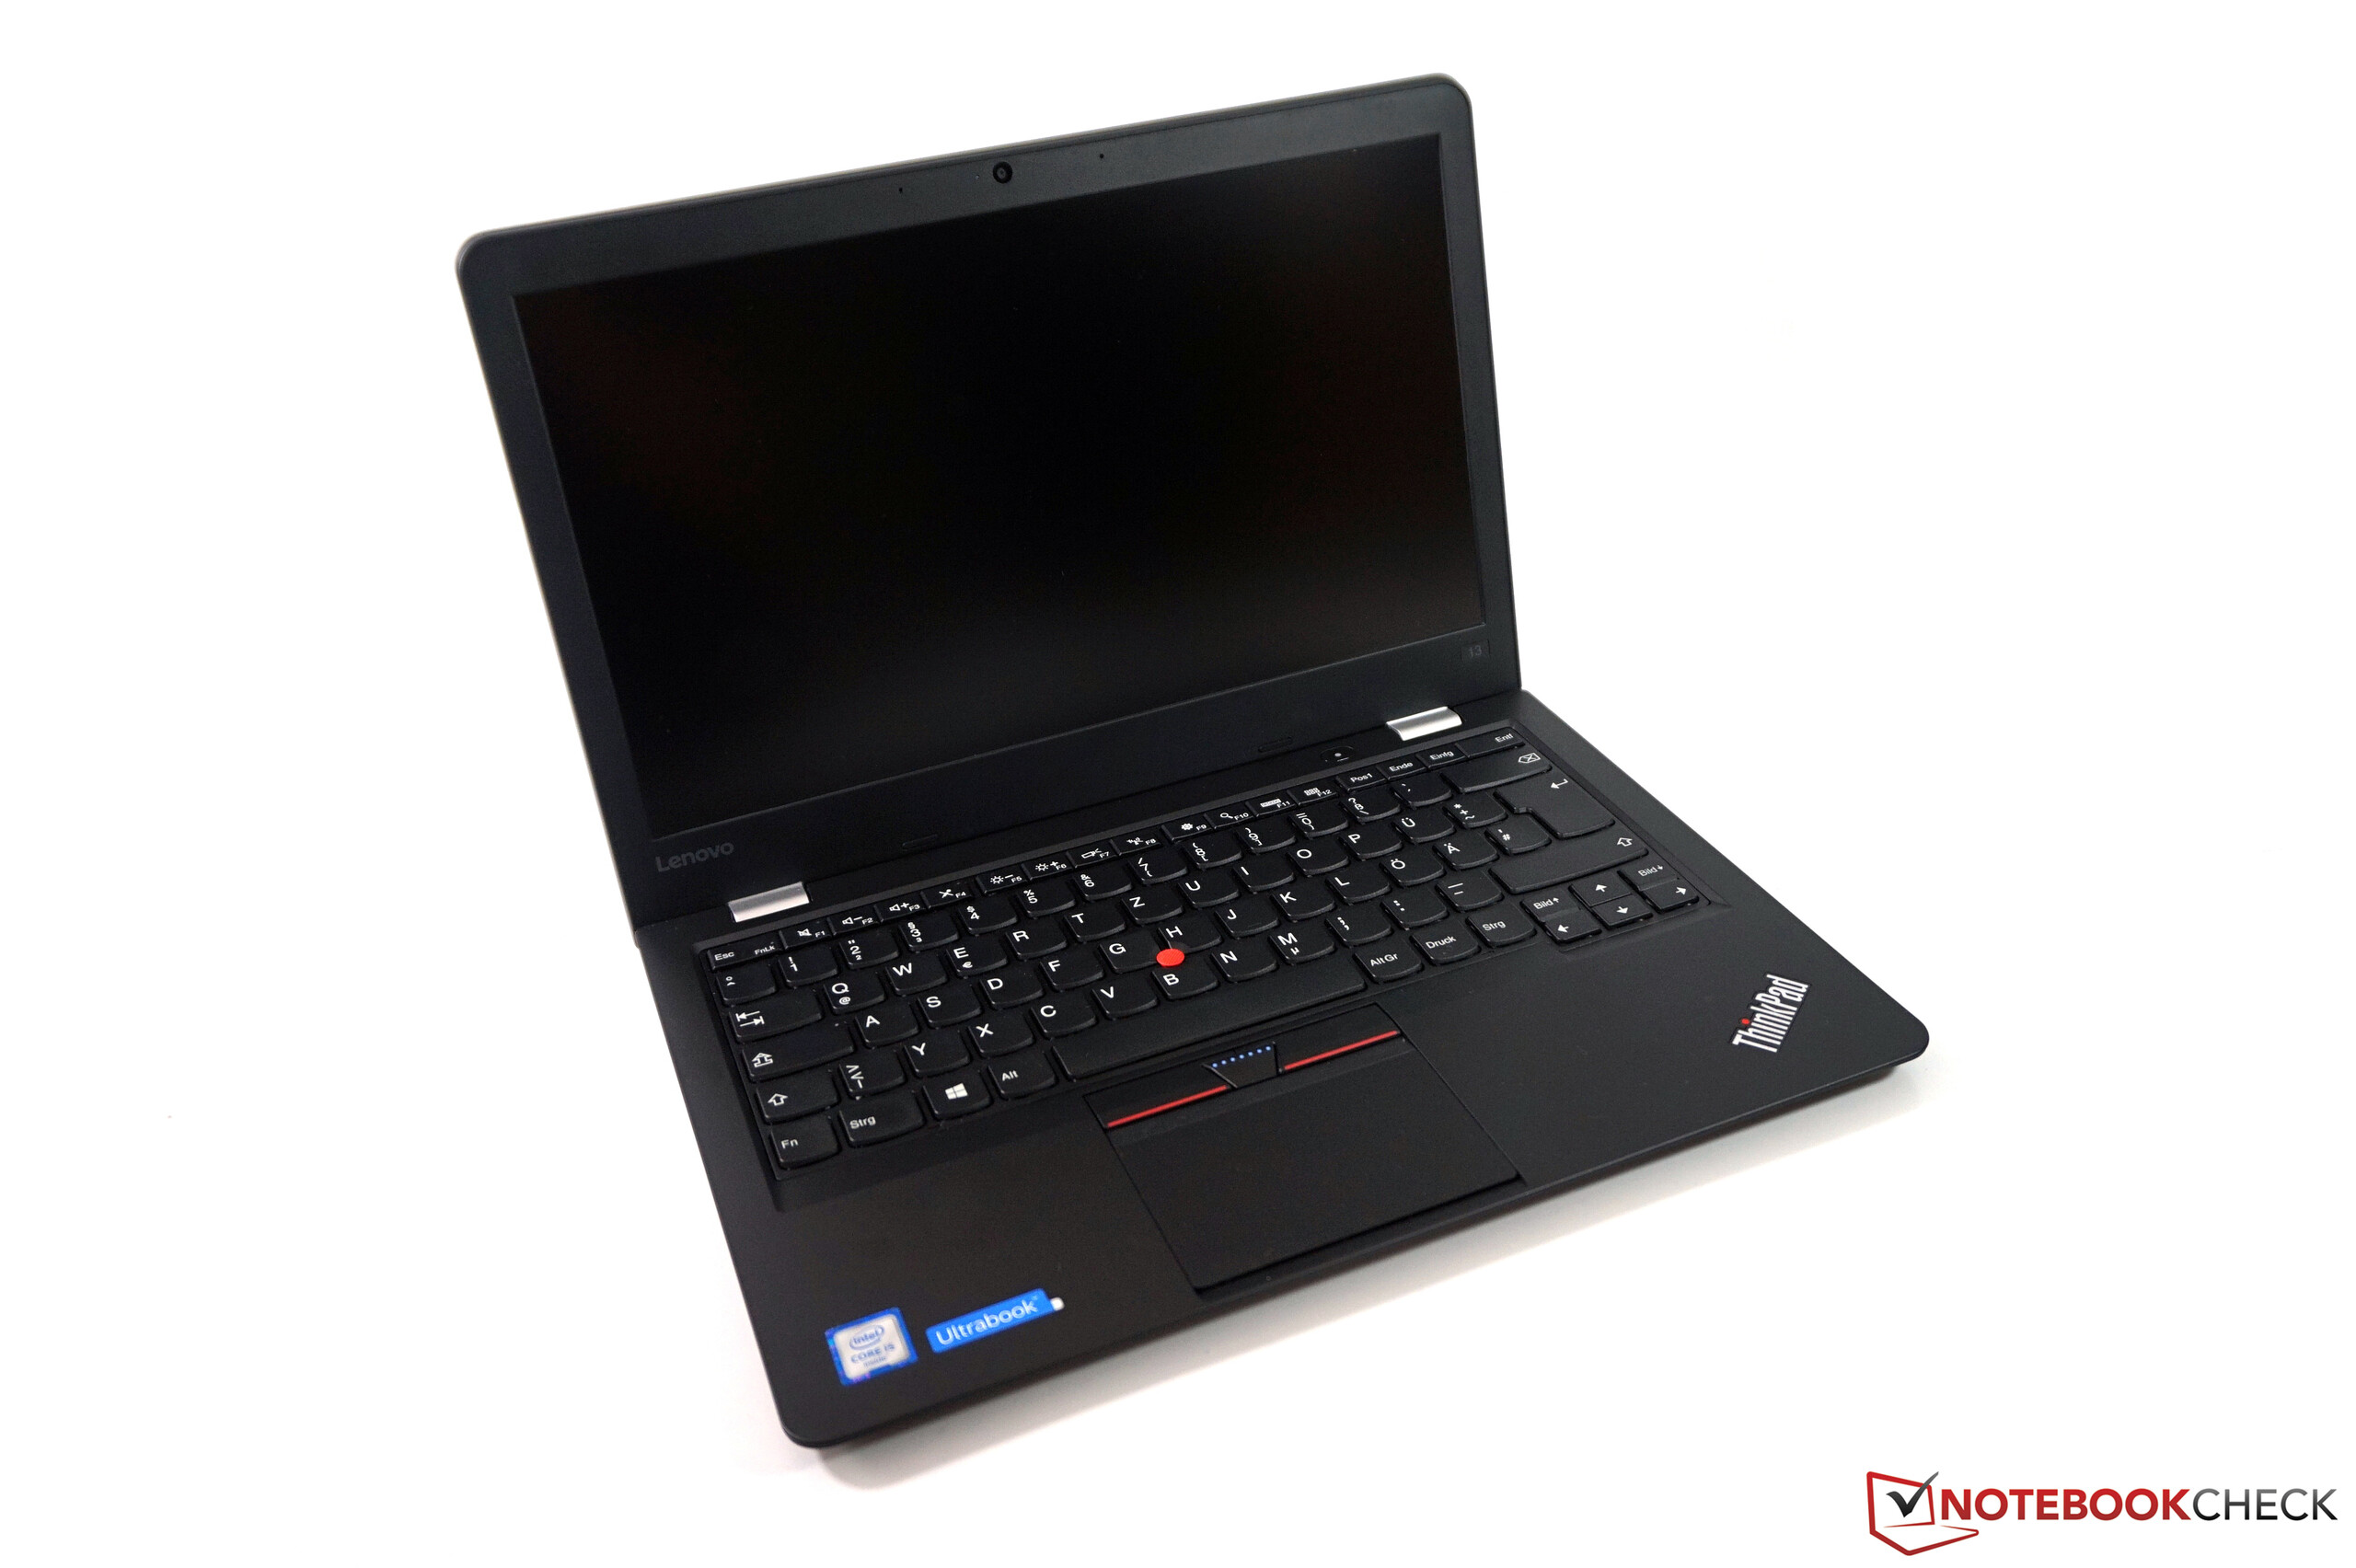
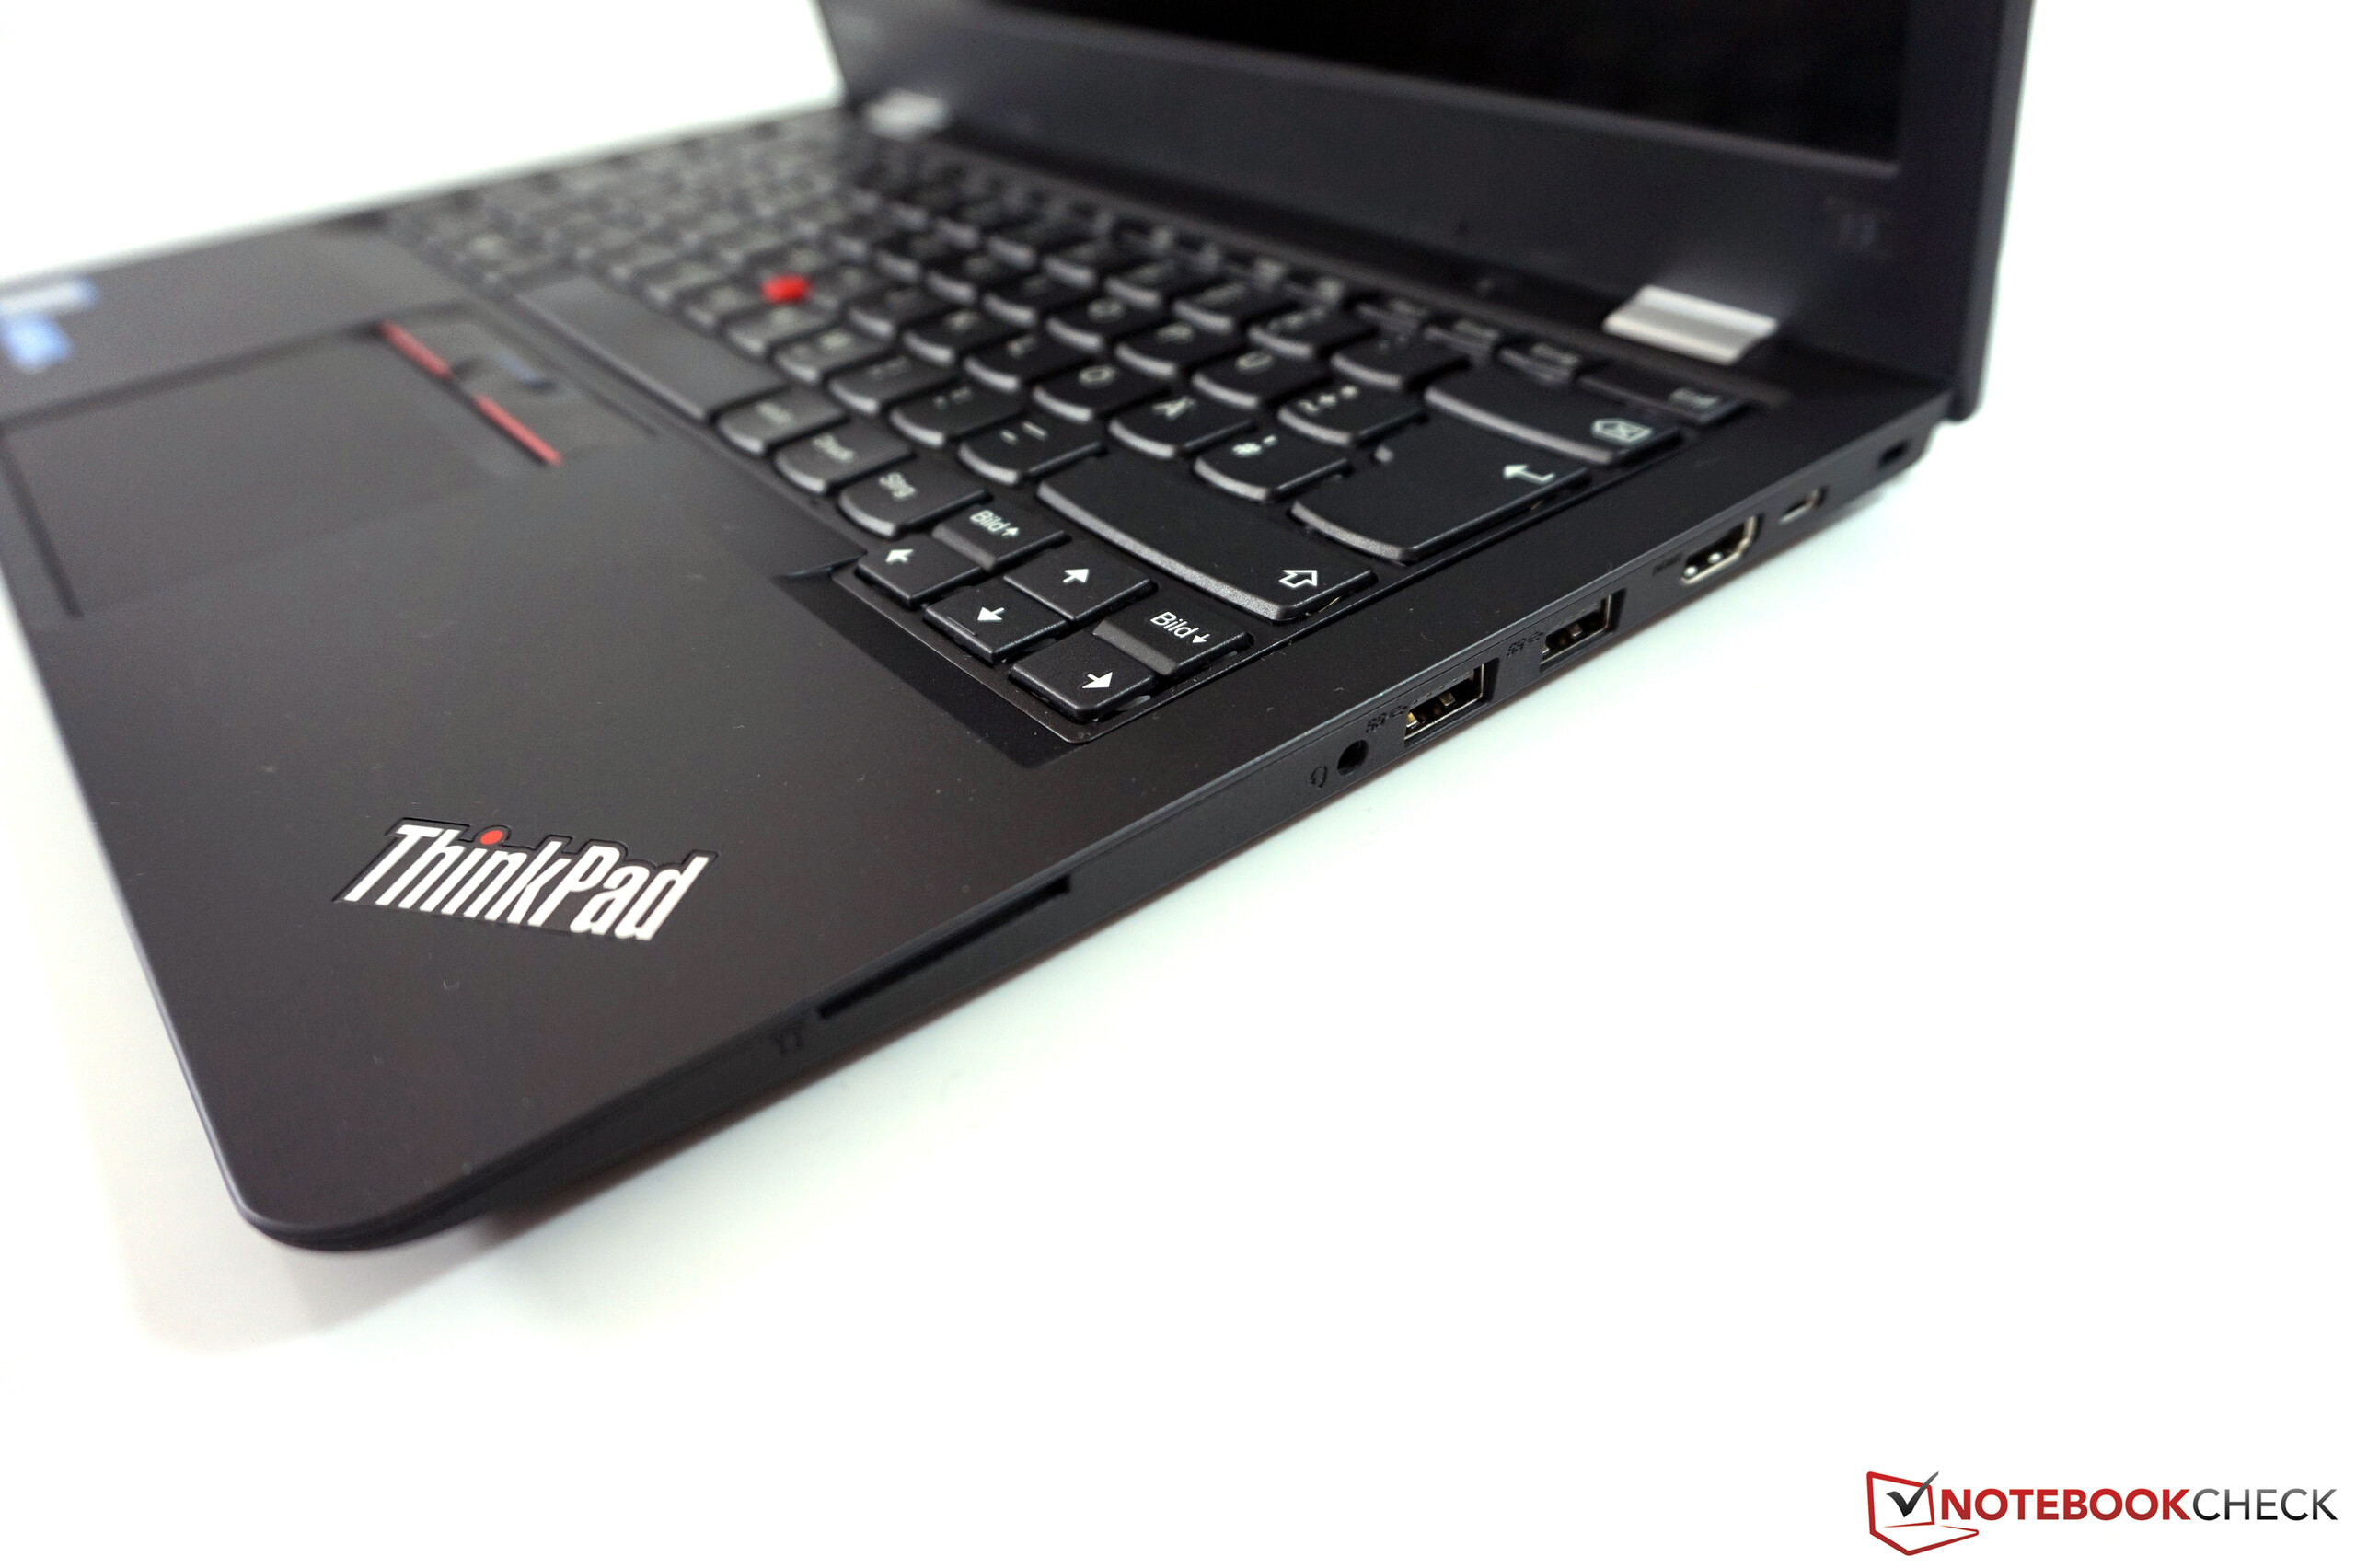
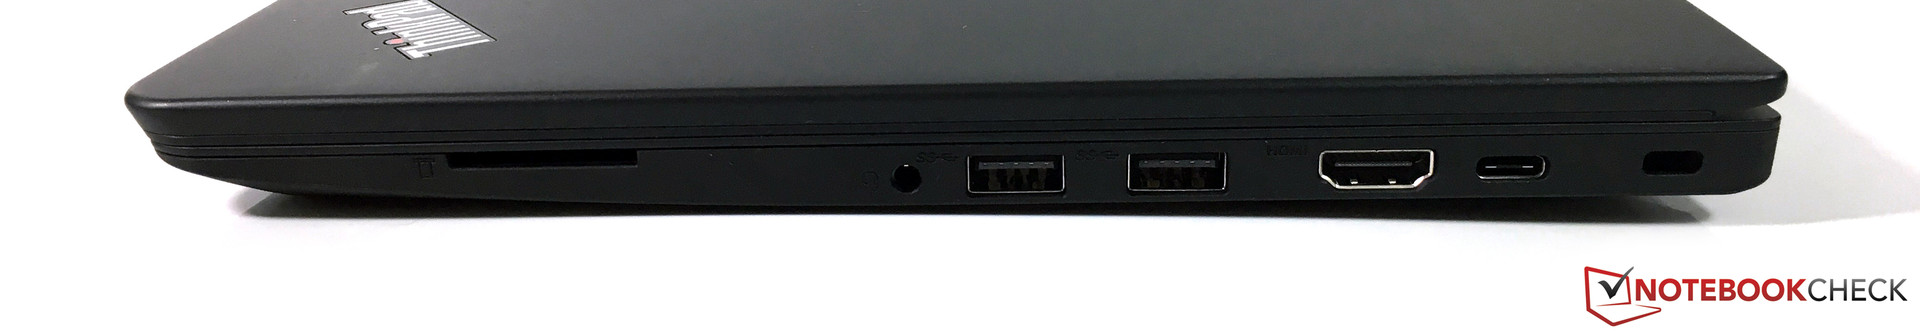
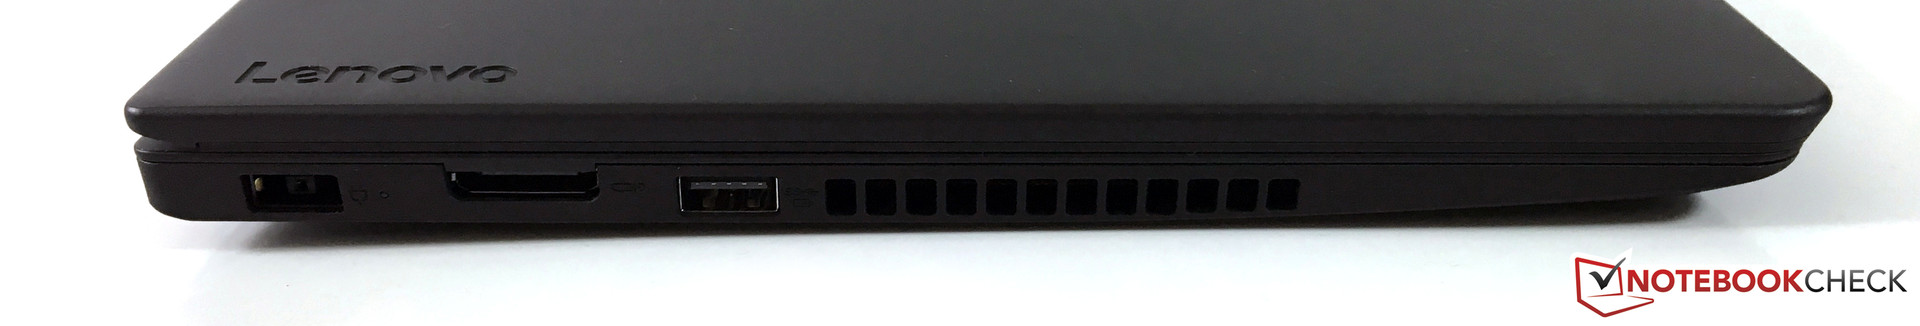
O novo ThinkPad 13 é um aparelho interessante: É um Ultrabook com componentes e portas modernas, que não revela problemas sérios em nossa análise. Obtemos um bom painel FHD-IPS mate, mas poderia ser mais brilhante para o seu uso confortável em exteriores. O desempenho subjetivo também é muito bom graças ao SSD, e estamos contentes sobre o o excelente teclado ThinkPad, embora não seja iluminado.
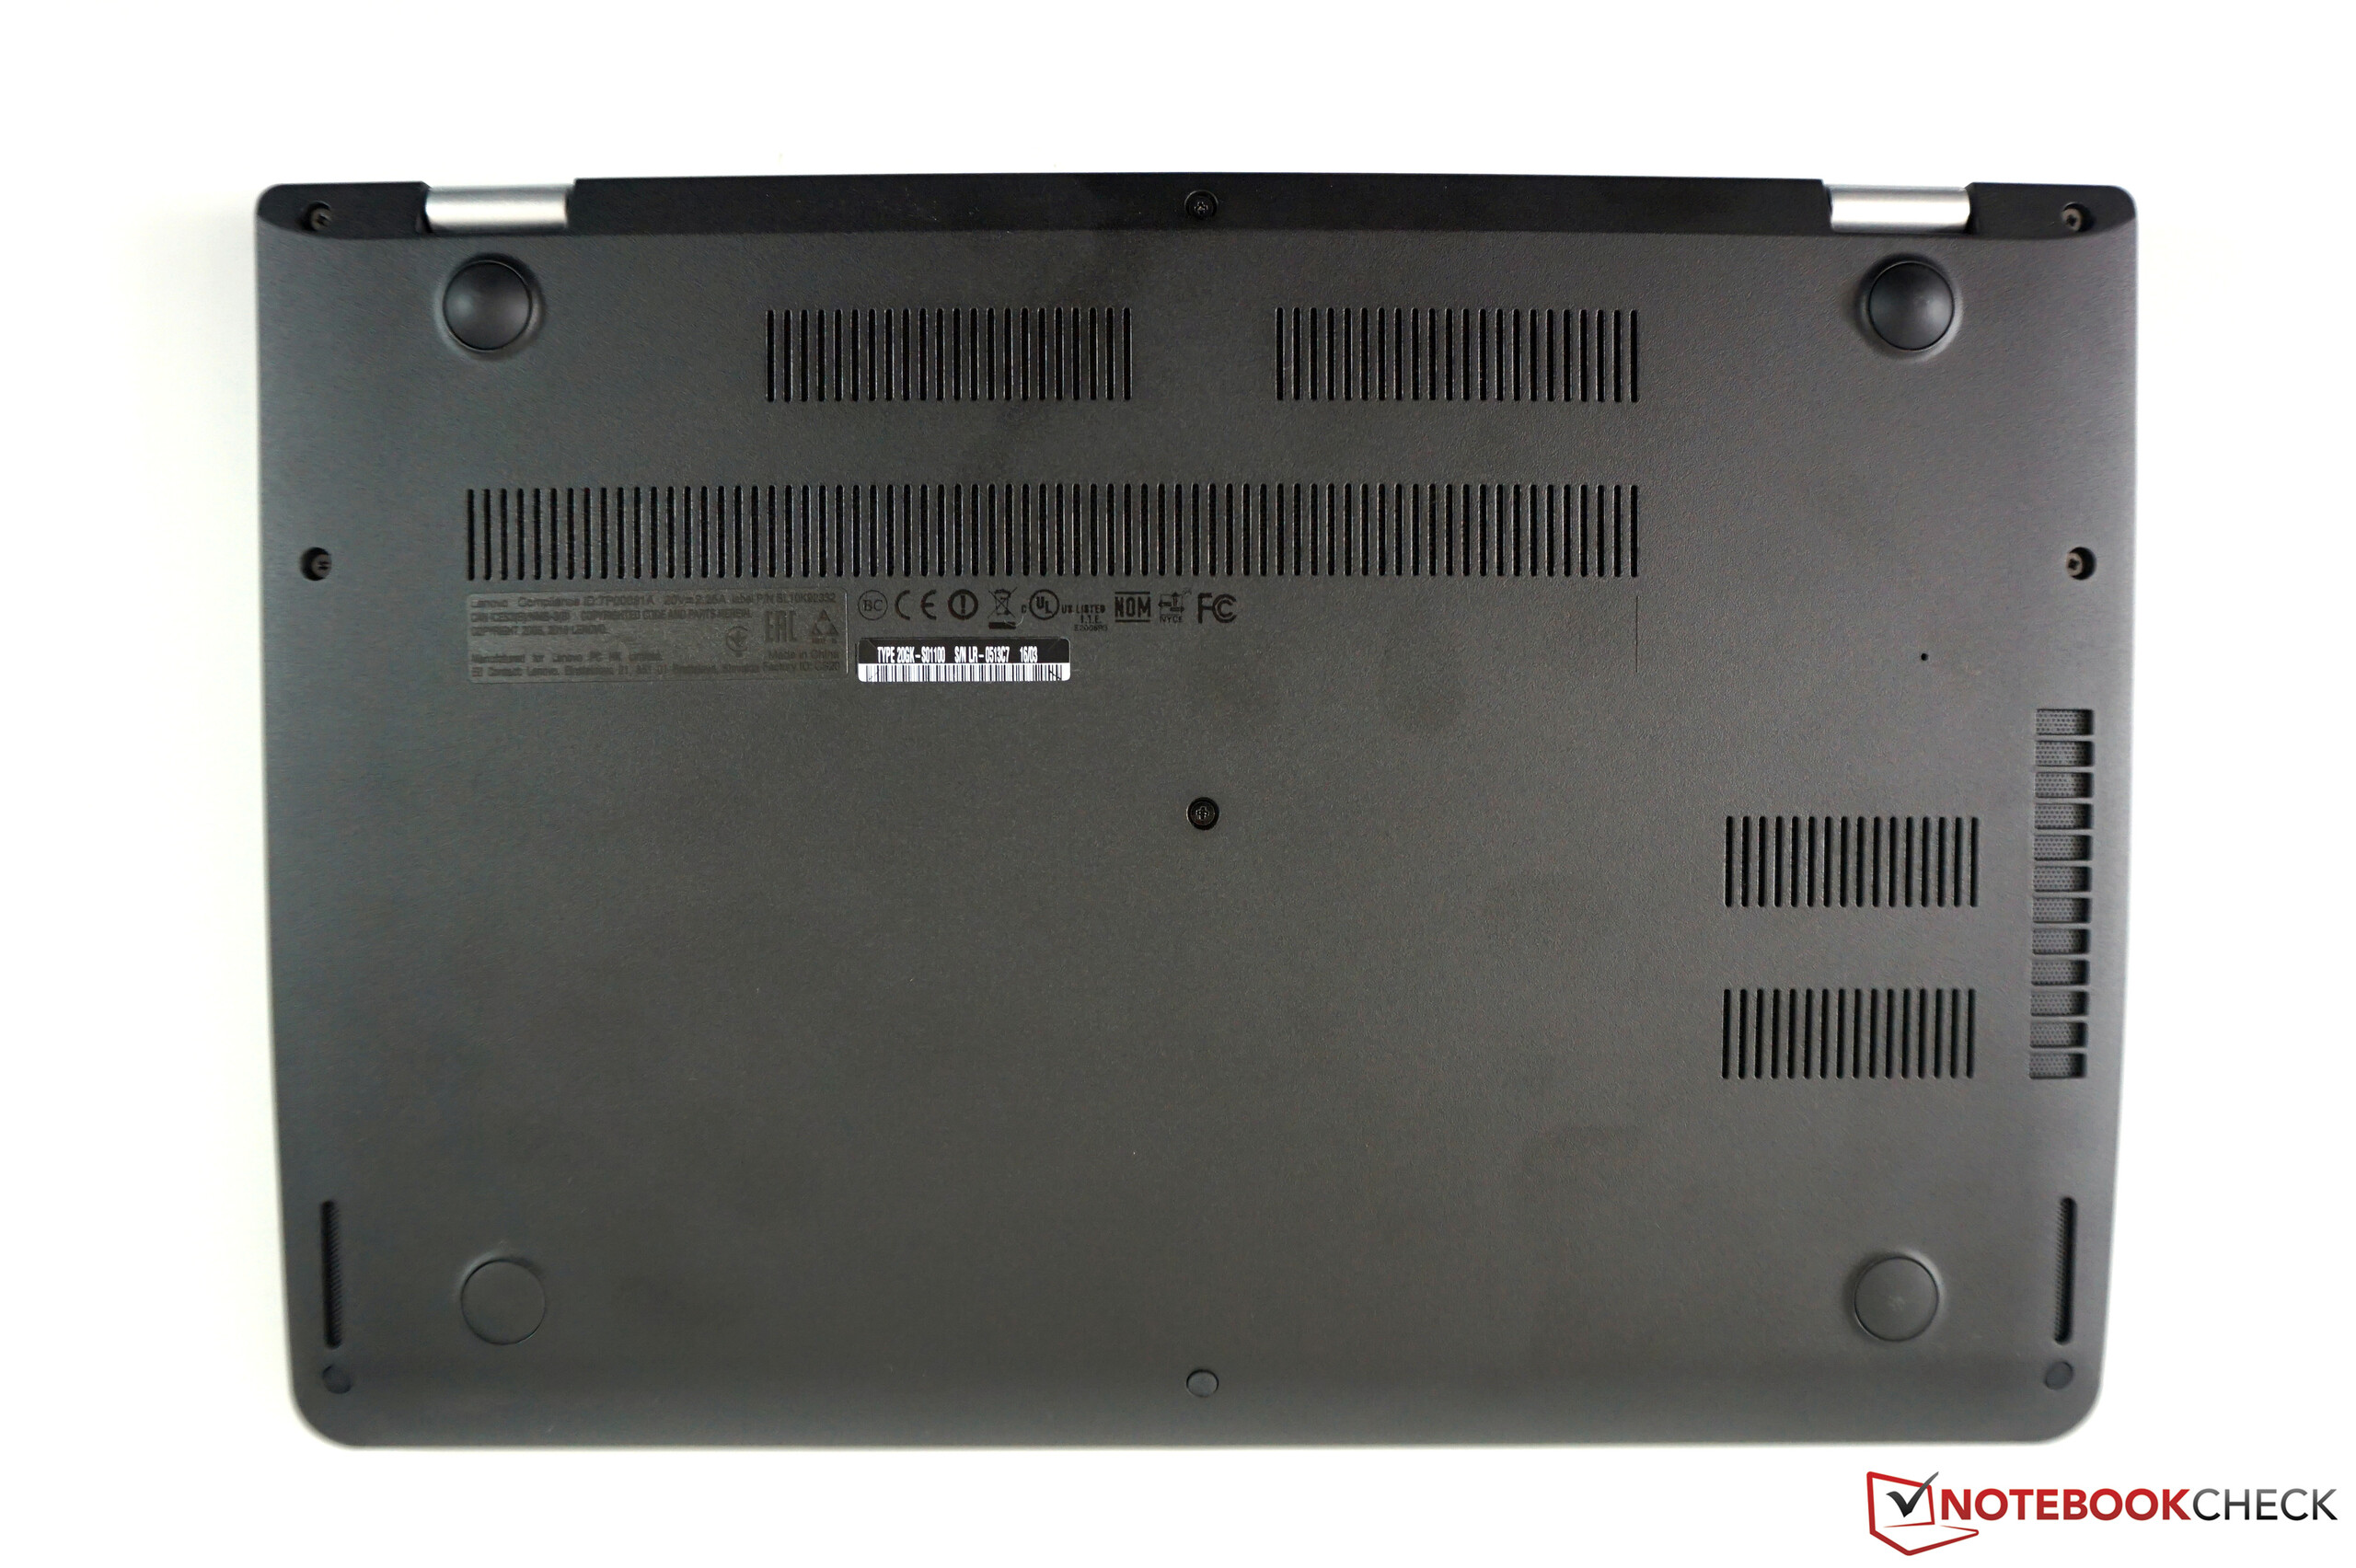
Você terá que fazer compromissos em termos da carcaça. A estabilidade da unidade base ainda é boa, mas a tela, em particular, é suscetível à pressão e tentativas de flexão. As dobradiças também não são suficientemente firmes, e não conseguem evitar o balanço da tela. Existe ainda mais limitações em termos de recursos de segurança.
O modelo Campus do ThinkPad 13, em particular, é uma recomendação. No entanto, a concorrência é maior quando você deve pagar o preço mais alto de 1.000 Euros (~$1119), e especialmente o Dell XPS 13 é uma alternativa ainda melhor.
A comparação com os outros dois modelos ThinkPad é particularmente interessante. O desempenho dos três portáteis é muito parecido, que é mais ou menos o caso para as durações da bateria. O preço adicional lhe arranjará construções mais sólidas, teclados iluminados e mais recursos de segurança, bem como períodos de garantia mais longos. A situação é bastante complicada para a tela. Nossos dois modelos de teste do T460 e T460s foram equipados com painéis da Innolux, que são derrotados pela tela LG do ThinkPad 13.
Tanto o ThinkPad 13 quanto o ThinkPad T460 oferecem mais que nossas duas alternativas econômicas da Asus e Acer quando você tem acesso ao programa Campus da Lenovo. O ThinkPad 13 é melhor que o T460 em termos de mobilidade, portanto, a decisão não é fácil e depende do cenário de uso. Se você levar o portátil todos os dias para a escola, o ThinkPad 13 certamente é a melhor escolha. Uma recomendação é mais difícil quando tem que pagar o preço integral de cerca de 1.000 Euros (~$1119). O Dell XPS 13, em particular, atualmente é uma alternativa ainda melhor nesta faixa de preços.
Esta é uma versão reduzida da análise original. Você pode ler a análise completa em inglês aqui.
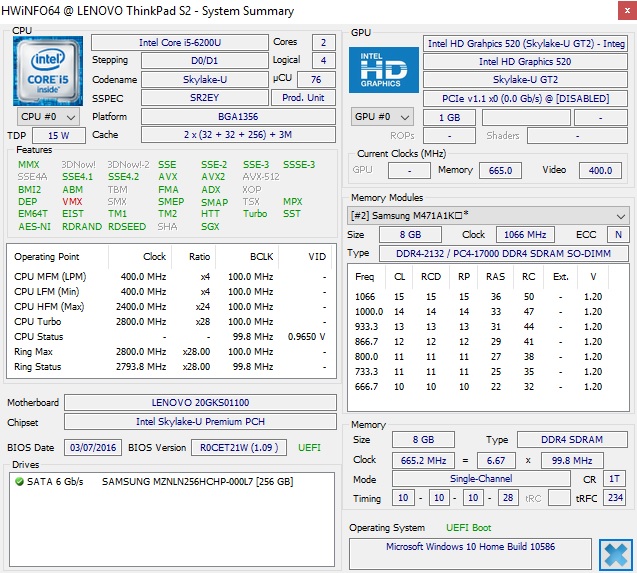
Lenovo ThinkPad 13-20GKS01100
- 04/28/2017 v6 (old)
Andreas Osthoff
Price comparison
