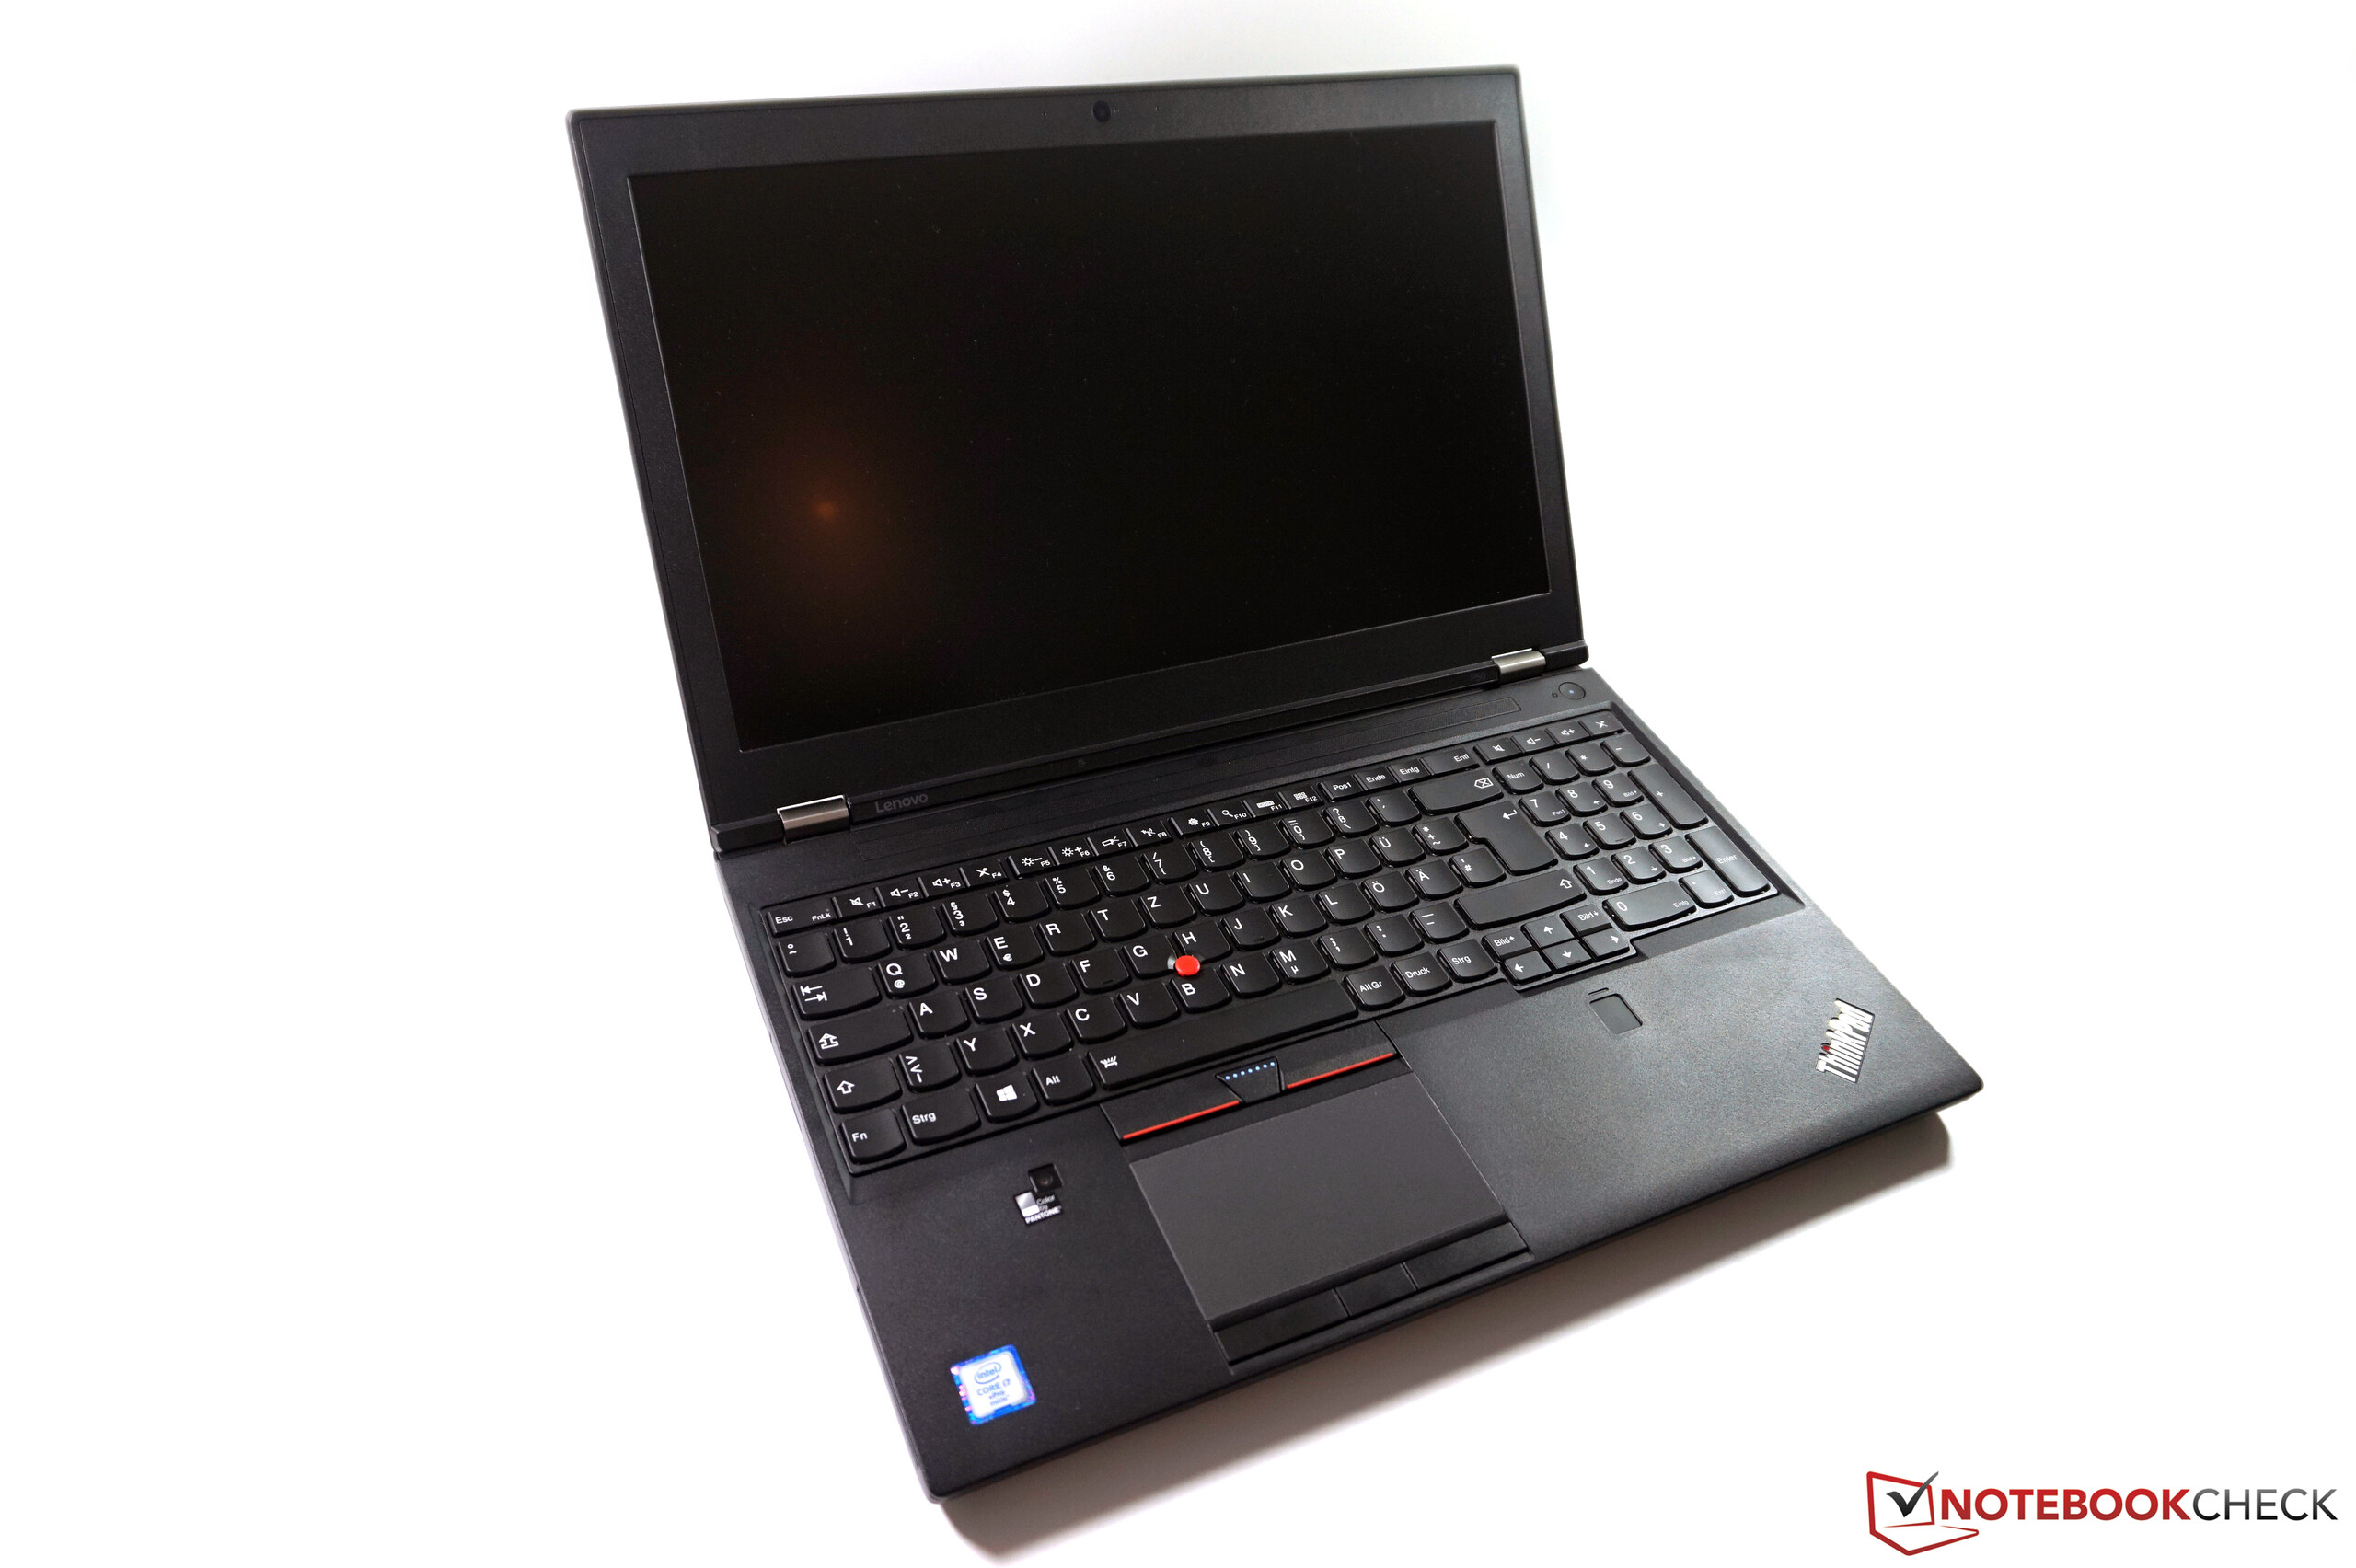
Breve Análise do Workstation Lenovo ThinkPad P50 Workstation (Xeon, 4K)
Cintilação da tela / PWM (modulação por largura de pulso)
| Tela tremeluzindo/PWM detectado | 217 Hz | 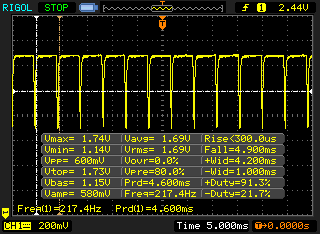 | |
A luz de fundo da tela pisca em 217 Hz (pior caso, por exemplo, utilizando PWM) . A frequência de 217 Hz é relativamente baixa, portanto, usuários sensíveis provavelmente notarão cintilação e sentirão fadiga ocular na configuração de brilho indicada e abaixo. [pwm_comparison] Em comparação: 52 % de todos os dispositivos testados não usam PWM para escurecer a tela. Se PWM foi detectado, uma média de 7754 (mínimo: 5 - máximo: 343500) Hz foi medida. | |||
| |||||||||||||||||||||||||
iluminação: 86 %
iluminação com acumulador: 243 cd/m²
Contraste: 806:1 (Preto: 0.31 cd/m²)
ΔE ColorChecker Calman: 4.5 | ∀{0.5-29.43 Ø4.71}
ΔE Greyscale Calman: 7.2 | ∀{0.09-98 Ø4.96}
94.5% sRGB (Calman 2D)
98.6% sRGB (Argyll 1.6.3 3D)
85% AdobeRGB 1998 (Argyll 1.6.3 3D)
98.2% AdobeRGB 1998 (Argyll 3D)
98.6% sRGB (Argyll 3D)
85.8% Display P3 (Argyll 3D)
Gamma: 2.31
CCT: 6399 K
| Lenovo ThinkPad P50 3840x2160, IPS, LQ156D1JW05 | Lenovo ThinkPad P50 1920x1080, IPS, LP156WF6-SPK1 | HP ZBook 15 G3 1920x1080, UWVA-IPS, Samsung SDC5344 | Dell Precision 5510 3840x2160, IGZO LED, SHP143E, 7PHPT_LQ156D1 | Schenker W505 3840x2160, IPS, Sharp LQ156D1JW04 (SHP1436) | Lenovo ThinkPad W541 20EF000SGE 2880x1620, IPS LED, VVX16T028J00, LEN40B5 | |
|---|---|---|---|---|---|---|
| Display | -51% | -18% | 2% | -20% | -27% | |
| Display P3 Coverage (%) | 85.8 | 39.13 -54% | 66.8 -22% | 88.4 3% | 64.7 -25% | 62.5 -27% |
| sRGB Coverage (%) | 98.6 | 58.5 -41% | 95.5 -3% | 100 1% | 96.4 -2% | 86.1 -13% |
| AdobeRGB 1998 Coverage (%) | 98.2 | 40.45 -59% | 69 -30% | 99.5 1% | 66.8 -32% | 58.1 -41% |
| Response Times | -18% | -50% | -50% | |||
| Response Time Grey 50% / Grey 80% * (ms) | 39.2 ? | 46 ? -17% | 54 ? -38% | 56.4 ? -44% | ||
| Response Time Black / White * (ms) | 22 ? | 26 ? -18% | 35.6 ? -62% | 34 ? -55% | ||
| PWM Frequency (Hz) | 217 | 198 ? | ||||
| Screen | -2% | -1% | 16% | 11% | 3% | |
| Brightness middle (cd/m²) | 250 | 263 5% | 306 22% | 391 56% | 288 15% | 360 44% |
| Brightness (cd/m²) | 250 | 236 -6% | 289 16% | 361 44% | 293 17% | 330 32% |
| Brightness Distribution (%) | 86 | 78 -9% | 85 -1% | 87 1% | 93 8% | 87 1% |
| Black Level * (cd/m²) | 0.31 | 0.34 -10% | 0.34 -10% | 0.4 -29% | 0.27 13% | 0.57 -84% |
| Contrast (:1) | 806 | 774 -4% | 900 12% | 978 21% | 1067 32% | 632 -22% |
| Colorchecker dE 2000 * | 4.5 | 2.35 48% | 5.1 -13% | 4.85 -8% | 3.76 16% | 2.85 37% |
| Colorchecker dE 2000 max. * | 9.3 | 9.9 -6% | ||||
| Greyscale dE 2000 * | 7.2 | 3.33 54% | 7.4 -3% | 4.01 44% | 4.83 33% | 4.29 40% |
| Gamma | 2.31 95% | 2.38 92% | 2.37 93% | 2.18 101% | 2.39 92% | 2.32 95% |
| CCT | 6399 102% | 6917 94% | 7263 89% | 7340 89% | 7602 86% | 6310 103% |
| Color Space (Percent of AdobeRGB 1998) (%) | 85 | 37 -56% | 63 -26% | 96 13% | 61 -28% | 62 -27% |
| Color Space (Percent of sRGB) (%) | 98.6 | 58 -41% | 95 -4% | 100 1% | 96 -3% | |
| Média Total (Programa/Configurações) | -24% /
-15% | -23% /
-11% | -11% /
4% | -5% /
4% | -12% /
-5% |
* ... menor é melhor
Exibir tempos de resposta
| ↔ Tempo de resposta preto para branco | ||
|---|---|---|
| 22 ms ... ascensão ↗ e queda ↘ combinadas | ↗ 7 ms ascensão | 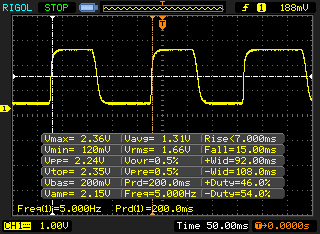 |
| ↘ 15 ms queda | ||
| A tela mostra boas taxas de resposta em nossos testes, mas pode ser muito lenta para jogadores competitivos. Em comparação, todos os dispositivos testados variam de 0.1 (mínimo) a 240 (máximo) ms. » 49 % de todos os dispositivos são melhores. Isso significa que o tempo de resposta medido é pior que a média de todos os dispositivos testados (19.8 ms). | ||
| ↔ Tempo de resposta 50% cinza a 80% cinza | ||
| 39.2 ms ... ascensão ↗ e queda ↘ combinadas | ↗ 14.8 ms ascensão | 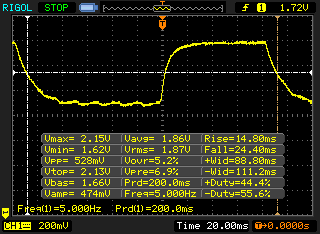 |
| ↘ 24.4 ms queda | ||
| A tela mostra taxas de resposta lentas em nossos testes e será insatisfatória para os jogadores. Em comparação, todos os dispositivos testados variam de 0.165 (mínimo) a 636 (máximo) ms. » 60 % de todos os dispositivos são melhores. Isso significa que o tempo de resposta medido é pior que a média de todos os dispositivos testados (31 ms). | ||
| Cinebench R15 | |
| CPU Multi 64Bit | |
| Lenovo ThinkPad W541 20EF000SGE | |
| Schenker W505 | |
| Dell Precision 5510 | |
| HP ZBook 15 G3 | |
| Lenovo ThinkPad P50 | |
| Lenovo ThinkPad P50 | |
| CPU Single 64Bit | |
| HP ZBook 15 G3 | |
| Lenovo ThinkPad P50 | |
| Lenovo ThinkPad W541 20EF000SGE | |
| Schenker W505 | |
| Dell Precision 5510 | |
| Lenovo ThinkPad P50 | |
| Cinebench R11.5 | |
| CPU Multi 64Bit | |
| Lenovo ThinkPad W541 20EF000SGE | |
| Lenovo ThinkPad P50 | |
| Dell Precision 5510 | |
| Schenker W505 | |
| HP ZBook 15 G3 | |
| Lenovo ThinkPad P50 | |
| CPU Single 64Bit | |
| HP ZBook 15 G3 | |
| Lenovo ThinkPad P50 | |
| Lenovo ThinkPad W541 20EF000SGE | |
| Schenker W505 | |
| Dell Precision 5510 | |
| Lenovo ThinkPad P50 | |
| PCMark 7 - Score | |
| Schenker W505 | |
| HP ZBook 15 G3 | |
| Dell Precision 5510 | |
| Lenovo ThinkPad W541 20EF000SGE | |
| Lenovo ThinkPad P50 | |
| Lenovo ThinkPad P50 | |
| PCMark 8 | |
| Home Score Accelerated v2 | |
| Lenovo ThinkPad P50 | |
| Lenovo ThinkPad P50 | |
| HP ZBook 15 G3 | |
| Dell Precision 5510 | |
| Lenovo ThinkPad W541 20EF000SGE | |
| Creative Score Accelerated v2 | |
| Dell Precision 5510 | |
| HP ZBook 15 G3 | |
| Lenovo ThinkPad P50 | |
| Work Score Accelerated v2 | |
| HP ZBook 15 G3 | |
| Dell Precision 5510 | |
| Lenovo ThinkPad P50 | |
| Lenovo ThinkPad P50 | |
| Lenovo ThinkPad W541 20EF000SGE | |
| PCMark 7 Score | 4979 pontos | |
| PCMark 8 Home Score Accelerated v2 | 4023 pontos | |
| PCMark 8 Creative Score Accelerated v2 | 4291 pontos | |
| PCMark 8 Work Score Accelerated v2 | 4372 pontos | |
Ajuda | ||
| Lenovo ThinkPad P50 Samsung SM951 MZVPV256HDGL m.2 PCI-e | Lenovo ThinkPad P50 Samsung SSD PM871 MZNLN256HCHP | HP ZBook 15 G3 Samsung SM951 MZVPV512HDGL m.2 PCI-e | Schenker W505 Samsung SSD 850 EVO M.2 500GB | Lenovo ThinkPad W541 20EF000SGE Samsung SSD PM851 512 GB MZ7TE512HMHP | |
|---|---|---|---|---|---|
| CrystalDiskMark 3.0 | -59% | -5% | -51% | -57% | |
| Read Seq (MB/s) | 1771 | 526 -70% | 1502 -15% | 528 -70% | 524 -70% |
| Write Seq (MB/s) | 1304 | 302.4 -77% | 1538 18% | 512 -61% | 440.7 -66% |
| Read 512 (MB/s) | 1364 | 465.3 -66% | 1164 -15% | 468.2 -66% | 436.7 -68% |
| Write 512 (MB/s) | 1291 | 301.3 -77% | 1432 11% | 378.9 -71% | 406.3 -69% |
| Read 4k (MB/s) | 60.2 | 35.58 -41% | 59.1 -2% | 48.93 -19% | 33.03 -45% |
| Write 4k (MB/s) | 256.7 | 124 -52% | 207.3 -19% | 121.2 -53% | 85.8 -67% |
| Read 4k QD32 (MB/s) | 953 | 345.3 -64% | 798 -16% | 370.9 -61% | 390.5 -59% |
| Write 4k QD32 (MB/s) | 389.6 | 291.9 -25% | 393.8 1% | 350.3 -10% | 334.1 -14% |

| SiSoft Sandra 2016 | |
| Image Processing | |
| HP ZBook 15 G3 | |
| Lenovo ThinkPad P50 | |
| Lenovo ThinkPad P50 | |
| Dell Precision 5510 | |
| GP Cryptography (Higher Security AES256+SHA2-512) | |
| Lenovo ThinkPad P50 | |
| HP ZBook 15 G3 | |
| Lenovo ThinkPad P50 | |
| Dell Precision 5510 | |
| GP Financial Analysis (FP High/Double Precision) | |
| HP ZBook 15 G3 | |
| Lenovo ThinkPad P50 | |
| Lenovo ThinkPad P50 | |
| Dell Precision 5510 | |
| Unigine Heaven 3.0 | |
| 1920x1080 OpenGL, Normal Tessellation, High Shaders AA:Off AF:Off | |
| HP ZBook 15 G3 | |
| Lenovo ThinkPad P50 | |
| Dell Precision 5510 | |
| Lenovo ThinkPad P50 | |
| 1920x1080 DX 11, Normal Tessellation, High Shaders AA:Off AF:Off | |
| Lenovo ThinkPad P50 | |
| Lenovo ThinkPad P50 | |
| HP ZBook 15 G3 | |
| Dell Precision 5510 | |
| Unigine Valley 1.0 | |
| 1920x1080 Extreme HD DirectX AA:x8 | |
| Lenovo ThinkPad P50 | |
| Lenovo ThinkPad P50 | |
| HP ZBook 15 G3 | |
| Dell Precision 5510 | |
| 1920x1080 Extreme HD Preset OpenGL AA:x8 | |
| HP ZBook 15 G3 | |
| Lenovo ThinkPad P50 | |
| Dell Precision 5510 | |
| Lenovo ThinkPad P50 | |
| 3DMark 06 Standard Score | 26643 pontos | |
| 3DMark 11 Performance | 5444 pontos | |
| 3DMark Ice Storm Standard Score | 91433 pontos | |
| 3DMark Cloud Gate Standard Score | 17219 pontos | |
| 3DMark Fire Strike Score | 3805 pontos | |
Ajuda | ||
| baixo | média | alto | ultra | 4K | |
|---|---|---|---|---|---|
| BioShock Infinite (2013) | 219 | 132.3 | 114.7 | 43.3 | |
| The Witcher 3 (2015) | 76.2 | 47.3 | 26.3 | 13.6 | 9.4 |
| Rise of the Tomb Raider (2016) | 72 | 45 | 25.5 | 21.6 | 9.2 |
Barulho
| Ocioso |
| 30 / 30 / 30 dB |
| Carga |
| 42.1 / 42.1 dB |
 | ||
30 dB silencioso 40 dB(A) audível 50 dB(A) ruidosamente alto |
||
min: | ||
(±) A temperatura máxima no lado superior é 44 °C / 111 F, em comparação com a média de 38.2 °C / 101 F , variando de 22.2 a 69.8 °C para a classe Workstation.
(-) A parte inferior aquece até um máximo de 52.6 °C / 127 F, em comparação com a média de 41.1 °C / 106 F
(+) Em uso inativo, a temperatura média para o lado superior é 31 °C / 88 F, em comparação com a média do dispositivo de 32 °C / ### class_avg_f### F.
(+) Os apoios para as mãos e o touchpad estão atingindo a temperatura máxima da pele (34.2 °C / 93.6 F) e, portanto, não estão quentes.
(-) A temperatura média da área do apoio para as mãos de dispositivos semelhantes foi 27.8 °C / 82 F (-6.4 °C / -11.6 F).
| desligado | |
| Ocioso | |
| Carga |
|
Key:
min: | |
| Lenovo ThinkPad P50 Quadro M2000M, E3-1505M v5, Samsung SM951 MZVPV256HDGL m.2 PCI-e | Lenovo ThinkPad P50 Quadro M2000M, 6820HQ, Samsung SSD PM871 MZNLN256HCHP | HP ZBook 15 G3 Quadro M2000M, E3-1505M v5, Samsung SM951 MZVPV512HDGL m.2 PCI-e | Dell Precision 5510 Quadro M1000M, E3-1505M v5, SK hynix SC920 512 GB | Schenker W505 Quadro K5100M, E3-1231 v3, Samsung SSD 850 EVO M.2 500GB | Lenovo ThinkPad W541 20EF000SGE Quadro K2100M, 4910MQ, Samsung SSD PM851 512 GB MZ7TE512HMHP | |
|---|---|---|---|---|---|---|
| Power Consumption | 29% | 17% | 4% | -140% | -6% | |
| Idle Minimum * (Watt) | 10.2 | 5.6 45% | 5.7 44% | 8.6 16% | 36 -253% | 11.3 -11% |
| Idle Average * (Watt) | 17.8 | 8.6 52% | 12.2 31% | 16.2 9% | 41.2 -131% | 18.5 -4% |
| Idle Maximum * (Watt) | 18.3 | 9.3 49% | 12.6 31% | 16.7 9% | 47.4 -159% | 19.7 -8% |
| Load Average * (Watt) | 76.9 | 89.5 -16% | 83.1 -8% | 82.6 -7% | 126.6 -65% | 84 -9% |
| Load Maximum * (Watt) | 123.5 | 105 15% | 138.2 -12% | 131.8 -7% | 235.8 -91% | 121.9 1% |
* ... menor é melhor
| Lenovo ThinkPad P50 Quadro M2000M, E3-1505M v5, Samsung SM951 MZVPV256HDGL m.2 PCI-e | Lenovo ThinkPad P50 Quadro M2000M, 6820HQ, Samsung SSD PM871 MZNLN256HCHP | HP ZBook 15 G3 Quadro M2000M, E3-1505M v5, Samsung SM951 MZVPV512HDGL m.2 PCI-e | Dell Precision 5510 Quadro M1000M, E3-1505M v5, SK hynix SC920 512 GB | Schenker W505 Quadro K5100M, E3-1231 v3, Samsung SSD 850 EVO M.2 500GB | Lenovo ThinkPad W541 20EF000SGE Quadro K2100M, 4910MQ, Samsung SSD PM851 512 GB MZ7TE512HMHP | |
|---|---|---|---|---|---|---|
| Duração da bateria | 53% | 34% | -12% | -46% | 11% | |
| Reader / Idle (h) | 9 | 14.3 59% | 13.7 52% | 7.1 -21% | 2.5 -72% | 10.8 20% |
| H.264 (h) | 5.5 | 8.9 62% | 7.5 36% | 3.3 -40% | ||
| WiFi v1.3 (h) | 4.8 | 8.3 73% | 6.4 33% | 4.8 0% | 5.7 19% | |
| Load (h) | 1.6 | 1.9 19% | 1.8 13% | 1.8 13% | 1.3 -19% | 1.5 -6% |
| WiFi (h) | 5 |
Pro
Contra
A atualização em análise do ThinkPad P50 é muito interessante, mas isto não facilita a escolha do modelo adequado para os compradores potenciais. Queremos começar com dois aspectos positivos: Os problemas do Turbo Boost, que afetou os resultados do benchmark do nosso modelo Full HD, parece ter sido resolvido. Isto significa que os usuários agora podem utilizar o desempenho pleno o tempo todo. Os alto falantes com distorção também parecem ter sido consertados, porque não conseguimos detectar problemas neste aspecto.
A situação é mais complicada para a tela. A tela Full HD não foi muito impressionante em termos de luminescência e gama de cores, mas o painel 4K também tem seus problemas. A luminescência anunciada de 300 nits está ausente, e PWM é utilizado para o controle do brilho. O contraste também não é muito melhor. O painel 4K não tem uma vantagem evidente em termos de gama de cores, portanto, é a única solução para a edição séria de imagens. No entanto, você deve calibrar a tela. O colorímetro integrado não produz bons resultados para nossa unidade de teste. Outras desvantagens são o bastante alto consumo de energia e, portanto, as durações muito mais curtas da bateria.
As ventoinhas funcionam um pouco mais frequentemente sob uso intenso, e o aparelho esquenta mais, em geral. Você terá que decidir: Se estiver na estrada com frequência, provavelmente irá preferir as longas durações da bateria do modelo Full HD, enquanto outros usuários precisam da gama mais ampla. Infelizmente, o painel 4K – apesar da tela FHD um pouco mais escura – não é a melhor opção para todo os usuários. Por causa das desvantagens mencionadas, a unidade de teste 4K também recebe uma pontuação um pouco baixa de 84%.
Esta é uma versão reduzida da análise original. Você pode ler a análise completa em inglês aqui.
Lenovo ThinkPad P50
- 07/05/2016 v5.1 (old)
Andreas Osthoff
Price comparison
