Breve Análise do Workstation Lenovo ThinkPad P1 (Xeon E-2176M, Quadro P2000 Max-Q)
| SD Card Reader | |
| average JPG Copy Test (av. of 3 runs) | |
| Lenovo ThinkPad X1 Carbon 2018-20KGS03900 (Toshiba Exceria Pro M501) | |
| Lenovo ThinkPad X1 Extreme-20MF000XGE (Toshiba Exceria Pro SDXC 64 GB UHS-II) | |
| Lenovo ThinkPad P1-20MD002LUS (Toshiba Exceria Pro SDXC 64 GB UHS-II) | |
| Dell Precision 5530 Xeon E-2176M (Toshiba Exceria Pro SDXC 64 GB UHS-II) | |
| HP EliteBook 1050 G1-4QY20EA (Toshiba Exceria Pro SDXC 64 GB UHS-II) | |
| Média da turma Workstation (49.6 - 681, n=14, últimos 2 anos) | |
| maximum AS SSD Seq Read Test (1GB) | |
| Lenovo ThinkPad X1 Extreme-20MF000XGE (Toshiba Exceria Pro SDXC 64 GB UHS-II) | |
| Lenovo ThinkPad P1-20MD002LUS (Toshiba Exceria Pro SDXC 64 GB UHS-II) | |
| Lenovo ThinkPad X1 Carbon 2018-20KGS03900 (Toshiba Exceria Pro M501) | |
| Média da turma Workstation (87.6 - 1455, n=14, últimos 2 anos) | |
| HP EliteBook 1050 G1-4QY20EA (Toshiba Exceria Pro SDXC 64 GB UHS-II) | |
| Dell Precision 5530 Xeon E-2176M (Toshiba Exceria Pro SDXC 64 GB UHS-II) | |
| |||||||||||||||||||||||||
iluminação: 85 %
iluminação com acumulador: 397.6 cd/m²
Contraste: 1590:1 (Preto: 0.25 cd/m²)
ΔE ColorChecker Calman: 4.95 | ∀{0.5-29.43 Ø4.71}
calibrated: 4.22
ΔE Greyscale Calman: 5.1 | ∀{0.09-98 Ø4.96}
100% sRGB (Argyll 1.6.3 3D)
87.6% AdobeRGB 1998 (Argyll 1.6.3 3D)
99.1% AdobeRGB 1998 (Argyll 3D)
99.9% sRGB (Argyll 3D)
86.4% Display P3 (Argyll 3D)
Gamma: 2.234
CCT: 7543 K
| Lenovo ThinkPad P1-20MD002LUS B156ZAN03.2, IPS, 15.6", 3840x2160 | Lenovo ThinkPad X1 Extreme-20MF000XGE B156ZAN03.2, IPS, 15.6", 3840x2160 | Dell Precision 5530 Xeon E-2176M Sharp SHP148D / LQ156D1, IGZO, 15.6", 3840x2160 | HP EliteBook 1050 G1-4QY20EA AUO30EB, IPS LED, 15.6", 3840x2160 | Apple MacBook Pro 15 2018 (2.6 GHz, 560X) APPA040, IPS, 15.4", 2880x1800 | |
|---|---|---|---|---|---|
| Display | 0% | -12% | -20% | 0% | |
| Display P3 Coverage (%) | 86.4 | 86.3 0% | 76.5 -11% | 67.8 -22% | 98.7 14% |
| sRGB Coverage (%) | 99.9 | 100 0% | 98.4 -2% | 94.1 -6% | 99.9 0% |
| AdobeRGB 1998 Coverage (%) | 99.1 | 99.4 0% | 76.4 -23% | 67.9 -31% | 86.6 -13% |
| Response Times | -8% | 3% | 3% | 11% | |
| Response Time Grey 50% / Grey 80% * (ms) | 55.6 ? | 61.6 ? -11% | 48 ? 14% | 56 ? -1% | 43.2 ? 22% |
| Response Time Black / White * (ms) | 30.8 ? | 32 ? -4% | 33.6 ? -9% | 29 ? 6% | 31.2 ? -1% |
| PWM Frequency (Hz) | 1000 | 117000 ? | |||
| Screen | 8% | 2% | 0% | 27% | |
| Brightness middle (cd/m²) | 397.6 | 396 0% | 451.7 14% | 440 11% | 520 31% |
| Brightness (cd/m²) | 396 | 380 -4% | 440 11% | 389 -2% | 492 24% |
| Brightness Distribution (%) | 85 | 90 6% | 90 6% | 83 -2% | 88 4% |
| Black Level * (cd/m²) | 0.25 | 0.28 -12% | 0.4 -60% | 0.34 -36% | 0.39 -56% |
| Contrast (:1) | 1590 | 1414 -11% | 1129 -29% | 1294 -19% | 1333 -16% |
| Colorchecker dE 2000 * | 4.95 | 4 19% | 3.11 37% | 5.04 -2% | 1.2 76% |
| Colorchecker dE 2000 max. * | 10.23 | 7.6 26% | 8.62 16% | 6.99 32% | 2.3 78% |
| Colorchecker dE 2000 calibrated * | 4.22 | 0.9 79% | 3.07 27% | 2.04 52% | |
| Greyscale dE 2000 * | 5.1 | 6.1 -20% | 3.7 27% | 4.98 2% | 1.3 75% |
| Gamma | 2.234 98% | 2.25 98% | 2.11 104% | 2.48 89% | 2.18 101% |
| CCT | 7543 86% | 7786 83% | 6492 100% | 7777 84% | 6738 96% |
| Color Space (Percent of AdobeRGB 1998) (%) | 87.6 | 88.5 1% | 69 -21% | 61 -30% | |
| Color Space (Percent of sRGB) (%) | 100 | 100 0% | 98 -2% | 94 -6% | |
| Média Total (Programa/Configurações) | 0% /
4% | -2% /
-0% | -6% /
-3% | 13% /
18% |
* ... menor é melhor
Exibir tempos de resposta
| ↔ Tempo de resposta preto para branco | ||
|---|---|---|
| 30.8 ms ... ascensão ↗ e queda ↘ combinadas | ↗ 16.4 ms ascensão | 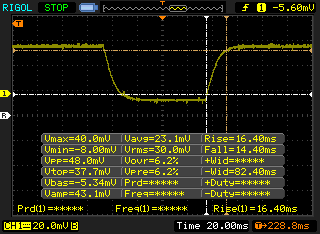 |
| ↘ 14.4 ms queda | ||
| A tela mostra taxas de resposta lentas em nossos testes e será insatisfatória para os jogadores. Em comparação, todos os dispositivos testados variam de 0.1 (mínimo) a 240 (máximo) ms. » 83 % de todos os dispositivos são melhores. Isso significa que o tempo de resposta medido é pior que a média de todos os dispositivos testados (19.8 ms). | ||
| ↔ Tempo de resposta 50% cinza a 80% cinza | ||
| 55.6 ms ... ascensão ↗ e queda ↘ combinadas | ↗ 38 ms ascensão | 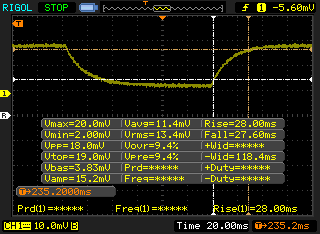 |
| ↘ 37.6 ms queda | ||
| A tela mostra taxas de resposta lentas em nossos testes e será insatisfatória para os jogadores. Em comparação, todos os dispositivos testados variam de 0.165 (mínimo) a 636 (máximo) ms. » 92 % de todos os dispositivos são melhores. Isso significa que o tempo de resposta medido é pior que a média de todos os dispositivos testados (31 ms). | ||
Cintilação da tela / PWM (modulação por largura de pulso)
| Tela tremeluzindo / PWM não detectado |  | ||
[pwm_comparison] Em comparação: 52 % de todos os dispositivos testados não usam PWM para escurecer a tela. Se PWM foi detectado, uma média de 7757 (mínimo: 5 - máximo: 343500) Hz foi medida. | |||
| PCMark 8 Home Score Accelerated v2 | 3536 pontos | |
| PCMark 8 Creative Score Accelerated v2 | 4832 pontos | |
| PCMark 8 Work Score Accelerated v2 | 4404 pontos | |
| PCMark 10 Score | 4618 pontos | |
Ajuda | ||
| Lenovo ThinkPad P1-20MD002LUS Samsung SSD PM981 MZVLB2T0HMLB | Lenovo ThinkPad X1 Extreme-20MF000XGE Samsung SSD PM981 MZVLB1T0HALR | Dell Precision 5530 Xeon E-2176M SK hynix PC400 512 GB | HP EliteBook 1050 G1-4QY20EA Toshiba XG5-P KXG50PNV2T04 | Apple MacBook Pro 15 2018 (2.6 GHz, 560X) Apple SSD AP0512 | Média Samsung SSD PM981 MZVLB2T0HMLB | |
|---|---|---|---|---|---|---|
| AS SSD | 19% | -37% | -38% | -97% | 4% | |
| Score Total (Points) | 4784 | 5355 12% | 2922 -39% | 2768 -42% | 2119 -56% | 4881 ? 2% |
| Score Write (Points) | 2200 | 2147 -2% | 1121 -49% | 1153 -48% | 347 -84% | 2139 ? -3% |
| Score Read (Points) | 1722 | 2132 24% | 1226 -29% | 1120 -35% | 1199 -30% | 1828 ? 6% |
| Access Time Write * (ms) | 0.032 | 0.028 12% | 0.053 -66% | 0.056 -75% | 0.0295 ? 8% | |
| Access Time Read * (ms) | 0.038 | 0.034 11% | 0.073 -92% | 0.051 -34% | 0.225 -492% | 0.0485 ? -28% |
| 4K-64 Write (MB/s) | 1866 | 1782 -5% | 926 -50% | 953 -49% | 163.5 -91% | 1789 ? -4% |
| 4K-64 Read (MB/s) | 1450 | 1805 24% | 970 -33% | 856 -41% | 965 -33% | 1527 ? 5% |
| 4K Write (MB/s) | 118.4 | 130.9 11% | 92.8 -22% | 105.4 -11% | 18.78 -84% | 128.8 ? 9% |
| 4K Read (MB/s) | 28.61 | 56.8 99% | 38.43 34% | 19.07 -33% | 9.46 -67% | 39.1 ? 37% |
| Seq Write (MB/s) | 2155 | 2336 8% | 1022 -53% | 948 -56% | 1644 -24% | 2217 ? 3% |
| Seq Read (MB/s) | 2440 | 2703 11% | 2169 -11% | 2454 1% | 2239 -8% | 2628 ? 8% |
* ... menor é melhor

| 3DMark 06 Standard Score | 31482 pontos | |
| 3DMark Vantage P Result | 32724 pontos | |
| 3DMark 11 Performance | 8363 pontos | |
| 3DMark Ice Storm Standard Score | 23769 pontos | |
| 3DMark Cloud Gate Standard Score | 14996 pontos | |
| 3DMark Fire Strike Score | 5958 pontos | |
| 3DMark Fire Strike Extreme Score | 3104 pontos | |
| 3DMark Time Spy Score | 2206 pontos | |
Ajuda | ||
| SPECviewperf 13 | |
| Solidworks (sw-04) | |
| Lenovo ThinkPad P52 20MAS03N00 | |
| Lenovo ThinkPad P1-20MD002LUS | |
| Siemens NX (snx-03) | |
| Lenovo ThinkPad P52 20MAS03N00 | |
| Lenovo ThinkPad P1-20MD002LUS | |
| Showcase (showcase-02) | |
| Lenovo ThinkPad P1-20MD002LUS | |
| Lenovo ThinkPad P52 20MAS03N00 | |
| Medical (medical-02) | |
| Lenovo ThinkPad P1-20MD002LUS | |
| Lenovo ThinkPad P52 20MAS03N00 | |
| Maya (maya-05) | |
| Lenovo ThinkPad P1-20MD002LUS | |
| Lenovo ThinkPad P52 20MAS03N00 | |
| Energy (energy-02) | |
| Lenovo ThinkPad P1-20MD002LUS | |
| Lenovo ThinkPad P52 20MAS03N00 | |
| Creo (creo-02) | |
| Lenovo ThinkPad P1-20MD002LUS | |
| Lenovo ThinkPad P52 20MAS03N00 | |
| Catia (catia-05) | |
| Lenovo ThinkPad P1-20MD002LUS | |
| Lenovo ThinkPad P52 20MAS03N00 | |
| 3ds Max (3dsmax-06) | |
| Lenovo ThinkPad P1-20MD002LUS | |
| Lenovo ThinkPad P52 20MAS03N00 | |
| baixo | média | alto | ultra | 4K | |
|---|---|---|---|---|---|
| Sleeping Dogs (2012) | 197 | 135 | 133 | 46 | |
| BioShock Infinite (2013) | 264 | 192 | 168 | 65 | |
| Metro: Last Light (2013) | 122 | 111 | 84 | 46 | |
| GRID 2 (2013) | 194 | 132 | 117 | 85 | |
| Company of Heroes 2 (2013) | 72 | 65 | 54 | 27 | |
| Total War: Rome II (2013) | 241 | 177 | 142 | 21 | |
| Thief (2014) | 57 | 54 | 51 | 44 | |
| Dirt Rally (2015) | 234 | 131 | 88 | 73 | 49 |
| The Witcher 3 (2015) | 106 | 73 | 32 | 25 | 12 |
| Batman: Arkham Knight (2015) | 100 | 92 | 59 | 58 | 17 |
| Metal Gear Solid V (2015) | 60 | 60 | 60 | 60 | 28 |
| Rise of the Tomb Raider (2016) | 44 | 40 | 36 | 32 | 15 |
| Ashes of the Singularity (2016) | 54.5 | 39.6 | 34.9 | 13 | |
| Doom (2016) | 103 | 104 | 63 | 61 | 20 |
| Deus Ex Mankind Divided (2016) | 70 | 53 | 31 | 16 | 10 |
| Prey (2017) | 140 | 111 | 109 | 109 | 36 |
| Middle-earth: Shadow of War (2017) | 67 | 49 | 38 | 29 | 13 |
| F1 2018 (2018) | 118 | 72 | 72 | 40 | 24 |
| Shadow of the Tomb Raider (2018) | 79 | 33 | 30 | 23 | 3 |
| Shadow of the Tomb Raider | |
| 1280x720 Lowest Preset | |
| Lenovo ThinkPad X1 Extreme-20MF000XGE | |
| Apple MacBook Pro 15 2018 (2.6 GHz, 560X) | |
| Lenovo ThinkPad P1-20MD002LUS | |
| 1920x1080 Medium Preset | |
| Lenovo ThinkPad X1 Extreme-20MF000XGE | |
| Lenovo ThinkPad P1-20MD002LUS | |
| Apple MacBook Pro 15 2018 (2.6 GHz, 560X) | |
| 1920x1080 High Preset AA:SM | |
| Lenovo ThinkPad X1 Extreme-20MF000XGE | |
| Lenovo ThinkPad P1-20MD002LUS | |
| Apple MacBook Pro 15 2018 (2.6 GHz, 560X) | |
| 1920x1080 Highest Preset AA:T | |
| Lenovo ThinkPad X1 Extreme-20MF000XGE | |
| Apple MacBook Pro 15 2018 (2.6 GHz, 560X) | |
| Lenovo ThinkPad P1-20MD002LUS | |
| 3840x2160 Highest Preset AA:T | |
| Lenovo ThinkPad X1 Extreme-20MF000XGE | |
| Apple MacBook Pro 15 2018 (2.6 GHz, 560X) | |
| Lenovo ThinkPad P1-20MD002LUS | |
| Batman: Arkham Knight | |
| 1280x720 Low / Off AF:Trilinear | |
| Dell Precision 5530 Xeon E-2176M | |
| Lenovo ThinkPad P1-20MD002LUS | |
| 1366x768 Normal / Off AF:4x | |
| Dell Precision 5530 Xeon E-2176M | |
| Lenovo ThinkPad P1-20MD002LUS | |
| 1920x1080 High / On (Interactive Smoke & Paper Debris Off) AA:SM AF:8x | |
| MSI WS63 7RF-290US | |
| Lenovo ThinkPad P1-20MD002LUS | |
| Dell Precision 5530 Xeon E-2176M | |
| 1920x1080 High / On AA:SM AF:16x | |
| Eurocom Tornado F5W | |
| Lenovo ThinkPad P1-20MD002LUS | |
| MSI WS63 7RF-290US | |
| Dell Precision 5530 Xeon E-2176M | |
| 3840x2160 High / On (Interactive Smoke & Paper Debris Off) AA:SM AF:8x | |
| Dell Precision 5530 Xeon E-2176M | |
| Lenovo ThinkPad P1-20MD002LUS | |
| Prey | |
| 1280x720 Low Preset AF:2x | |
| Lenovo ThinkPad P1-20MD002LUS | |
| Dell Precision 5530 Xeon E-2176M | |
| 1366x768 Medium Preset AA:FX AF:4x | |
| Dell Precision 5530 Xeon E-2176M | |
| 1920x1080 High Preset AA:2TX SM AF:8x | |
| Lenovo ThinkPad P1-20MD002LUS | |
| Dell Precision 5530 Xeon E-2176M | |
| 1920x1080 Very High Preset AA:2TX SM AF:16x | |
| Lenovo ThinkPad P1-20MD002LUS | |
| MSI WS63 7RF-290US | |
| Dell Precision 5530 Xeon E-2176M | |
| 3840x2160 High Preset AA:2TX SM AF:8x | |
| Lenovo ThinkPad P1-20MD002LUS | |
| Dell Precision 5530 Xeon E-2176M | |
Barulho
| Ocioso |
| 28.4 / 28.4 / 29.2 dB |
| Carga |
| 41.8 / 41.8 dB |
 | ||
30 dB silencioso 40 dB(A) audível 50 dB(A) ruidosamente alto |
||
min: | ||
| Lenovo ThinkPad P1-20MD002LUS Quadro P2000 Max-Q, E-2176M, Samsung SSD PM981 MZVLB2T0HMLB | Lenovo ThinkPad X1 Extreme-20MF000XGE GeForce GTX 1050 Ti Max-Q, i7-8750H, Samsung SSD PM981 MZVLB1T0HALR | Dell Precision 5530 Xeon E-2176M Quadro P2000, E-2176M, SK hynix PC400 512 GB | HP EliteBook 1050 G1-4QY20EA GeForce GTX 1050 Max-Q, i7-8750H, Toshiba XG5-P KXG50PNV2T04 | Lenovo ThinkPad X1 Carbon 2018-20KGS03900 UHD Graphics 620, i5-8550U, Samsung SSD PM981 MZVLB512HAJQ | Apple MacBook Pro 15 2018 (2.6 GHz, 560X) Radeon Pro 560X, i7-8850H, Apple SSD AP0512 | |
|---|---|---|---|---|---|---|
| Noise | 2% | -5% | -6% | 3% | -5% | |
| desligado / ambiente * (dB) | 28.3 | 28.8 -2% | 28.4 -0% | 30.25 -7% | 28.9 -2% | 29.6 -5% |
| Idle Minimum * (dB) | 28.4 | 28.8 -1% | 28.4 -0% | 30.25 -7% | 28.9 -2% | 30.1 -6% |
| Idle Average * (dB) | 28.4 | 28.8 -1% | 28.4 -0% | 30.25 -7% | 28.9 -2% | 30.1 -6% |
| Idle Maximum * (dB) | 29.2 | 31.3 -7% | 28.4 3% | 31.8 -9% | 32.5 -11% | 30.1 -3% |
| Load Average * (dB) | 41.8 | 36.4 13% | 46.5 -11% | 44.7 -7% | 35.1 16% | 46.8 -12% |
| Witcher 3 ultra * (dB) | 39.1 | 36.4 7% | 46.5 -19% | 36 8% | ||
| Load Maximum * (dB) | 41.8 | 39.2 6% | 46.5 -11% | 42 -0% | 35.1 16% | 46.8 -12% |
* ... menor é melhor
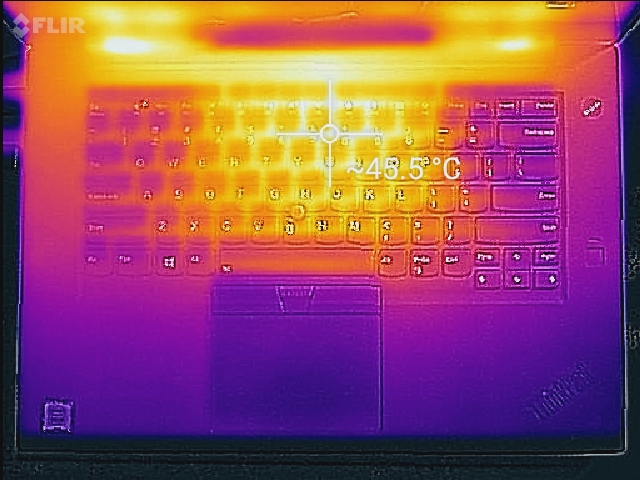
(±) A temperatura máxima no lado superior é 43.4 °C / 110 F, em comparação com a média de 38.2 °C / 101 F , variando de 22.2 a 69.8 °C para a classe Workstation.
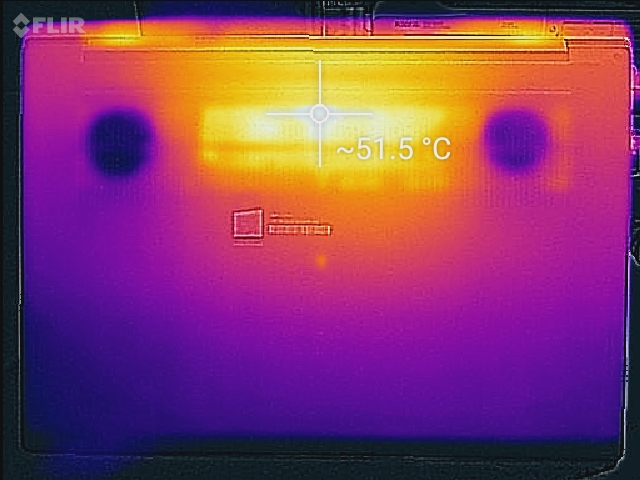
(-) A parte inferior aquece até um máximo de 50 °C / 122 F, em comparação com a média de 41.1 °C / 106 F
(+) Em uso inativo, a temperatura média para o lado superior é 24.8 °C / 77 F, em comparação com a média do dispositivo de 32 °C / ### class_avg_f### F.
(±) Jogando The Witcher 3, a temperatura média para o lado superior é 33.9 °C / 93 F, em comparação com a média do dispositivo de 32 °C / ## #class_avg_f### F.
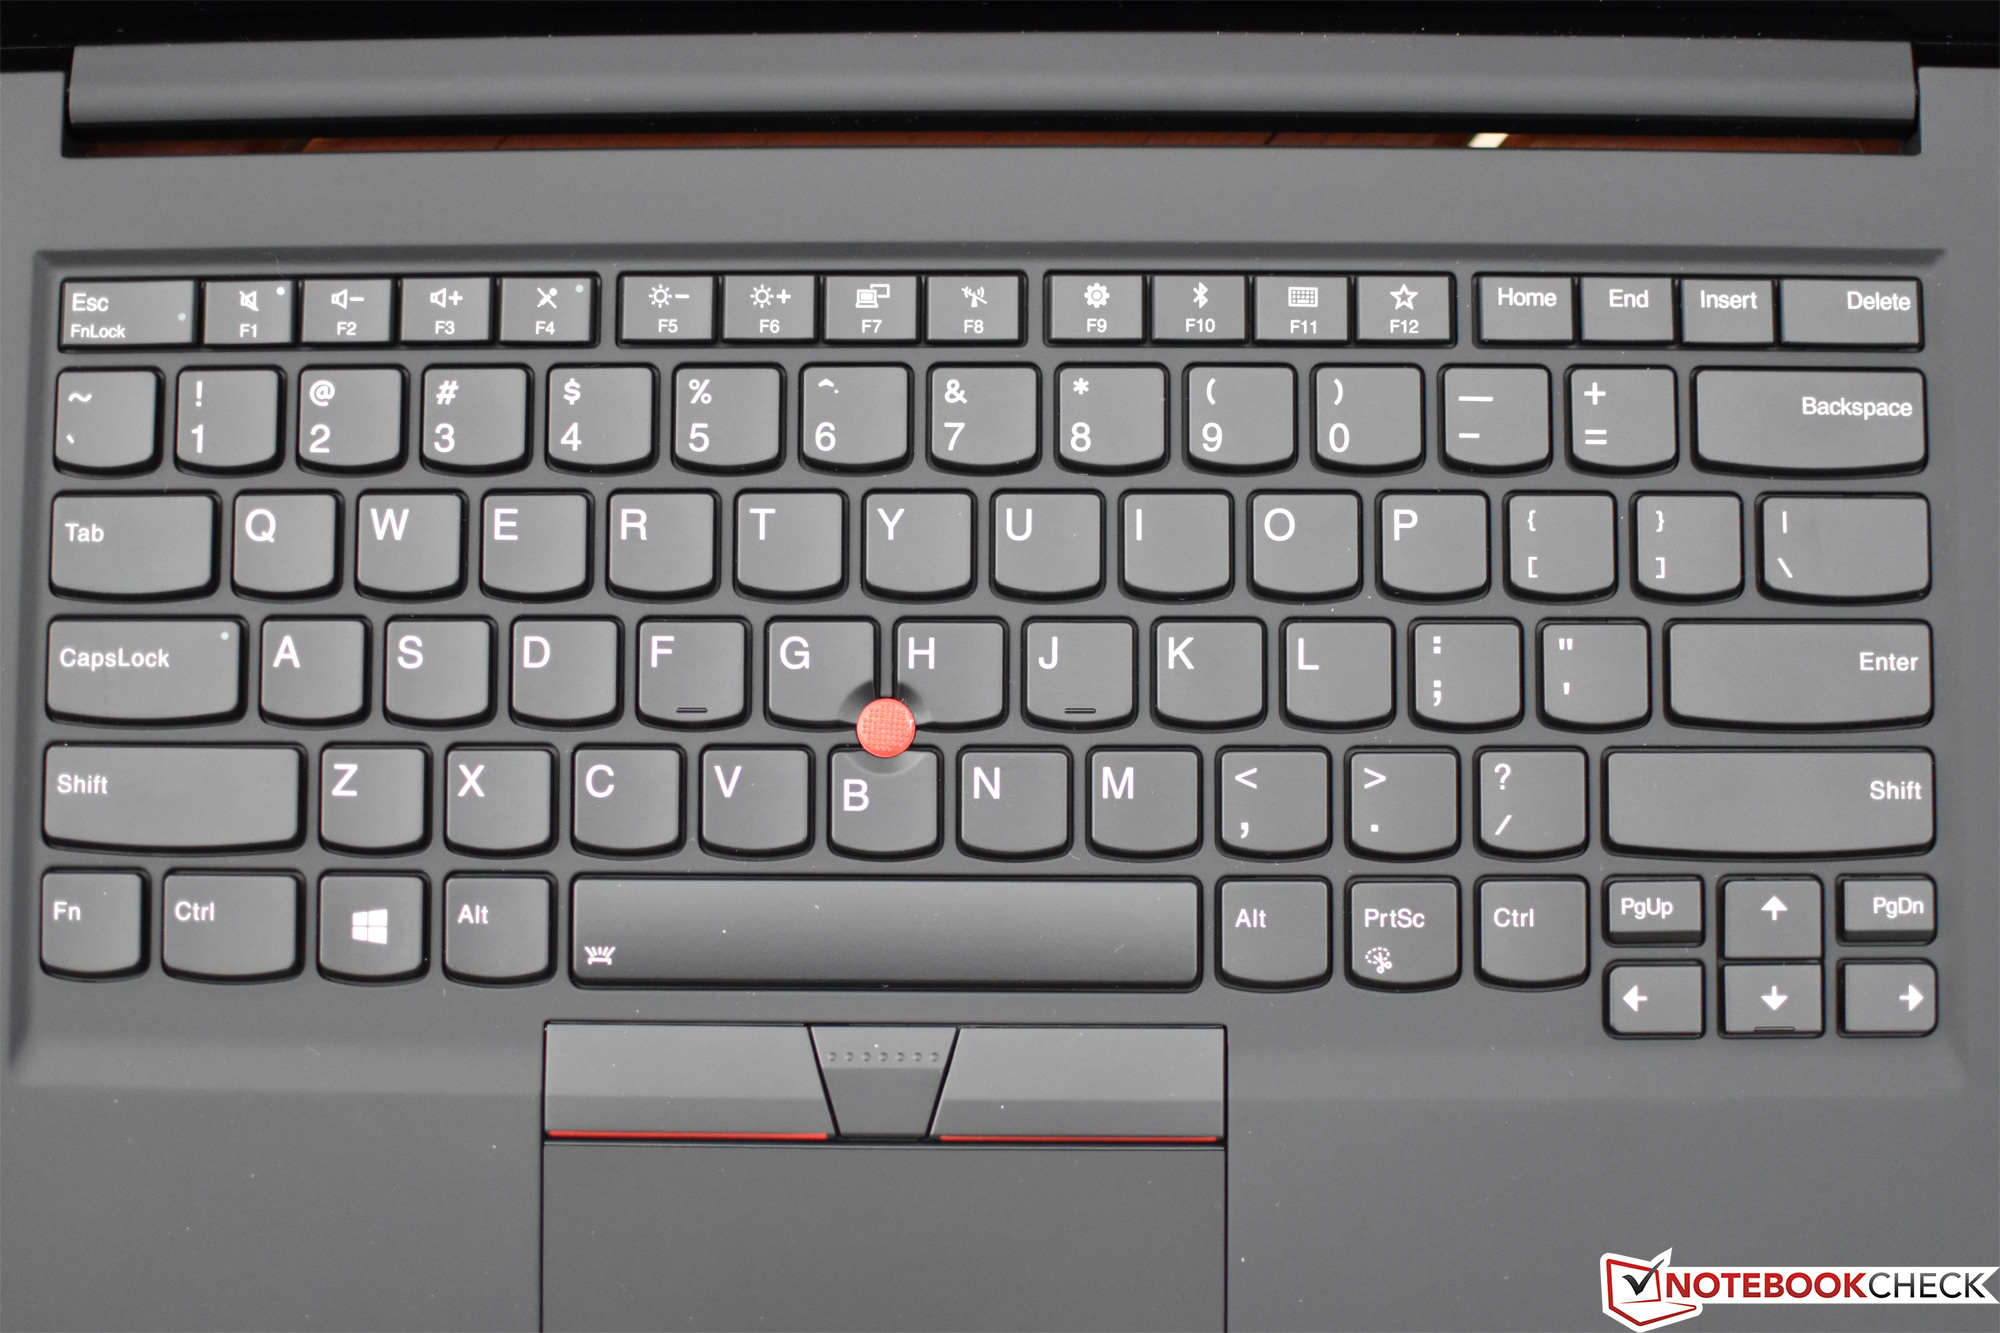
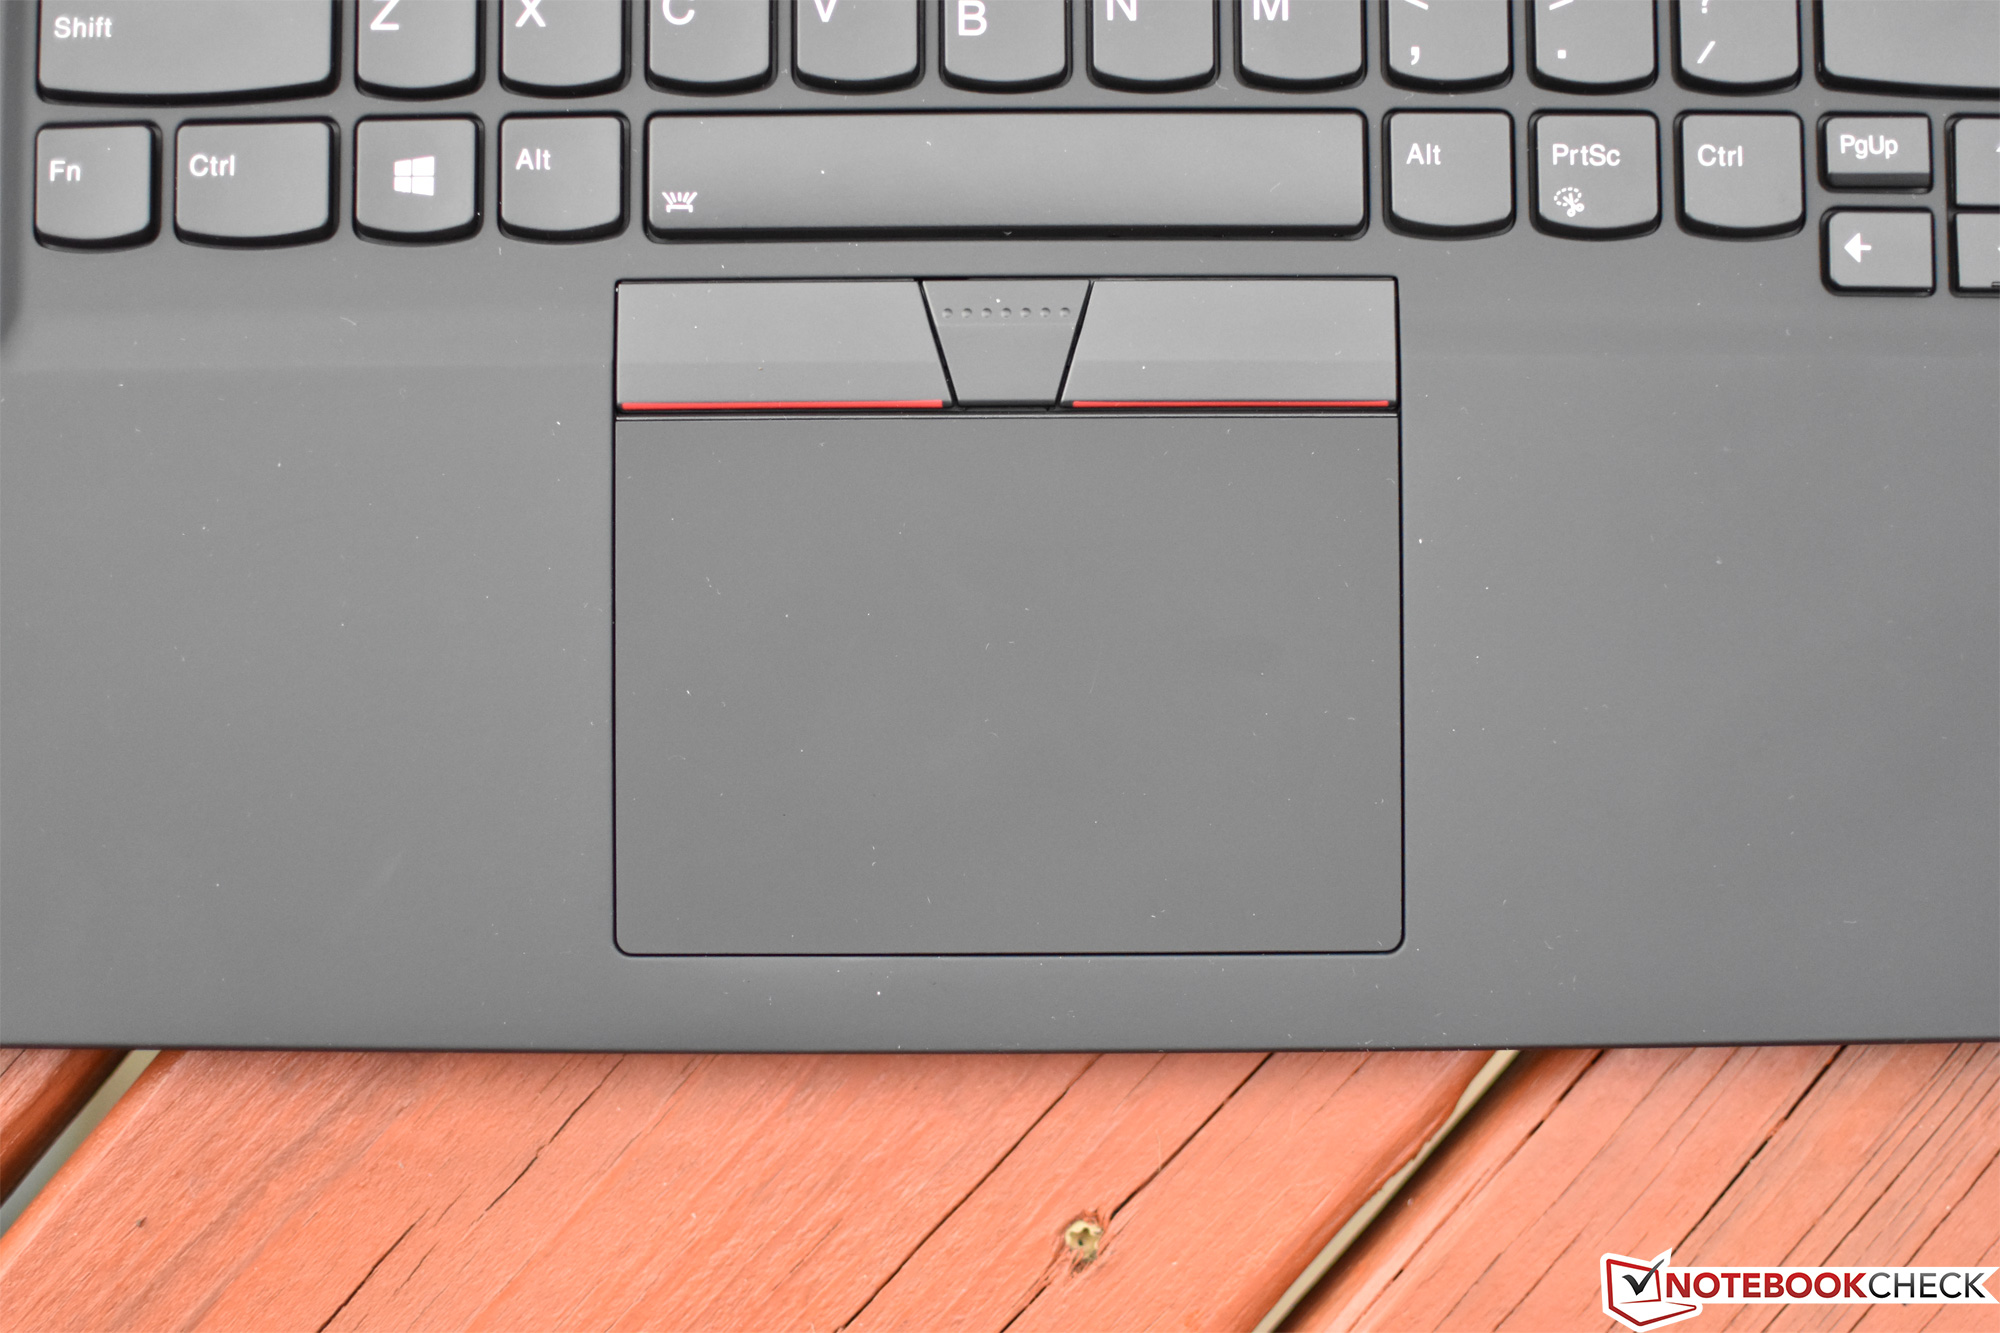
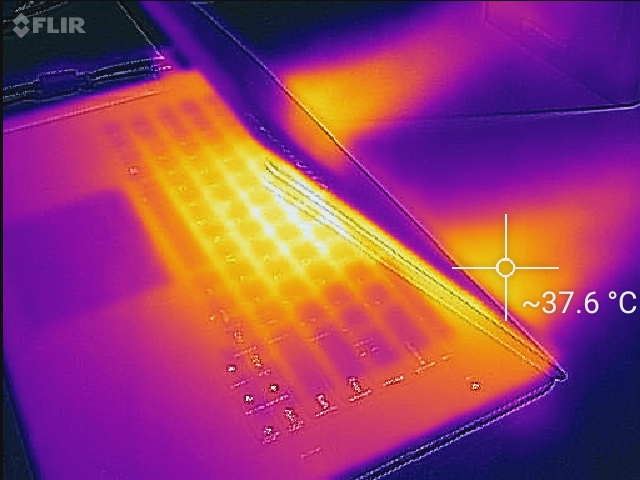
(+) Os apoios para as mãos e o touchpad são mais frios que a temperatura da pele, com um máximo de 28.8 °C / 83.8 F e, portanto, são frios ao toque.
(±) A temperatura média da área do apoio para as mãos de dispositivos semelhantes foi 27.8 °C / 82 F (-1 °C / -1.8 F).
Lenovo ThinkPad P1-20MD002LUS análise de áudio
(±) | o volume do alto-falante é médio, mas bom (###valor### dB)
Graves 100 - 315Hz
(±) | graves reduzidos - em média 10.1% menor que a mediana
(±) | a linearidade dos graves é média (12.3% delta para a frequência anterior)
Médios 400 - 2.000 Hz
(±) | médios mais altos - em média 5.9% maior que a mediana
(±) | a linearidade dos médios é média (8.9% delta para frequência anterior)
Altos 2 - 16 kHz
(+) | agudos equilibrados - apenas 2% longe da mediana
(+) | os máximos são lineares (5.1% delta da frequência anterior)
Geral 100 - 16.000 Hz
(±) | a linearidade do som geral é média (21.8% diferença em relação à mediana)
Comparado com a mesma classe
» 77% de todos os dispositivos testados nesta classe foram melhores, 6% semelhantes, 17% piores
» O melhor teve um delta de 7%, a média foi 17%, o pior foi 35%
Comparado com todos os dispositivos testados
» 62% de todos os dispositivos testados foram melhores, 7% semelhantes, 31% piores
» O melhor teve um delta de 4%, a média foi 23%, o pior foi 134%
Apple MacBook Pro 15 2018 (2.6 GHz, 560X) análise de áudio
(+) | os alto-falantes podem tocar relativamente alto (###valor### dB)
Graves 100 - 315Hz
(+) | bons graves - apenas 4.7% longe da mediana
(±) | a linearidade dos graves é média (8.3% delta para a frequência anterior)
Médios 400 - 2.000 Hz
(+) | médios equilibrados - apenas 1.8% longe da mediana
(+) | médios são lineares (3.5% delta para frequência anterior)
Altos 2 - 16 kHz
(+) | agudos equilibrados - apenas 2.6% longe da mediana
(+) | os máximos são lineares (5.7% delta da frequência anterior)
Geral 100 - 16.000 Hz
(+) | o som geral é linear (6.4% diferença em relação à mediana)
Comparado com a mesma classe
» 4% de todos os dispositivos testados nesta classe foram melhores, 1% semelhantes, 95% piores
» O melhor teve um delta de 5%, a média foi 17%, o pior foi 45%
Comparado com todos os dispositivos testados
» 1% de todos os dispositivos testados foram melhores, 0% semelhantes, 99% piores
» O melhor teve um delta de 4%, a média foi 23%, o pior foi 134%
| desligado | |
| Ocioso | |
| Carga |
|
Key:
min: | |
| Lenovo ThinkPad P1-20MD002LUS E-2176M, Quadro P2000 Max-Q, Samsung SSD PM981 MZVLB2T0HMLB, IPS, 3840x2160, 15.6" | Lenovo ThinkPad X1 Extreme-20MF000XGE i7-8750H, GeForce GTX 1050 Ti Max-Q, Samsung SSD PM981 MZVLB1T0HALR, IPS, 3840x2160, 15.6" | Dell Precision 5530 Xeon E-2176M E-2176M, Quadro P2000, SK hynix PC400 512 GB, IGZO, 3840x2160, 15.6" | HP EliteBook 1050 G1-4QY20EA i7-8750H, GeForce GTX 1050 Max-Q, Toshiba XG5-P KXG50PNV2T04, IPS LED, 3840x2160, 15.6" | Apple MacBook Pro 15 2018 (2.6 GHz, 560X) i7-8850H, Radeon Pro 560X, Apple SSD AP0512, IPS, 2880x1800, 15.4" | |
|---|---|---|---|---|---|
| Power Consumption | -11% | -18% | 5% | 17% | |
| Idle Minimum * (Watt) | 7.1 | 7.6 -7% | 9.8 -38% | 6.1 14% | 3.4 52% |
| Idle Average * (Watt) | 14.4 | 14.8 -3% | 16.8 -17% | 10.2 29% | 11 24% |
| Idle Maximum * (Watt) | 14.6 | 17.6 -21% | 16.9 -16% | 13.4 8% | 14.9 -2% |
| Load Average * (Watt) | 93.9 | 86 8% | 102.3 -9% | 82 13% | 78.9 16% |
| Witcher 3 ultra * (Watt) | 77.9 | 85 -9% | 76.5 2% | ||
| Load Maximum * (Watt) | 88.3 | 118.9 -35% | 114.5 -30% | 122 -38% | 91.2 -3% |
* ... menor é melhor
| Lenovo ThinkPad P1-20MD002LUS E-2176M, Quadro P2000 Max-Q, 80 Wh | Lenovo ThinkPad X1 Extreme-20MF000XGE i7-8750H, GeForce GTX 1050 Ti Max-Q, 80 Wh | Dell Precision 5530 Xeon E-2176M E-2176M, Quadro P2000, 97 Wh | HP EliteBook 1050 G1-4QY20EA i7-8750H, GeForce GTX 1050 Max-Q, 96 Wh | Lenovo ThinkPad X1 Carbon 2018-20KGS03900 i5-8550U, UHD Graphics 620, 57 Wh | Apple MacBook Pro 15 2018 (2.6 GHz, 560X) i7-8850H, Radeon Pro 560X, 83 Wh | |
|---|---|---|---|---|---|---|
| Duração da bateria | 21% | 58% | 64% | 64% | 92% | |
| WiFi v1.3 (h) | 5.3 | 6.4 21% | 8.4 58% | 8.7 64% | 8.7 64% | 10.2 92% |
| Reader / Idle (h) | 11.5 | 16.5 | 17.1 | 22.1 | ||
| Witcher 3 ultra (h) | 1.1 | 1.5 | ||||
| Load (h) | 2 | 1.8 | 2.1 | 1.8 |
Pro
Contra
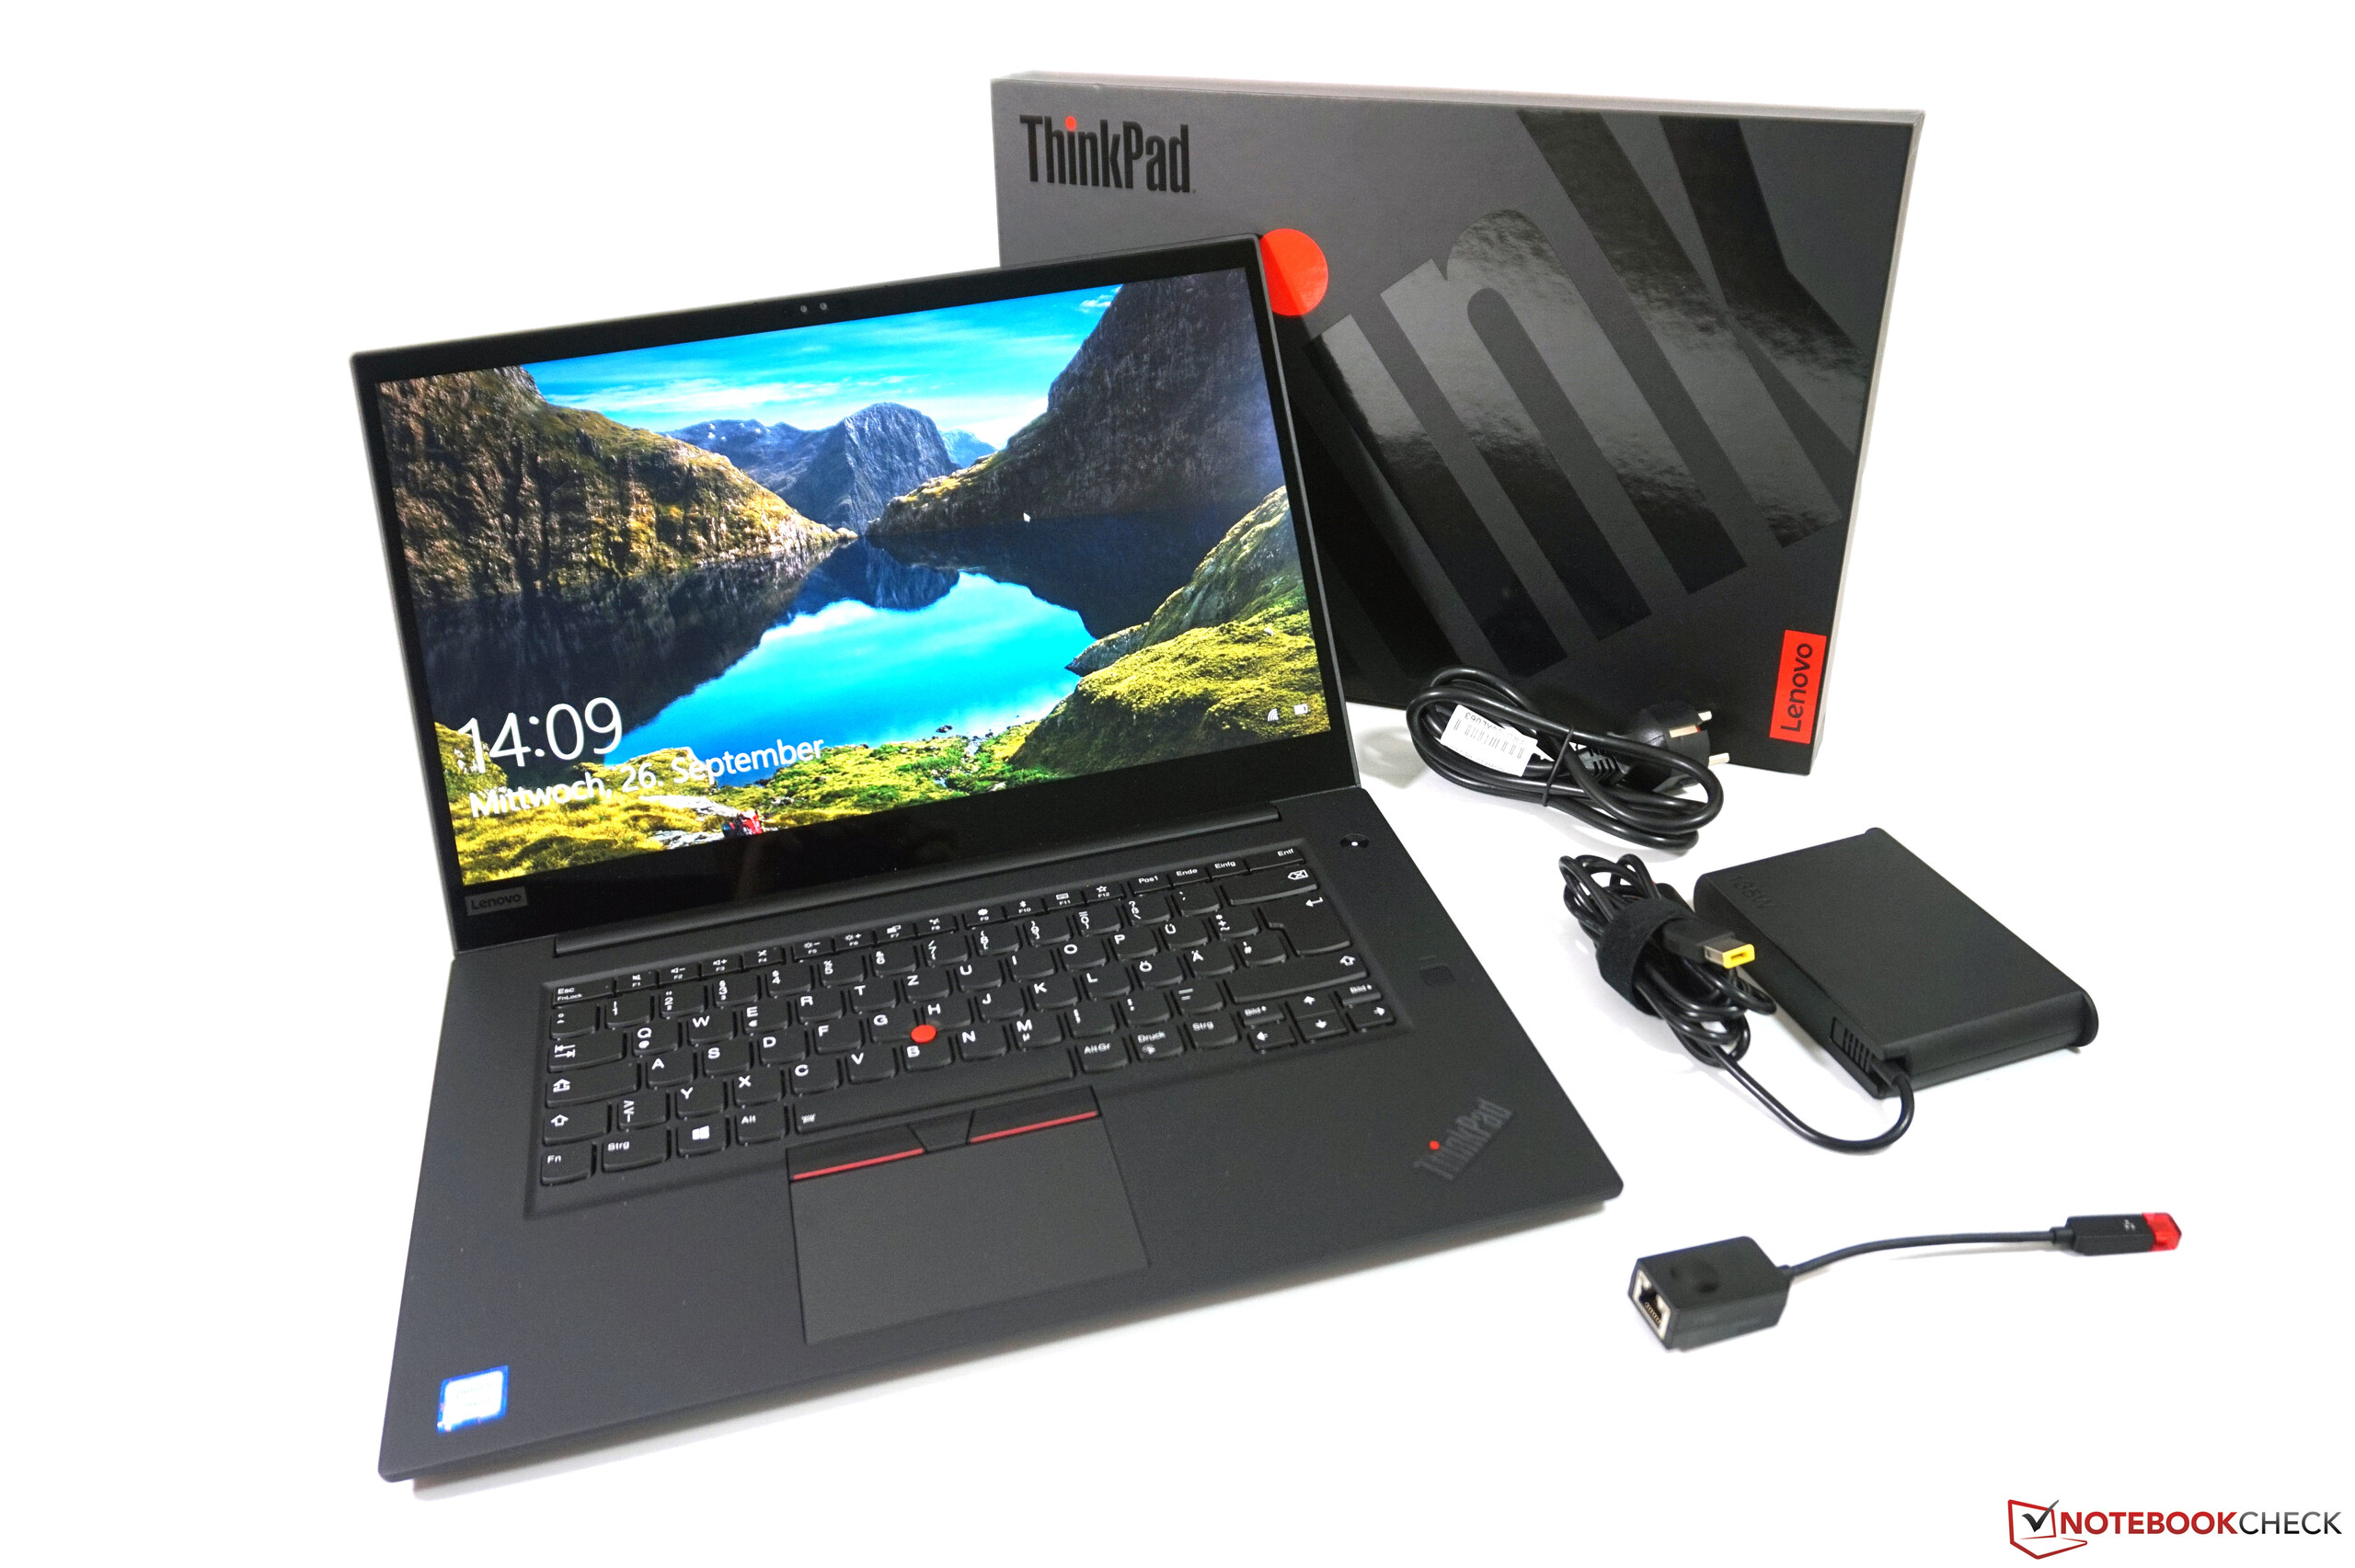
Juntamente com a crescente popularidade de máquinas de jogos leves, workstations finos e leves (na veia do Dell Precision 5530) também criaram um segmento do mercado para eles mesmos, e o ThinkPad P1 da Lenovo representa um forte acréscimo a essa linha em formação.
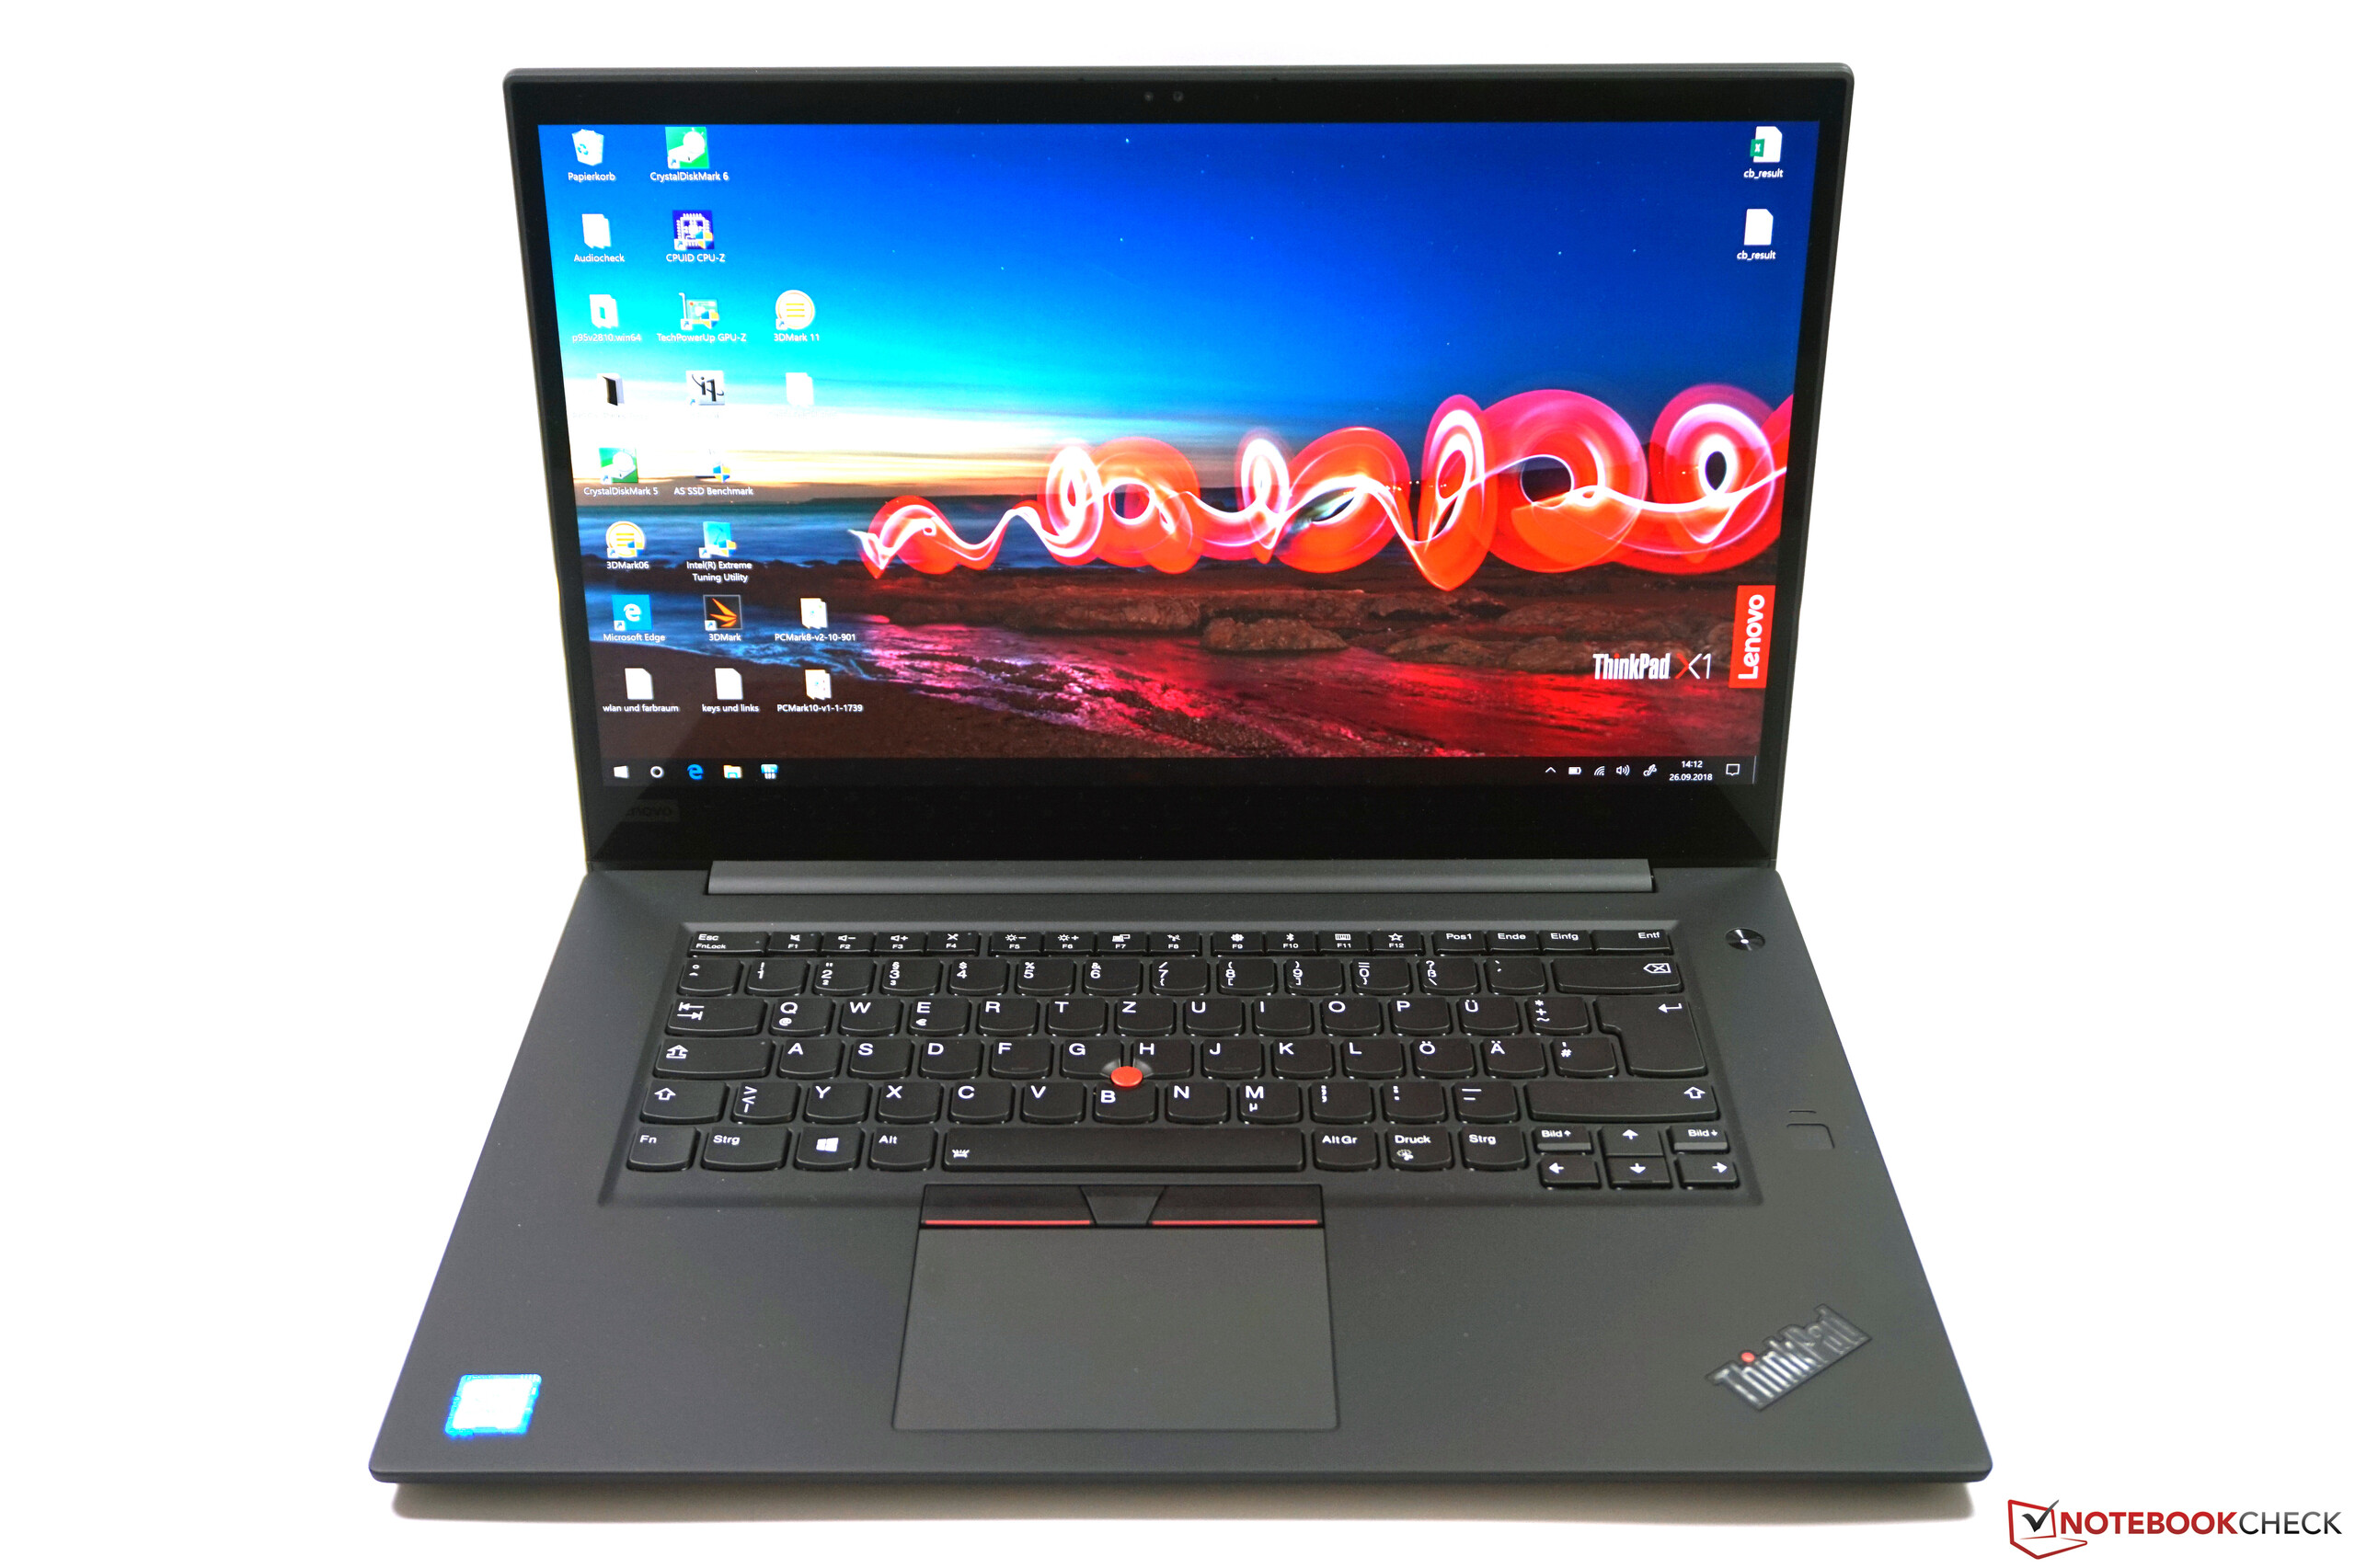
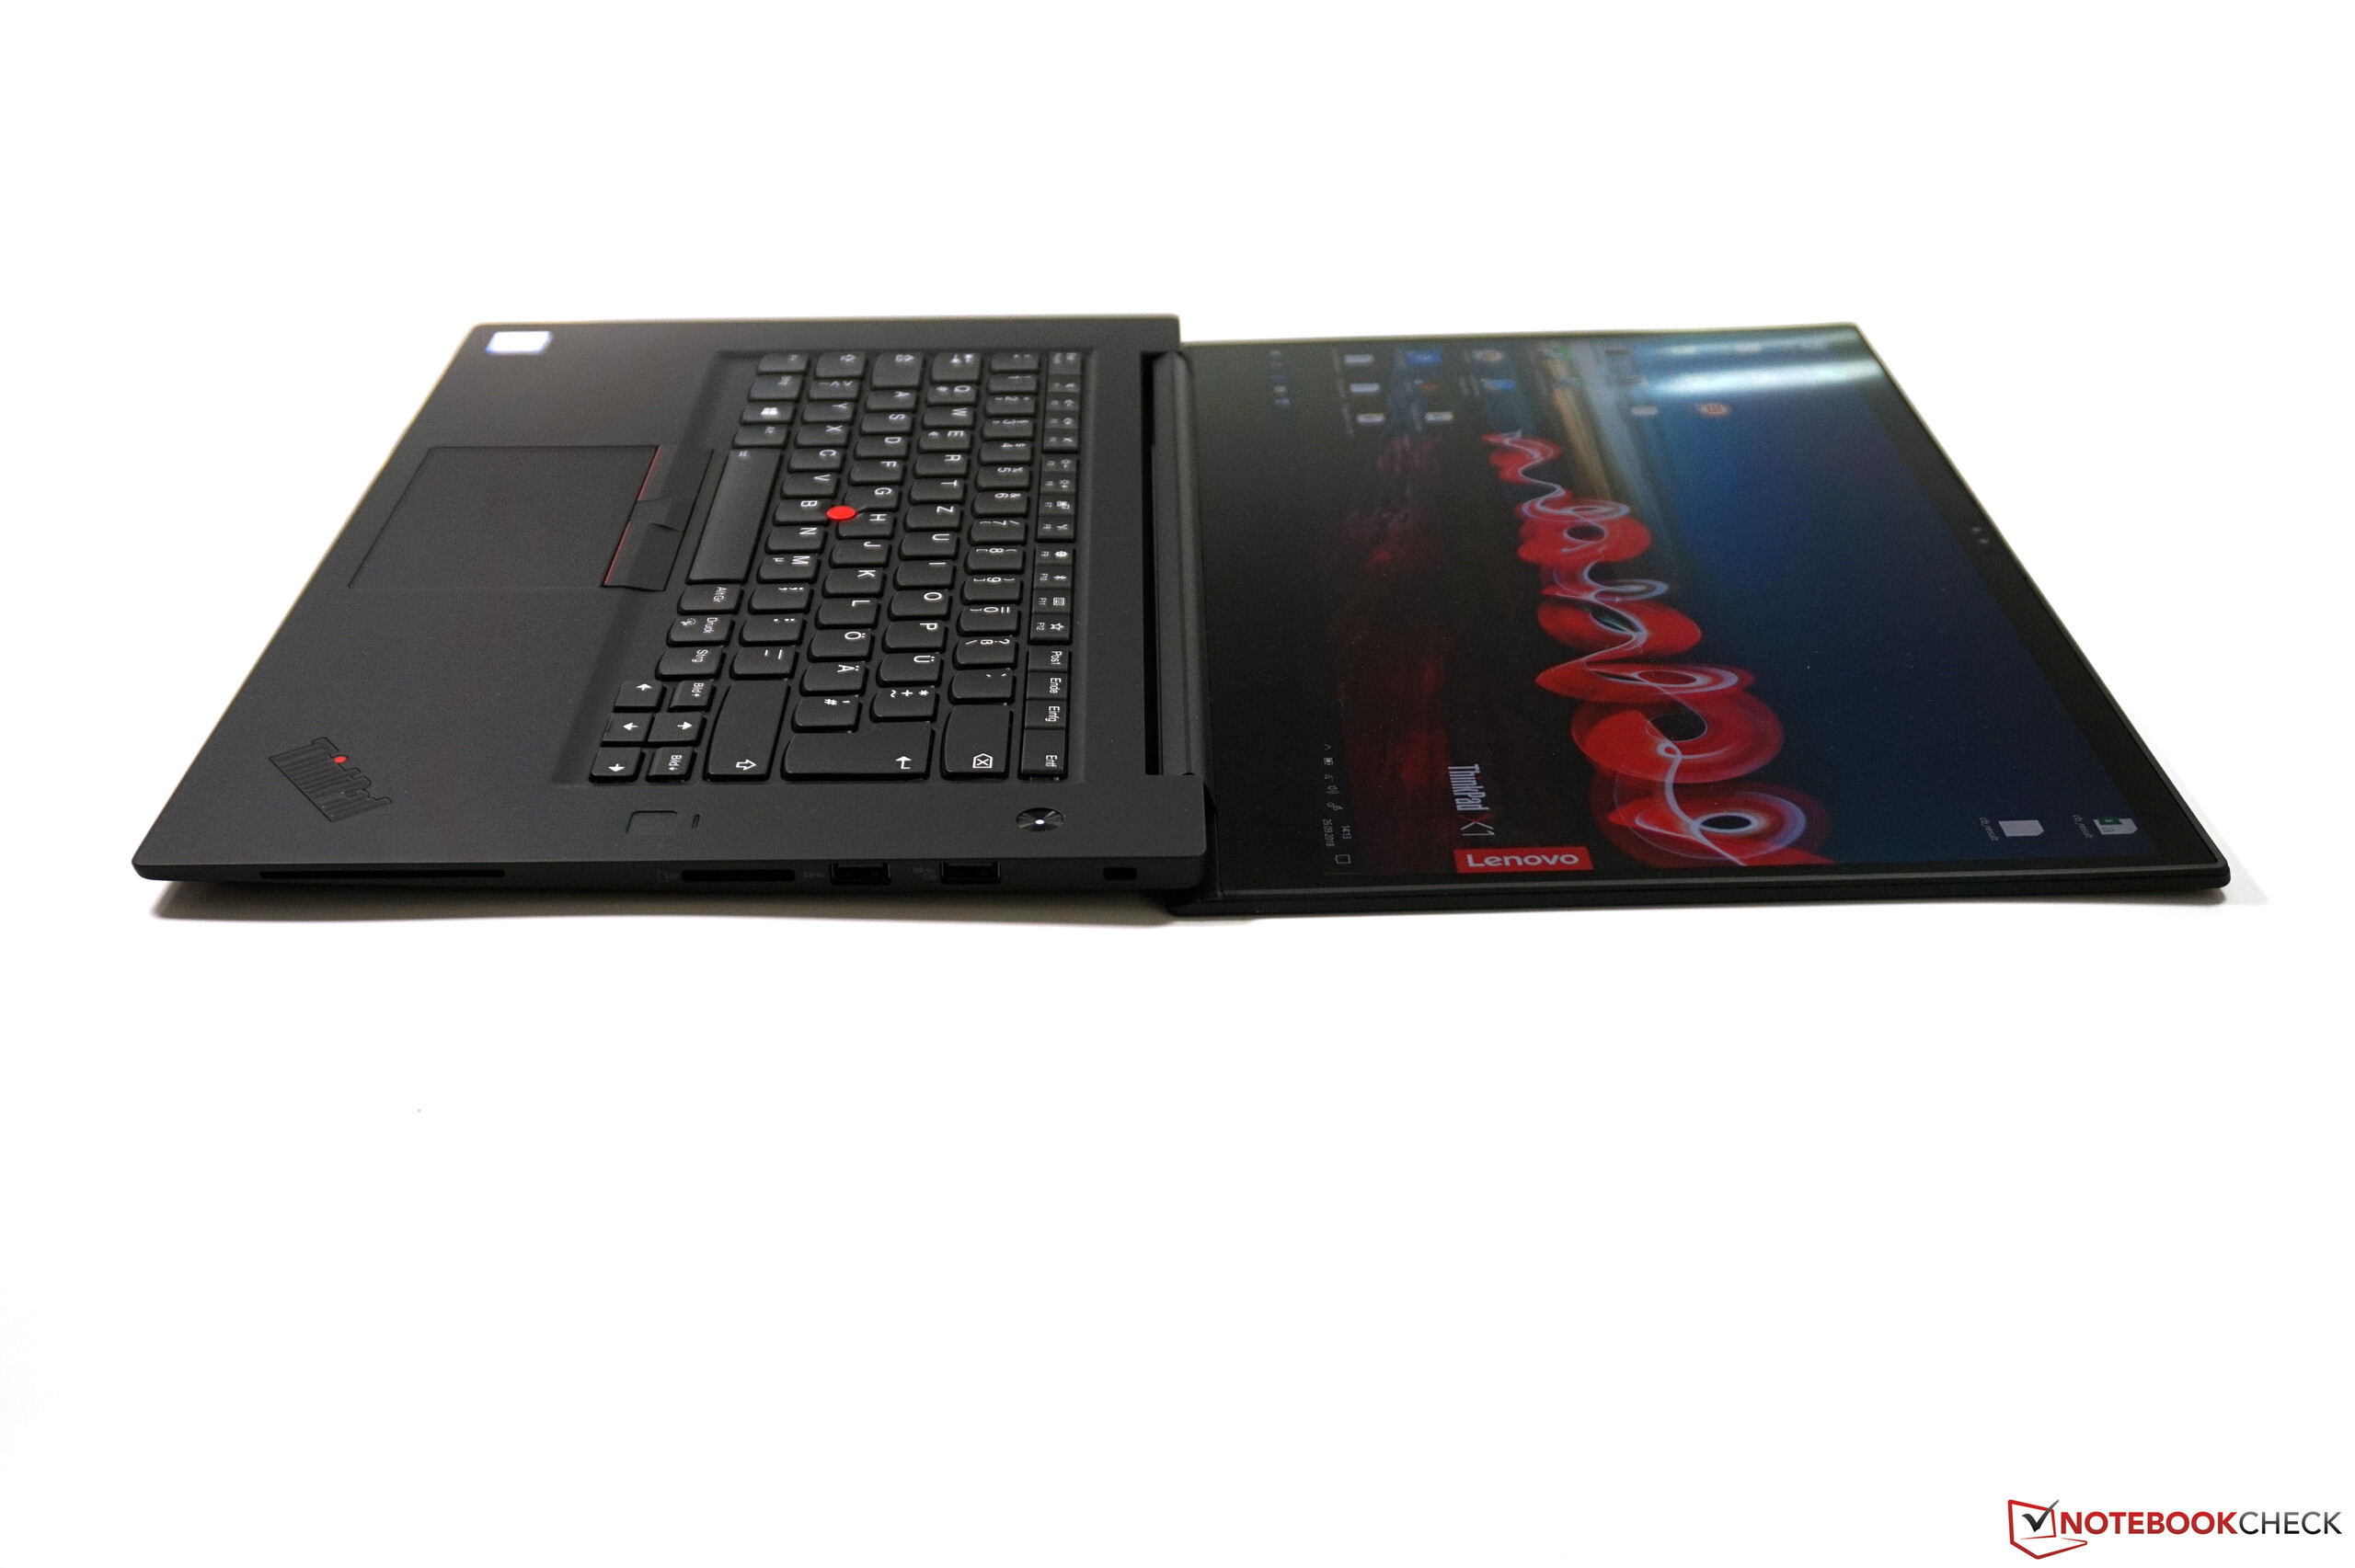
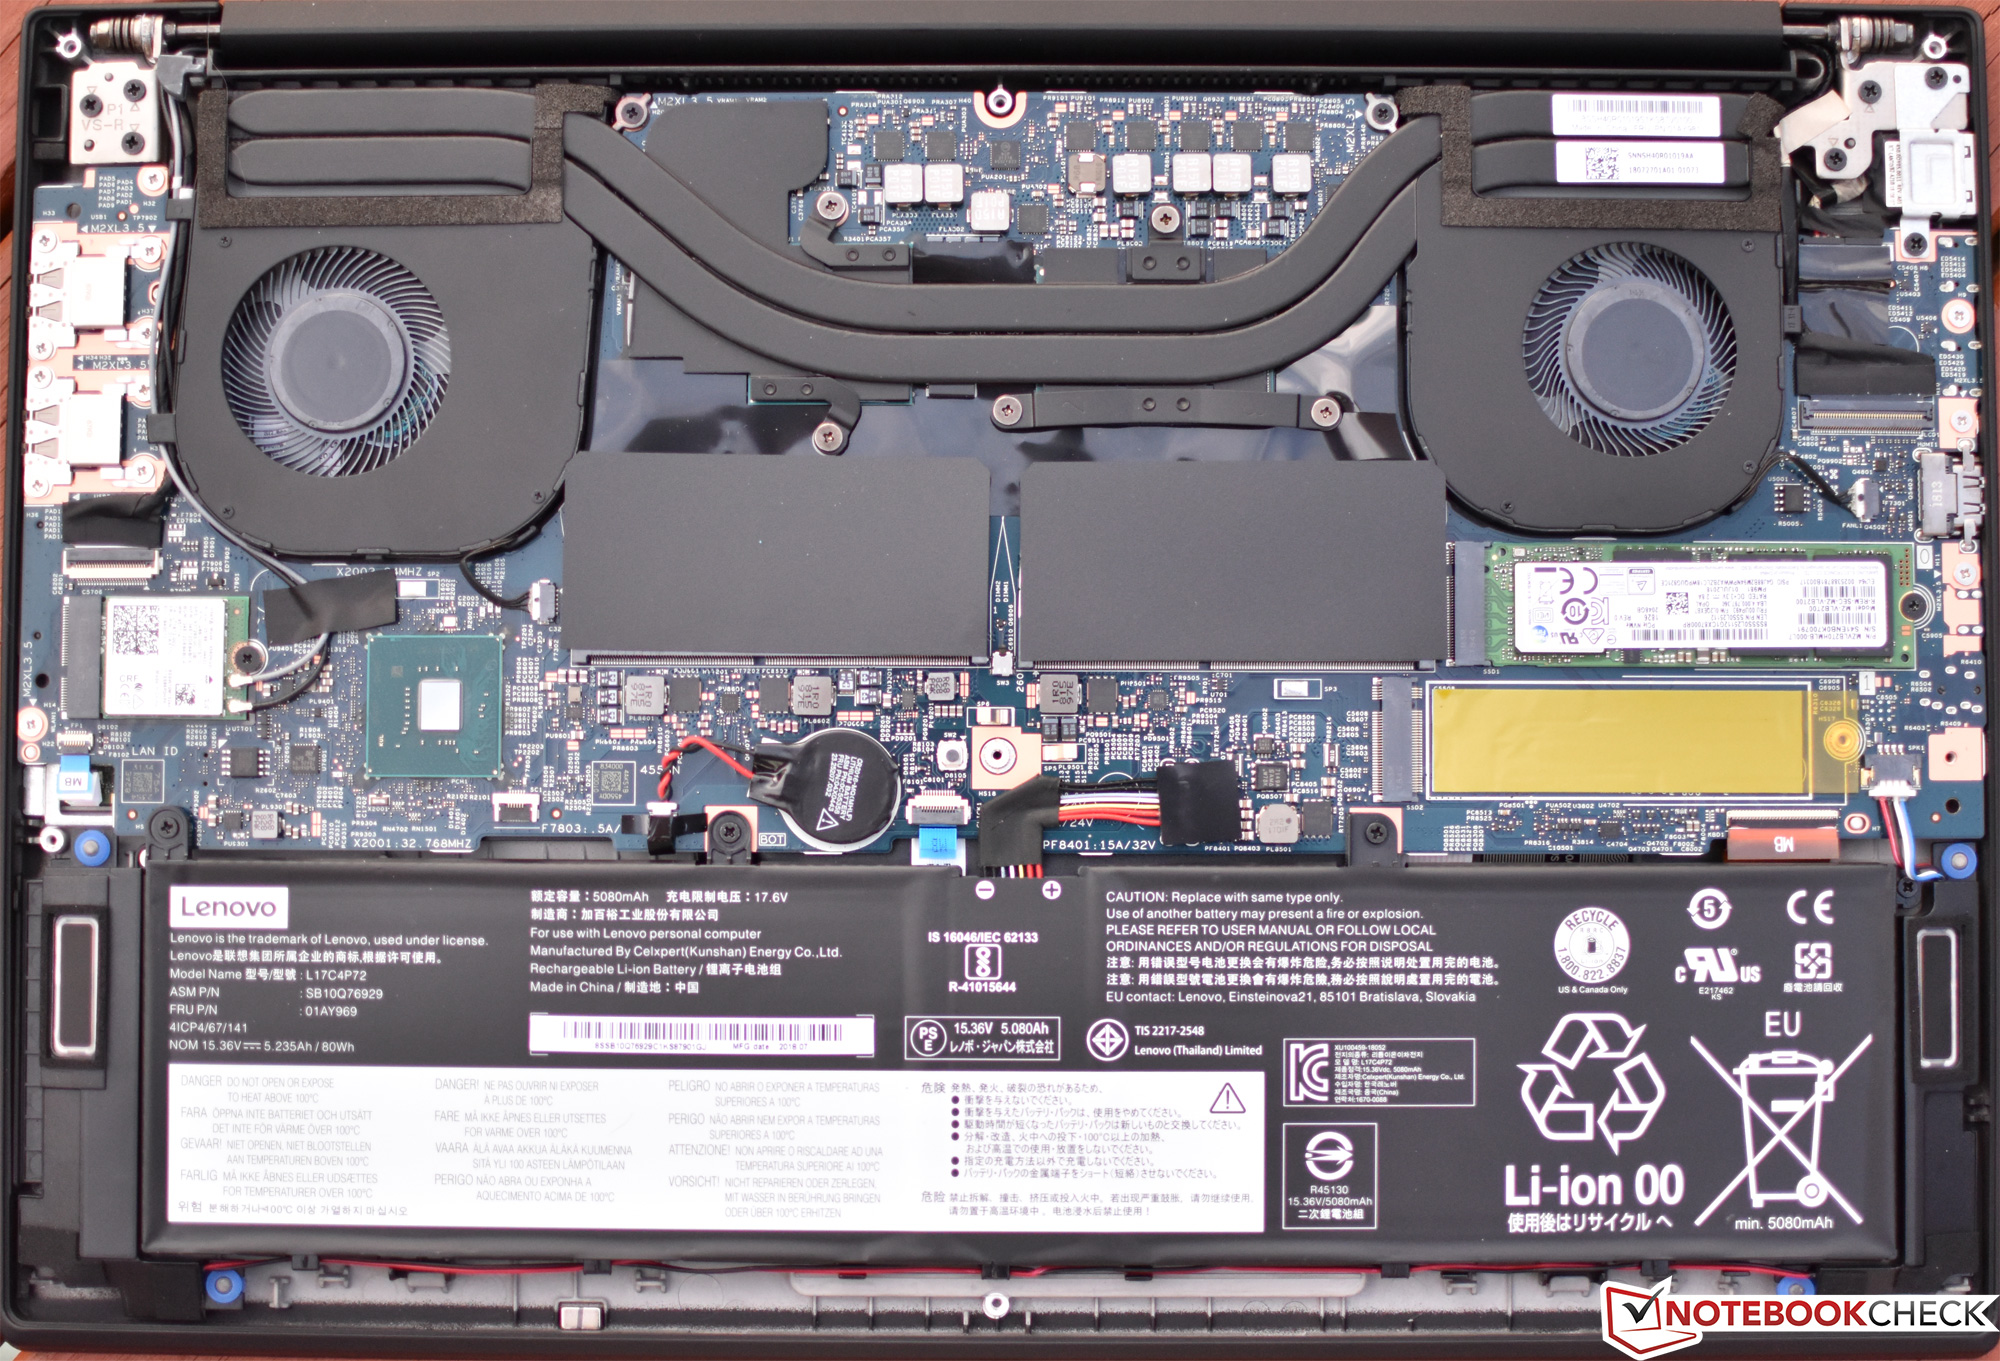
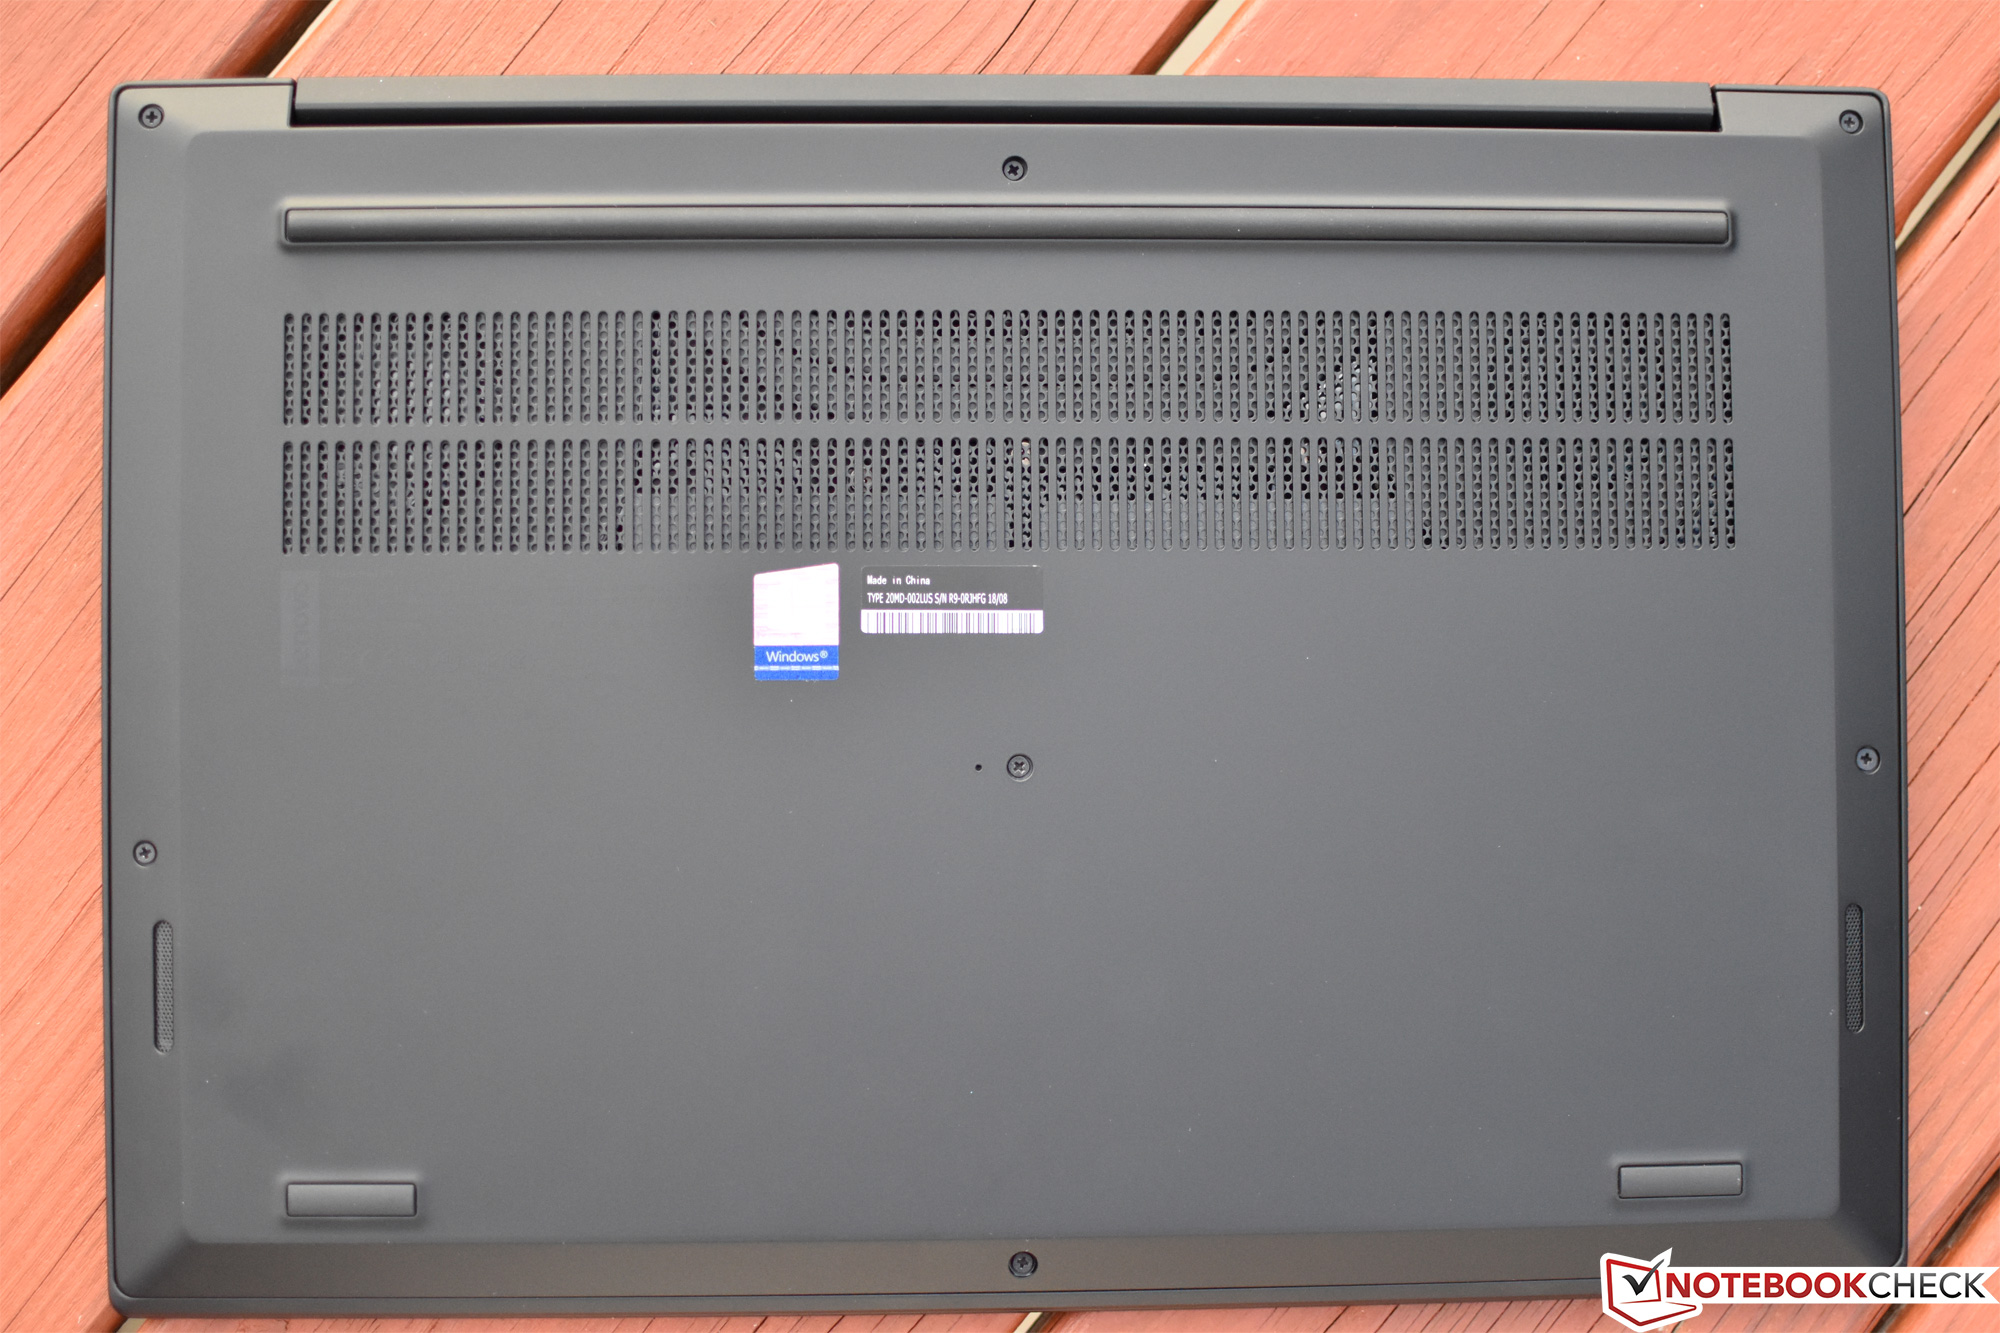
Considerando que as duas máquinas são idênticas no design, pouco mudou com o ThinkPad P1 desde o Nossa análise do X1 Extreme algumas semanas atrás. Ainda estamos impressionados com a carcaça robusta, de alta qualidade e atraente, tela IPS colorida, desempenho de CPU e GPU forte, resfriamento discreto, mas eficaz e dispositivos de entrada de alto nível. Também apreciamos a simplicidade de manutenção e atualizações, com uma tampa inferior fácil de remover e muitas oportunidades de expansão (RAM de canal duplo até 64 GB, 4 slots PCIe M.2 duplos).
O X1 Extreme já era uma oferta de primeira classe para o consumidor, mas o design também tem muito mérito quando visto da perspectiva de um workstation ultraportátil.
Naturalmente, os compromissos se aplicam quando você corta o tamanho e o peso de um workstation típico em 30 a 50%. O ThinkPad P1 gerencia um bom desempenho na maioria das cargas de trabalho, mas o estresse pesado combinado serve como um lembrete sóbrio das limitações de tal design. Com o Max-Q da NVIDIA ao volante, as temperaturas e o consumo de energia nunca saem do controle, mas o desempenho da GPU cai (e o desempenho da CPU é notavelmente reduzido) sob as mais pesadas cargas de computação. Ainda assim, o desempenho do workstation é adequado para lidar com a maioria das demandas de modelagem e design, mesmo se estiver abaixo dos dispositivos convencionais impulsionados pelo P2000 (como o Precision 5530).
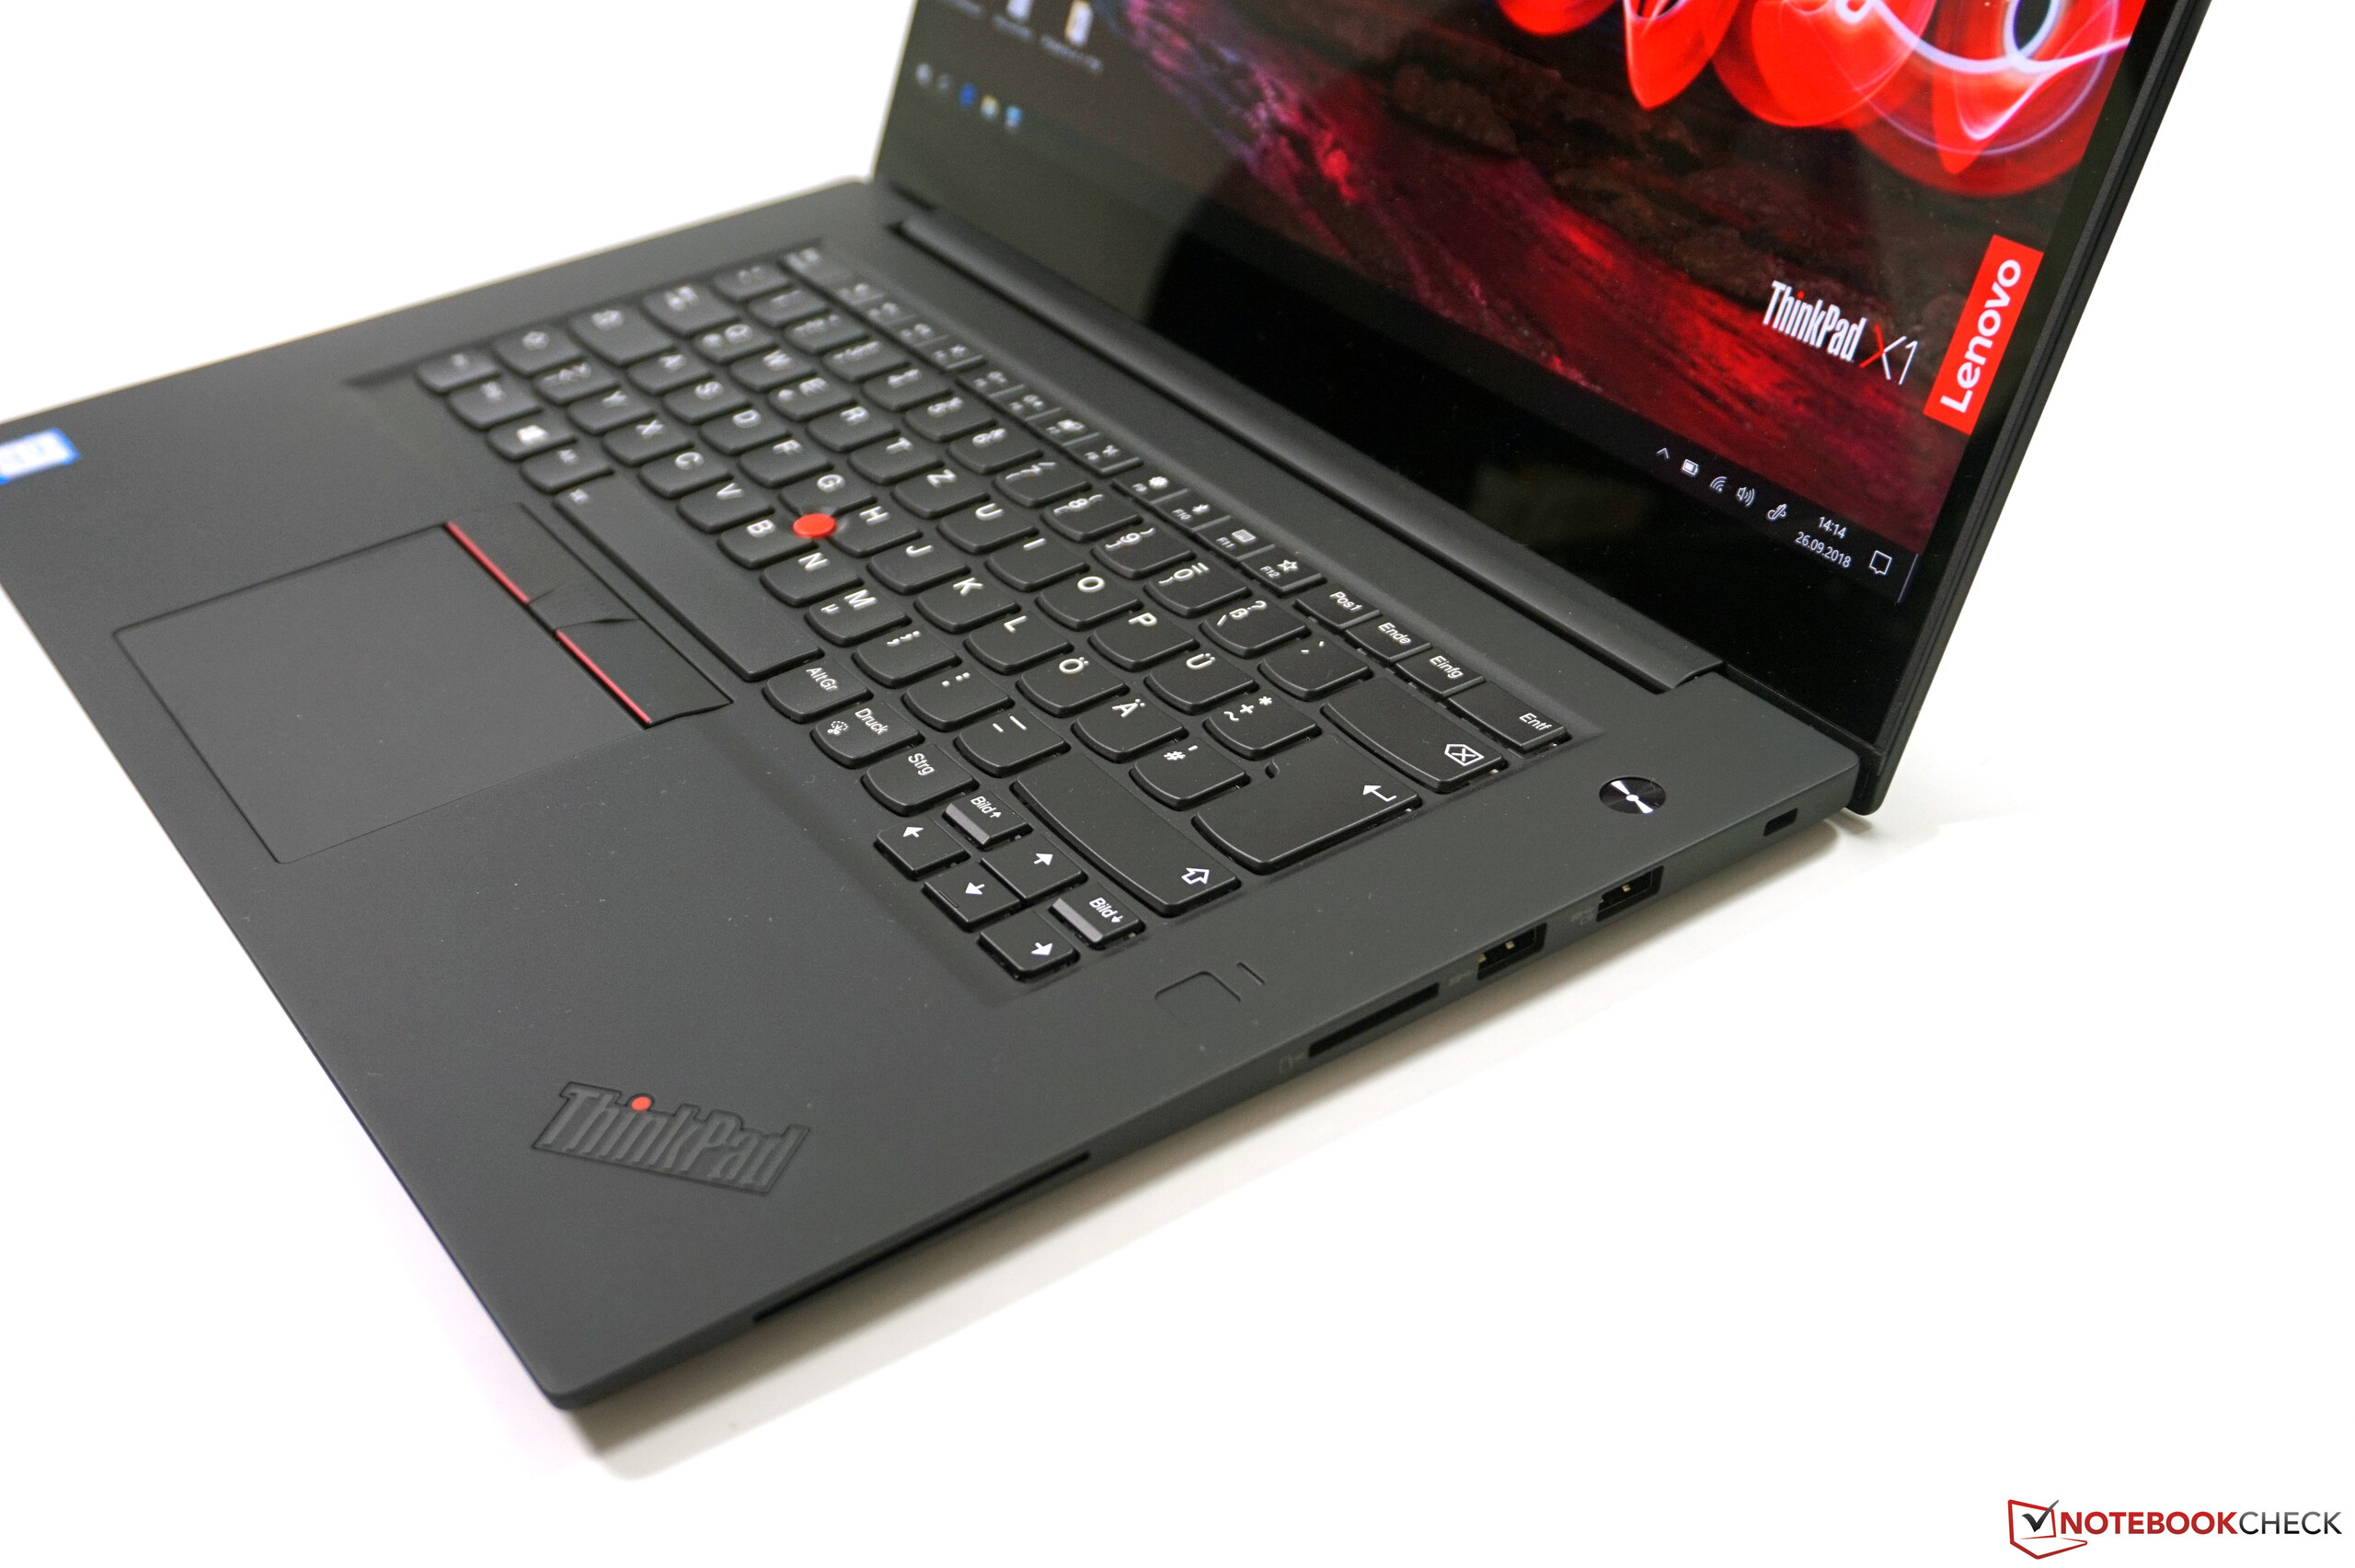
A maioria das nossas trivialidades originais do X1 Extreme também se aplicam ao ThinkPad P1. A pressão na tampa da tela ainda produz um visível rangido/estouro inicial, e a operação da ventoinha o modo inativo permanece sujeita a surtos aleatórios (e auditivos). A duração da bateria fica aquém dos líderes da categoria por uma margem significativa. E a falta de configurações de telas antirreflexos contribui para uma operação problemática em ambientes mais claros.
O preço (aproximadamente) de $4.220 de nossa unidade de teste positivamente adornada - com seu enorme SSD NVMe de 2 TB - também certamente dará uma pausa. Os usuários podem encontrar opções um pouco mais acessíveis com desempenho comparável no X1 Extreme, Precision 5530, HP EliteBook 1050 G1, ou até mesmo no XPS 15-9570. No entanto, não há muito explicitamente errado com o P1, e o que ele consegue equilibrar vai longe no sentido de justificar seu valor no universo de negócios sempre competitivo.
Lenovo ThinkPad P1-20MD002LUS
- 10/11/2018 v6 (old)
Steve Schardein
Price comparison
