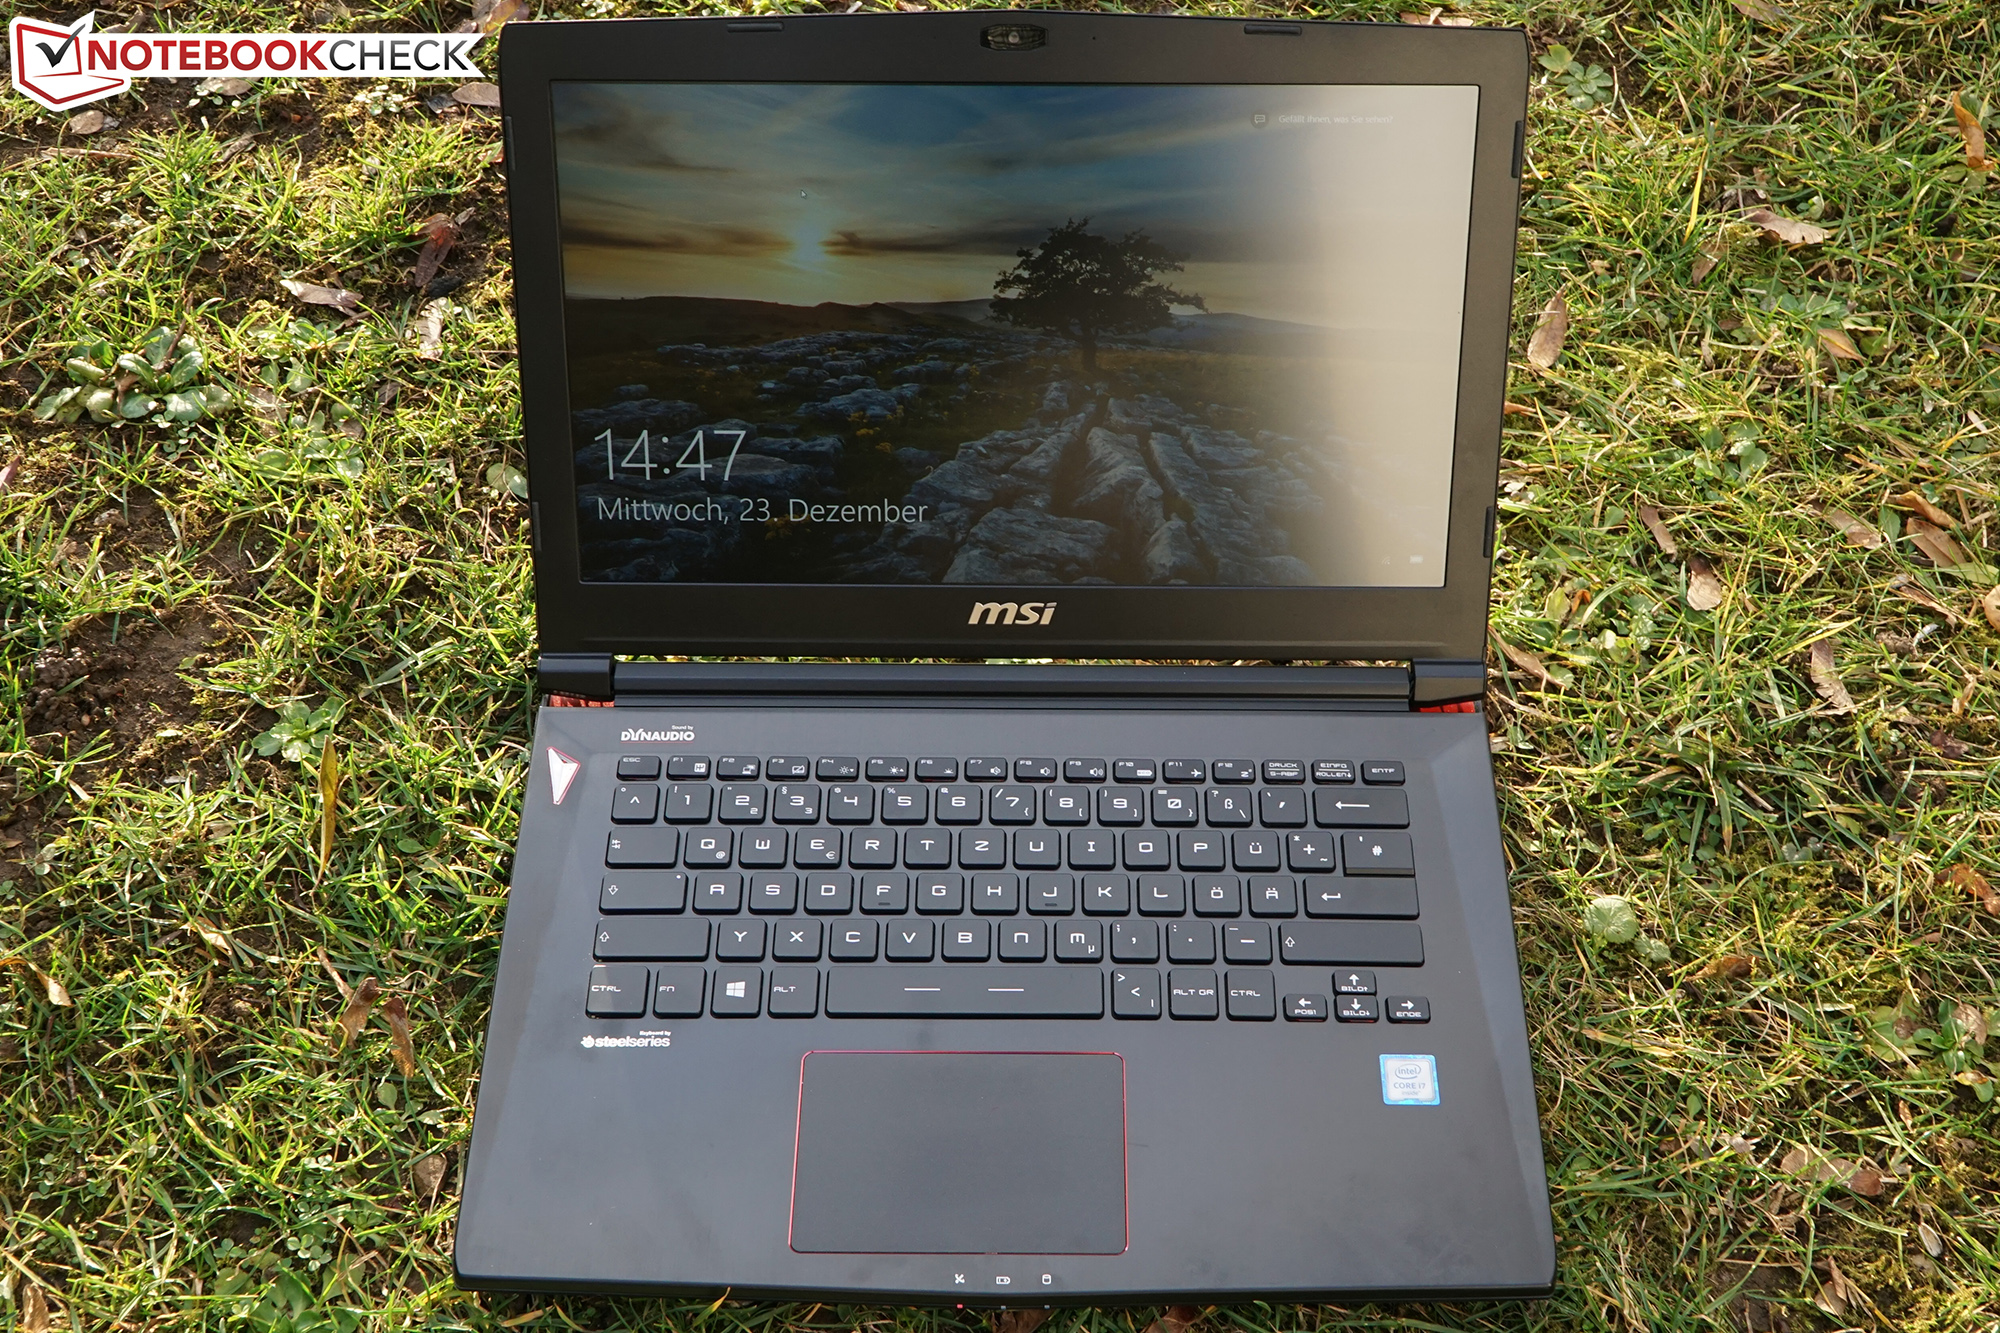
Breve análise do Portátil MSI GS40 6QE Phantom


| |||||||||||||||||||||||||
iluminação: 88 %
iluminação com acumulador: 304 cd/m²
Contraste: 822:1 (Preto: 0.37 cd/m²)
ΔE ColorChecker Calman: 7.47 | ∀{0.5-29.43 Ø4.72}
ΔE Greyscale Calman: 6.51 | ∀{0.09-98 Ø4.97}
86% sRGB (Argyll 1.6.3 3D)
56% AdobeRGB 1998 (Argyll 1.6.3 3D)
62.6% AdobeRGB 1998 (Argyll 3D)
85.7% sRGB (Argyll 3D)
66.2% Display P3 (Argyll 3D)
Gamma: 3.71
CCT: 7840 K
| MSI GS40-6QE16H11 LG Philips LP140WF3-SPD1 (LGD046D), IPS, 14", 1920x1080 | Schenker XMG P406 LG Philips 140WF1 (LGD040A), IPS, 14", 1920x1080 | Gigabyte P34W V3 AU Optronics B140HAN01.1, IPS, 14", 1920x1080 | Schenker XMG C405 AU Optronics B140HAN01.1 (AUO113ED), AHVA, 14", 1920x1080 | Asus Zenbook UX303UB-R4100T ChiMei N133HSE-EA3, IPS, 13.3", 1920x1080 | Alienware 15 R2 (Skylake) Samsung 4NDDJ_156HL (SDC4C48), IPS, 15.6", 1920x1080 | |
|---|---|---|---|---|---|---|
| Display | -2% | 7% | 4% | 6% | -34% | |
| Display P3 Coverage (%) | 66.2 | 66.2 0% | 69.4 5% | 66.8 1% | 66.9 1% | 40.3 -39% |
| sRGB Coverage (%) | 85.7 | 82.8 -3% | 92.6 8% | 89.6 5% | 92.3 8% | 60.2 -30% |
| AdobeRGB 1998 Coverage (%) | 62.6 | 60.5 -3% | 67.4 8% | 65.6 5% | 67.6 8% | 41.67 -33% |
| Response Times | -56% | -86% | -40% | |||
| Response Time Grey 50% / Grey 80% * (ms) | 31 ? | 56 ? -81% | 68 ? -119% | 48.8 ? -57% | ||
| Response Time Black / White * (ms) | 23 ? | 30 ? -30% | 35 ? -52% | 28 ? -22% | ||
| PWM Frequency (Hz) | 178 ? | 200 ? | ||||
| Screen | 15% | -1% | 7% | 20% | -8% | |
| Brightness middle (cd/m²) | 304 | 282 -7% | 305.4 0% | 280 -8% | 385 27% | 180 -41% |
| Brightness (cd/m²) | 282 | 266 -6% | 277 -2% | 267 -5% | 394 40% | 179 -37% |
| Brightness Distribution (%) | 88 | 81 -8% | 84 -5% | 85 -3% | 89 1% | 83 -6% |
| Black Level * (cd/m²) | 0.37 | 0.22 41% | 0.72 -95% | 0.32 14% | 0.41 -11% | 0.19 49% |
| Contrast (:1) | 822 | 1282 56% | 424 -48% | 875 6% | 939 14% | 947 15% |
| Colorchecker dE 2000 * | 7.47 | 4.98 33% | 2.81 62% | 4.75 36% | 3.84 49% | 6.74 10% |
| Greyscale dE 2000 * | 6.51 | 4.08 37% | 1.92 71% | 5.91 9% | 3.79 42% | 6.44 1% |
| Gamma | 3.71 59% | 2.51 88% | 2.21 100% | 2.52 87% | 2.23 99% | 2.29 96% |
| CCT | 7840 83% | 5877 111% | 6384 102% | 5742 113% | 6499 100% | 6465 101% |
| Color Space (Percent of AdobeRGB 1998) (%) | 56 | 54 -4% | 60.4 8% | 59 5% | 60 7% | 38 -32% |
| Color Space (Percent of sRGB) (%) | 86 | 83 -3% | 92 7% | 60 -30% | ||
| Colorchecker dE 2000 max. * | 10.2 | |||||
| Média Total (Programa/Configurações) | -14% /
2% | 3% /
1% | 6% /
6% | -20% /
2% | -27% /
-18% |
* ... menor é melhor
Exibir tempos de resposta
| ↔ Tempo de resposta preto para branco | ||
|---|---|---|
| 23 ms ... ascensão ↗ e queda ↘ combinadas | ↗ 5 ms ascensão | 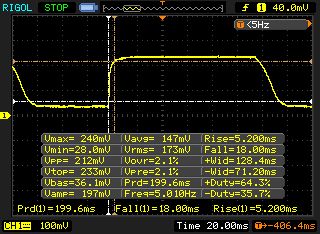 |
| ↘ 18 ms queda | ||
| A tela mostra boas taxas de resposta em nossos testes, mas pode ser muito lenta para jogadores competitivos. Em comparação, todos os dispositivos testados variam de 0.1 (mínimo) a 240 (máximo) ms. » 52 % de todos os dispositivos são melhores. Isso significa que o tempo de resposta medido é pior que a média de todos os dispositivos testados (19.8 ms). | ||
| ↔ Tempo de resposta 50% cinza a 80% cinza | ||
| 31 ms ... ascensão ↗ e queda ↘ combinadas | ↗ 12 ms ascensão | 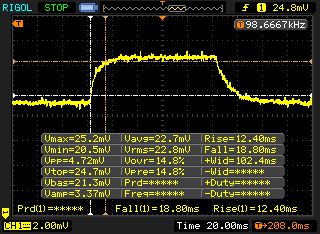 |
| ↘ 19 ms queda | ||
| A tela mostra taxas de resposta lentas em nossos testes e será insatisfatória para os jogadores. Em comparação, todos os dispositivos testados variam de 0.165 (mínimo) a 636 (máximo) ms. » 42 % de todos os dispositivos são melhores. Isso significa que o tempo de resposta medido é semelhante à média de todos os dispositivos testados (31 ms). | ||
Cintilação da tela / PWM (modulação por largura de pulso)
| Tela tremeluzindo / PWM não detectado | 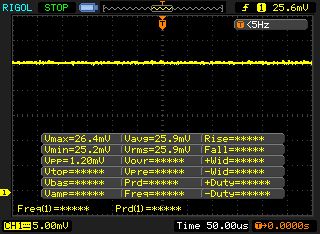 | ||
[pwm_comparison] Em comparação: 52 % de todos os dispositivos testados não usam PWM para escurecer a tela. Se PWM foi detectado, uma média de 7747 (mínimo: 5 - máximo: 343500) Hz foi medida. | |||
| Cinebench R15 | |
| CPU Multi 64Bit (classificar por valor) | |
| MSI GS40-6QE16H11 | |
| Schenker XMG P406 | |
| Gigabyte P34W V3 | |
| Schenker XMG C405 | |
| Asus Zenbook UX303UB-R4100T | |
| Alienware 15 R2 (Skylake) | |
| MSI GT72S 6QF | |
| CPU Single 64Bit (classificar por valor) | |
| MSI GS40-6QE16H11 | |
| Schenker XMG P406 | |
| Gigabyte P34W V3 | |
| Schenker XMG C405 | |
| Asus Zenbook UX303UB-R4100T | |
| Alienware 15 R2 (Skylake) | |
| MSI GT72S 6QF | |
| Cinebench R11.5 | |
| CPU Multi 64Bit (classificar por valor) | |
| MSI GS40-6QE16H11 | |
| Schenker XMG P406 | |
| Gigabyte P34W V3 | |
| Schenker XMG C405 | |
| Asus Zenbook UX303UB-R4100T | |
| Alienware 15 R2 (Skylake) | |
| MSI GT72S 6QF | |
| CPU Single 64Bit (classificar por valor) | |
| MSI GS40-6QE16H11 | |
| Schenker XMG P406 | |
| Gigabyte P34W V3 | |
| Schenker XMG C405 | |
| Asus Zenbook UX303UB-R4100T | |
| Alienware 15 R2 (Skylake) | |
| MSI GT72S 6QF | |
| PCMark 7 Score | 5451 pontos | |
| PCMark 8 Home Score Accelerated v2 | 3776 pontos | |
| PCMark 8 Creative Score Accelerated v2 | 4742 pontos | |
| PCMark 8 Work Score Accelerated v2 | 4831 pontos | |
Ajuda | ||
| PCMark 7 - Score (classificar por valor) | |
| MSI GS40-6QE16H11 | |
| Schenker XMG P406 | |
| Gigabyte P34W V3 | |
| Asus Zenbook UX303UB-R4100T | |
| Alienware 15 R2 (Skylake) | |
| PCMark 8 | |
| Home Score Accelerated v2 (classificar por valor) | |
| MSI GS40-6QE16H11 | |
| Schenker XMG P406 | |
| Gigabyte P34W V3 | |
| Schenker XMG C405 | |
| Asus Zenbook UX303UB-R4100T | |
| Alienware 15 R2 (Skylake) | |
| Creative Score Accelerated v2 (classificar por valor) | |
| MSI GS40-6QE16H11 | |
| Gigabyte P34W V3 | |
| Schenker XMG C405 | |
| Asus Zenbook UX303UB-R4100T | |
| Alienware 15 R2 (Skylake) | |
| Work Score Accelerated v2 (classificar por valor) | |
| MSI GS40-6QE16H11 | |
| Schenker XMG P406 | |
| Gigabyte P34W V3 | |
| Schenker XMG C405 | |
| Asus Zenbook UX303UB-R4100T | |
| Alienware 15 R2 (Skylake) | |

| MSI GS40-6QE16H11 Samsung MZFLV128 NVMe | Schenker XMG P406 Samsung SM951 MZHPV256HDGL m.2 PCI-e | Gigabyte P34W V3 Lite-On LMT-128L9M | Schenker XMG C405 Crucial M550 CT256M550SSD3 | Asus Zenbook UX303UB-R4100T Micron M600 MTFDDAK512MBF | Alienware 15 R2 (Skylake) Samsung PM951 NVMe MZ-VLV256D | |
|---|---|---|---|---|---|---|
| CrystalDiskMark 3.0 | 20% | -48% | -36% | -44% | -19% | |
| Read Seq (MB/s) | 1332 | 1634 23% | 504 -62% | 517 -61% | 484.2 -64% | 1213 -9% |
| Write Seq (MB/s) | 687 | 1290 88% | 337.4 -51% | 496.6 -28% | 444.9 -35% | 306 -55% |
| Read 4k (MB/s) | 49.57 | 43.82 -12% | 33.13 -33% | 33.03 -33% | 28.74 -42% | 42.62 -14% |
| Write 4k (MB/s) | 138.8 | 110.3 -21% | 75 -46% | 111.3 -20% | 90.5 -35% | 143.7 4% |
| AS SSD | 165% | 64% | 98% | 62% | ||
| Seq Read (MB/s) | 1834 | 1875 2% | 487 -73% | 523 -71% | 514 -72% | |
| Seq Write (MB/s) | 289.1 | 1252 333% | 322.9 12% | 475.6 65% | 399.9 38% | |
| 4K Read (MB/s) | 45.54 | 39.68 -13% | 30.97 -32% | 30.61 -33% | 26.51 -42% | |
| 4K Write (MB/s) | 102.4 | 92 -10% | 67.9 -34% | 97.6 -5% | 76.1 -26% | |
| 4K-64 Read (MB/s) | 738 | 707 -4% | 366.8 -50% | 384.8 -48% | 308.1 -58% | |
| 4K-64 Write (MB/s) | 34.73 | 351.2 911% | 256.3 638% | 304.5 777% | 254 631% | |
| Access Time Read * (ms) | 0.062 | 0.061 2% | 0.094 -52% | 0.063 -2% | 0.11 -77% | |
| Access Time Write * (ms) | 4.234 | 0.042 99% | 0.054 99% | 0.046 99% | 0.064 98% | |
| Média Total (Programa/Configurações) | 93% /
117% | 8% /
26% | 31% /
53% | 9% /
26% | -19% /
-19% |
* ... menor é melhor
| 3DMark 11 Performance | 9544 pontos | |
| 3DMark Ice Storm Standard Score | 87313 pontos | |
| 3DMark Cloud Gate Standard Score | 21133 pontos | |
| 3DMark Fire Strike Score | 6530 pontos | |
Ajuda | ||
| 3DMark | |
| 1920x1080 Fire Strike Score (classificar por valor) | |
| MSI GS40-6QE16H11 | |
| Schenker XMG P406 | |
| Gigabyte P55 V4 | |
| Gigabyte P34W V3 | |
| Schenker XMG C405 | |
| Asus Zenbook UX303UB-R4100T | |
| Alienware 15 R2 (Skylake) | |
| 1280x720 Cloud Gate Standard Score (classificar por valor) | |
| MSI GS40-6QE16H11 | |
| Schenker XMG P406 | |
| Gigabyte P55 V4 | |
| Gigabyte P34W V3 | |
| Schenker XMG C405 | |
| Asus Zenbook UX303UB-R4100T | |
| Alienware 15 R2 (Skylake) | |
| 3DMark 11 - 1280x720 Performance (classificar por valor) | |
| MSI GS40-6QE16H11 | |
| Schenker XMG P406 | |
| Gigabyte P55 V4 | |
| Gigabyte P34W V3 | |
| Schenker XMG C405 | |
| Asus Zenbook UX303UB-R4100T | |
| Alienware 15 R2 (Skylake) | |
| baixo | média | alto | ultra | |
|---|---|---|---|---|
| Tomb Raider (2013) | 307.5 | 270.3 | 185 | 86.6 |
| The Witcher 3 (2015) | 134.5 | 84.6 | 38.9 | 26.4 |
| Fallout 4 (2015) | 135.5 | 101.3 | 53.5 | 43.7 |
| Tomb Raider - 1920x1080 Ultra Preset AA:FX AF:16x (classificar por valor) | |
| MSI GS40-6QE16H11 | |
| Gigabyte P34W V3 | |
| Schenker XMG C405 | |
| Asus Zenbook UX303UB-R4100T | |
| Alienware 15 R2 (Skylake) | |
| The Witcher 3 | |
| 1920x1080 High Graphics & Postprocessing (Nvidia HairWorks Off) (classificar por valor) | |
| MSI GS40-6QE16H11 | |
| Alienware 15 R2 (Skylake) | |
| 1920x1080 Ultra Graphics & Postprocessing (HBAO+) (classificar por valor) | |
| MSI GS40-6QE16H11 | |
| Alienware 15 R2 (Skylake) | |
| Fallout 4 | |
| 1920x1080 High Preset AA:T AF:16x (classificar por valor) | |
| MSI GS40-6QE16H11 | |
| Schenker XMG P406 | |
| Asus Zenbook UX303UB-R4100T | |
| 1920x1080 Ultra Preset AA:T AF:16x (classificar por valor) | |
| MSI GS40-6QE16H11 | |
| Schenker XMG P406 | |
| Asus Zenbook UX303UB-R4100T | |
Barulho
| Ocioso |
| 33 / 34 / 38 dB |
| HDD |
| 34 dB |
| Carga |
| 44 / 52 dB |
 | ||
30 dB silencioso 40 dB(A) audível 50 dB(A) ruidosamente alto |
||
min: | ||
| MSI GS40-6QE16H11 GeForce GTX 970M, 6700HQ | Schenker XMG P406 GeForce GTX 970M, 6700HQ | Gigabyte P34W V3 GeForce GTX 970M, 4720HQ | Schenker XMG C405 GeForce GTX 965M, 4720HQ | Asus Zenbook UX303UB-R4100T GeForce 940M, 6500U | Alienware 15 R2 (Skylake) GeForce GTX 980M, 6700HQ | |
|---|---|---|---|---|---|---|
| Noise | 1% | -2% | -4% | 15% | 4% | |
| Idle Minimum * (dB) | 33 | 30 9% | 34.2 -4% | 29.2 12% | 31.5 5% | 33.6 -2% |
| Idle Average * (dB) | 34 | 32 6% | 34.3 -1% | 34.6 -2% | 31.5 7% | 33.8 1% |
| Idle Maximum * (dB) | 38 | 40 -5% | 38 -0% | 38.8 -2% | 31.5 17% | 34 11% |
| Load Average * (dB) | 44 | 47 -7% | 43.8 -0% | 54 -23% | 35.9 18% | 39.3 11% |
| Load Maximum * (dB) | 52 | 51 2% | 55 -6% | 54.4 -5% | 38.2 27% | 51.4 1% |
* ... menor é melhor
(-) A temperatura máxima no lado superior é 57.4 °C / 135 F, em comparação com a média de 40.4 °C / 105 F , variando de 21.2 a 68.8 °C para a classe Gaming.
(-) A parte inferior aquece até um máximo de 68.8 °C / 156 F, em comparação com a média de 43.2 °C / 110 F
(±) Em uso inativo, a temperatura média para o lado superior é 34.1 °C / 93 F, em comparação com a média do dispositivo de 33.9 °C / ### class_avg_f### F.
(+) Os apoios para as mãos e o touchpad estão atingindo a temperatura máxima da pele (35.3 °C / 95.5 F) e, portanto, não estão quentes.
(-) A temperatura média da área do apoio para as mãos de dispositivos semelhantes foi 28.8 °C / 83.8 F (-6.5 °C / -11.7 F).
| MSI GS40-6QE16H11 GeForce GTX 970M, 6700HQ | Schenker XMG P406 GeForce GTX 970M, 6700HQ | Gigabyte P34W V3 GeForce GTX 970M, 4720HQ | Schenker XMG C405 GeForce GTX 965M, 4720HQ | Asus Zenbook UX303UB-R4100T GeForce 940M, 6500U | Alienware 15 R2 (Skylake) GeForce GTX 980M, 6700HQ | |
|---|---|---|---|---|---|---|
| Heat | 4% | 9% | 4% | 24% | 16% | |
| Maximum Upper Side * (°C) | 57.4 | 55 4% | 45.2 21% | 47.8 17% | 56.6 1% | 48 16% |
| Maximum Bottom * (°C) | 68.8 | 58.7 15% | 56.8 17% | 60.4 12% | 54.3 21% | 57.3 17% |
| Idle Upper Side * (°C) | 36.3 | 36.9 -2% | 34.6 5% | 37.7 -4% | 24 34% | 31.9 12% |
| Idle Bottom * (°C) | 41.2 | 41.7 -1% | 43.6 -6% | 44.8 -9% | 24.2 41% | 33.4 19% |
* ... menor é melhor
| desligado | |
| Ocioso | |
| Carga |
|
Key:
min: | |
| MSI GS40-6QE16H11 GeForce GTX 970M, 6700HQ | Schenker XMG P406 GeForce GTX 970M, 6700HQ | MSI GS60-6QE4K16H21 GeForce GTX 970M, 6700HQ | Schenker XMG C405 GeForce GTX 965M, 4720HQ | Asus Zenbook UX303UB-R4100T GeForce 940M, 6500U | Alienware 15 R2 (Skylake) GeForce GTX 980M, 6700HQ | |
|---|---|---|---|---|---|---|
| Power Consumption | -5% | -26% | -28% | 59% | -8% | |
| Idle Minimum * (Watt) | 10 | 12 -20% | 17 -70% | 15.8 -58% | 3.2 68% | 11.4 -14% |
| Idle Average * (Watt) | 14 | 16 -14% | 22 -57% | 22.8 -63% | 7.6 46% | 16.5 -18% |
| Idle Maximum * (Watt) | 24 | 22 8% | 28 -17% | 27.3 -14% | 8 67% | 22 8% |
| Load Average * (Watt) | 90 | 90 -0% | 91 -1% | 106.8 -19% | 47 48% | 94.2 -5% |
| Load Maximum * (Watt) | 172 | 170 1% | 149 13% | 152 12% | 55 68% | 192.2 -12% |
* ... menor é melhor
| MSI GS40-6QE16H11 GeForce GTX 970M, 6700HQ, 61 Wh | Schenker XMG P406 GeForce GTX 970M, 6700HQ, 45 Wh | MSI GS60-6QE4K16H21 GeForce GTX 970M, 6700HQ, 47 Wh | Schenker XMG C405 GeForce GTX 965M, 4720HQ, 61 Wh | Asus Zenbook UX303UB-R4100T GeForce 940M, 6500U, 50 Wh | Alienware 15 R2 (Skylake) GeForce GTX 980M, 6700HQ, 96 Wh | |
|---|---|---|---|---|---|---|
| Duração da bateria | -9% | -26% | -22% | 98% | 84% | |
| Reader / Idle (h) | 5.2 | 4.6 -12% | 3.6 -31% | 16.6 219% | 12.8 146% | |
| H.264 (h) | 5 | 6.9 38% | 7.6 52% | |||
| WiFi v1.3 (h) | 5 | 3.3 -34% | 2.6 -48% | 3.9 -22% | 6.8 36% | 7.4 48% |
| Load (h) | 1 | 1.2 20% | 1 0% | 2 100% | 1.9 90% |
Pro
Contra
O GS40 é um bom compromisso entre desempenho e dimensões compactas. As poucas desvantagens são principalmente o resultado do conceito "Mini-Max", mas você pode viver com elas. O desempenho (jogos) é inegável – o GS40 inclusive pode lidar com jogos muito exigentes. A tela é impressionante, o consumo de energia é razoável e as durações da bateria são bastante boas.
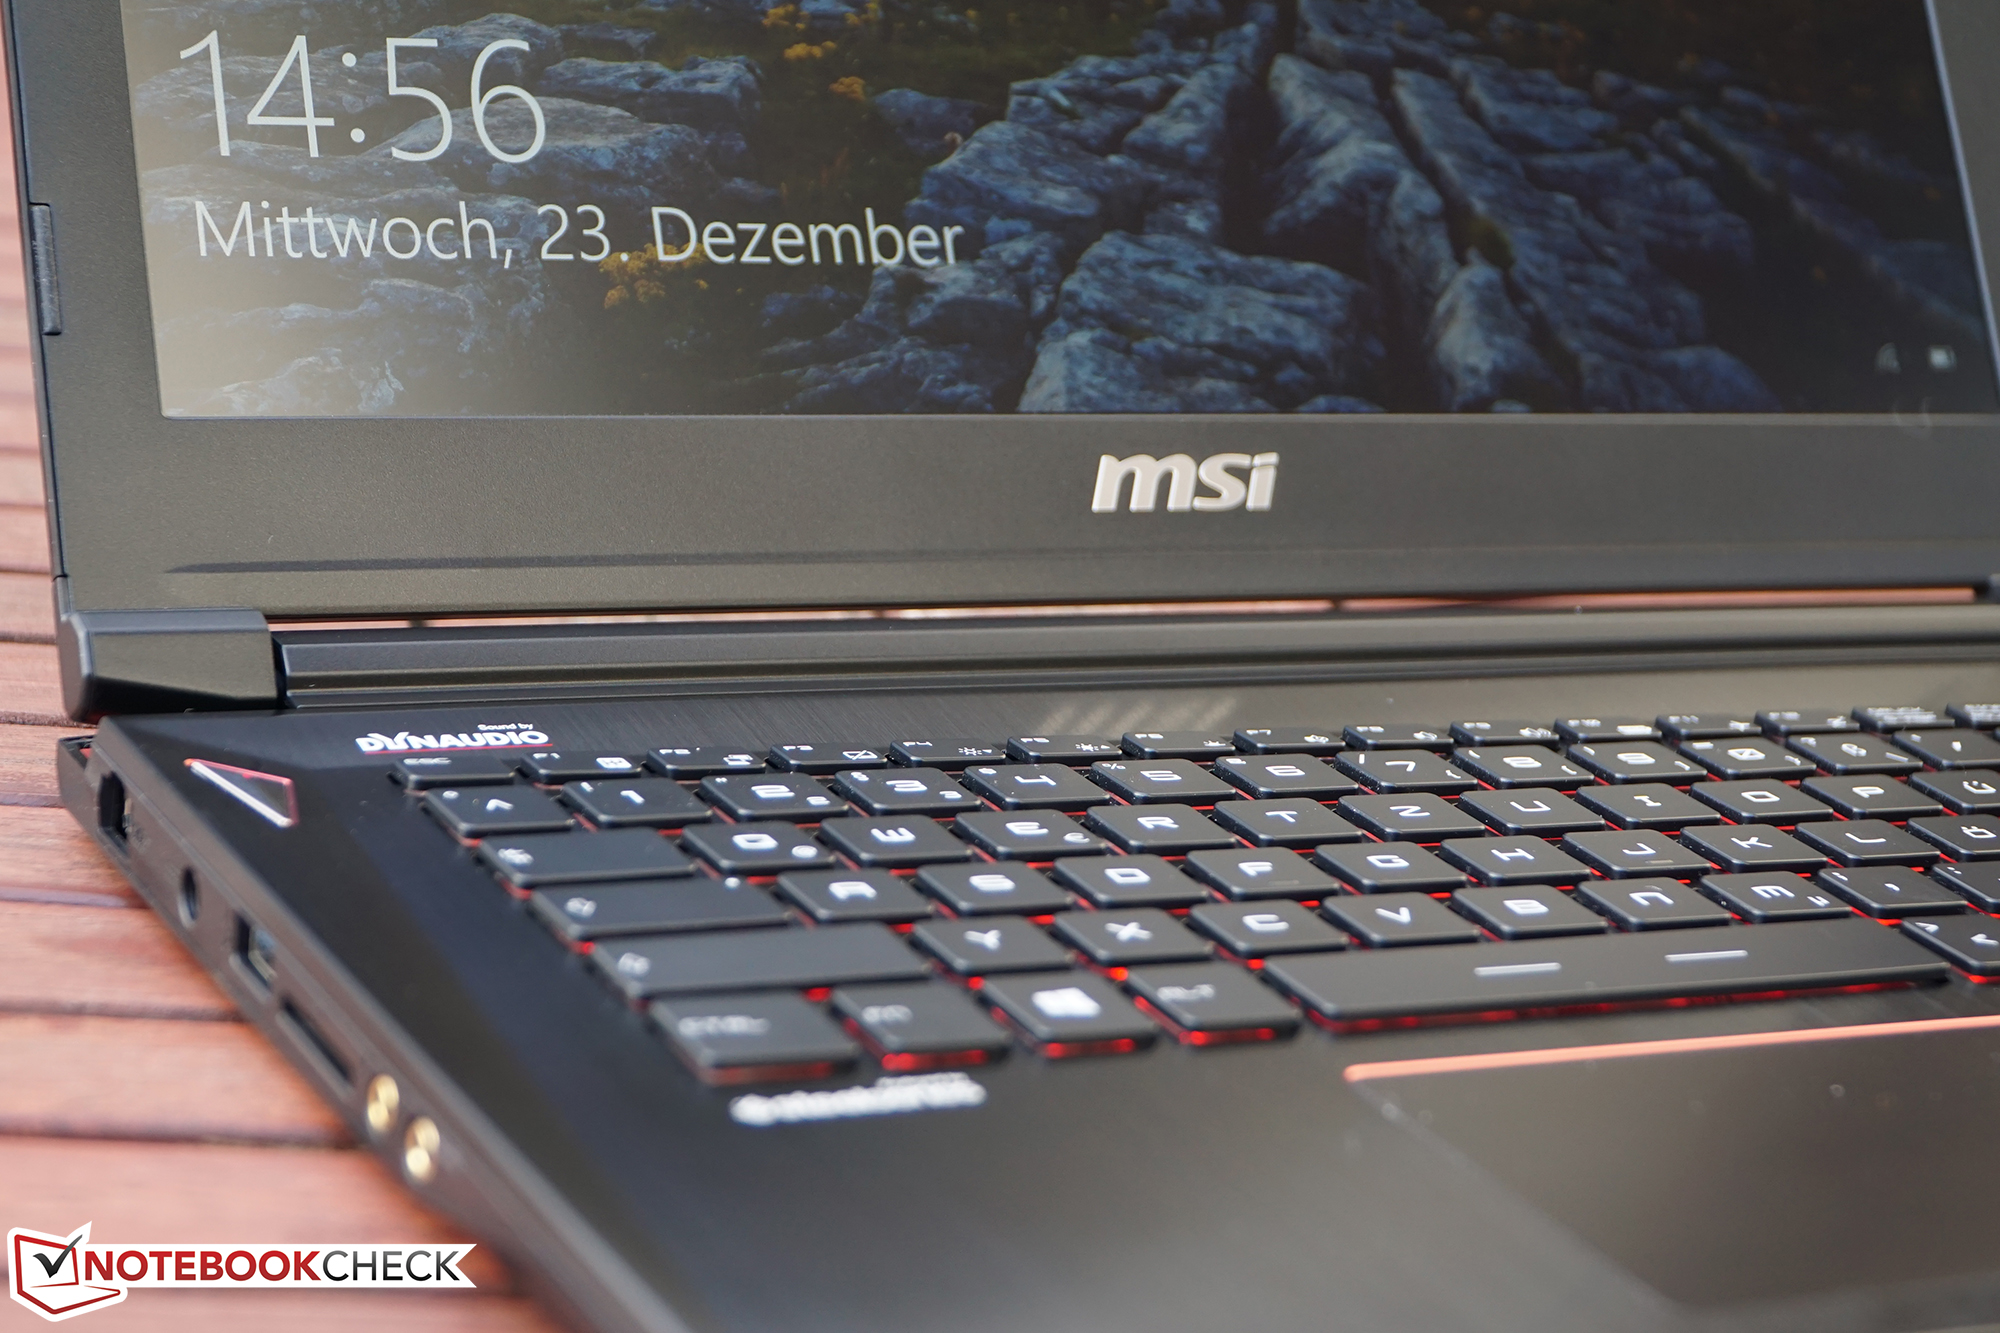
O peso leve afeta a estabilidade do chassi, que se flexiona bastante rapidamente sob pressão (incluindo as teclas). As ventoinhas também tiveram dificuldades em dissipar o calor – tal vez elas deveriam funcionar com uma velocidade estável em vez de ser pulsantes? isto definitivamente melhoraria o ruído.
Mas isto não consegue mudar nossa impressão geral boa do GS40. Não há muitas alternativas de 14-polegadas, pelo menos se você quiser recursos modernos com uma CPU Skylake, RAM DDR4 e USB 3.1. Isto poderia mudar rapidamente (análise do Schenker XMG P406 seguirá em breve), mas por enquanto somente poderia optar por um sistema menor e menos poderoso ou por um portátil de jogos mais pesado, de 15 ou até mesmo de 17- polegadas.
Com cerca de 1700 Euros (~$1851), o GS40 certamente não é uma barganha, mas o preço ainda é similar ao dos rivais.
Esta é uma versão reduzida da análise original. Você pode ler a análise completa em inglês aqui.
MSI GS40-6QE16H11
- 03/08/2016 v5 (old)
Oliver Moebel
Price comparison
