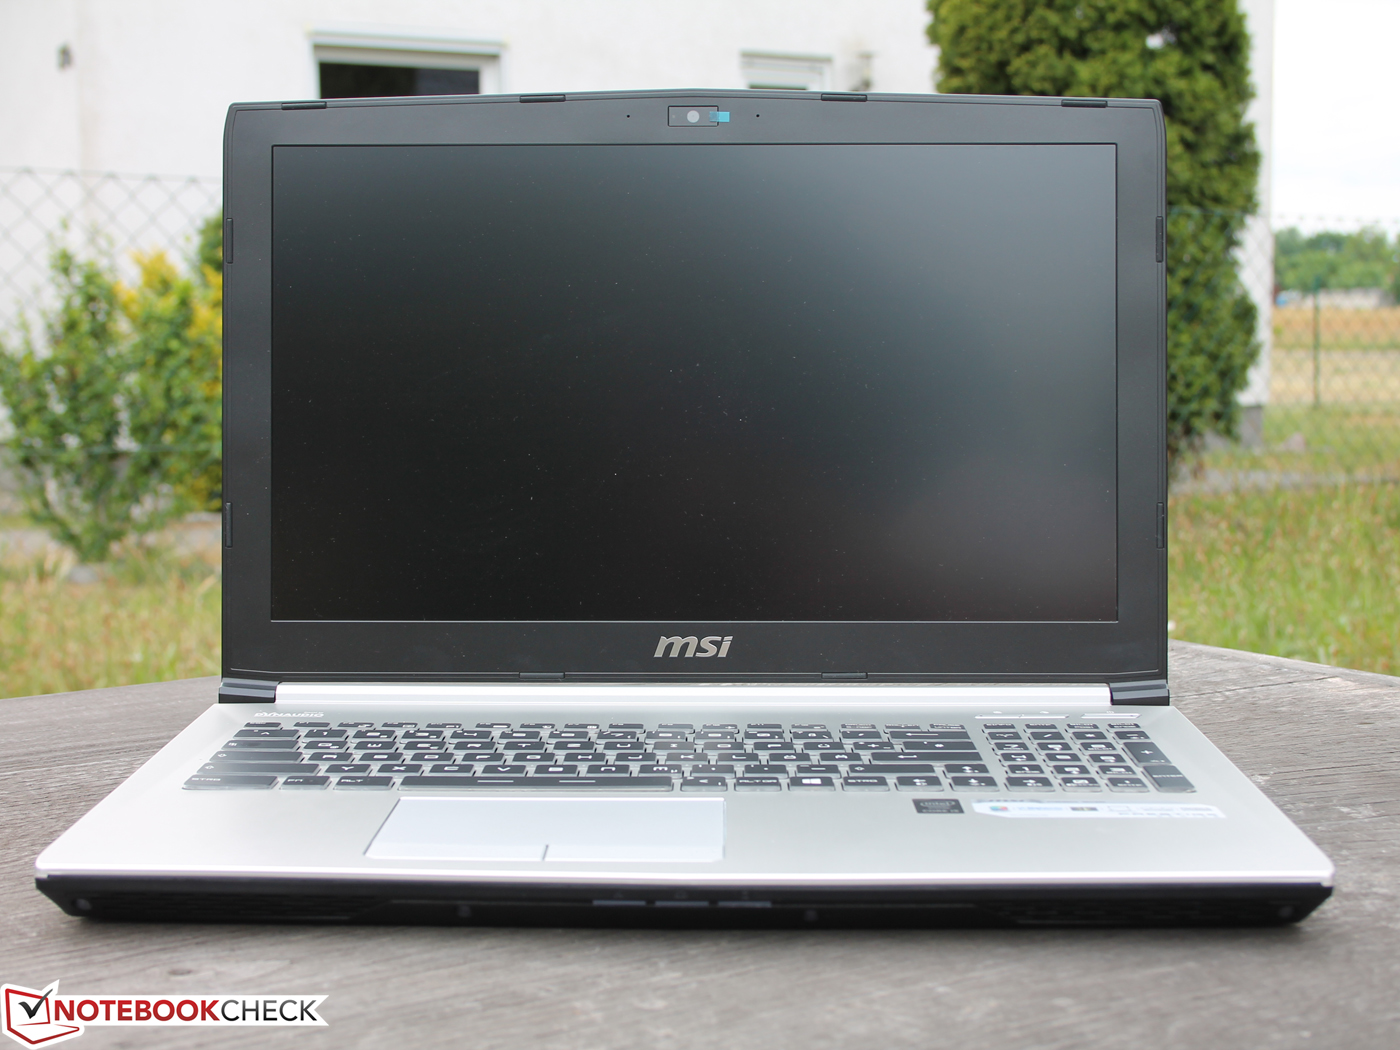
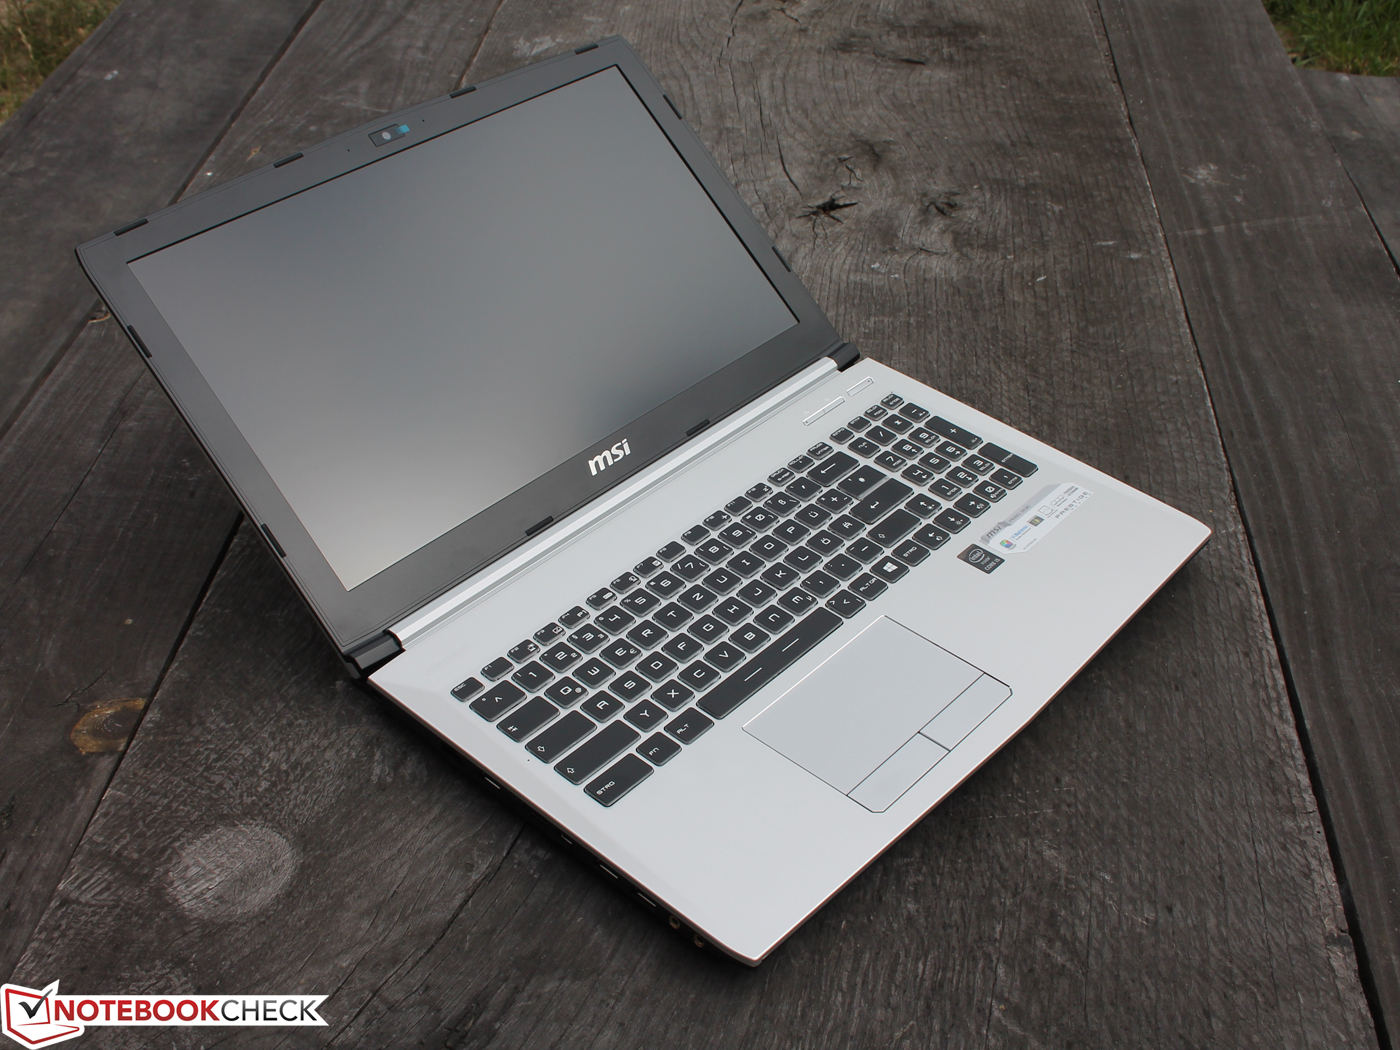
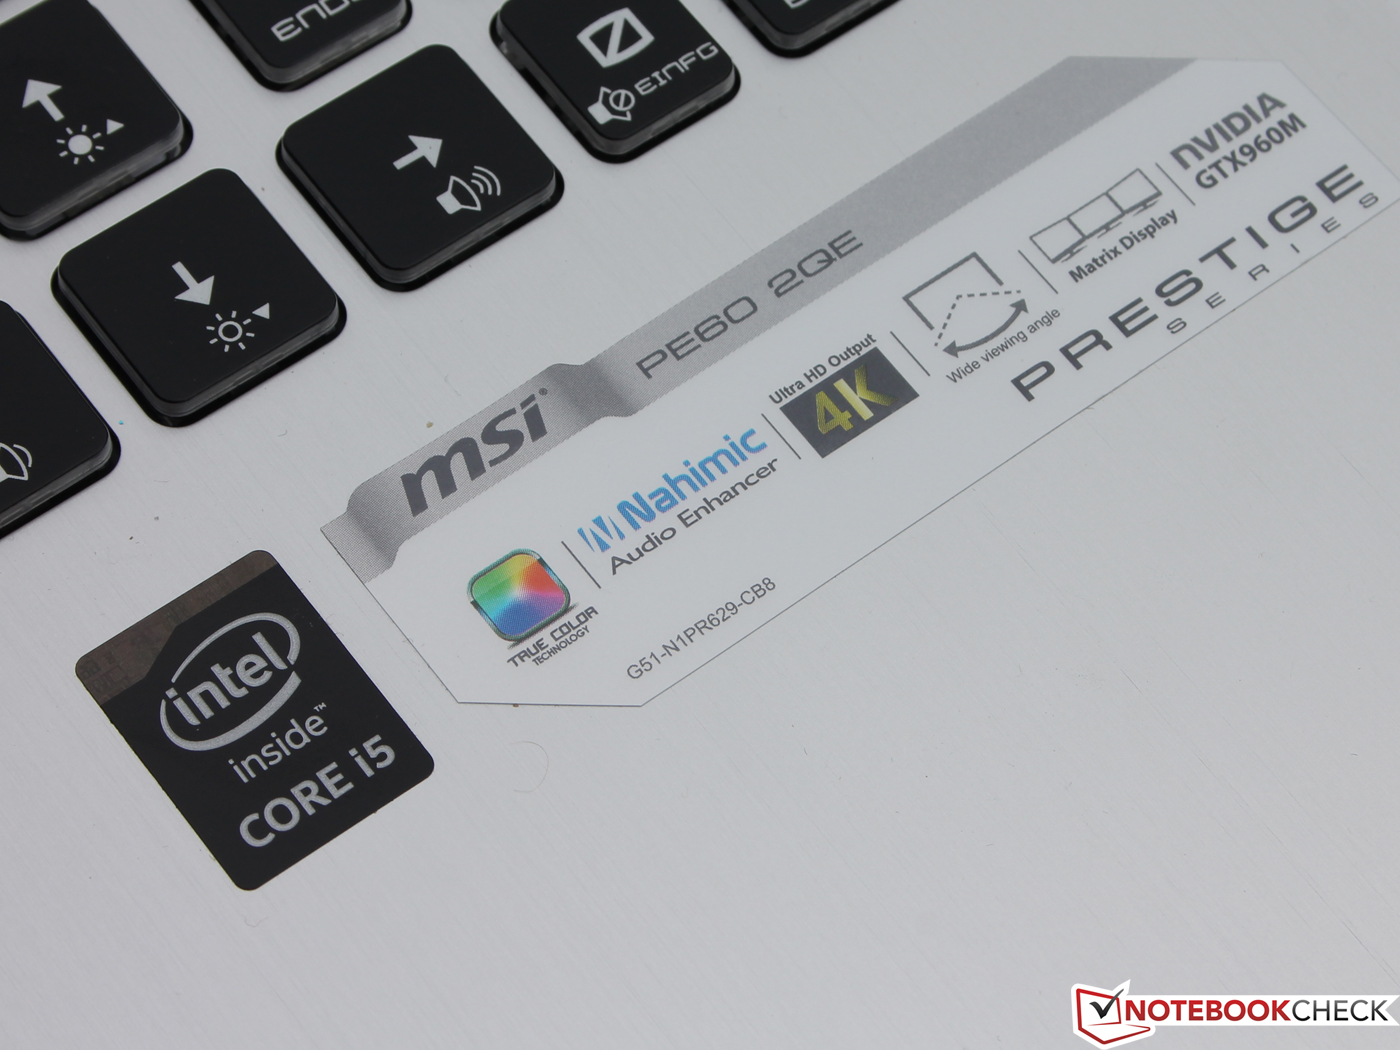
Breve análise do Portátil MSI PE60 2QE Prestige


| |||||||||||||||||||||||||
iluminação: 90 %
iluminação com acumulador: 251 cd/m²
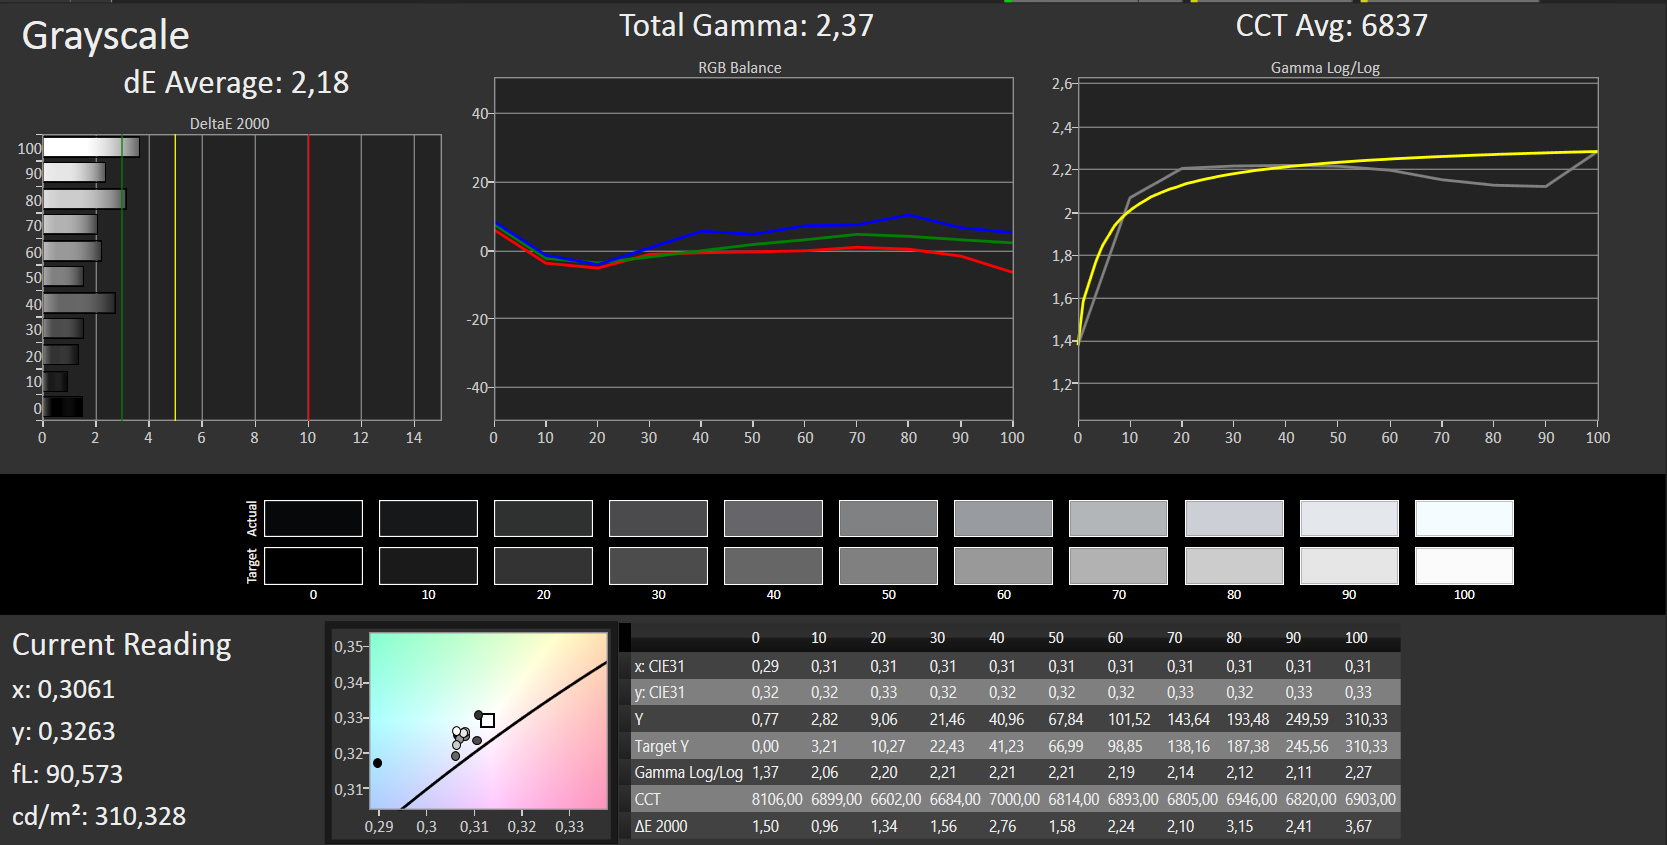
Contraste: 857:1 (Preto: 0.35 cd/m²)
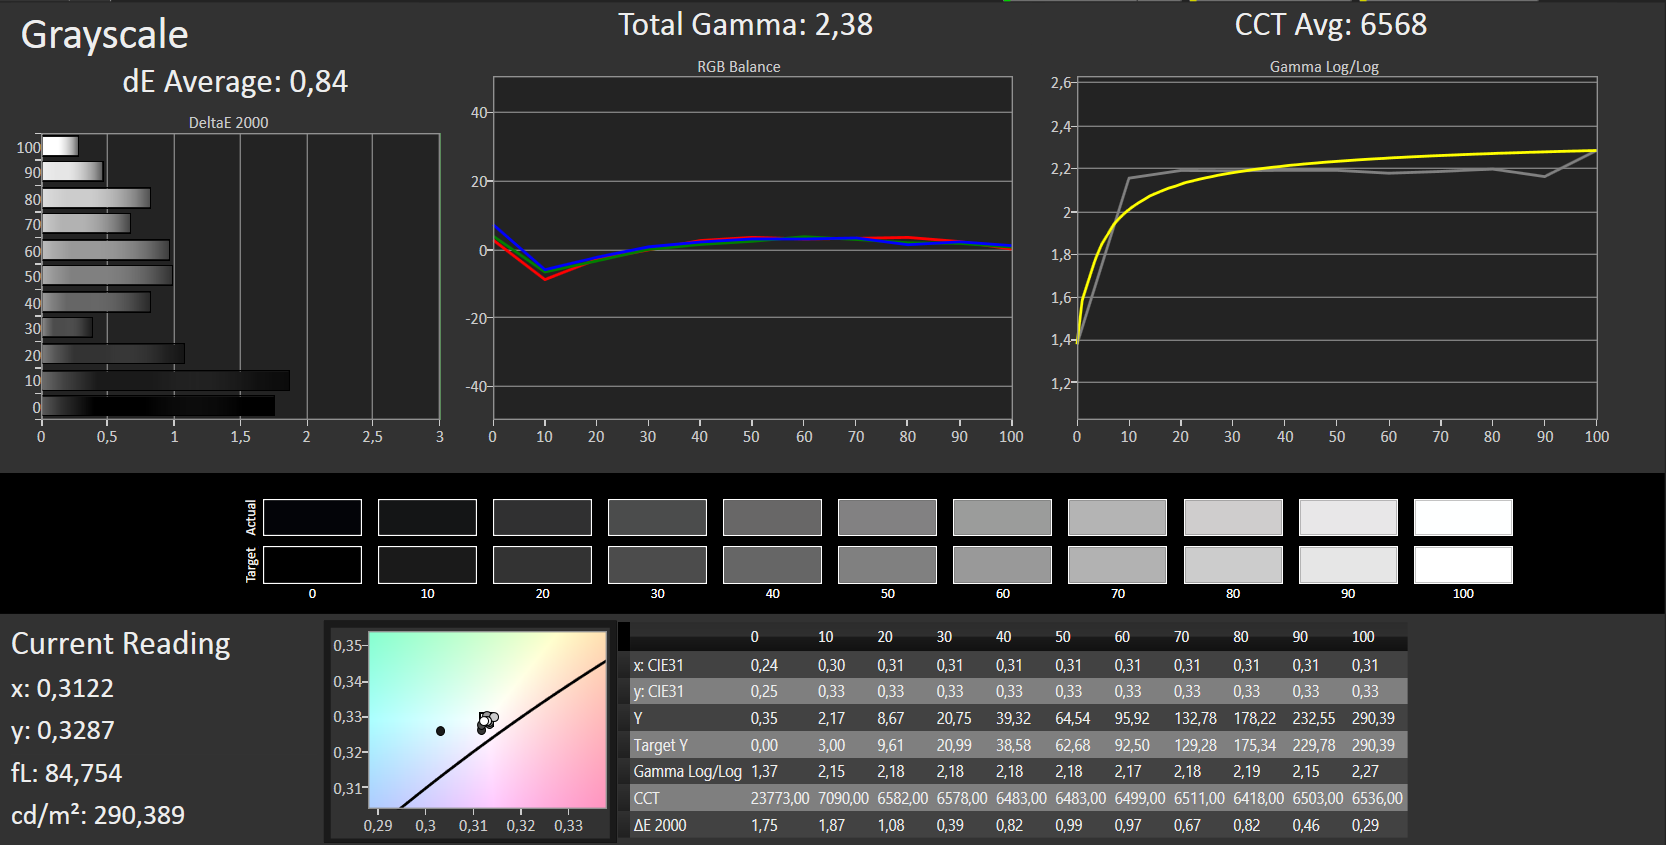
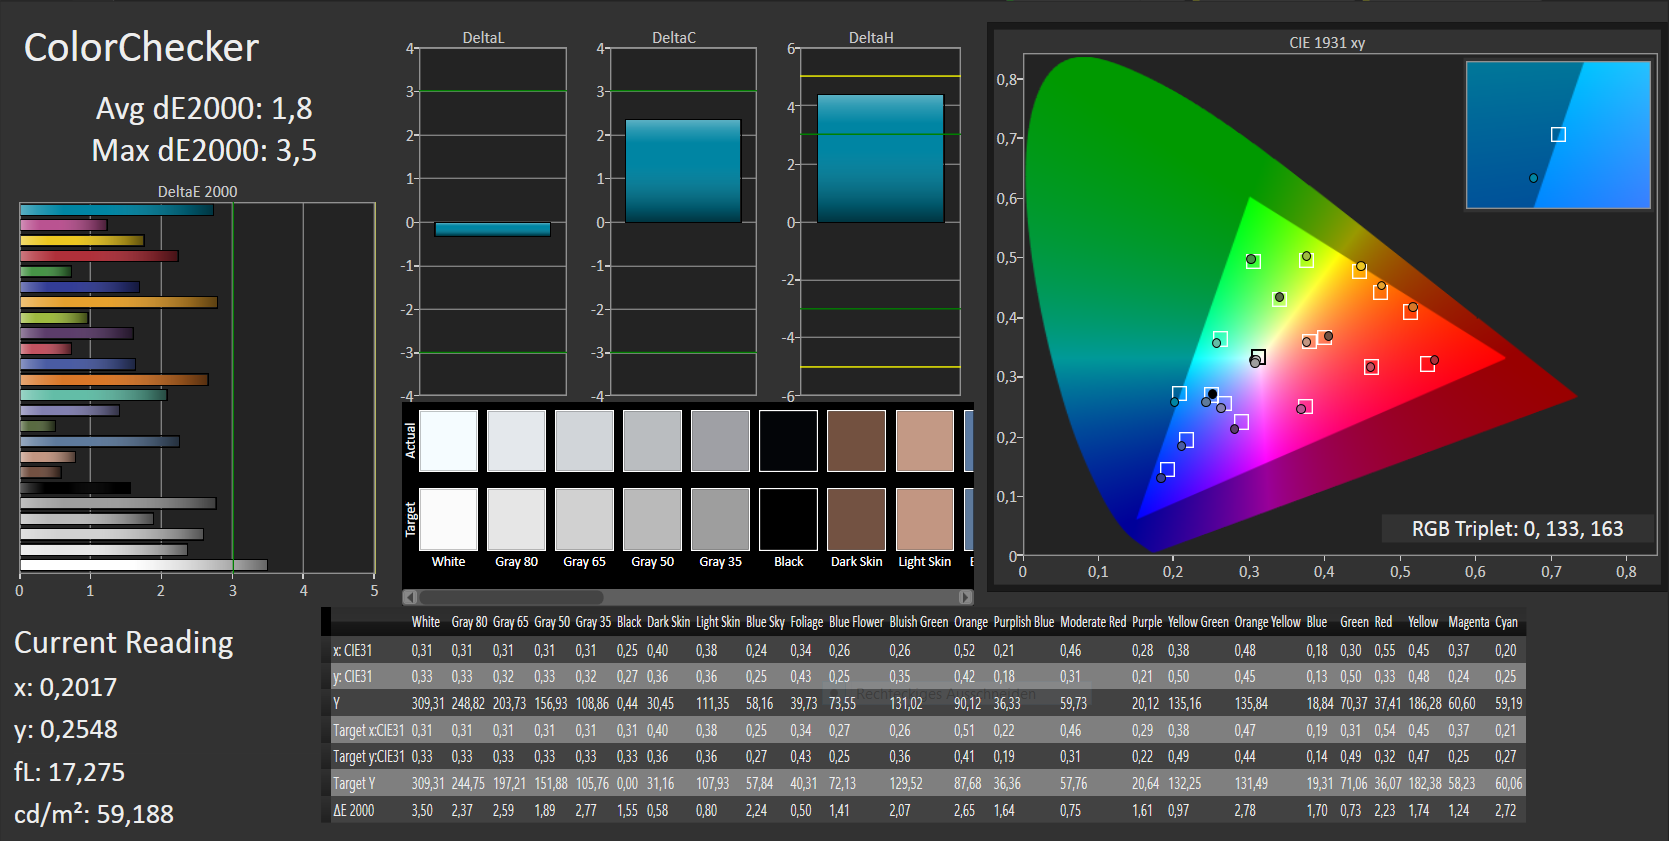
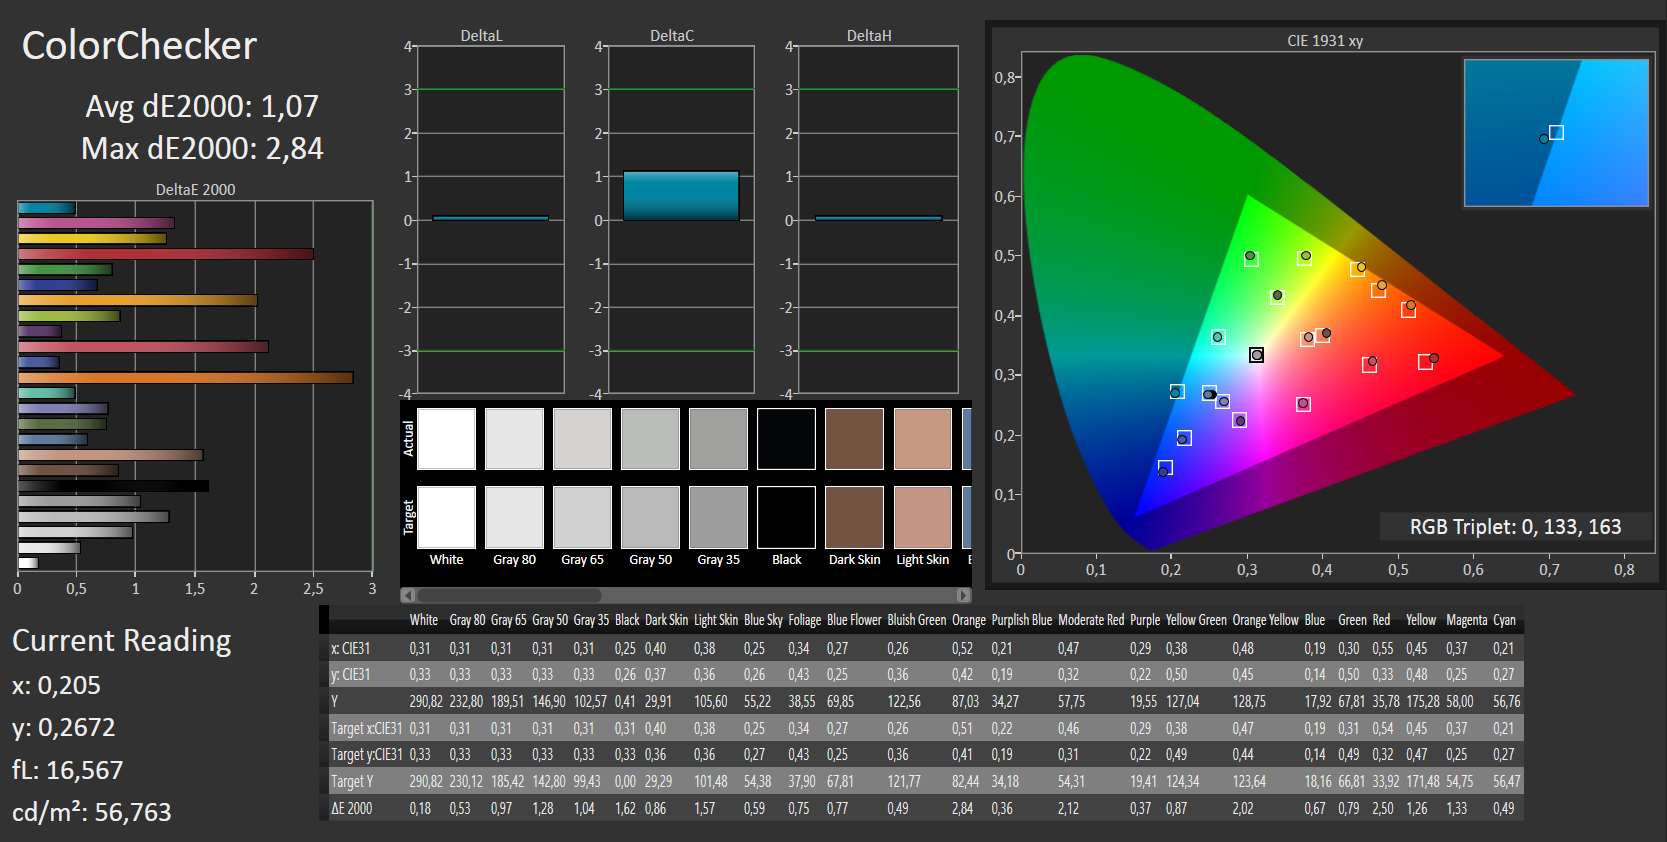
ΔE ColorChecker Calman: 1.8 | ∀{0.5-29.43 Ø4.72}
ΔE Greyscale Calman: 2.18 | ∀{0.09-98 Ø4.97}
97% sRGB (Argyll 1.6.3 3D)
64% AdobeRGB 1998 (Argyll 1.6.3 3D)
69.8% AdobeRGB 1998 (Argyll 3D)
97% sRGB (Argyll 3D)
67.6% Display P3 (Argyll 3D)
Gamma: 2.37
CCT: 6837 K
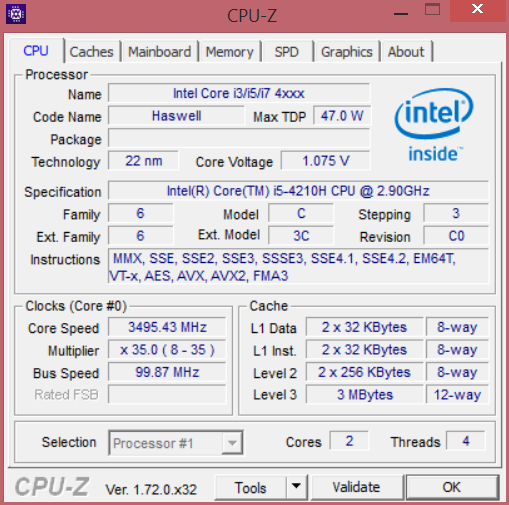
| MSI PE60-2QEi581 GeForce GTX 960M, 4210H, HGST Travelstar 7K1000 HTS721010A9E630 | Acer Aspire VN7-591G-727P GeForce GTX 960M, 4720HQ, Toshiba HG6 THNSNJ256G8NU | Asus N551JK-CN166H GeForce GTX 850M, 4200H, HGST Travelstar 5K1000 HTS541010A9E680 | Asus UX501JW-DS71T GeForce GTX 960M, 4720HQ, Samsung SSD SM951 512 GB MZHPV512HDGL | Toshiba Satellite P50t-B-10T Radeon R9 M265X, 4710HQ, Toshiba MQ01ABD100 | Dell XPS 15 (9530-0538) GeForce GT 750M, 4712HQ, Lite-On LMT-512L9M | |
|---|---|---|---|---|---|---|
| Display | -13% | -0% | -25% | -5% | -3% | |
| Display P3 Coverage (%) | 67.6 | 64.9 -4% | 67.3 0% | 50.2 -26% | 64.1 -5% | 64.9 -4% |
| sRGB Coverage (%) | 97 | 66.9 -31% | 96.7 0% | 75 -23% | 92.3 -5% | 96.1 -1% |
| AdobeRGB 1998 Coverage (%) | 69.8 | 66.9 -4% | 69.4 -1% | 51.8 -26% | 65.5 -6% | 66.9 -4% |
| Screen | -30% | -61% | -68% | 10% | -2% | |
| Brightness middle (cd/m²) | 300 | 322 7% | 323 8% | 278.1 -7% | 255 -15% | 349 16% |
| Brightness (cd/m²) | 282 | 325 15% | 312 11% | 281 0% | 248 -12% | 365 29% |
| Brightness Distribution (%) | 90 | 90 0% | 83 -8% | 89 -1% | 88 -2% | 87 -3% |
| Black Level * (cd/m²) | 0.35 | 0.37 -6% | 0.38 -9% | 0.293 16% | 0.18 49% | 0.282 19% |
| Contrast (:1) | 857 | 870 2% | 850 -1% | 949 11% | 1417 65% | 1238 44% |
| Colorchecker dE 2000 * | 1.8 | 3.77 -109% | 7.4 -311% | 8.78 -388% | 2 -11% | 2.65 -47% |
| Greyscale dE 2000 * | 2.18 | 5.36 -146% | 6.24 -186% | 6.29 -189% | 1.61 26% | 3.77 -73% |
| Gamma | 2.37 93% | 2.39 92% | 2.98 74% | 2.25 98% | 2.37 93% | 2.41 91% |
| CCT | 6837 95% | 7163 91% | 8098 80% | 6197 105% | 6462 101% | 6786 96% |
| Color Space (Percent of AdobeRGB 1998) (%) | 64 | 61 -5% | 69 8% | 48.31 -25% | 60 -6% | 61.02 -5% |
| Color Space (Percent of sRGB) (%) | 97 | 72.54 -25% | 92.1 -5% | 96.1 -1% | ||
| Média Total (Programa/Configurações) | -22% /
-26% | -31% /
-44% | -47% /
-57% | 3% /
6% | -3% /
-3% |
* ... menor é melhor
| Cinebench R11.5 | |
| CPU Single 64Bit (classificar por valor) | |
| MSI PE60-2QEi581 | |
| Acer Aspire VN7-591G-727P | |
| Asus N551JK-CN166H | |
| Asus UX501JW-DS71T | |
| Toshiba Satellite P50t-B-10T | |
| Dell XPS 15 (9530-0538) | |
| CPU Multi 64Bit (classificar por valor) | |
| MSI PE60-2QEi581 | |
| Acer Aspire VN7-591G-727P | |
| Asus N551JK-CN166H | |
| Asus UX501JW-DS71T | |
| Toshiba Satellite P50t-B-10T | |
| Dell XPS 15 (9530-0538) | |
| Cinebench R15 | |
| CPU Single 64Bit (classificar por valor) | |
| MSI PE60-2QEi581 | |
| Acer Aspire VN7-591G-727P | |
| Asus N551JK-CN166H | |
| Asus UX501JW-DS71T | |
| Toshiba Satellite P50t-B-10T | |
| Dell XPS 15 (9530-0538) | |
| CPU Multi 64Bit (classificar por valor) | |
| MSI PE60-2QEi581 | |
| Acer Aspire VN7-591G-727P | |
| Asus N551JK-CN166H | |
| Asus UX501JW-DS71T | |
| Toshiba Satellite P50t-B-10T | |
| Dell XPS 15 (9530-0538) | |
| MSI PE60-2QEi581 GeForce GTX 960M, 4210H, HGST Travelstar 7K1000 HTS721010A9E630 | Acer Aspire VN7-591G-727P GeForce GTX 960M, 4720HQ, Toshiba HG6 THNSNJ256G8NU | Asus N551JK-CN166H GeForce GTX 850M, 4200H, HGST Travelstar 5K1000 HTS541010A9E680 | Asus UX501JW-DS71T GeForce GTX 960M, 4720HQ, Samsung SSD SM951 512 GB MZHPV512HDGL | Toshiba Satellite P50t-B-10T Radeon R9 M265X, 4710HQ, Toshiba MQ01ABD100 | Dell XPS 15 (9530-0538) GeForce GT 750M, 4712HQ, Lite-On LMT-512L9M | |
|---|---|---|---|---|---|---|
| PCMark 7 | 83% | 29% | 86% | 25% | 47% | |
| Score (Points) | 3275 | 5804 77% | 4131 26% | 6087 86% | 5010 53% | 5549 69% |
| Productivity (Points) | 2014 | 5144 155% | 3494 73% | 2035 1% | 2782 38% | |
| Creativity (Points) | 6313 | 10418 65% | 7266 15% | 7924 26% | 10028 59% | |
| Computation (Points) | 14944 | 19805 33% | 15092 1% | 17704 18% | 17929 20% | |
| PCMark 8 | -9% | -4% | -4% | 9% | ||
| Work Score Accelerated v2 (Points) | 4169 | 3601 -14% | 3881 -7% | 3944 -5% | ||
| Home Score Accelerated v2 (Points) | 3114 | 3019 -3% | 3113 0% | 3064 -2% | 3386 9% | |
| Média Total (Programa/Configurações) | 37% /
52% | 13% /
18% | 41% /
26% | 17% /
21% | 47% /
47% |
| PCMark 7 Score | 3275 pontos | |
| PCMark 8 Home Score Accelerated v2 | 3114 pontos | |
| PCMark 8 Work Score Accelerated v2 | 4169 pontos | |
Ajuda | ||
| MSI PE60-2QEi581 GeForce GTX 960M, 4210H, HGST Travelstar 7K1000 HTS721010A9E630 | Acer Aspire VN7-591G-727P GeForce GTX 960M, 4720HQ, Toshiba HG6 THNSNJ256G8NU | Asus N551JK-CN166H GeForce GTX 850M, 4200H, HGST Travelstar 5K1000 HTS541010A9E680 | Asus UX501JW-DS71T GeForce GTX 960M, 4720HQ, Samsung SSD SM951 512 GB MZHPV512HDGL | Toshiba Satellite P50t-B-10T Radeon R9 M265X, 4710HQ, Toshiba MQ01ABD100 | Dell XPS 15 (9530-0538) GeForce GT 750M, 4712HQ, Lite-On LMT-512L9M | |
|---|---|---|---|---|---|---|
| CrystalDiskMark 3.0 | 1948% | -35% | 4343% | 2811% | ||
| Read 4k (MB/s) | 0.63 | 18.74 2875% | 0.326 -48% | 43.38 6786% | 32.41 5044% | |
| Write 4k (MB/s) | 1.2 | 54.2 4417% | 0.768 -36% | 107 8817% | 70.2 5750% | |
| Read Seq (MB/s) | 140.4 | 521 271% | 102.3 -27% | 1362 870% | 485.2 246% | |
| Write Seq (MB/s) | 140.1 | 460.2 228% | 102.3 -27% | 1400 899% | 425.4 204% |

| 3DMark 11 | |
| 1280x720 Performance (classificar por valor) | |
| MSI PE60-2QEi581 | |
| Acer Aspire VN7-591G-727P | |
| Asus N551JK-CN166H | |
| Asus UX501JW-DS71T | |
| Dell XPS 15 (9530-0538) | |
| 1280x720 Performance GPU (classificar por valor) | |
| MSI PE60-2QEi581 | |
| Acer Aspire VN7-591G-727P | |
| Asus N551JK-CN166H | |
| Asus UX501JW-DS71T | |
| Dell XPS 15 (9530-0538) | |
| 1280x720 Performance Physics (classificar por valor) | |
| MSI PE60-2QEi581 | |
| Acer Aspire VN7-591G-727P | |
| Asus N551JK-CN166H | |
| Asus UX501JW-DS71T | |
| Dell XPS 15 (9530-0538) | |
| 1280x720 Performance Combined (classificar por valor) | |
| MSI PE60-2QEi581 | |
| Acer Aspire VN7-591G-727P | |
| Asus N551JK-CN166H | |
| Asus UX501JW-DS71T | |
| Dell XPS 15 (9530-0538) | |
| 3DMark 11 Performance | 4999 pontos | |
| 3DMark Ice Storm Standard Score | 51289 pontos | |
| 3DMark Cloud Gate Standard Score | 10596 pontos | |
| 3DMark Fire Strike Score | 3778 pontos | |
Ajuda | ||
| Alien: Isolation | |
| 1366x768 Medium, On (AA & SSAO Off), Shadow Map 1024 AF:4x (classificar por valor) | |
| MSI PE60-2QEi581 | |
| 1920x1080 High, On, Shadow Map 1536, Standard SSAO AA:FX AF:8x (classificar por valor) | |
| MSI PE60-2QEi581 | |
| 1920x1080 Ultra, On, Shadow Map 2048, HDAO AA:2x SM AF:16x (classificar por valor) | |
| MSI PE60-2QEi581 | |
| F1 2014 | |
| 1366x768 Medium Preset (classificar por valor) | |
| MSI PE60-2QEi581 | |
| Acer Aspire VN7-591G-727P | |
| 1920x1080 High Preset (classificar por valor) | |
| MSI PE60-2QEi581 | |
| Acer Aspire VN7-591G-727P | |
| 1920x1080 Ultra Preset AA:4x MS (classificar por valor) | |
| MSI PE60-2QEi581 | |
| Acer Aspire VN7-591G-727P | |
| Evolve | |
| 1366x768 Medium Graphics Quality (classificar por valor) | |
| MSI PE60-2QEi581 | |
| Acer Aspire VN7-591G-727P | |
| 1920x1080 High Graphics Quality AA:FX (classificar por valor) | |
| MSI PE60-2QEi581 | |
| Acer Aspire VN7-591G-727P | |
| 1920x1080 Very High Graphics Quality AA:1TX SM (classificar por valor) | |
| MSI PE60-2QEi581 | |
| Acer Aspire VN7-591G-727P | |
| baixo | média | alto | ultra | |
|---|---|---|---|---|
| Alien: Isolation (2014) | 109 | 62 | 46.5 | |
| F1 2014 (2014) | 83 | 72 | 62 | |
| Evolve (2015) | 65.6 | 35.5 | 31.1 |
| MSI PE60-2QEi581 GeForce GTX 960M, 4210H, HGST Travelstar 7K1000 HTS721010A9E630 | Acer Aspire VN7-591G-727P GeForce GTX 960M, 4720HQ, Toshiba HG6 THNSNJ256G8NU | Asus N551JK-CN166H GeForce GTX 850M, 4200H, HGST Travelstar 5K1000 HTS541010A9E680 | Asus UX501JW-DS71T GeForce GTX 960M, 4720HQ, Samsung SSD SM951 512 GB MZHPV512HDGL | Toshiba Satellite P50t-B-10T Radeon R9 M265X, 4710HQ, Toshiba MQ01ABD100 | Dell XPS 15 (9530-0538) GeForce GT 750M, 4712HQ, Lite-On LMT-512L9M | |
|---|---|---|---|---|---|---|
| Noise | 5% | 3% | 5% | 1% | 4% | |
| Idle Minimum * (dB) | 32.8 | 30 9% | 32.1 2% | 31.2 5% | 32.4 1% | 29.6 10% |
| Idle Average * (dB) | 32.8 | 32.2 2% | 32.9 -0% | 31.3 5% | 33.4 -2% | 31.6 4% |
| Idle Maximum * (dB) | 35.4 | 35 1% | 33.7 5% | 33.4 6% | 33.4 6% | 31.6 11% |
| Load Average * (dB) | 42.3 | 41.7 1% | 42 1% | 38.6 9% | 44.5 -5% | 45.4 -7% |
| Load Maximum * (dB) | 47.4 | 42.6 10% | 44.8 5% | 46.5 2% | 44.4 6% | 45.4 4% |
* ... menor é melhor
Barulho
| Ocioso |
| 32.8 / 32.8 / 35.4 dB |
| HDD |
| 33.6 dB |
| DVD |
| 37.7 / dB |
| Carga |
| 42.3 / 47.4 dB |
 | ||
30 dB silencioso 40 dB(A) audível 50 dB(A) ruidosamente alto |
||
min: | ||
| MSI PE60-2QEi581 GeForce GTX 960M, 4210H, HGST Travelstar 7K1000 HTS721010A9E630 | Acer Aspire VN7-591G-727P GeForce GTX 960M, 4720HQ, Toshiba HG6 THNSNJ256G8NU | Asus N551JK-CN166H GeForce GTX 850M, 4200H, HGST Travelstar 5K1000 HTS541010A9E680 | Asus UX501JW-DS71T GeForce GTX 960M, 4720HQ, Samsung SSD SM951 512 GB MZHPV512HDGL | Toshiba Satellite P50t-B-10T Radeon R9 M265X, 4710HQ, Toshiba MQ01ABD100 | Dell XPS 15 (9530-0538) GeForce GT 750M, 4712HQ, Lite-On LMT-512L9M | |
|---|---|---|---|---|---|---|
| Heat | -21% | 17% | -1% | 5% | -27% | |
| Maximum Upper Side * (°C) | 45.5 | 53 -16% | 39.4 13% | 42.2 7% | 43.5 4% | 51.8 -14% |
| Maximum Bottom * (°C) | 37.5 | 53.2 -42% | 37.6 -0% | 48.6 -30% | 46 -23% | 64.6 -72% |
| Idle Upper Side * (°C) | 35.8 | 38.6 -8% | 28.7 20% | 33.2 7% | 28 22% | 38.4 -7% |
| Idle Bottom * (°C) | 38.7 | 45.9 -19% | 26.1 33% | 34.4 11% | 32.8 15% | 44.4 -15% |
* ... menor é melhor
(-) A temperatura máxima no lado superior é 45.5 °C / 114 F, em comparação com a média de 36.8 °C / 98 F , variando de 21 a 71 °C para a classe Multimedia.
(+) A parte inferior aquece até um máximo de 37.5 °C / 100 F, em comparação com a média de 39.1 °C / 102 F
(±) Em uso inativo, a temperatura média para o lado superior é 32.2 °C / 90 F, em comparação com a média do dispositivo de 31.3 °C / ### class_avg_f### F.
(±) Os apoios para as mãos e o touchpad podem ficar muito quentes ao toque, com um máximo de 38.8 °C / 101.8 F.
(-) A temperatura média da área do apoio para as mãos de dispositivos semelhantes foi 28.7 °C / 83.7 F (-10.1 °C / -18.1 F).
| MSI PE60-2QEi581 GeForce GTX 960M, 4210H, HGST Travelstar 7K1000 HTS721010A9E630 | Acer Aspire VN7-591G-727P GeForce GTX 960M, 4720HQ, Toshiba HG6 THNSNJ256G8NU | Asus N551JK-CN166H GeForce GTX 850M, 4200H, HGST Travelstar 5K1000 HTS541010A9E680 | Toshiba Satellite P50t-B-10T Radeon R9 M265X, 4710HQ, Toshiba MQ01ABD100 | Dell XPS 15 (9530-0538) GeForce GT 750M, 4712HQ, Lite-On LMT-512L9M | |
|---|---|---|---|---|---|
| Power Consumption | 10% | 39% | 28% | 22% | |
| Idle Minimum * (Watt) | 21.8 | 16.2 26% | 8.6 61% | 12.8 41% | 14.6 33% |
| Idle Average * (Watt) | 26.1 | 20.2 23% | 12 54% | 18.8 28% | 19.6 25% |
| Idle Maximum * (Watt) | 26.6 | 22.8 14% | 13 51% | 19 29% | 19.8 26% |
| Load Average * (Watt) | 88.5 | 96.4 -9% | 72.2 18% | 66.7 25% | 92 -4% |
| Load Maximum * (Watt) | 119.7 | 126.9 -6% | 104 13% | 99.1 17% | 85.8 28% |
* ... menor é melhor
| desligado | |
| Ocioso | |
| Carga |
|
Key:
min: | |
| Duração da bateria | |
| WiFi v1.3 (classificar por valor) | |
| MSI PE60-2QEi581 | |
| Acer Aspire VN7-591G-727P | |
| Asus UX501JW-DS71T | |
| Dell XPS 15 (9530-0538) | |
| WiFi (classificar por valor) | |
| Asus N551JK-CN166H | |
| Toshiba Satellite P50t-B-10T | |
Pro
Contra
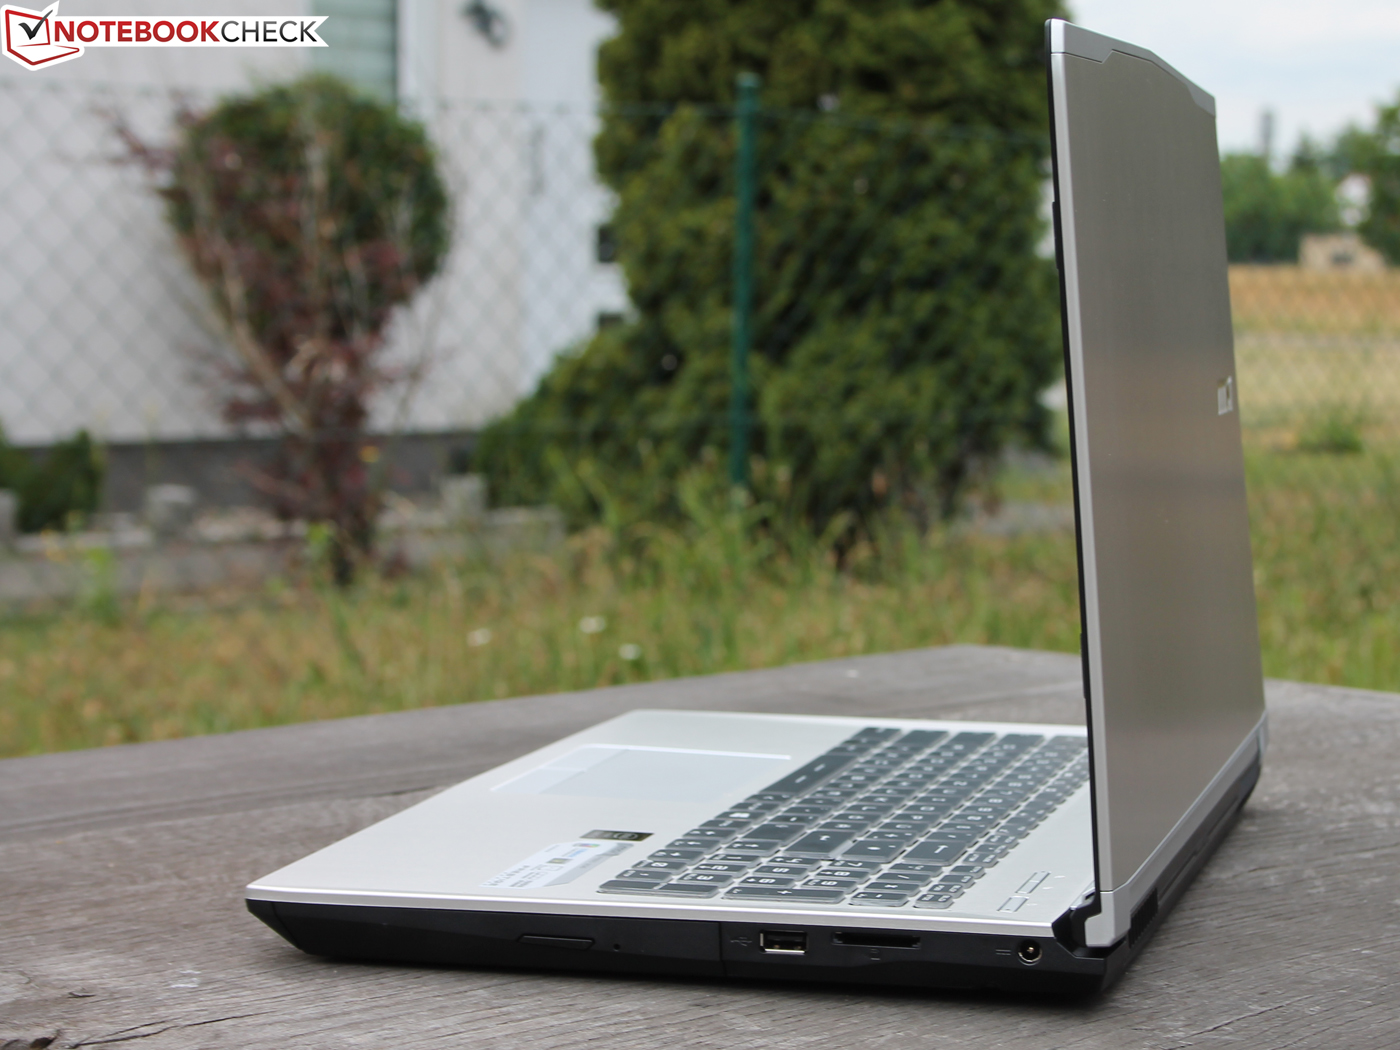
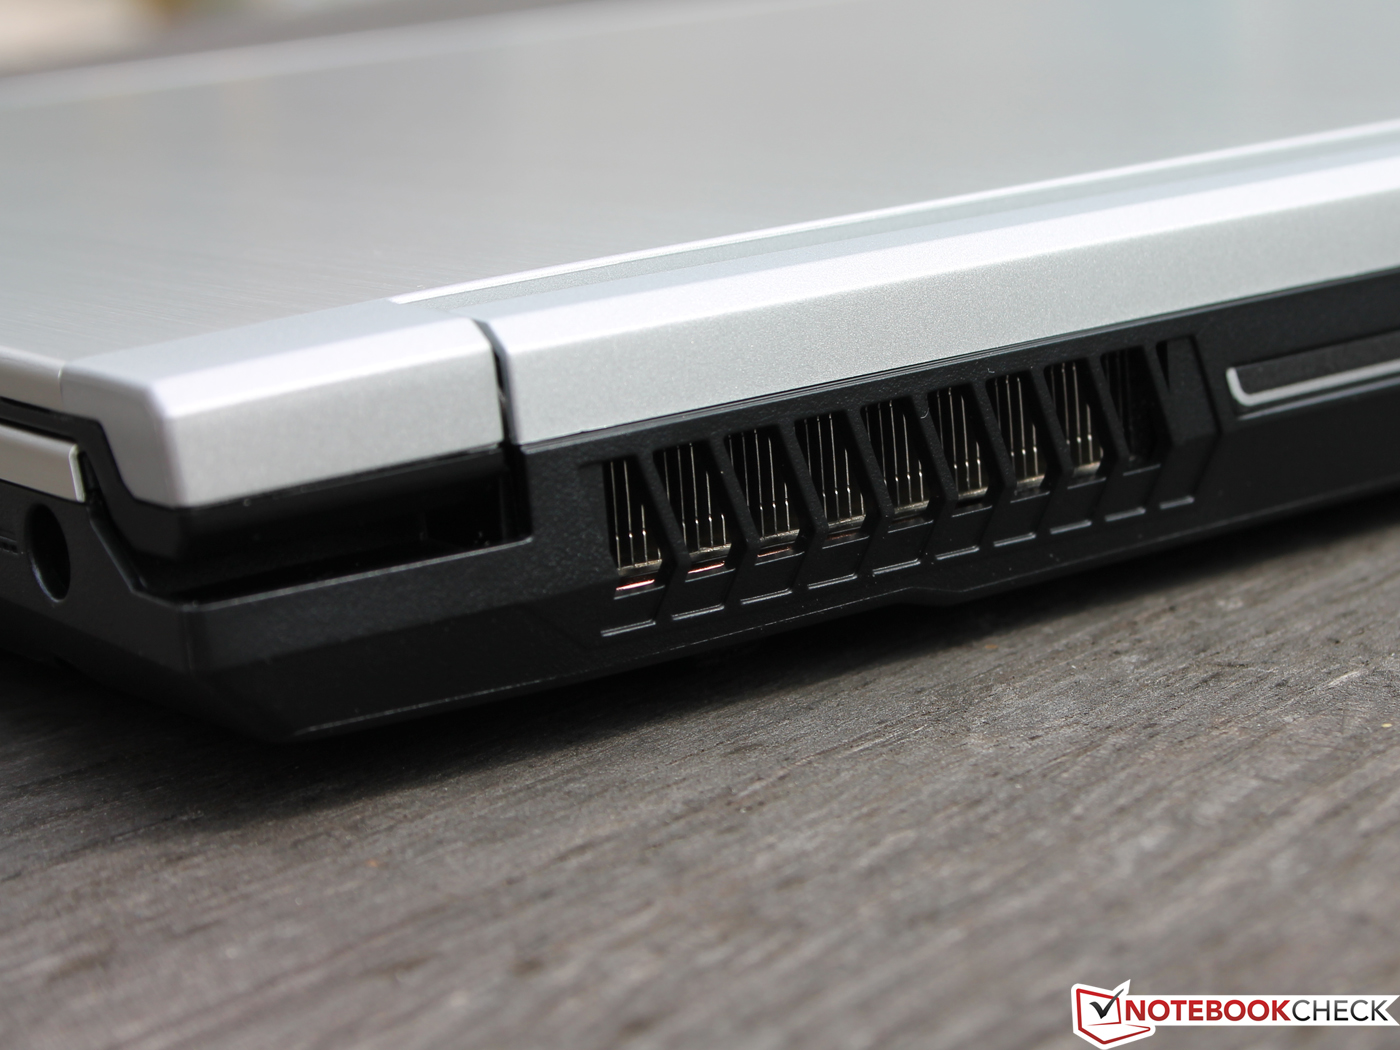
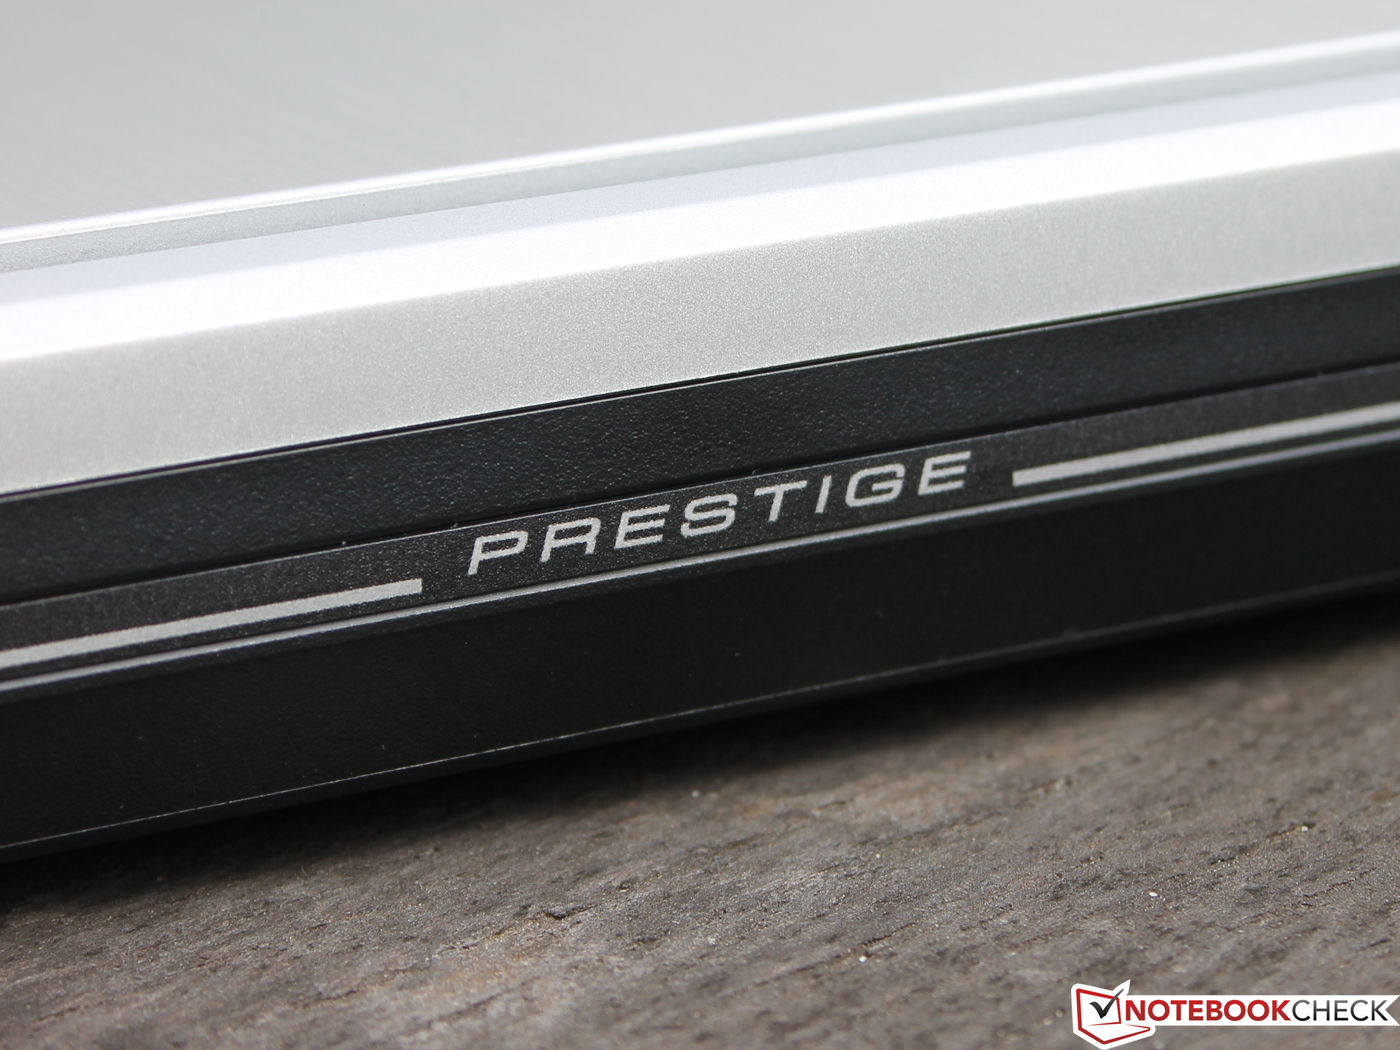
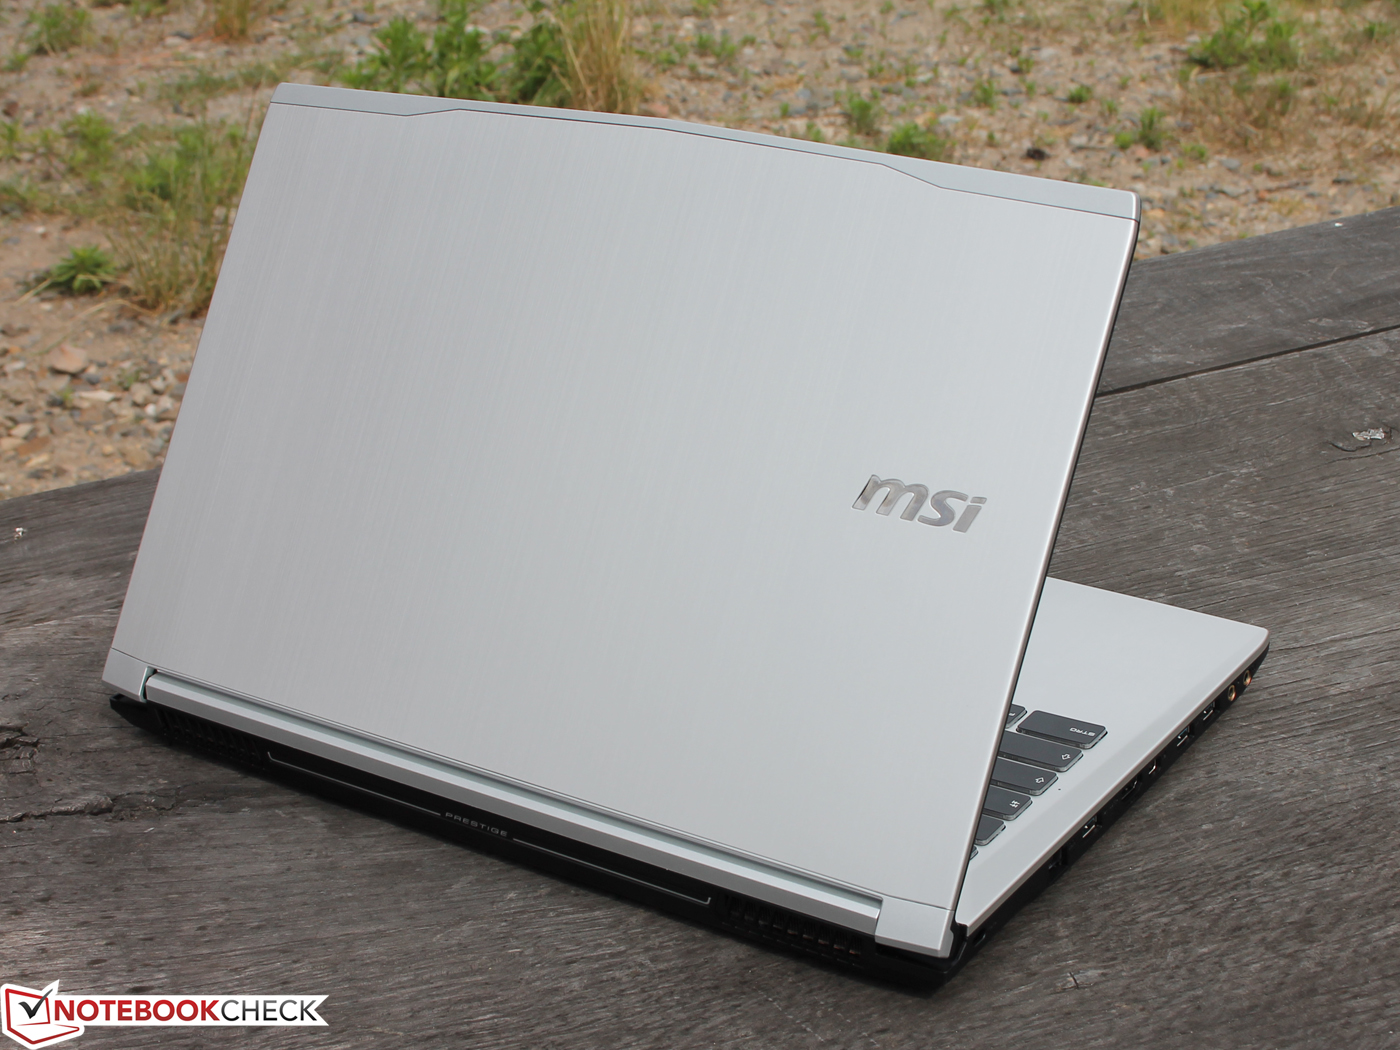
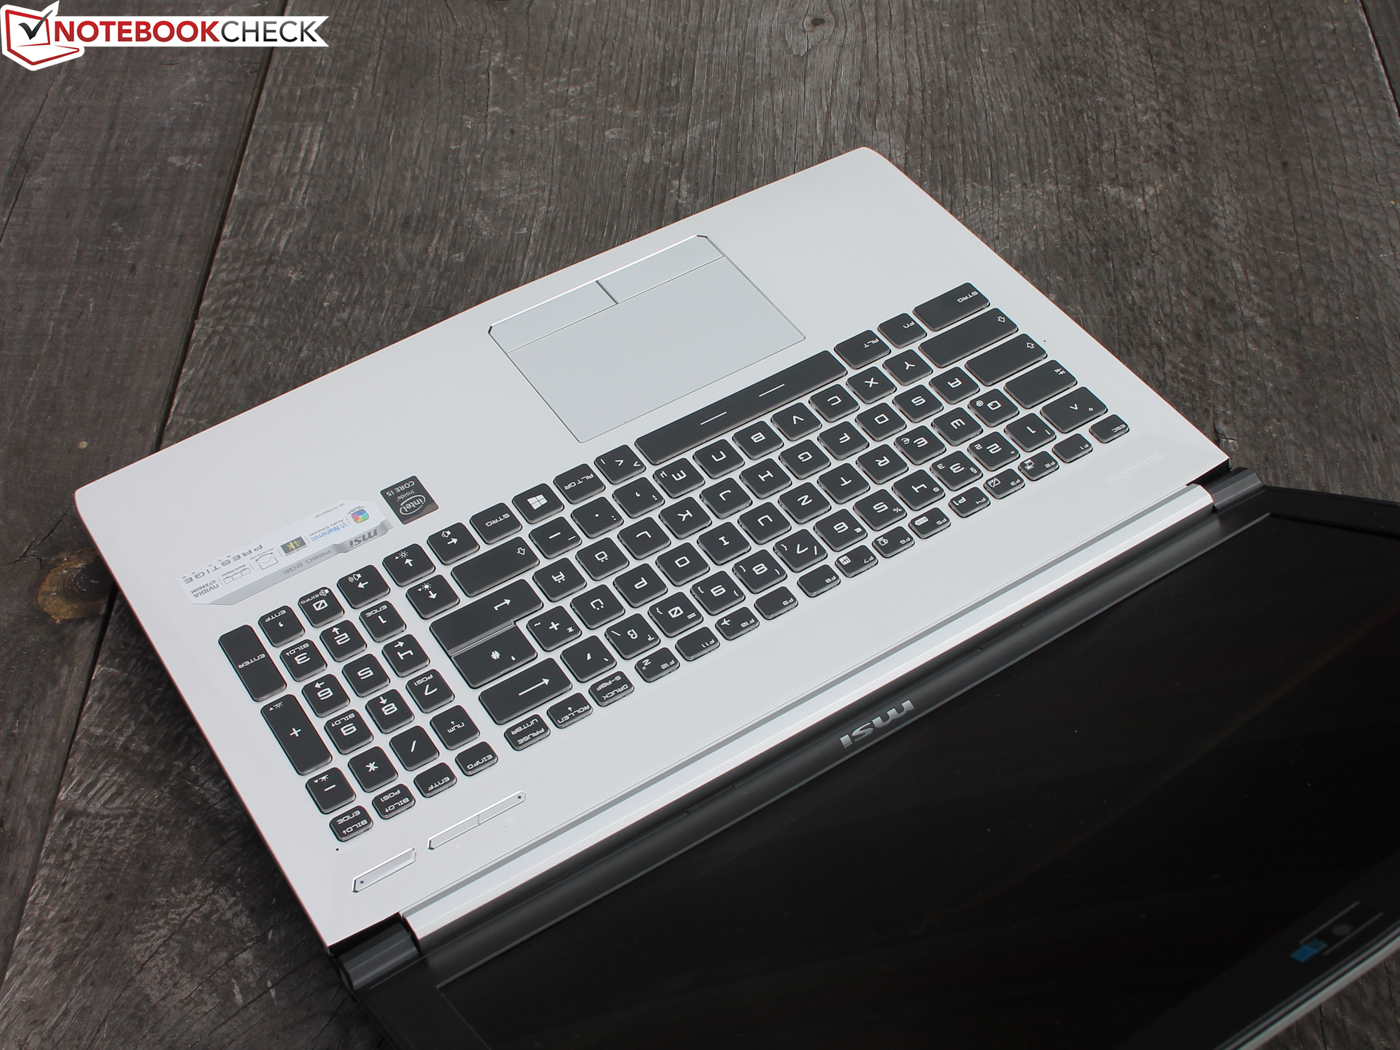
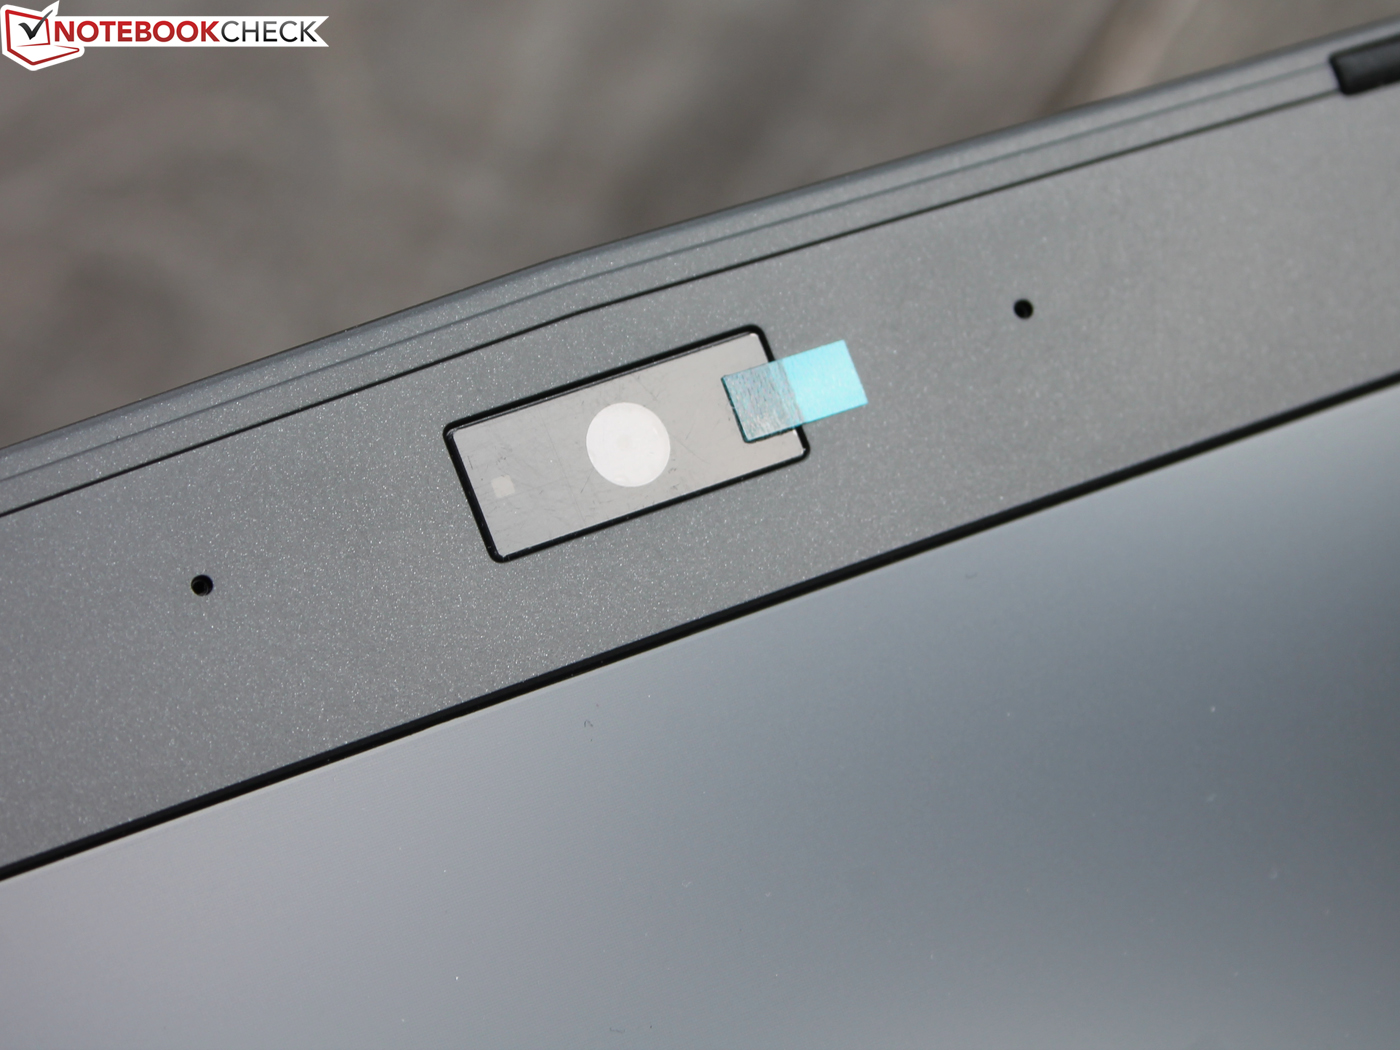
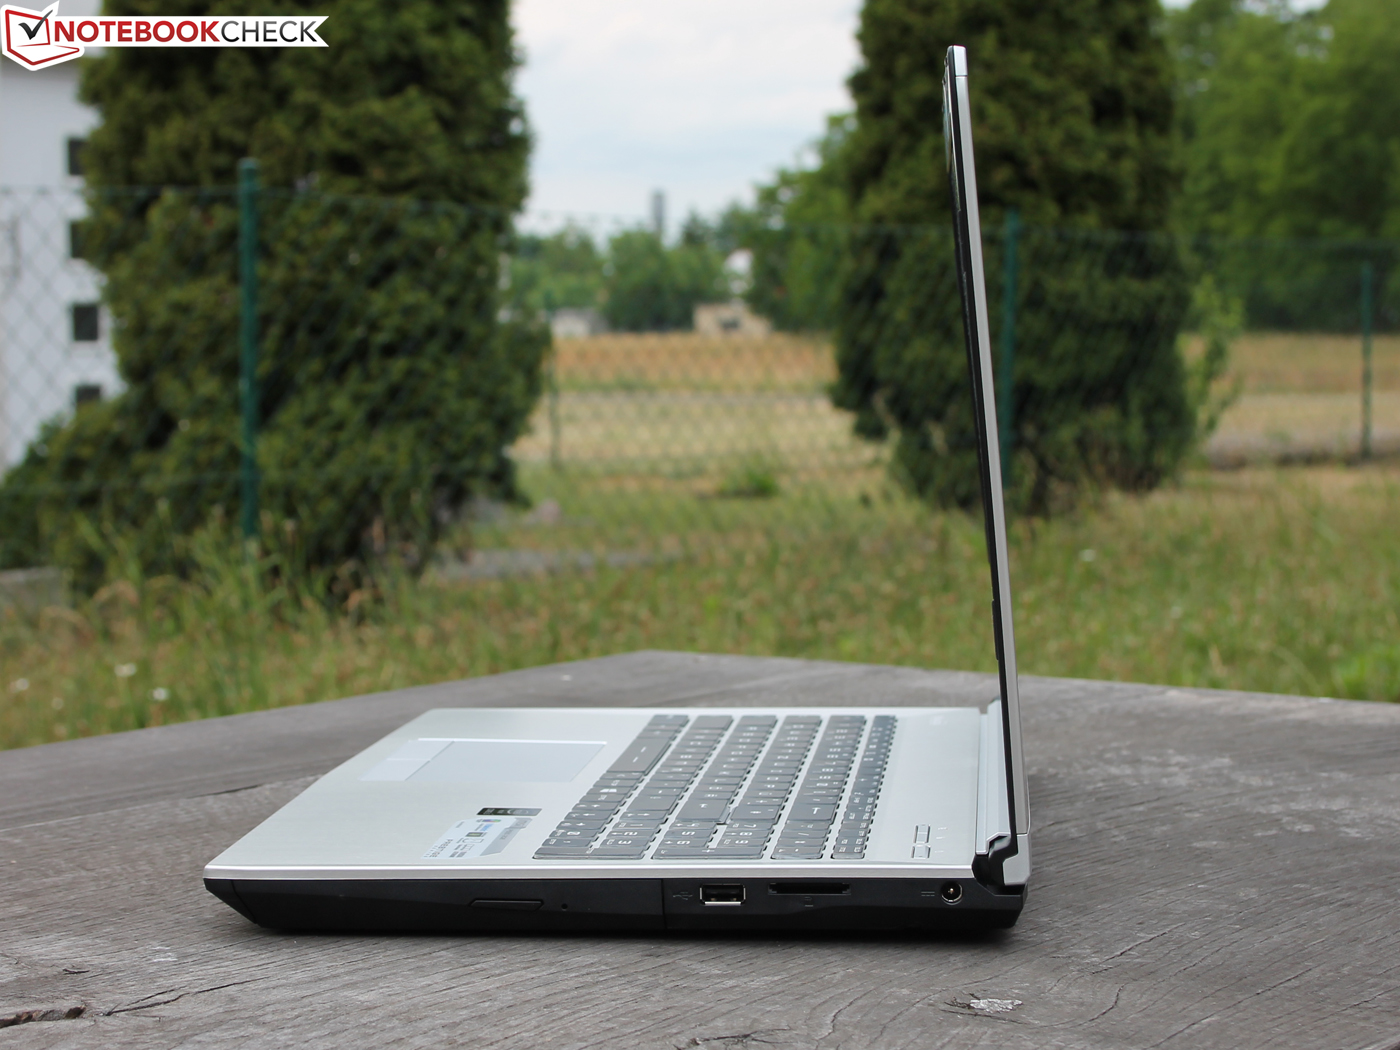
A se esforçou muito para ganhar partes do mercado no setor de portáteis premium de preço elevado com a sua série Prestige. A tela PLS da Samsung com a cobertura sRGB e os ângulos de visão de primeira categoria, junto com a superfície mate certamente é uma de suas maiores fortalezas. A adequação dos jogos para os jogos atuais com configurações altas e um desempenho do sistema surpreendentemente alto com um disco rígido de 7200-rpm seguem isso. Os sistema de resfriamento de duas ventoinhas garante temperaturas moderadas a um nível de ruído aceitável. No entanto, o consumo de energia no modo inativo é consideravelmente maior que o da concorrência. Por outro lado, os alto falantes de 4-canais e o subwoofer são dignos de um genuíno portátil multimídia (Perfil de áudio Nahimic). O mesmo também é verdade para a diversidade de interfaces (DisplayPort, 2 conectores de áudio banhados a ouro), mas não da pobre qualidade de imagem da webcam. Inclusive é possível fazer a manutenção do relativamente compacto PE60, e um SSD, por exemplo, pode ser instalado via o slot M.2.
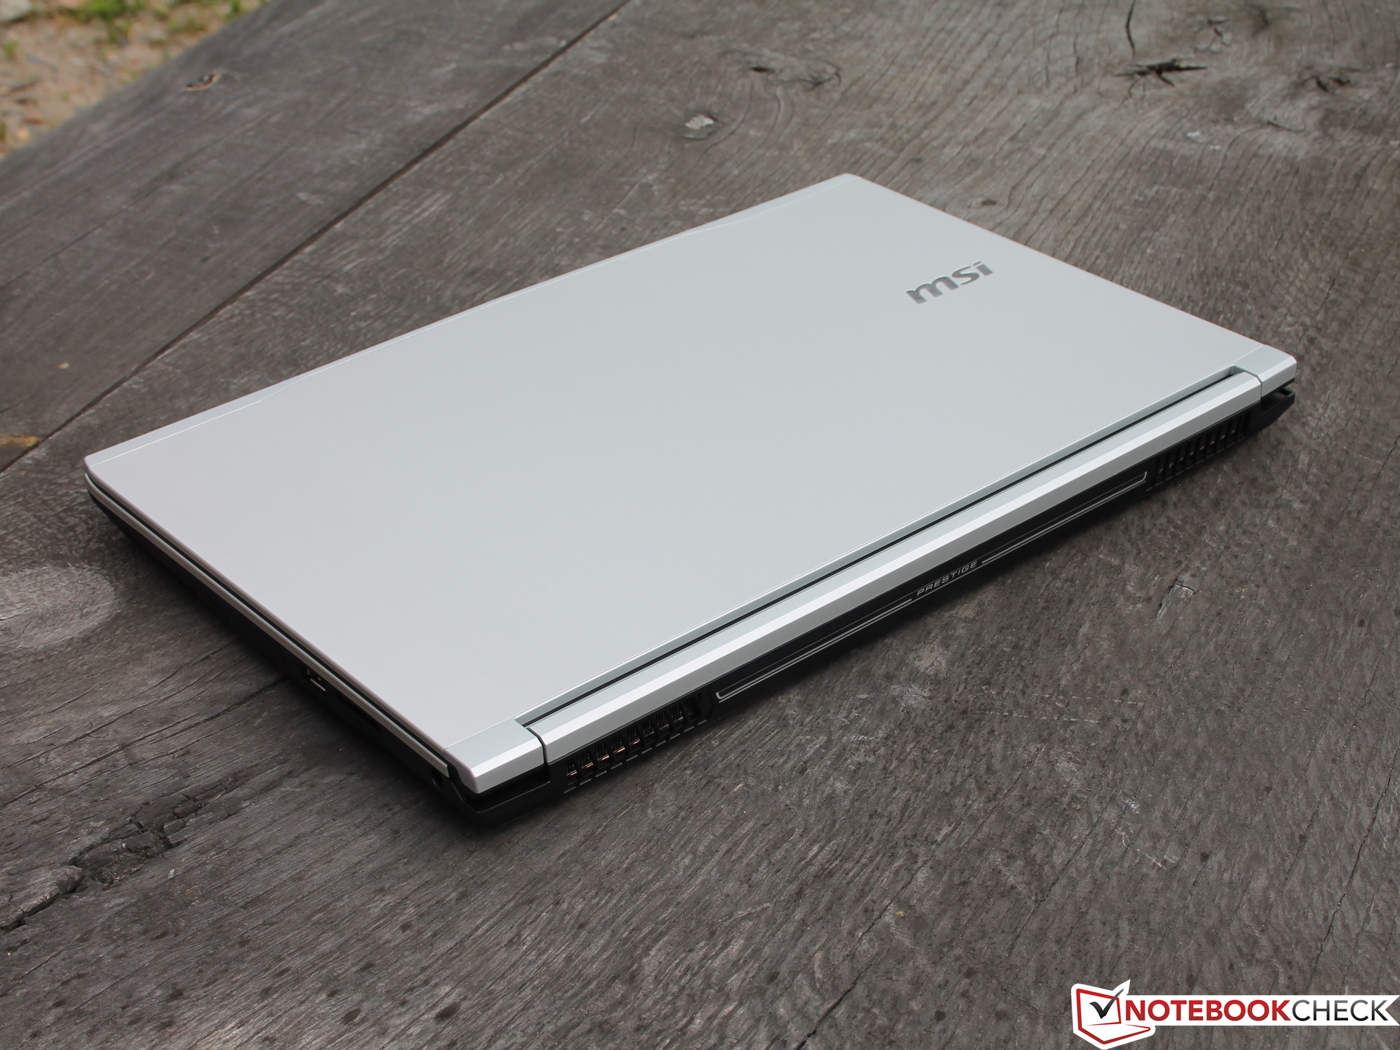
O chassi plástico comparativamente simples e as curtas durações da bateria de menos de três horas são as desvantagens. O ZenBook UX501 e o Dell XPS 15 têm uma borda evidente aqui. O XPS 15 atualmente não ganhará a comparação com o seu muito antigo GeForce GT 750M. O ZenBook Pro UX501 é consideravelmente mais caro com um preço inicial de 1600 Euros (~$1780). E por isso, o Acer Aspire VN7-591G Black Edition (1600 Euros/~$1780, 4K; configuração muito mais econômica com FHD, GTX 860M), Asus N551JK(a partir de 990 Euros/~$1100, GTX 850M), e o Toshiba Satellite P50t-B-10T (1400 Euros/~$1560, 4K, Radeon R9 M265X) provavelmente sejam os rivais mais atraentes.
Esta é uma versão reduzida da análise original. Você pode ler a análise completa em inglês aqui.
MSI PE60-2QEi581
- 03/25/2016 v5 (old)
Sebastian Jentsch