Breve Análise do Portátil MSI PE60 6QE Prestige iBuyPower Edition


| |||||||||||||||||||||||||
iluminação: 86 %
iluminação com acumulador: 200.1 cd/m²
Contraste: 466:1 (Preto: 0.429 cd/m²)
ΔE ColorChecker Calman: 10.63 | ∀{0.5-29.43 Ø4.71}
ΔE Greyscale Calman: 11.51 | ∀{0.09-98 Ø4.96}
99.8% sRGB (Argyll 1.6.3 3D)
74.6% AdobeRGB 1998 (Argyll 1.6.3 3D)
84.2% AdobeRGB 1998 (Argyll 3D)
99.8% sRGB (Argyll 3D)
86% Display P3 (Argyll 3D)
Gamma: 2.23
CCT: 14492 K
| MSI PE60 6QE-056XUS 15.6", 1920x1080 | HP ZBook 15 G3 15.6", 1920x1080 | Lenovo Ideapad Y700 15ISK 80NW 15.6", 1920x1080 | Asus G501VW-FY081T 15.6", 1920x1080 | Dell XPS 15 9550 i7 FHD 15.6", 1920x1080 | |
|---|---|---|---|---|---|
| Display | -15% | -50% | -15% | -13% | |
| Display P3 Coverage (%) | 86 | 66.8 -22% | 38.55 -55% | 66.8 -22% | 68.5 -20% |
| sRGB Coverage (%) | 99.8 | 95.5 -4% | 57.6 -42% | 97.3 -3% | 97.2 -3% |
| AdobeRGB 1998 Coverage (%) | 84.2 | 69 -18% | 39.86 -53% | 68.6 -19% | 70.4 -16% |
| Response Times | -27% | 10% | -28% | -64% | |
| Response Time Grey 50% / Grey 80% * (ms) | 43.6 ? | 54 ? -24% | 40.8 ? 6% | 50 ? -15% | 64 ? -47% |
| Response Time Black / White * (ms) | 27.6 ? | 35.6 ? -29% | 24 ? 13% | 39 ? -41% | 50 ? -81% |
| PWM Frequency (Hz) | 1000 ? | 198 ? | 58.1 | 200 ? | |
| Screen | 33% | 18% | 44% | 54% | |
| Brightness middle (cd/m²) | 200.1 | 306 53% | 258.6 29% | 341 70% | 371.5 86% |
| Brightness (cd/m²) | 194 | 289 49% | 242 25% | 312 61% | 356 84% |
| Brightness Distribution (%) | 86 | 85 -1% | 88 2% | 83 -3% | 92 7% |
| Black Level * (cd/m²) | 0.429 | 0.34 21% | 0.277 35% | 0.32 25% | 0.252 41% |
| Contrast (:1) | 466 | 900 93% | 934 100% | 1066 129% | 1474 216% |
| Colorchecker dE 2000 * | 10.63 | 5.1 52% | 8.1 24% | 4.23 60% | 5.55 48% |
| Colorchecker dE 2000 max. * | 18.19 | 9.9 46% | 8.02 56% | 10.95 40% | |
| Greyscale dE 2000 * | 11.51 | 7.4 36% | 7.23 37% | 4.69 59% | 7.1 38% |
| Gamma | 2.23 99% | 2.37 93% | 1.99 111% | 2.53 87% | 2.1 105% |
| CCT | 14492 45% | 7263 89% | 6567 99% | 7549 86% | |
| Color Space (Percent of AdobeRGB 1998) (%) | 74.6 | 63 -16% | 36.5 -51% | 63 -16% | 63.4 -15% |
| Color Space (Percent of sRGB) (%) | 99.8 | 95 -5% | 57.2 -43% | 97 -3% | 97.9 -2% |
| Média Total (Programa/Configurações) | -3% /
15% | -7% /
2% | 0% /
23% | -8% /
25% |
* ... menor é melhor
Exibir tempos de resposta
| ↔ Tempo de resposta preto para branco | ||
|---|---|---|
| 27.6 ms ... ascensão ↗ e queda ↘ combinadas | ↗ 10 ms ascensão | 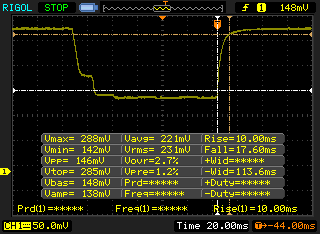 |
| ↘ 17.6 ms queda | ||
| A tela mostra taxas de resposta relativamente lentas em nossos testes e pode ser muito lenta para os jogadores. Em comparação, todos os dispositivos testados variam de 0.1 (mínimo) a 240 (máximo) ms. » 70 % de todos os dispositivos são melhores. Isso significa que o tempo de resposta medido é pior que a média de todos os dispositivos testados (19.8 ms). | ||
| ↔ Tempo de resposta 50% cinza a 80% cinza | ||
| 43.6 ms ... ascensão ↗ e queda ↘ combinadas | ↗ 22 ms ascensão | 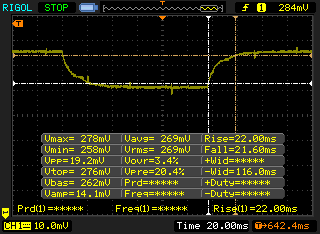 |
| ↘ 21.6 ms queda | ||
| A tela mostra taxas de resposta lentas em nossos testes e será insatisfatória para os jogadores. Em comparação, todos os dispositivos testados variam de 0.165 (mínimo) a 636 (máximo) ms. » 73 % de todos os dispositivos são melhores. Isso significa que o tempo de resposta medido é pior que a média de todos os dispositivos testados (31 ms). | ||
Cintilação da tela / PWM (modulação por largura de pulso)
| Tela tremeluzindo/PWM detectado | 1000 Hz | ≤ 99 % configuração de brilho | 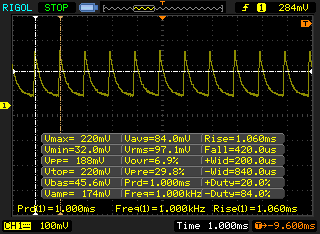 |
A luz de fundo da tela pisca em 1000 Hz (pior caso, por exemplo, utilizando PWM) Cintilação detectada em uma configuração de brilho de 99 % e abaixo. Não deve haver cintilação ou PWM acima desta configuração de brilho. A frequência de 1000 Hz é bastante alta, então a maioria dos usuários sensíveis ao PWM não deve notar nenhuma oscilação. [pwm_comparison] Em comparação: 52 % de todos os dispositivos testados não usam PWM para escurecer a tela. Se PWM foi detectado, uma média de 7754 (mínimo: 5 - máximo: 343500) Hz foi medida. | |||
| Cinebench R15 | |
| CPU Single 64Bit (classificar por valor) | |
| MSI PE60 6QE-056XUS | |
| DogHouse Systems Mobius SS | |
| Lenovo ThinkPad P70 | |
| Gigabyte P55 V4 | |
| Asus G750JM-T4014H | |
| CPU Multi 64Bit (classificar por valor) | |
| MSI PE60 6QE-056XUS | |
| DogHouse Systems Mobius SS | |
| Lenovo ThinkPad P70 | |
| Gigabyte P55 V4 | |
| Asus G750JM-T4014H | |
| Cinebench R11.5 | |
| CPU Single 64Bit (classificar por valor) | |
| MSI PE60 6QE-056XUS | |
| DogHouse Systems Mobius SS | |
| Lenovo ThinkPad P70 | |
| Gigabyte P55 V4 | |
| Asus G750JM-T4014H | |
| CPU Multi 64Bit (classificar por valor) | |
| MSI PE60 6QE-056XUS | |
| DogHouse Systems Mobius SS | |
| Lenovo ThinkPad P70 | |
| Gigabyte P55 V4 | |
| Asus G750JM-T4014H | |
| Cinebench R10 | |
| Rendering Single 32Bit (classificar por valor) | |
| MSI PE60 6QE-056XUS | |
| DogHouse Systems Mobius SS | |
| Lenovo ThinkPad P70 | |
| Gigabyte P55 V4 | |
| Rendering Multiple CPUs 32Bit (classificar por valor) | |
| MSI PE60 6QE-056XUS | |
| DogHouse Systems Mobius SS | |
| Lenovo ThinkPad P70 | |
| Gigabyte P55 V4 | |
| wPrime 2.10 - 1024m (classificar por valor) | |
| MSI PE60 6QE-056XUS | |
| DogHouse Systems Mobius SS | |
| Lenovo ThinkPad P70 | |
| Gigabyte P55 V4 | |
| Super Pi Mod 1.5 XS 32M - 32M (classificar por valor) | |
| MSI PE60 6QE-056XUS | |
| DogHouse Systems Mobius SS | |
| Lenovo ThinkPad P70 | |
| Gigabyte P55 V4 | |
* ... menor é melhor
| PCMark 8 | |
| Home Score Accelerated v2 (classificar por valor) | |
| MSI PE60 6QE-056XUS | |
| MSI PE60-2QEi581 | |
| Lenovo Ideapad Y700 15ISK 80NW | |
| Dell XPS 15 9550 i7 FHD | |
| Asus G501VW-FY081T | |
| Work Score Accelerated v2 (classificar por valor) | |
| MSI PE60 6QE-056XUS | |
| MSI PE60-2QEi581 | |
| Lenovo Ideapad Y700 15ISK 80NW | |
| Dell XPS 15 9550 i7 FHD | |
| Asus G501VW-FY081T | |
| Creative Score Accelerated v2 (classificar por valor) | |
| MSI PE60 6QE-056XUS | |
| Lenovo Ideapad Y700 15ISK 80NW | |
| Dell XPS 15 9550 i7 FHD | |
| Asus G501VW-FY081T | |
| PCMark 8 Home Score Accelerated v2 | 3766 pontos | |
| PCMark 8 Creative Score Accelerated v2 | 4735 pontos | |
| PCMark 8 Work Score Accelerated v2 | 4827 pontos | |
Ajuda | ||
| MSI PE60 6QE-056XUS GeForce GTX 960M, 6700HQ, Intel SSD 535 SSDSCKJW120H6 | MSI PE60-2QEi78H11 SSD/4720HQ GeForce GTX 960M, 4720HQ, Toshiba HG6 THNSNJ128G8NU | HP ZBook 15 G3 Quadro M2000M, E3-1505M v5, Samsung SM951 MZVPV512HDGL m.2 PCI-e | Asus G501VW-FY081T GeForce GTX 960M, 6700HQ, Samsung CM871 MZNLF128HCHP | Dell XPS 15 9550 i7 FHD GeForce GTX 960M, 6700HQ, Samsung PM951 NVMe 512 GB | |
|---|---|---|---|---|---|
| AS SSD | 28% | 268% | -44% | 211% | |
| Copy Game MB/s (MB/s) | 307.1 | 261.9 -15% | 1023 233% | 141.5 -54% | 805 162% |
| Copy Program MB/s (MB/s) | 187.5 | 154.9 -17% | 585 212% | 99.9 -47% | 325.3 73% |
| Copy ISO MB/s (MB/s) | 280 | 353.4 26% | 1494 434% | 163 -42% | 1127 303% |
| Score Total (Points) | 588 | 865 47% | 2495 324% | 269 -54% | 2410 310% |
| Score Write (Points) | 293 | 207 -29% | 548 87% | 63 -78% | 675 130% |
| Score Read (Points) | 198 | 434 119% | 1302 558% | 152 -23% | 1180 496% |
| Access Time Write * (ms) | 0.196 | 0.056 71% | 0.024 88% | 0.225 -15% | 0.035 82% |
| Access Time Read * (ms) | 0.148 | 0.191 -29% | 0.031 79% | 0.207 -40% | 0.038 74% |
| 4K-64 Write (MB/s) | 180.2 | 99.9 -45% | 257 43% | 19.4 -89% | 513 185% |
| 4K-64 Read (MB/s) | 128.9 | 362.6 181% | 1066 727% | 87.6 -32% | 990 668% |
| 4K Write (MB/s) | 91 | 59.5 -35% | 173.1 90% | 30.66 -66% | 105.4 16% |
| 4K Read (MB/s) | 22.59 | 19.79 -12% | 52.5 132% | 13.87 -39% | 31.86 41% |
| Seq Write (MB/s) | 215.9 | 473.6 119% | 1181 447% | 126.9 -41% | 570 164% |
| Seq Read (MB/s) | 460.3 | 514 12% | 1841 300% | 504 9% | 1579 243% |
* ... menor é melhor

| 3DMark 11 | |
| 1280x720 Performance (classificar por valor) | |
| MSI PE60 6QE-056XUS | |
| Gigabyte P55W v5 | |
| Asus G501VW-FY081T | |
| MSI PE60 2QD | |
| Acer TravelMate P278-MG-76L2 | |
| 1280x720 Performance Combined (classificar por valor) | |
| MSI PE60 6QE-056XUS | |
| Gigabyte P55W v5 | |
| Asus G501VW-FY081T | |
| MSI PE60 2QD | |
| Acer TravelMate P278-MG-76L2 | |
| 1280x720 Performance Physics (classificar por valor) | |
| MSI PE60 6QE-056XUS | |
| Gigabyte P55W v5 | |
| Asus G501VW-FY081T | |
| MSI PE60 2QD | |
| Acer TravelMate P278-MG-76L2 | |
| 1280x720 Performance GPU (classificar por valor) | |
| MSI PE60 6QE-056XUS | |
| Gigabyte P55W v5 | |
| Asus G501VW-FY081T | |
| MSI PE60 2QD | |
| Acer TravelMate P278-MG-76L2 | |
| 3DMark | |
| 1920x1080 Fire Strike Score (classificar por valor) | |
| MSI PE60 6QE-056XUS | |
| Gigabyte P55W v5 | |
| Asus G501VW-FY081T | |
| MSI PE60 2QD | |
| Acer TravelMate P278-MG-76L2 | |
| 1920x1080 Fire Strike Combined (classificar por valor) | |
| MSI PE60 6QE-056XUS | |
| Gigabyte P55W v5 | |
| Asus G501VW-FY081T | |
| MSI PE60 2QD | |
| Acer TravelMate P278-MG-76L2 | |
| 1920x1080 Fire Strike Graphics (classificar por valor) | |
| MSI PE60 6QE-056XUS | |
| Gigabyte P55W v5 | |
| Asus G501VW-FY081T | |
| MSI PE60 2QD | |
| Acer TravelMate P278-MG-76L2 | |
| Fire Strike Extreme Physics (classificar por valor) | |
| MSI PE60 6QE-056XUS | |
| Acer TravelMate P278-MG-76L2 | |
| 3DMark 11 Performance | 5774 pontos | |
| 3DMark Ice Storm Standard Score | 85812 pontos | |
| 3DMark Cloud Gate Standard Score | 17782 pontos | |
| 3DMark Fire Strike Score | 4088 pontos | |
| 3DMark Fire Strike Extreme Score | 2046 pontos | |
Ajuda | ||
| BioShock Infinite - 1920x1080 Ultra Preset, DX11 (DDOF) | |
| Aorus X5S v5 | |
| Aorus X3 Plus v5 | |
| MSI PE60 6QE-056XUS | |
| MSI PX60 QD-034US | |
| Lenovo ThinkPad T460p-20FXS05500 | |
| Metro: Last Light - 1920x1080 Very High (DX11) AF:16x | |
| Aorus X5S v5 | |
| Aorus X3 Plus v5 | |
| MSI PE60 6QE-056XUS | |
| MSI PX60 QD-034US | |
| Lenovo ThinkPad T460p-20FXS05500 | |
| Thief - 1920x1080 Very High Preset AA:FXAA & High SS AF:8x | |
| Aorus X5S v5 | |
| Aorus X3 Plus v5 | |
| MSI PE60 6QE-056XUS | |
| MSI PX60 QD-034US | |
| Lenovo ThinkPad T460p-20FXS05500 | |
| Metal Gear Solid V - 1920x1080 Extra High / On | |
| Aorus X5S v5 | |
| Aorus X3 Plus v5 | |
| MSI PE60 6QE-056XUS | |
| MSI PX60 QD-034US | |
| Fallout 4 - 1920x1080 Ultra Preset AA:T AF:16x | |
| Aorus X5S v5 | |
| Aorus X3 Plus v5 | |
| MSI PE60 6QE-056XUS | |
| Rise of the Tomb Raider - 1920x1080 Very High Preset AA:FX AF:16x | |
| Aorus X5S v5 | |
| MSI PE60 6QE-056XUS | |
| baixo | média | alto | ultra | |
|---|---|---|---|---|
| BioShock Infinite (2013) | 130 | 117.4 | 45.8 | |
| Metro: Last Light (2013) | 100.3 | 59.9 | 31.7 | |
| Thief (2014) | 65.3 | 55.3 | 27.9 | |
| Batman: Arkham Knight (2015) | 60 | 32 | ||
| Metal Gear Solid V (2015) | 60 | 58 | 39.1 | |
| Fallout 4 (2015) | 57.5 | 31.6 | 24.9 | |
| Rise of the Tomb Raider (2016) | 53.7 | 30.3 | 23 |
| MSI PE60 6QE-056XUS GeForce GTX 960M, 6700HQ, Intel SSD 535 SSDSCKJW120H6 | MSI PE60-2QEi581 GeForce GTX 960M, 4210H, HGST Travelstar 7K1000 HTS721010A9E630 | HP ZBook 15 G3 Quadro M2000M, E3-1505M v5, Samsung SM951 MZVPV512HDGL m.2 PCI-e | Asus G501VW-FY081T GeForce GTX 960M, 6700HQ, Samsung CM871 MZNLF128HCHP | Dell XPS 15 9550 i7 FHD GeForce GTX 960M, 6700HQ, Samsung PM951 NVMe 512 GB | |
|---|---|---|---|---|---|
| Noise | -2% | 1% | 0% | 8% | |
| desligado / ambiente * (dB) | 29.3 | 30 -2% | 31.2 -6% | ||
| Idle Minimum * (dB) | 32.4 | 32.8 -1% | 30 7% | 32.1 1% | 29.2 10% |
| Idle Average * (dB) | 32.4 | 32.8 -1% | 30 7% | 32.1 1% | 29.3 10% |
| Idle Maximum * (dB) | 35.4 | 35.4 -0% | 30 15% | 32.1 9% | 29.5 17% |
| Load Average * (dB) | 40.5 | 42.3 -4% | 45.3 -12% | 43.3 -7% | 36.5 10% |
| Load Maximum * (dB) | 45.3 | 47.4 -5% | 49.7 -10% | 44.3 2% | 47.7 -5% |
* ... menor é melhor
Barulho
| Ocioso |
| 32.4 / 32.4 / 35.4 dB |
| DVD |
| / 38.9 dB |
| Carga |
| 40.5 / 45.3 dB |
 | ||
30 dB silencioso 40 dB(A) audível 50 dB(A) ruidosamente alto |
||
min: | ||
(±) A temperatura máxima no lado superior é 43.2 °C / 110 F, em comparação com a média de 36.8 °C / 98 F , variando de 21 a 71 °C para a classe Multimedia.
(-) A parte inferior aquece até um máximo de 49 °C / 120 F, em comparação com a média de 39.1 °C / 102 F
(+) Em uso inativo, a temperatura média para o lado superior é 25.5 °C / 78 F, em comparação com a média do dispositivo de 31.3 °C / ### class_avg_f### F.
(-) Os apoios para as mãos e o touchpad podem ficar muito quentes ao toque, com um máximo de 40.6 °C / 105.1 F.
(-) A temperatura média da área do apoio para as mãos de dispositivos semelhantes foi 28.7 °C / 83.7 F (-11.9 °C / -21.4 F).
| MSI PE60 6QE-056XUS GeForce GTX 960M, 6700HQ, Intel SSD 535 SSDSCKJW120H6 | MSI PE60-2QEi581 GeForce GTX 960M, 4210H, HGST Travelstar 7K1000 HTS721010A9E630 | HP ZBook 15 G3 Quadro M2000M, E3-1505M v5, Samsung SM951 MZVPV512HDGL m.2 PCI-e | Asus G501VW-FY081T GeForce GTX 960M, 6700HQ, Samsung CM871 MZNLF128HCHP | Lenovo Y700-15 80NV004LPB GeForce GTX 960M, 6700HQ, Samsung SSD 850 EVO 250GB | Dell XPS 15 2016 9550 GeForce GTX 960M, 6300HQ, WDC WD10SPCX-75KHST0 + LiteON CS1-SP32-11 M.2 2242 32GB | |
|---|---|---|---|---|---|---|
| Power Consumption | -50% | 15% | 22% | 4% | 10% | |
| Idle Minimum * (Watt) | 9.7 | 21.8 -125% | 5.7 41% | 6.9 29% | 4.2 57% | 9.9 -2% |
| Idle Average * (Watt) | 13.1 | 26.1 -99% | 12.2 7% | 10.7 18% | 10.5 20% | 12.6 4% |
| Idle Maximum * (Watt) | 23.2 | 26.6 -15% | 12.6 46% | 13.2 43% | 28.5 -23% | 16.8 28% |
| Load Average * (Watt) | 79.1 | 88.5 -12% | 83.1 -5% | 82 -4% | 113 -43% | 70 12% |
| Load Maximum * (Watt) | 122.9 | 119.7 3% | 138.2 -12% | 94 24% | 114.2 7% | 114 7% |
* ... menor é melhor
| desligado | |
| Ocioso | |
| Carga |
|
Key:
min: | |
| MSI PE60 6QE-056XUS 42 Wh | MSI PE60-2QEi581 42 Wh | HP ZBook 15 G3 90 Wh | Asus G501VW-FY081T 60 Wh | Lenovo Ideapad Y700 15ISK 80NW 60 Wh | Dell XPS 15 9550 i7 FHD 84 Wh | |
|---|---|---|---|---|---|---|
| Duração da bateria | 4% | 101% | 51% | 68% | 146% | |
| Reader / Idle (h) | 5.7 | 5.8 2% | 13.7 140% | 10.2 79% | 10.3 81% | 16.3 186% |
| WiFi v1.3 (h) | 3 | 2.8 -7% | 6.4 113% | 5.5 83% | 5.9 97% | 9.1 203% |
| Load (h) | 1.2 | 1.4 17% | 1.8 50% | 1.1 -8% | 1.5 25% | 1.8 50% |
Pro
Contra
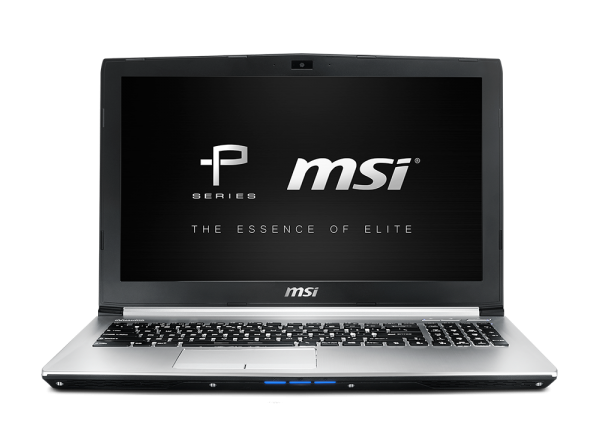
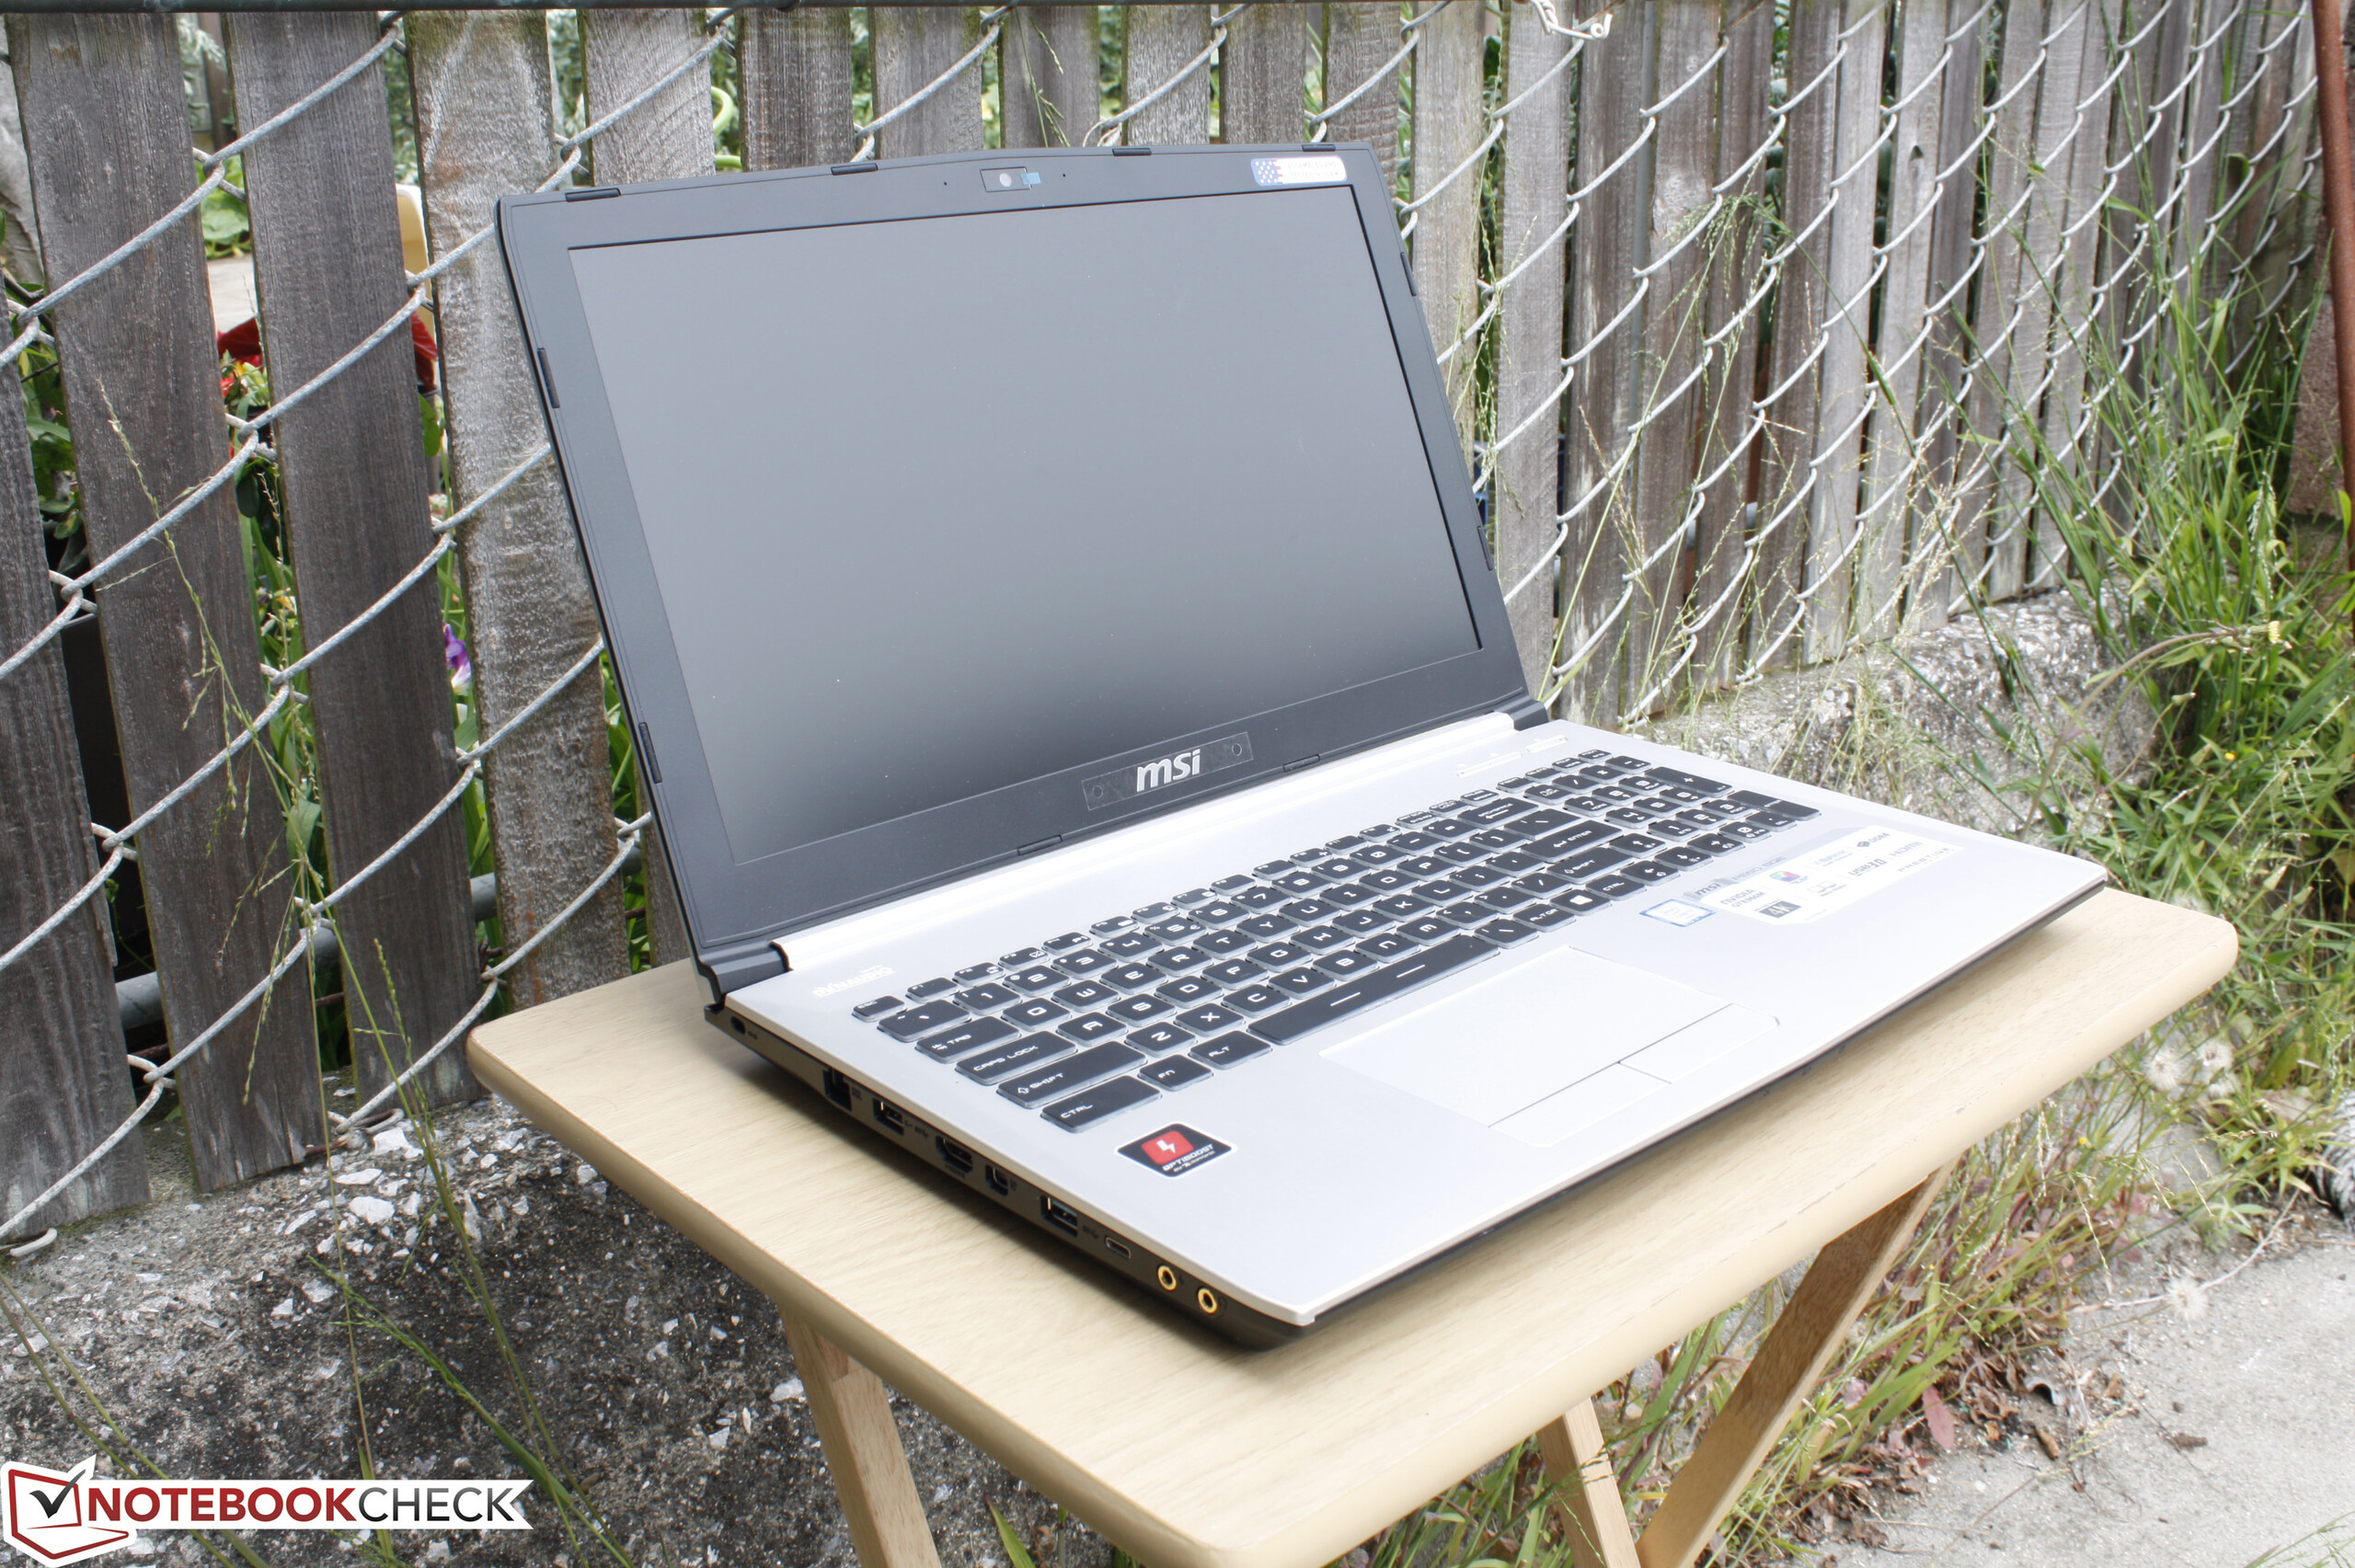
Em sua essência, o MSI PE60 Prestige é um GE62 com um novo revestimento de pintura e um nome diferente, destinado para empresas e usuários multimídia. Isto essencialmente transforma o PE60 um portátil de jogos disfarçado, o qual para os usuários empresariais não é a melhor notícia. Além da ampla gama da tela depois de uma calibração adequada, há muito pouco aqui que possa trair usuários. O mais recente XPS 15 deixa o MSI bem atrás com duração de bateria mais longas, design mais leve e fino, tela mais brilhante, SSD NVMe mais veloz, USB Type-C com Thunderbolt 3, e chassi mais forte com a mesma CPU e GPU.
O PE60 Prestige tem como alvo o uso profissional, mas a MSI terá que se esforçar mais para incorporar recursos que os usuários empresariais podem apreciar, em vez de simplesmente trocar a máscara de uma série de jogos que já existe. É melhor descrito como um "portátil profissional de jogos" onde existem melhores opções para usuários empresariais dedicados ou gamers hardcore dedicados, na mesma faixa de preços.
Esta é uma versão reduzida da análise original. Você pode ler a análise completa em inglês aqui.
MSI PE60 6QE-056XUS
- 12/09/2016 v6 (old)
Allen Ngo
Price comparison
