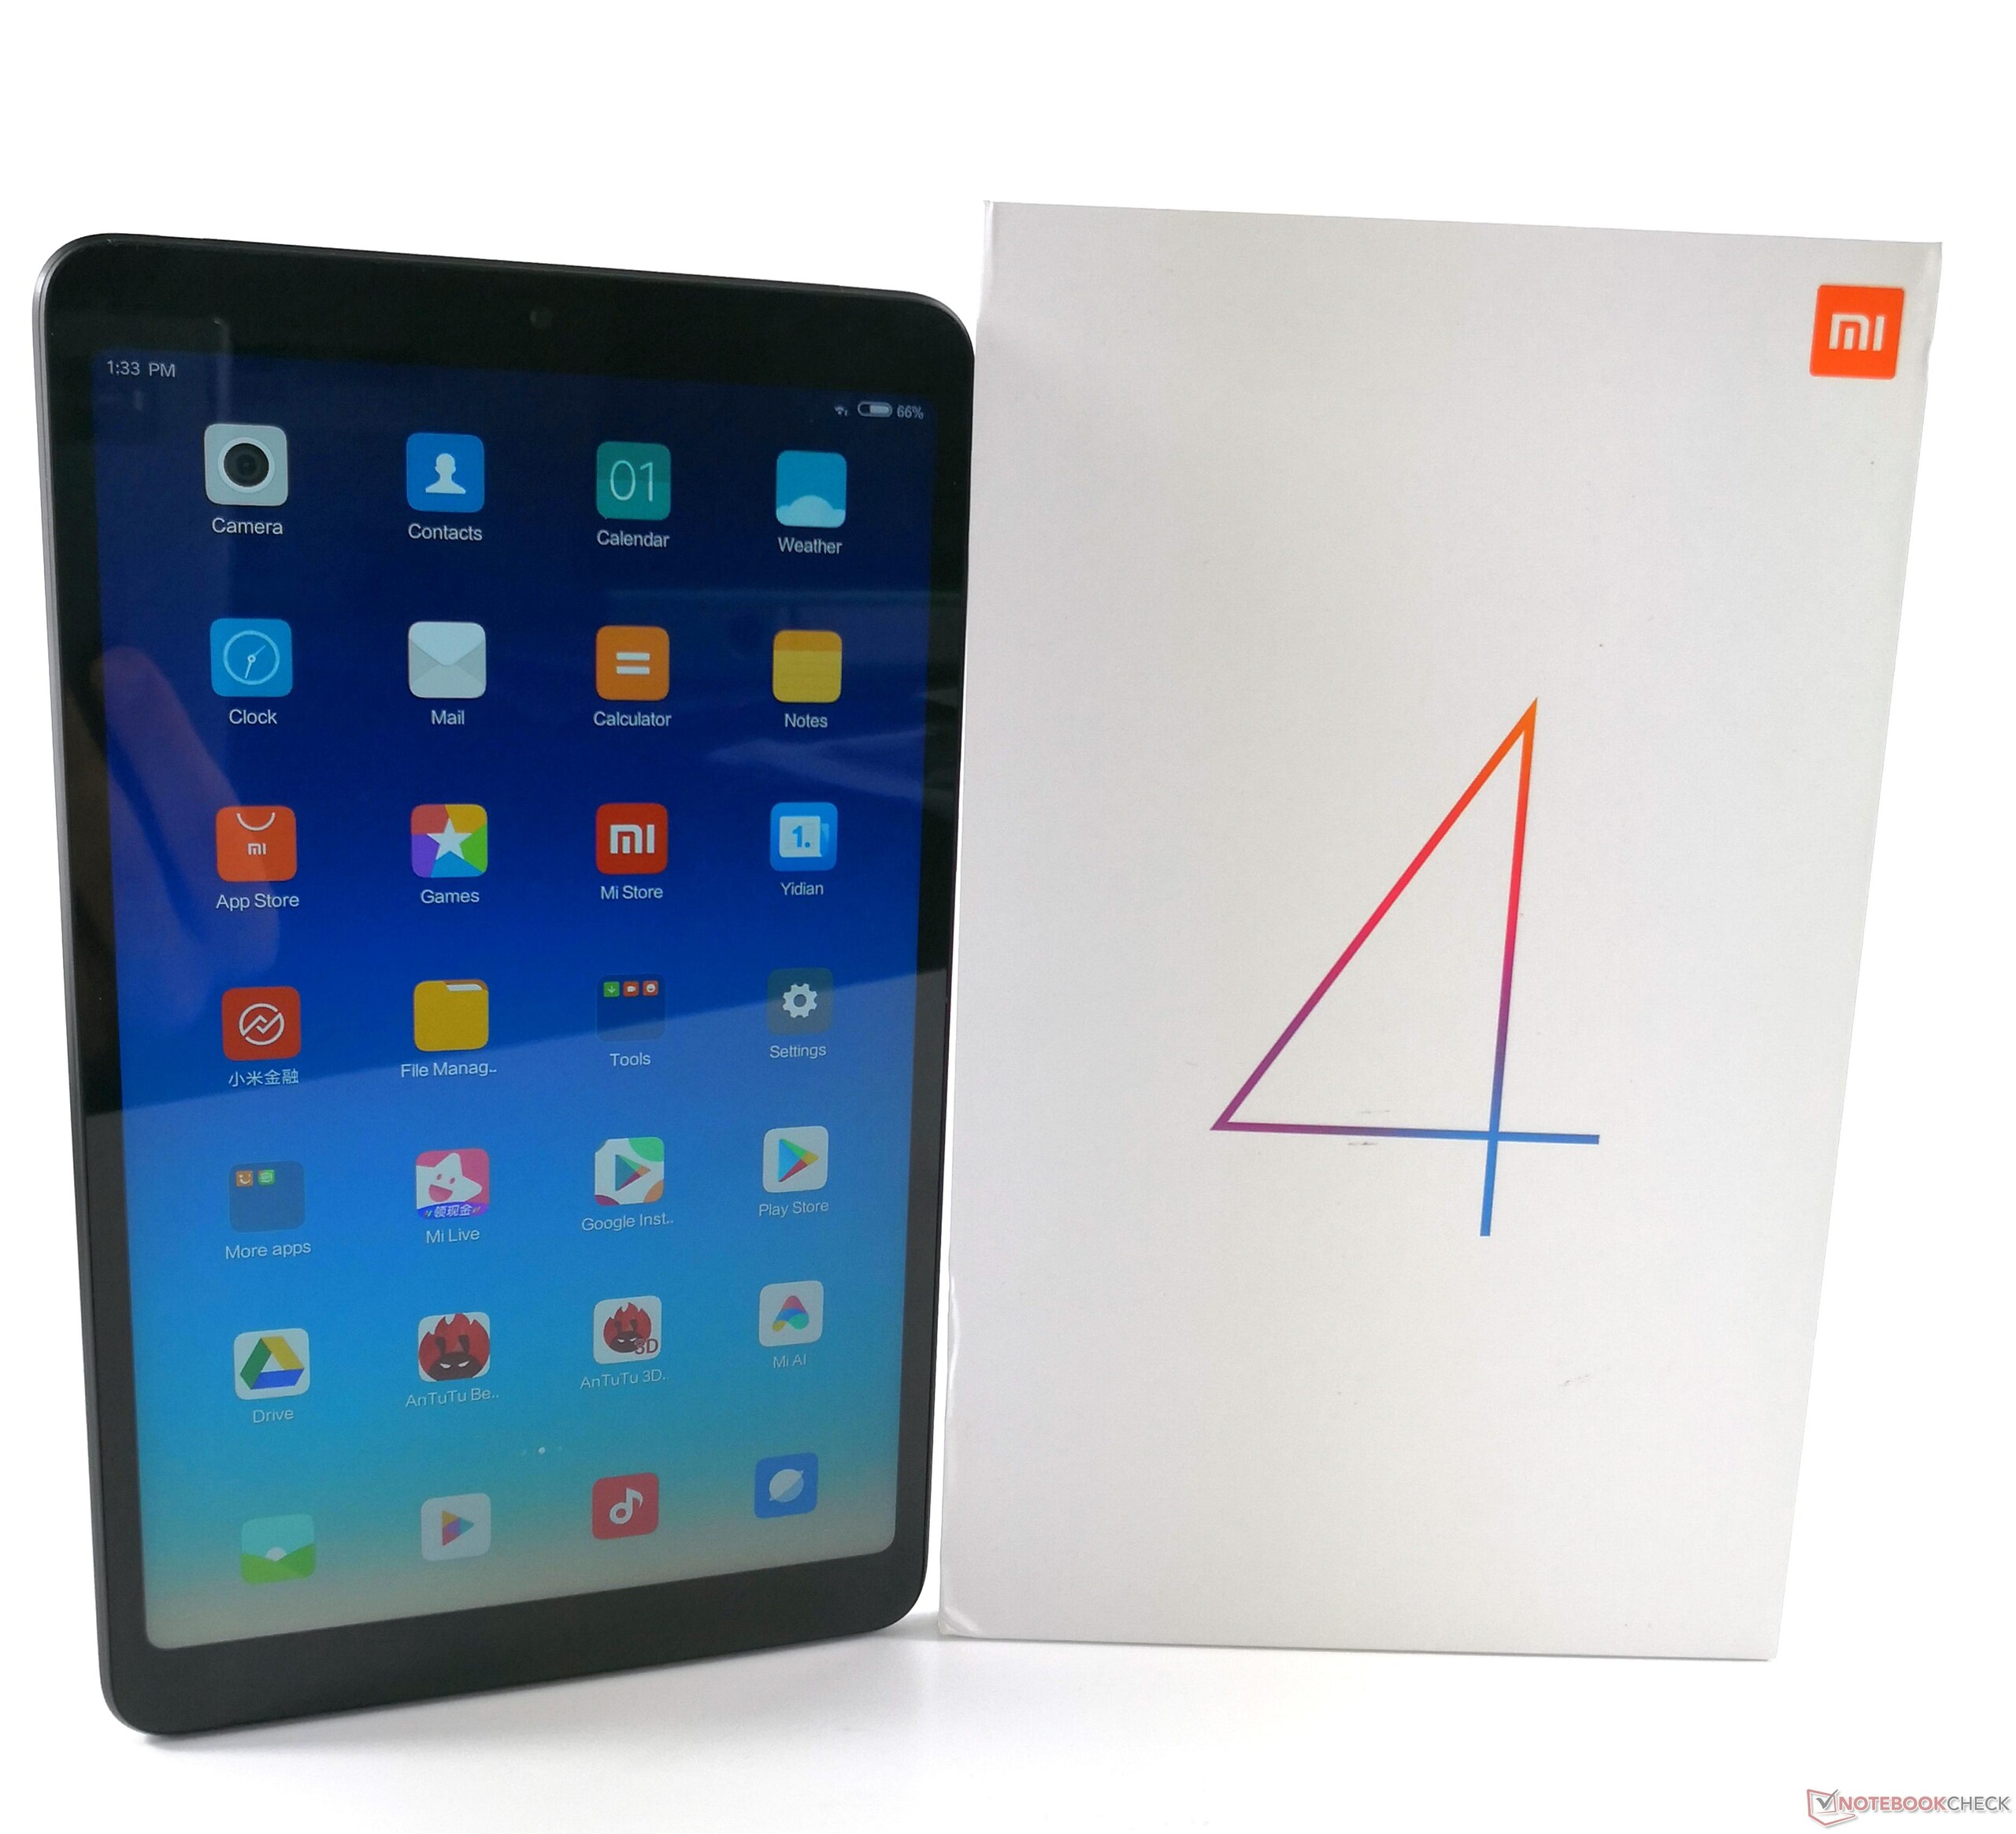
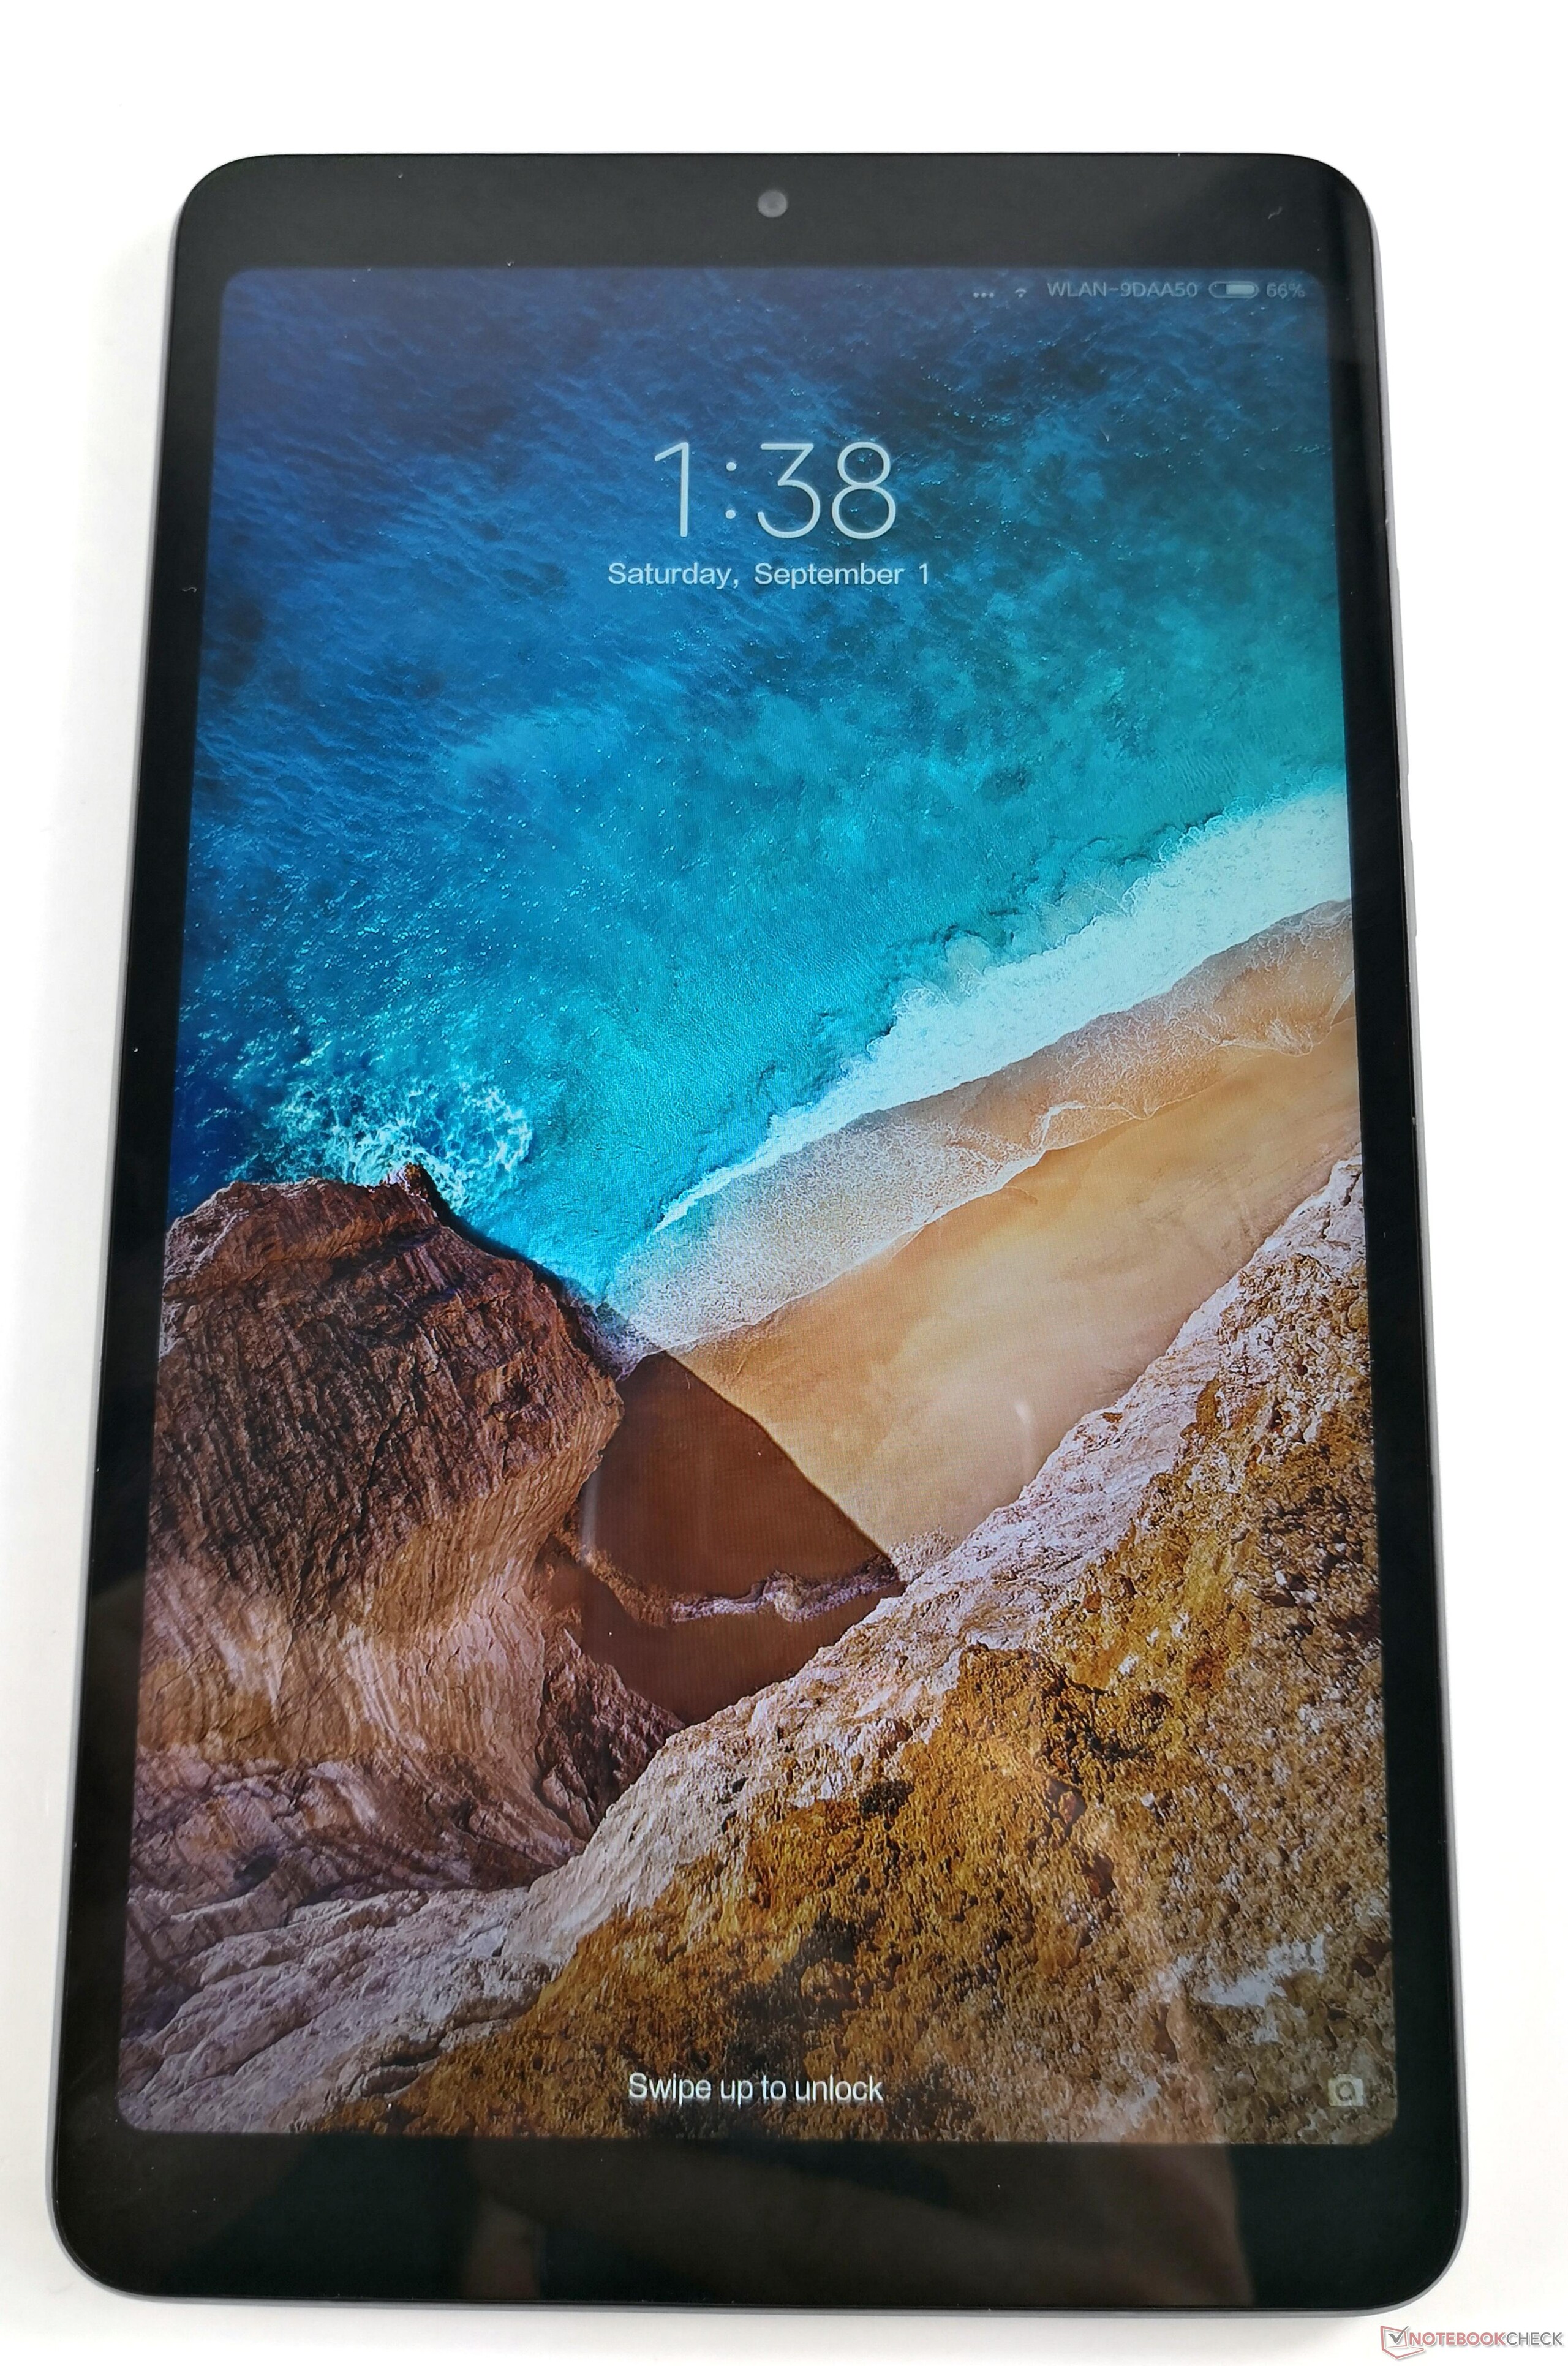
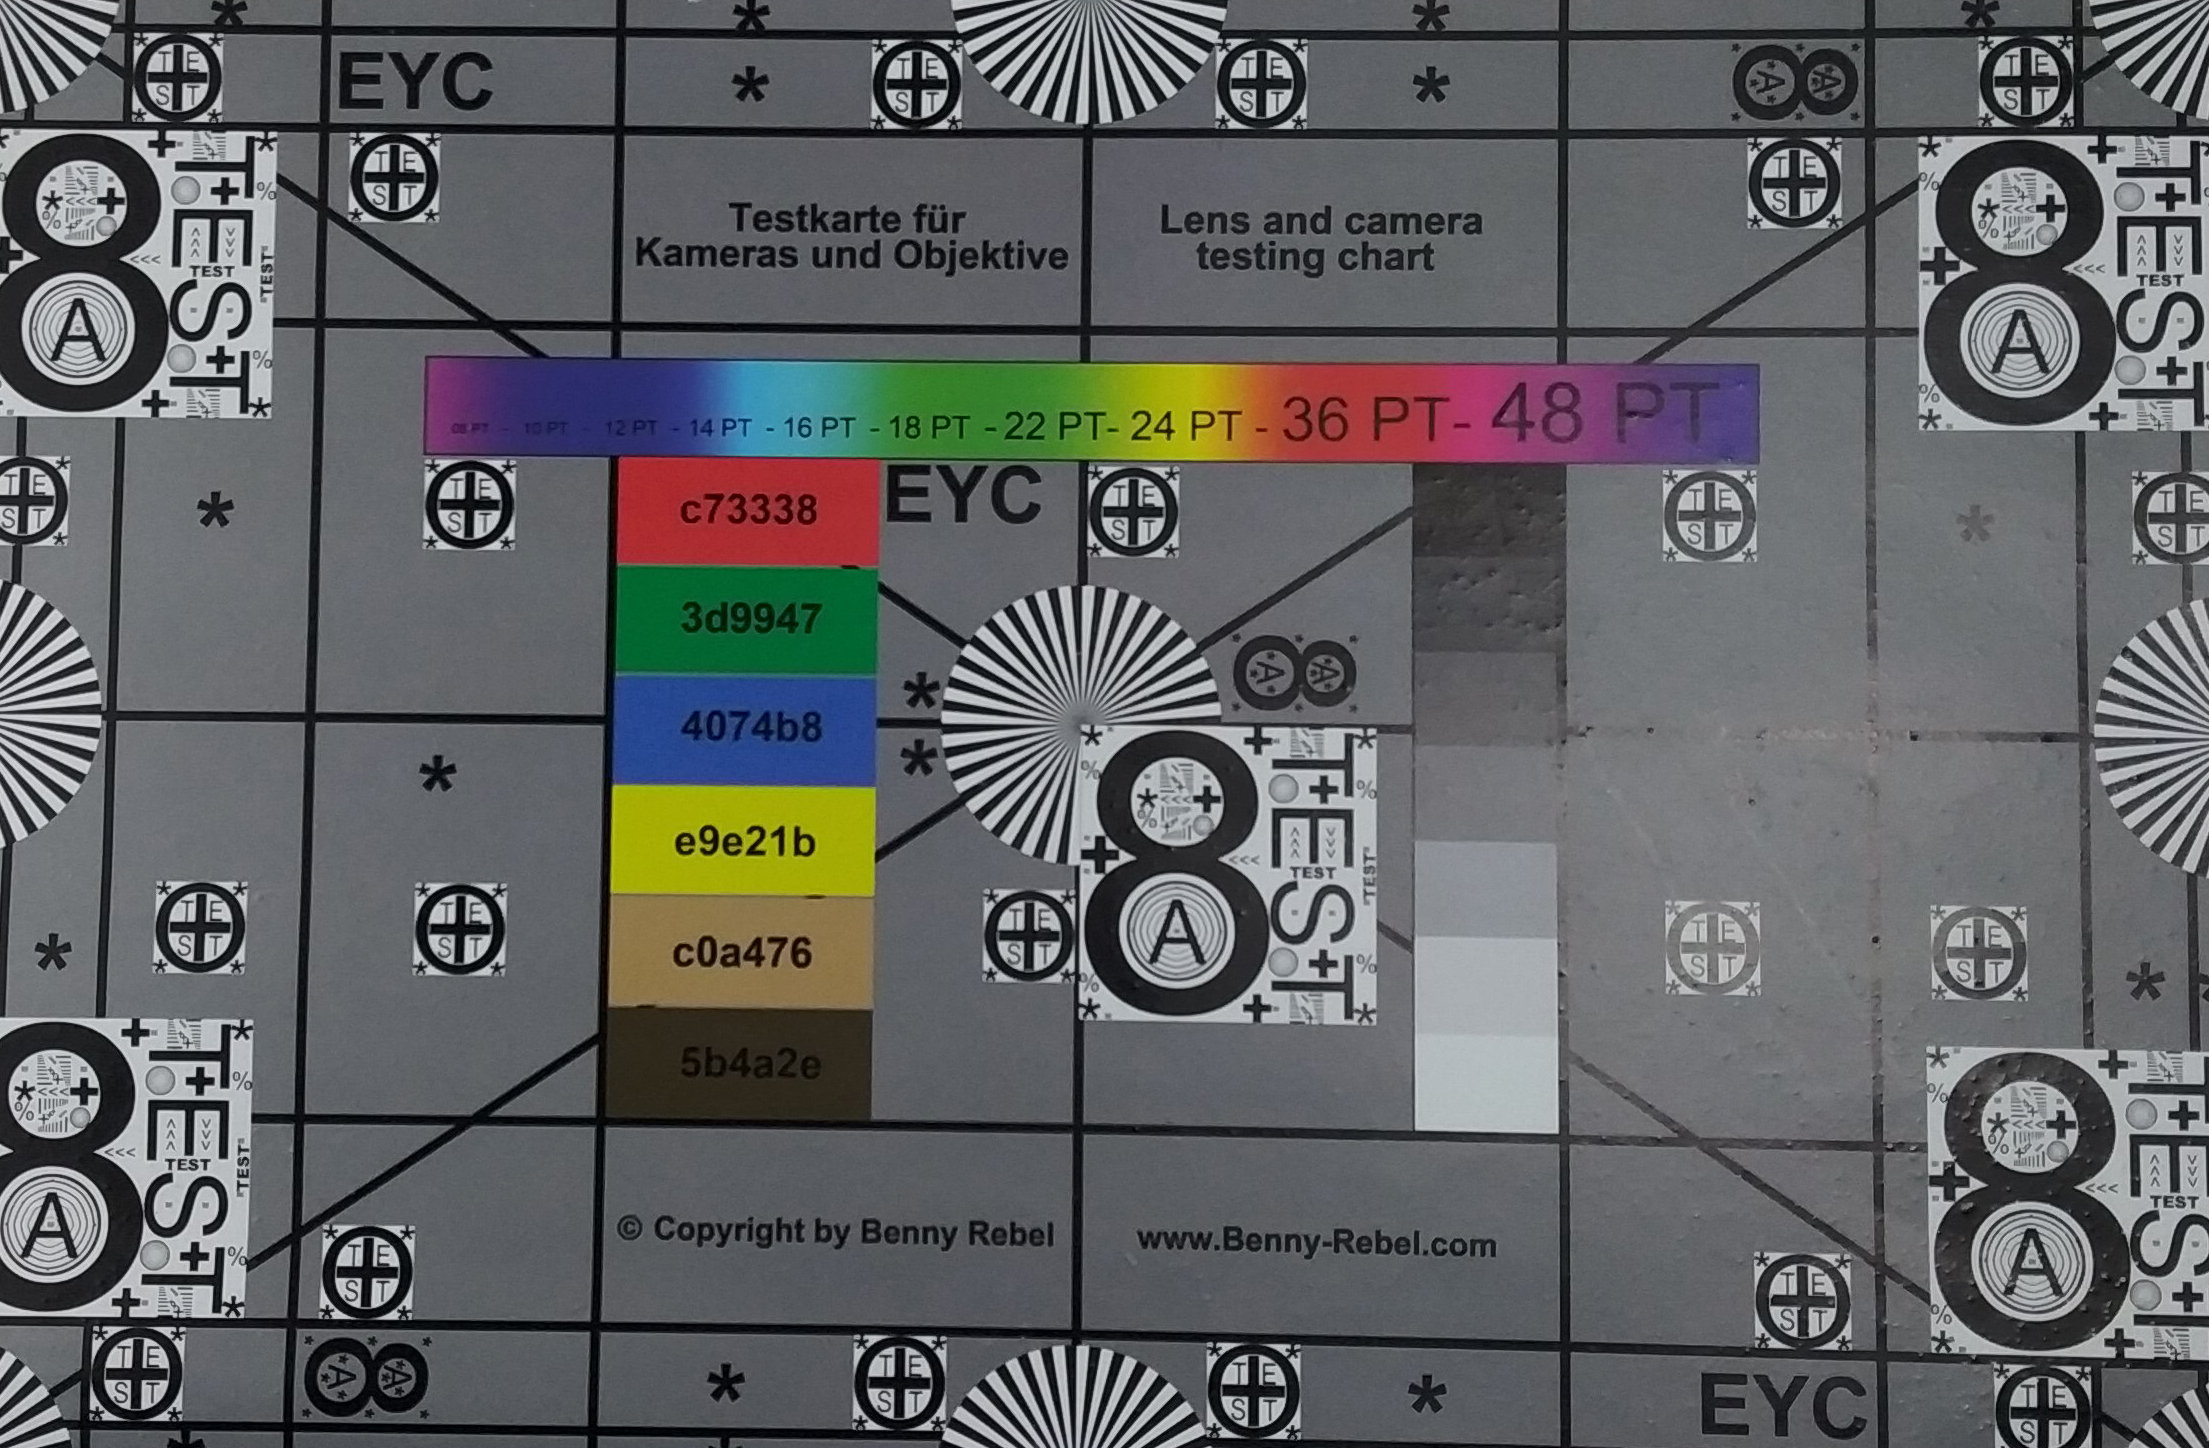
Breve análise do Tablet Xiaomi Mi Pad 4 (LTE)


| |||||||||||||||||||||||||
iluminação: 83 %
iluminação com acumulador: 454 cd/m²
Contraste: 622:1 (Preto: 0.73 cd/m²)
ΔE ColorChecker Calman: 5.2 | ∀{0.5-29.43 Ø4.71}
ΔE Greyscale Calman: 4.7 | ∀{0.09-98 Ø4.96}
94.9% sRGB (Calman 2D)
Gamma: 2.271
CCT: 7361 K
| Xiaomi Mi Pad 4 IPS LCD, 1920x1200, 8" | Huawei Mediapad M3 Lite 8 IPS, 1920x1200, 8" | Huawei MediaPad M3 8.4 inch IPS, 2560x1600, 8.4" | Amazon Fire HD 8 2017 IPS, 1280x800, 8" | Huawei MediaPad M5 8.4 IPS, 2560x1600, 8.4" | Medion Lifetab P10606 IPS, 1920x1200, 10.1" | Acer Iconia Tab 10 A3-A50 IPS, 1920x1200, 10.1" | |
|---|---|---|---|---|---|---|---|
| Screen | 4% | 5% | -16% | -10% | -46% | -16% | |
| Brightness middle (cd/m²) | 454 | 409.1 -10% | 460 1% | 419 -8% | 405 -11% | 326 -28% | 340 -25% |
| Brightness (cd/m²) | 411 | 402 -2% | 445 8% | 412 0% | 392 -5% | 338 -18% | 320 -22% |
| Brightness Distribution (%) | 83 | 92 11% | 90 8% | 91 10% | 92 11% | 92 11% | 84 1% |
| Black Level * (cd/m²) | 0.73 | 0.56 23% | 0.45 38% | 0.39 47% | 0.67 8% | 0.56 23% | 0.19 74% |
| Contrast (:1) | 622 | 731 18% | 1022 64% | 1074 73% | 604 -3% | 582 -6% | 1789 188% |
| Colorchecker dE 2000 * | 5.2 | 4.1 21% | 6.2 -19% | 8.5 -63% | 5.78 -11% | 9.1 -75% | 15 -188% |
| Colorchecker dE 2000 max. * | 8.36 | 9.6 -15% | 10.5 -26% | 13.8 -65% | 9.82 -17% | 18.2 -118% | 22.8 -173% |
| Greyscale dE 2000 * | 4.7 | 5.3 -13% | 6.5 -38% | 10.3 -119% | 7.2 -53% | 12 -155% | 4 15% |
| Gamma | 2.271 97% | 2.2 100% | 2.33 94% | 2.6 85% | 2.278 97% | 2.32 95% | 2.09 105% |
| CCT | 7361 88% | 7603 85% | 8056 81% | 6216 105% | 8405 77% | 11359 57% | 6940 94% |
* ... menor é melhor
Cintilação da tela / PWM (modulação por largura de pulso)
| Tela tremeluzindo/PWM detectado | 2358 Hz | ≤ 10 % configuração de brilho | 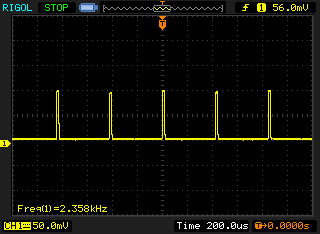 |
A luz de fundo da tela pisca em 2358 Hz (pior caso, por exemplo, utilizando PWM) Cintilação detectada em uma configuração de brilho de 10 % e abaixo. Não deve haver cintilação ou PWM acima desta configuração de brilho. A frequência de 2358 Hz é bastante alta, então a maioria dos usuários sensíveis ao PWM não deve notar nenhuma oscilação. [pwm_comparison] Em comparação: 52 % de todos os dispositivos testados não usam PWM para escurecer a tela. Se PWM foi detectado, uma média de 7754 (mínimo: 5 - máximo: 343500) Hz foi medida. | |||
Exibir tempos de resposta
| ↔ Tempo de resposta preto para branco | ||
|---|---|---|
| 16 ms ... ascensão ↗ e queda ↘ combinadas | ↗ 5 ms ascensão | 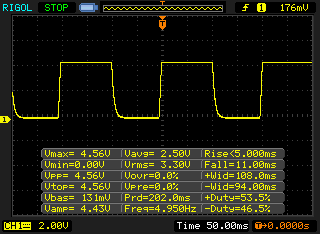 |
| ↘ 11 ms queda | ||
| A tela mostra boas taxas de resposta em nossos testes, mas pode ser muito lenta para jogadores competitivos. Em comparação, todos os dispositivos testados variam de 0.1 (mínimo) a 240 (máximo) ms. » 37 % de todos os dispositivos são melhores. Isso significa que o tempo de resposta medido é melhor que a média de todos os dispositivos testados (19.8 ms). | ||
| ↔ Tempo de resposta 50% cinza a 80% cinza | ||
| 42 ms ... ascensão ↗ e queda ↘ combinadas | ↗ 21 ms ascensão | 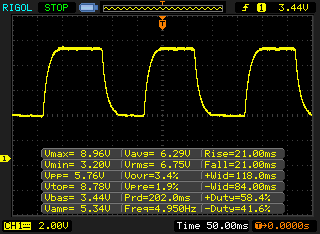 |
| ↘ 21 ms queda | ||
| A tela mostra taxas de resposta lentas em nossos testes e será insatisfatória para os jogadores. Em comparação, todos os dispositivos testados variam de 0.165 (mínimo) a 636 (máximo) ms. » 67 % de todos os dispositivos são melhores. Isso significa que o tempo de resposta medido é pior que a média de todos os dispositivos testados (31 ms). | ||
| AnTuTu v7 - Total Score | |
| Huawei MediaPad M5 8.4 | |
| Xiaomi Mi Pad 4 | |
| Média Qualcomm Snapdragon 660 (116346 - 143551, n=10) | |
| Medion Lifetab P10606 | |
| PCMark for Android | |
| Work performance score | |
| Huawei MediaPad M5 8.4 | |
| Xiaomi Mi Pad 4 | |
| Média Qualcomm Snapdragon 660 (6274 - 7026, n=11) | |
| Acer Iconia Tab 10 A3-A50 | |
| Huawei MediaPad M3 8.4 inch | |
| Huawei Mediapad M3 Lite 8 | |
| Medion Lifetab P10606 | |
| Amazon Fire HD 8 2017 | |
| Work 2.0 performance score | |
| Média Qualcomm Snapdragon 660 (5789 - 6426, n=13) | |
| Xiaomi Mi Pad 4 | |
| Huawei MediaPad M5 8.4 | |
| Acer Iconia Tab 10 A3-A50 | |
| Huawei Mediapad M3 Lite 8 | |
| Medion Lifetab P10606 | |
| Amazon Fire HD 8 2017 | |
| Geekbench 4.4 | |
| 64 Bit Single-Core Score | |
| Média da turma Tablet (4231 - 9867, n=8, últimos 2 anos) | |
| Huawei MediaPad M5 8.4 | |
| Xiaomi Mi Pad 4 | |
| Média Qualcomm Snapdragon 660 (1431 - 1646, n=11) | |
| Acer Iconia Tab 10 A3-A50 | |
| Huawei Mediapad M3 Lite 8 | |
| Medion Lifetab P10606 | |
| Amazon Fire HD 8 2017 | |
| 64 Bit Multi-Core Score | |
| Média da turma Tablet (11144 - 28034, n=8, últimos 2 anos) | |
| Huawei MediaPad M5 8.4 | |
| Xiaomi Mi Pad 4 | |
| Média Qualcomm Snapdragon 660 (4895 - 5913, n=11) | |
| Huawei Mediapad M3 Lite 8 | |
| Acer Iconia Tab 10 A3-A50 | |
| Medion Lifetab P10606 | |
| Amazon Fire HD 8 2017 | |
| Compute RenderScript Score | |
| Média da turma Tablet (8856 - 22243, n=5, últimos 2 anos) | |
| Huawei MediaPad M5 8.4 | |
| Xiaomi Mi Pad 4 | |
| Média Qualcomm Snapdragon 660 (4983 - 5811, n=9) | |
| Acer Iconia Tab 10 A3-A50 | |
| Medion Lifetab P10606 | |
| GFXBench (DX / GLBenchmark) 2.7 | |
| T-Rex Onscreen | |
| Média da turma Tablet (22 - 165, n=57, últimos 2 anos) | |
| Huawei MediaPad M5 8.4 | |
| Média Qualcomm Snapdragon 660 (42 - 59, n=14) | |
| Xiaomi Mi Pad 4 | |
| Huawei MediaPad M3 8.4 inch | |
| Amazon Fire HD 8 2017 | |
| Acer Iconia Tab 10 A3-A50 | |
| Huawei Mediapad M3 Lite 8 | |
| Medion Lifetab P10606 | |
| 1920x1080 T-Rex Offscreen | |
| Média da turma Tablet (24 - 886, n=57, últimos 2 anos) | |
| Huawei MediaPad M5 8.4 | |
| Xiaomi Mi Pad 4 | |
| Média Qualcomm Snapdragon 660 (43 - 51, n=14) | |
| Huawei MediaPad M3 8.4 inch | |
| Acer Iconia Tab 10 A3-A50 | |
| Huawei Mediapad M3 Lite 8 | |
| Medion Lifetab P10606 | |
| Amazon Fire HD 8 2017 | |
| GFXBench 3.0 | |
| on screen Manhattan Onscreen OGL | |
| Média da turma Tablet (14 - 165, n=57, últimos 2 anos) | |
| Huawei MediaPad M5 8.4 | |
| Média Qualcomm Snapdragon 660 (19 - 40, n=14) | |
| Xiaomi Mi Pad 4 | |
| Huawei MediaPad M3 8.4 inch | |
| Acer Iconia Tab 10 A3-A50 | |
| Huawei Mediapad M3 Lite 8 | |
| Amazon Fire HD 8 2017 | |
| Medion Lifetab P10606 | |
| 1920x1080 1080p Manhattan Offscreen | |
| Média da turma Tablet (15 - 532, n=57, últimos 2 anos) | |
| Huawei MediaPad M5 8.4 | |
| Xiaomi Mi Pad 4 | |
| Média Qualcomm Snapdragon 660 (20 - 23, n=14) | |
| Huawei MediaPad M3 8.4 inch | |
| Acer Iconia Tab 10 A3-A50 | |
| Medion Lifetab P10606 | |
| Huawei Mediapad M3 Lite 8 | |
| Amazon Fire HD 8 2017 | |
| GFXBench 3.1 | |
| on screen Manhattan ES 3.1 Onscreen | |
| Média da turma Tablet (9.2 - 160, n=57, últimos 2 anos) | |
| Média Qualcomm Snapdragon 660 (12 - 30, n=15) | |
| Huawei MediaPad M5 8.4 | |
| Xiaomi Mi Pad 4 | |
| Acer Iconia Tab 10 A3-A50 | |
| Amazon Fire HD 8 2017 | |
| Huawei Mediapad M3 Lite 8 | |
| Medion Lifetab P10606 | |
| Huawei MediaPad M3 8.4 inch | |
| 1920x1080 Manhattan ES 3.1 Offscreen | |
| Média da turma Tablet (9.8 - 361, n=57, últimos 2 anos) | |
| Huawei MediaPad M5 8.4 | |
| Xiaomi Mi Pad 4 | |
| Média Qualcomm Snapdragon 660 (8.2 - 15, n=14) | |
| Huawei MediaPad M3 8.4 inch | |
| Acer Iconia Tab 10 A3-A50 | |
| Huawei Mediapad M3 Lite 8 | |
| Amazon Fire HD 8 2017 | |
| Medion Lifetab P10606 | |
| GFXBench | |
| on screen Car Chase Onscreen | |
| Média da turma Tablet (3.8 - 110, n=57, últimos 2 anos) | |
| Huawei MediaPad M5 8.4 | |
| Média Qualcomm Snapdragon 660 (7.5 - 18, n=15) | |
| Xiaomi Mi Pad 4 | |
| Huawei MediaPad M3 8.4 inch | |
| Acer Iconia Tab 10 A3-A50 | |
| Huawei Mediapad M3 Lite 8 | |
| Medion Lifetab P10606 | |
| 1920x1080 Car Chase Offscreen | |
| Média da turma Tablet (4 - 256, n=57, últimos 2 anos) | |
| Huawei MediaPad M5 8.4 | |
| Xiaomi Mi Pad 4 | |
| Média Qualcomm Snapdragon 660 (8 - 9.1, n=14) | |
| Huawei MediaPad M3 8.4 inch | |
| Acer Iconia Tab 10 A3-A50 | |
| Huawei Mediapad M3 Lite 8 | |
| Medion Lifetab P10606 | |
| Octane V2 - Total Score | |
| Média da turma Tablet (1633 - 138481, n=71, últimos 2 anos) | |
| Huawei MediaPad M3 8.4 inch (Chrome 54) | |
| Huawei MediaPad M5 8.4 (Chrome 66) | |
| Xiaomi Mi Pad 4 (Chrome 68) | |
| Média Qualcomm Snapdragon 660 (8463 - 10945, n=14) | |
| Acer Iconia Tab 10 A3-A50 (Browser: Chrome Version 63) | |
| Medion Lifetab P10606 (Chrome 60) | |
| Huawei Mediapad M3 Lite 8 (Google Chrome 61.0.3163.98) | |
| Amazon Fire HD 8 2017 (Amazon Silk 58.2.3029.83.10) | |
| WebXPRT 2015 - Overall | |
| Huawei MediaPad M5 8.4 (Chrome 66) | |
| Xiaomi Mi Pad 4 (Chrome 68) | |
| Média Qualcomm Snapdragon 660 (159 - 182, n=8) | |
| Huawei MediaPad M3 8.4 inch (Chrome 54) | |
| Huawei Mediapad M3 Lite 8 (Google Chrome 61.0.3163.98) | |
| Medion Lifetab P10606 (Chrome 60) | |
| Amazon Fire HD 8 2017 (Amazon Silk 58.2.3029.83.10) | |
| JetStream 1.1 - 1.1 Total | |
| Huawei MediaPad M5 8.4 (Chrome 66) | |
| Xiaomi Mi Pad 4 (Chrome 68) | |
| Huawei MediaPad M3 8.4 inch (Chrome 54) | |
| Média Qualcomm Snapdragon 660 (45.3 - 55.5, n=12) | |
| Acer Iconia Tab 10 A3-A50 (Browser: Chrome Version 63) | |
| Amazon Fire HD 8 2017 (Amazon Silk 58.2.3029.83.10) | |
| Medion Lifetab P10606 (Chrome 60) | |
| Huawei Mediapad M3 Lite 8 (Google Chrome 61.0.3163.98) | |
| Mozilla Kraken 1.1 - Total | |
| Medion Lifetab P10606 (Chrome 60) | |
| Huawei Mediapad M3 Lite 8 (Google Chrome 61.0.3163.98) | |
| Amazon Fire HD 8 2017 (Amazon Silk 58.2.3029.83.10) | |
| Média Qualcomm Snapdragon 660 (3796 - 4769, n=13) | |
| Xiaomi Mi Pad 4 (Chrome 68) | |
| Acer Iconia Tab 10 A3-A50 (Browser: Chrome Version 63) | |
| Huawei MediaPad M5 8.4 (Chrome 66) | |
| Huawei MediaPad M3 8.4 inch (Chrome 54) | |
| Média da turma Tablet (243 - 16233, n=65, últimos 2 anos) | |
* ... menor é melhor
| Xiaomi Mi Pad 4 | Huawei Mediapad M3 Lite 8 | Huawei MediaPad M3 8.4 inch | Amazon Fire HD 8 2017 | Huawei MediaPad M5 8.4 | Medion Lifetab P10606 | Acer Iconia Tab 10 A3-A50 | Média 64 GB eMMC Flash | Média da turma Tablet | |
|---|---|---|---|---|---|---|---|---|---|
| AndroBench 3-5 | -60% | -45% | -61% | -12% | -35% | -47% | -20% | 464% | |
| Sequential Read 256KB (MB/s) | 277.6 | 135.1 -51% | 249.7 -10% | 159.1 -43% | 268.6 -3% | 274.7 -1% | 173.7 -37% | 278 ? 0% | 2073 ? 647% |
| Sequential Write 256KB (MB/s) | 207.9 | 38.01 -82% | 117.2 -44% | 47.23 -77% | 132.2 -36% | 74.2 -64% | 92.4 -56% | 178.6 ? -14% | 1667 ? 702% |
| Random Read 4KB (MB/s) | 94.2 | 35 -63% | 32.04 -66% | 21.55 -77% | 62.8 -33% | 34.59 -63% | 13.7 -85% | 60.9 ? -35% | 275 ? 192% |
| Random Write 4KB (MB/s) | 77.9 | 7.64 -90% | 31.35 -60% | 11.51 -85% | 65.1 -16% | 12.02 -85% | 8.77 -89% | 34.2 ? -56% | 324 ? 316% |
| Sequential Read 256KB SDCard (MB/s) | 84.2 ? | 87.7 4% | 61.7 ? -27% | 51.1 -39% | 84.9 ? 1% | 79.6 ? -5% | 80.4 ? -5% | 77.4 ? -8% | |
| Sequential Write 256KB SDCard (MB/s) | 61.2 ? | 14.6 -76% | 23.52 ? -62% | 34.15 -44% | 70.7 ? 16% | 64.9 ? 6% | 56.8 ? -7% | 58.3 ? -5% |
| Shadow Fight 3 | |||
| Configurações | Valor | ||
| high | 60 fps | ||
| PUBG Mobile | |||
| Configurações | Valor | ||
| Smooth | 30 fps | ||
| Balanced | 24 fps | ||
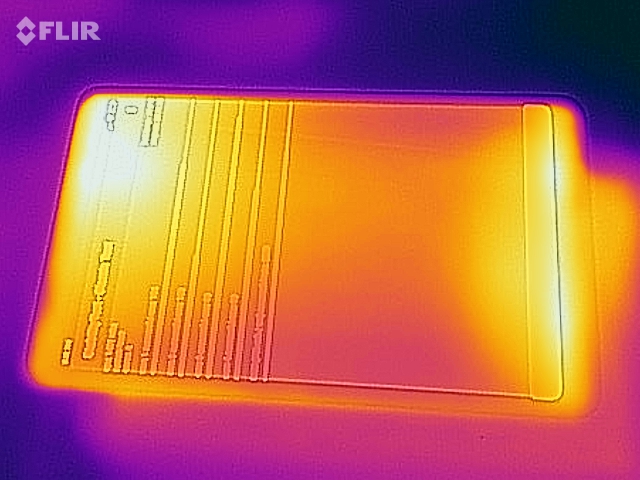
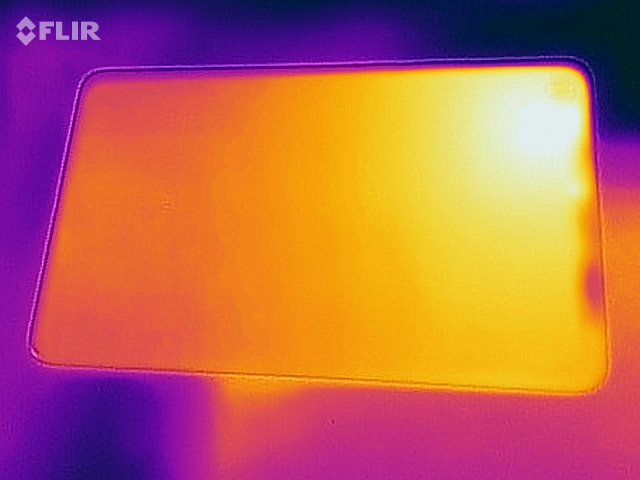
(±) A temperatura máxima no lado superior é 41.1 °C / 106 F, em comparação com a média de 33.7 °C / 93 F , variando de 20.7 a 53.2 °C para a classe Tablet.
(±) A parte inferior aquece até um máximo de 40.5 °C / 105 F, em comparação com a média de 33.2 °C / 92 F
(+) Em uso inativo, a temperatura média para o lado superior é 28.7 °C / 84 F, em comparação com a média do dispositivo de 30 °C / ### class_avg_f### F.
Xiaomi Mi Pad 4 análise de áudio
(+) | os alto-falantes podem tocar relativamente alto (###valor### dB)
Graves 100 - 315Hz
(-) | quase nenhum baixo - em média 75.1% menor que a mediana
(+) | o baixo é linear (0% delta para a frequência anterior)
Médios 400 - 2.000 Hz
(-) | quase nenhum médio - em média 75.1% menor que a mediana
(+) | médios são lineares (0% delta para frequência anterior)
Altos 2 - 16 kHz
(-) | quase nenhum máximo - em média 75.1% menor que a mediana
(+) | os máximos são lineares (0% delta da frequência anterior)
Geral 100 - 16.000 Hz
(-) | o som geral não é linear (110.9% diferença em relação à mediana)
Comparado com a mesma classe
» 98% de todos os dispositivos testados nesta classe foram melhores, 1% semelhantes, 1% piores
» O melhor teve um delta de 7%, a média foi 20%, o pior foi 129%
Comparado com todos os dispositivos testados
» 96% de todos os dispositivos testados foram melhores, 0% semelhantes, 4% piores
» O melhor teve um delta de 4%, a média foi 23%, o pior foi 134%
Huawei Mediapad M3 Lite 8 análise de áudio
(±) | o volume do alto-falante é médio, mas bom (###valor### dB)
Graves 100 - 315Hz
(-) | quase nenhum baixo - em média 18.4% menor que a mediana
(+) | o baixo é linear (4.6% delta para a frequência anterior)
Médios 400 - 2.000 Hz
(±) | médios reduzidos - em média 5.9% menor que a mediana
(±) | a linearidade dos médios é média (7.6% delta para frequência anterior)
Altos 2 - 16 kHz
(±) | máximos mais altos - em média 7.4% maior que a mediana
(+) | os máximos são lineares (6.9% delta da frequência anterior)
Geral 100 - 16.000 Hz
(-) | o som geral não é linear (30.3% diferença em relação à mediana)
Comparado com a mesma classe
» 90% de todos os dispositivos testados nesta classe foram melhores, 3% semelhantes, 8% piores
» O melhor teve um delta de 7%, a média foi 20%, o pior foi 129%
Comparado com todos os dispositivos testados
» 89% de todos os dispositivos testados foram melhores, 3% semelhantes, 9% piores
» O melhor teve um delta de 4%, a média foi 23%, o pior foi 134%
| desligado | |
| Ocioso | |
| Carga |
|
Key:
min: | |
| Xiaomi Mi Pad 4 6000 mAh | Huawei Mediapad M3 Lite 8 4800 mAh | Huawei MediaPad M3 8.4 inch 5100 mAh | Amazon Fire HD 8 2017 mAh | Huawei MediaPad M5 8.4 5100 mAh | Medion Lifetab P10606 7000 mAh | Acer Iconia Tab 10 A3-A50 6100 mAh | |
|---|---|---|---|---|---|---|---|
| Power Consumption | -88% | -8% | 24% | -21% | -22% | -78% | |
| Idle Minimum * (Watt) | 1.2 | 4.02 -235% | 1.51 -26% | 0.99 17% | 2.1 -75% | 1.4 -17% | 3.21 -168% |
| Idle Average * (Watt) | 2.2 | 6 -173% | 3.64 -65% | 2.74 -25% | 3.74 -70% | 4.17 -90% | 5.97 -171% |
| Idle Maximum * (Watt) | 4.1 | 6.64 -62% | 3.68 10% | 2.83 31% | 4.33 -6% | 4.2 -2% | 6.19 -51% |
| Load Average * (Watt) | 8.2 | 7.34 10% | 6.95 15% | 4.51 45% | 6.32 23% | 7.5 9% | 9.72 -19% |
| Load Maximum * (Watt) | 12.2 | 9.6 21% | 9.11 25% | 5.69 53% | 9.13 25% | 13.71 -12% | 9.97 18% |
* ... menor é melhor
| Xiaomi Mi Pad 4 6000 mAh | Huawei Mediapad M3 Lite 8 4800 mAh | Huawei MediaPad M3 8.4 inch 5100 mAh | Amazon Fire HD 8 2017 mAh | Huawei MediaPad M5 8.4 5100 mAh | Medion Lifetab P10606 7000 mAh | Acer Iconia Tab 10 A3-A50 6100 mAh | |
|---|---|---|---|---|---|---|---|
| Duração da bateria | 41% | -17% | 26% | -7% | 22% | -40% | |
| Reader / Idle (h) | 22.7 | 23 1% | 18.5 -19% | 33.9 49% | 19.2 -15% | 25.1 11% | 12.3 -46% |
| H.264 (h) | 15.2 | 9.7 -36% | 12.4 -18% | 11.7 -23% | 11 -28% | ||
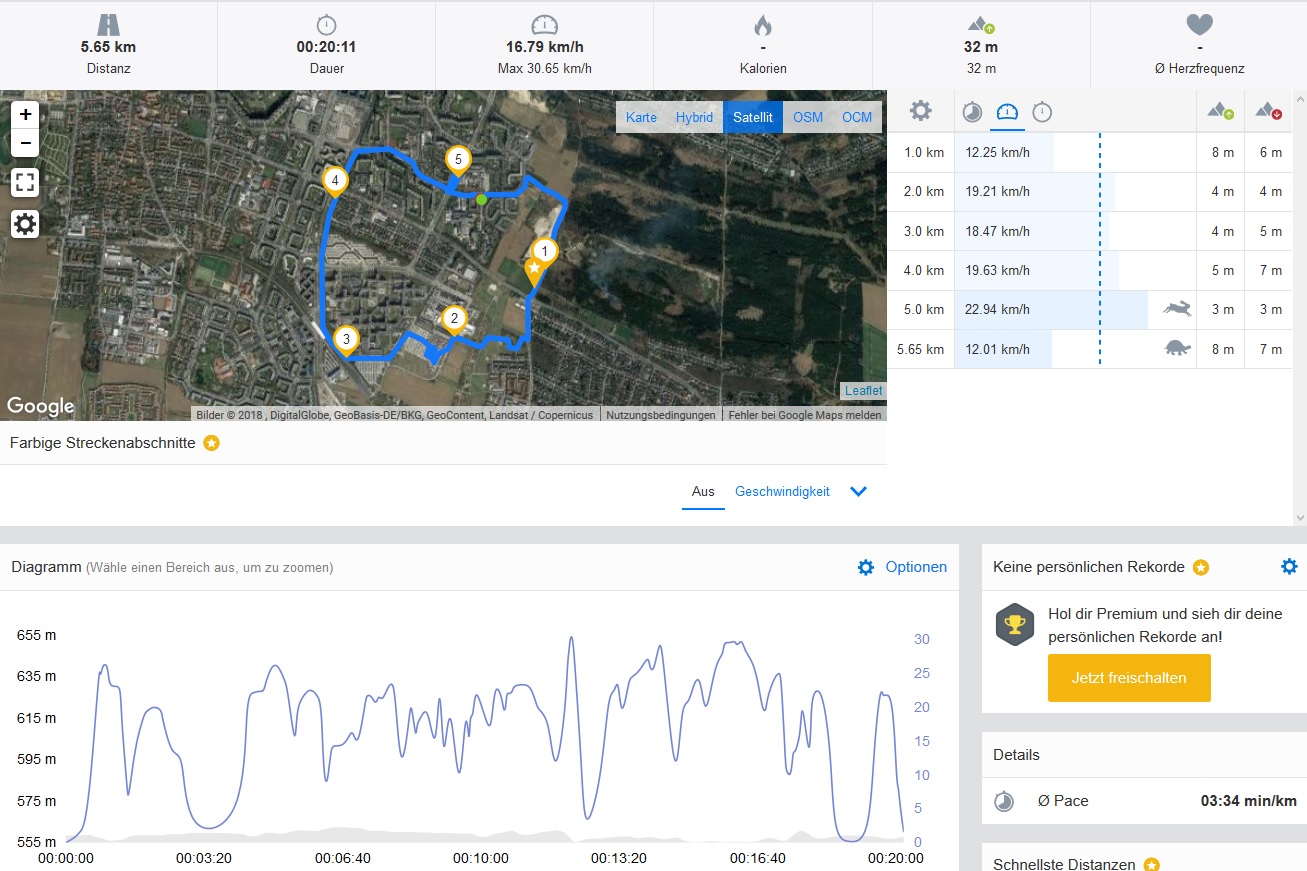
| WiFi v1.3 (h) | 13.8 | 14.6 6% | 9.1 -34% | 12.8 -7% | 10.5 -24% | 13.3 -4% | 6.5 -53% |
| Load (h) | 3.7 | 8 116% | 4.5 22% | 6.6 78% | 5 35% | 7.7 108% | 2.9 -22% |
Pro
Contra

A Xiaomi conseguiu criar um tablet surpreendentemente bom com uma forte relação preço/desempenho. O Mi Pad 4 é um tablet de baixo custo que nos impressionou durante os testes, apesar de apenas ter hardware de gama média.
Talvez seja esperado, a Xiaomi fez alguns compromissos para manter o custo baixo. No geral, o Mi Pad 4 é um excelente tablet para o dinheiro.
O Mi Pad 4 compete no mesmo nível de seus competidores Huawei, que são muito mais caros em termos de duração de bateria, desempenho e qualidade de acabamento. A Xiaomi até equipou o dispositivo com um módulo Wi-Fi mais rápido que todos os nossos dispositivos de comparação.
Alguns recursos, como a má implementação do desbloqueio facial, estragam a experiência geral. Da mesma forma, a tela tem uma taxa de contraste relativamente baixa e a câmera também poderia ser melhor. A omissão de um leitor de digitais e NFC, também parece ser uma oportunidade perdida.
Finalmente, vale a pena ter em mente que pelo momento, o Mi Pad 4 suporta apenas uma versão chinesa do MIUI e a variante LTE não suporta a banda LTE 20, que é comumente usada em toda a Europa.
Xiaomi Mi Pad 4
- 09/16/2019 v7 (old)
Marcus Herbrich
Price comparison
