Breve Análise do Tablet Huawei MediaPad M5 8.4


| |||||||||||||||||||||||||
iluminação: 92 %
iluminação com acumulador: 403 cd/m²
Contraste: 604:1 (Preto: 0.67 cd/m²)
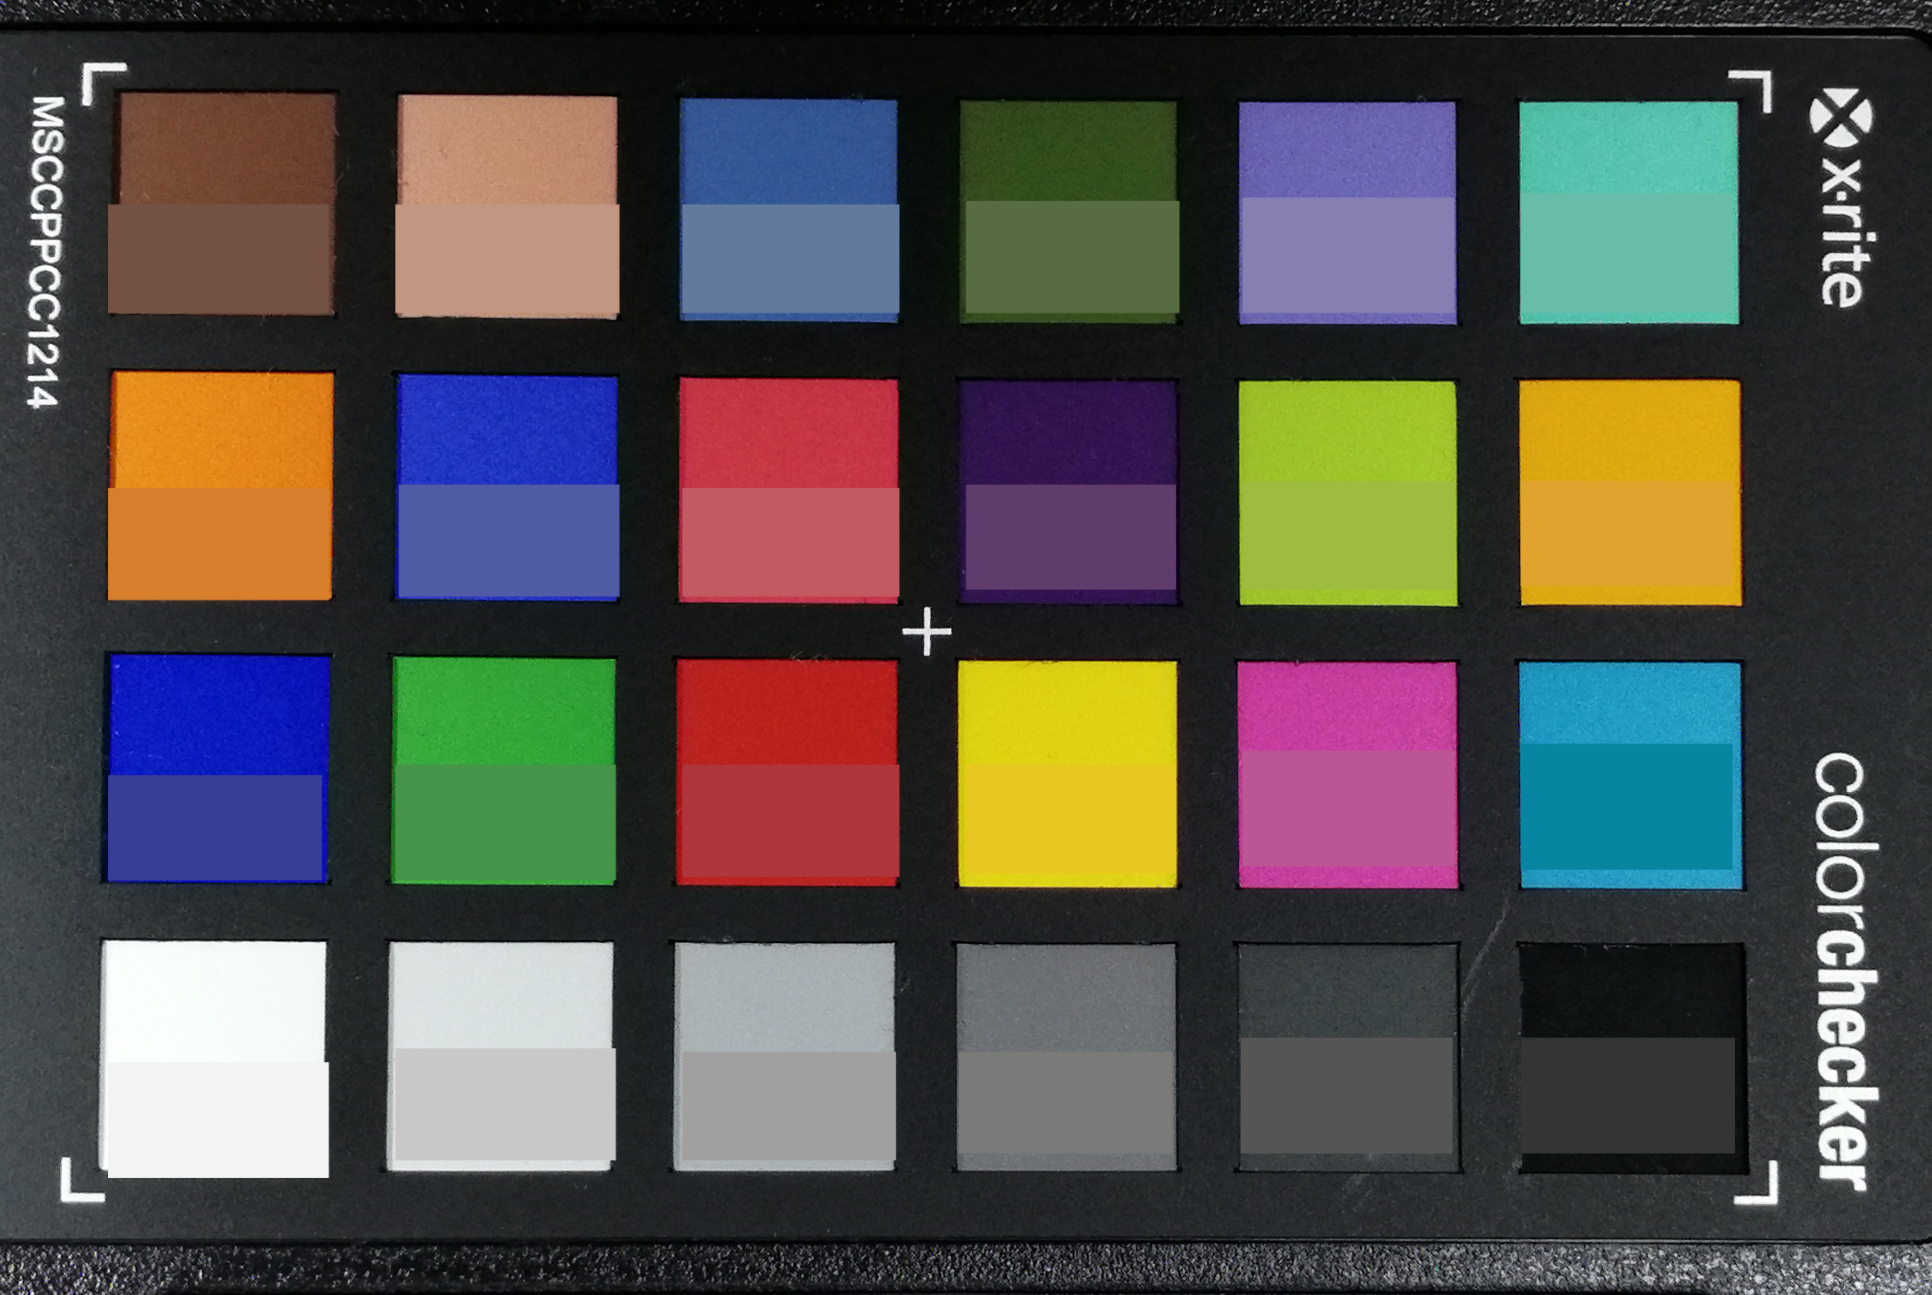
ΔE ColorChecker Calman: 5.78 | ∀{0.5-29.43 Ø4.73}
ΔE Greyscale Calman: 7.2 | ∀{0.09-98 Ø4.97}
99.8% sRGB (Calman 2D)
Gamma: 2.278
CCT: 8405 K
| Huawei MediaPad M5 8.4 IPS, 2560x1600, 8.4" | Amazon Fire HD 8 2017 IPS, 1280x800, 8" | Lenovo Tab 4 8 IPS, 1280x800, 8" | Samsung Galaxy Tab Active 2 TFT LCD, 1280x800, 8" | Huawei MediaPad M3 8.4 inch IPS, 2560x1600, 8.4" | |
|---|---|---|---|---|---|
| Screen | -1% | 9% | 34% | 16% | |
| Brightness middle (cd/m²) | 405 | 419 3% | 455 12% | 509 26% | 460 14% |
| Brightness (cd/m²) | 392 | 412 5% | 446 14% | 477 22% | 445 14% |
| Brightness Distribution (%) | 92 | 91 -1% | 91 -1% | 91 -1% | 90 -2% |
| Black Level * (cd/m²) | 0.67 | 0.39 42% | 0.51 24% | 0.48 28% | 0.45 33% |
| Contrast (:1) | 604 | 1074 78% | 892 48% | 1060 75% | 1022 69% |
| Colorchecker dE 2000 * | 5.78 | 8.5 -47% | 5.5 5% | 3.45 40% | 6.2 -7% |
| Colorchecker dE 2000 max. * | 9.82 | 13.8 -41% | 14.8 -51% | 5.17 47% | 10.5 -7% |
| Greyscale dE 2000 * | 7.2 | 10.3 -43% | 5.5 24% | 4.5 37% | 6.5 10% |
| Gamma | 2.278 97% | 2.6 85% | 2.23 99% | 2.11 104% | 2.33 94% |
| CCT | 8405 77% | 6216 105% | 7852 83% | 7171 91% | 8056 81% |
* ... menor é melhor
Cintilação da tela / PWM (modulação por largura de pulso)
| Tela tremeluzindo/PWM detectado | 2451 Hz | ≤ 25 % configuração de brilho | 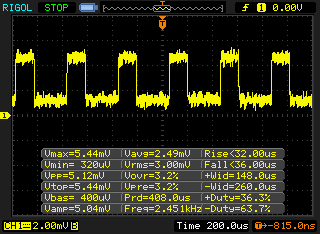 |
A luz de fundo da tela pisca em 2451 Hz (pior caso, por exemplo, utilizando PWM) Cintilação detectada em uma configuração de brilho de 25 % e abaixo. Não deve haver cintilação ou PWM acima desta configuração de brilho. A frequência de 2451 Hz é bastante alta, então a maioria dos usuários sensíveis ao PWM não deve notar nenhuma oscilação. [pwm_comparison] Em comparação: 52 % de todos os dispositivos testados não usam PWM para escurecer a tela. Se PWM foi detectado, uma média de 7798 (mínimo: 5 - máximo: 343500) Hz foi medida. | |||
Exibir tempos de resposta
| ↔ Tempo de resposta preto para branco | ||
|---|---|---|
| 20.5 ms ... ascensão ↗ e queda ↘ combinadas | ↗ 19 ms ascensão | 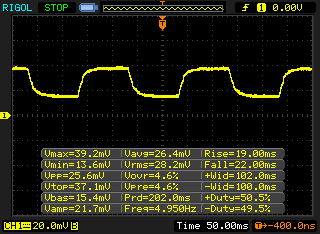 |
| ↘ 22 ms queda | ||
| A tela mostra boas taxas de resposta em nossos testes, mas pode ser muito lenta para jogadores competitivos. Em comparação, todos os dispositivos testados variam de 0.1 (mínimo) a 240 (máximo) ms. » 46 % de todos os dispositivos são melhores. Isso significa que o tempo de resposta medido é semelhante à média de todos os dispositivos testados (19.9 ms). | ||
| ↔ Tempo de resposta 50% cinza a 80% cinza | ||
| 13 ms ... ascensão ↗ e queda ↘ combinadas | ↗ 15 ms ascensão | 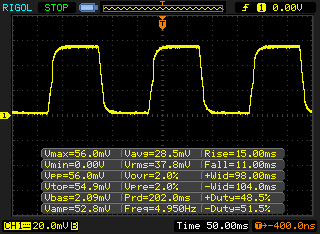 |
| ↘ 11 ms queda | ||
| A tela mostra boas taxas de resposta em nossos testes, mas pode ser muito lenta para jogadores competitivos. Em comparação, todos os dispositivos testados variam de 0.165 (mínimo) a 636 (máximo) ms. » 26 % de todos os dispositivos são melhores. Isso significa que o tempo de resposta medido é melhor que a média de todos os dispositivos testados (31.1 ms). | ||
| AnTuTu v6 - Total Score | |
| Huawei MediaPad M5 8.4 | |
| Média HiSilicon Kirin 960 (124087 - 157445, n=7) | |
| Huawei MediaPad M3 8.4 inch | |
| Samsung Galaxy Tab Active 2 | |
| Lenovo Tab 4 8 | |
| Amazon Fire HD 8 2017 | |
| AnTuTu v7 - Total Score | |
| Huawei MediaPad M5 8.4 | |
| Média HiSilicon Kirin 960 (170015 - 181614, n=4) | |
| PCMark for Android | |
| Work performance score | |
| Média HiSilicon Kirin 960 (6830 - 7403, n=7) | |
| Huawei MediaPad M5 8.4 | |
| Huawei MediaPad M3 8.4 inch | |
| Samsung Galaxy Tab Active 2 | |
| Lenovo Tab 4 8 | |
| Amazon Fire HD 8 2017 | |
| Work 2.0 performance score | |
| Média HiSilicon Kirin 960 (6006 - 6299, n=7) | |
| Huawei MediaPad M5 8.4 | |
| Samsung Galaxy Tab Active 2 | |
| Lenovo Tab 4 8 | |
| Amazon Fire HD 8 2017 | |
| GFXBench 3.1 | |
| on screen Manhattan ES 3.1 Onscreen | |
| Média da turma Tablet (9.2 - 160, n=57, últimos 2 anos) | |
| Média HiSilicon Kirin 960 (12 - 28, n=7) | |
| Huawei MediaPad M5 8.4 | |
| Samsung Galaxy Tab Active 2 | |
| Amazon Fire HD 8 2017 | |
| Huawei MediaPad M3 8.4 inch | |
| 1920x1080 Manhattan ES 3.1 Offscreen | |
| Média da turma Tablet (9.8 - 359, n=57, últimos 2 anos) | |
| Huawei MediaPad M5 8.4 | |
| Média HiSilicon Kirin 960 (21 - 28, n=7) | |
| Huawei MediaPad M3 8.4 inch | |
| Samsung Galaxy Tab Active 2 | |
| Amazon Fire HD 8 2017 | |
| Octane V2 - Total Score | |
| Média da turma Tablet (763 - 138481, n=73, últimos 2 anos) | |
| Huawei MediaPad M3 8.4 inch (Chrome 54) | |
| Huawei MediaPad M5 8.4 (Chrome 66) | |
| Média HiSilicon Kirin 960 (10016 - 11897, n=7) | |
| Samsung Galaxy Tab Active 2 | |
| Lenovo Tab 4 8 (Chrome 61) | |
| Amazon Fire HD 8 2017 (Amazon Silk 58.2.3029.83.10) | |
| WebXPRT 2015 - Overall | |
| Huawei MediaPad M5 8.4 (Chrome 66) | |
| Média HiSilicon Kirin 960 (107 - 184, n=7) | |
| Huawei MediaPad M3 8.4 inch (Chrome 54) | |
| Lenovo Tab 4 8 (Chrome 61) | |
| Samsung Galaxy Tab Active 2 | |
| Amazon Fire HD 8 2017 (Amazon Silk 58.2.3029.83.10) | |
| JetStream 1.1 - 1.1 Total | |
| Média HiSilicon Kirin 960 (56.8 - 68.6, n=7) | |
| Huawei MediaPad M5 8.4 (Chrome 66) | |
| Huawei MediaPad M3 8.4 inch (Chrome 54) | |
| Samsung Galaxy Tab Active 2 | |
| Amazon Fire HD 8 2017 (Amazon Silk 58.2.3029.83.10) | |
| Lenovo Tab 4 8 (Chrome 61) | |
| Mozilla Kraken 1.1 - Total | |
| Lenovo Tab 4 8 (Chrome 61) | |
| Amazon Fire HD 8 2017 (Amazon Silk 58.2.3029.83.10) | |
| Samsung Galaxy Tab Active 2 | |
| Huawei MediaPad M5 8.4 (Chrome 66) | |
| Média HiSilicon Kirin 960 (2734 - 3734, n=7) | |
| Huawei MediaPad M3 8.4 inch (Chrome 54) | |
| Média da turma Tablet (243 - 27101, n=67, últimos 2 anos) | |
* ... menor é melhor
| Huawei MediaPad M5 8.4 | Amazon Fire HD 8 2017 | Lenovo Tab 4 8 | Samsung Galaxy Tab Active 2 | Huawei MediaPad M3 8.4 inch | Média 32 GB eMMC Flash | Média da turma Tablet | |
|---|---|---|---|---|---|---|---|
| AndroBench 3-5 | -58% | -30% | -39% | -36% | -29% | 610% | |
| Sequential Read 256KB (MB/s) | 268.6 | 159.1 -41% | 265.1 -1% | 218.1 -19% | 249.7 -7% | 242 ? -10% | 1987 ? 640% |
| Sequential Write 256KB (MB/s) | 132.2 | 47.23 -64% | 72.3 -45% | 54 -59% | 117.2 -11% | 100.5 ? -24% | 1580 ? 1095% |
| Random Read 4KB (MB/s) | 62.8 | 21.55 -66% | 44 -30% | 25.96 -59% | 32.04 -49% | 43.1 ? -31% | 268 ? 327% |
| Random Write 4KB (MB/s) | 65.1 | 11.51 -82% | 7.1 -89% | 10.98 -83% | 31.35 -52% | 22.3 ? -66% | 312 ? 379% |
| Sequential Read 256KB SDCard (MB/s) | 84.9 ? | 51.1 -40% | 84.8 0% | 78.6 -7% | 61.7 ? -27% | 71.8 ? -15% | |
| Sequential Write 256KB SDCard (MB/s) | 70.7 ? | 34.15 -52% | 61.1 -14% | 64.3 -9% | 23.52 ? -67% | 52.9 ? -25% |
| Shadow Fight 3 | |||
| Configurações | Valor | ||
| high | 58 fps | ||
| minimal | 58 fps | ||
| Arena of Valor | |||
| Configurações | Valor | ||
| min | 58 fps | ||
| high HD | 58 fps | ||
| Battle Bay | |||
| Configurações | Valor | ||
| half resolution | 58 fps | ||
| full resolution | 58 fps | ||
(+) A temperatura máxima no lado superior é 38.2 °C / 101 F, em comparação com a média de 33.6 °C / 92 F , variando de 20.7 a 53.2 °C para a classe Tablet.
(+) A parte inferior aquece até um máximo de 36.4 °C / 98 F, em comparação com a média de 33.2 °C / 92 F
(+) Em uso inativo, a temperatura média para o lado superior é 30.8 °C / 87 F, em comparação com a média do dispositivo de 30 °C / ### class_avg_f### F.
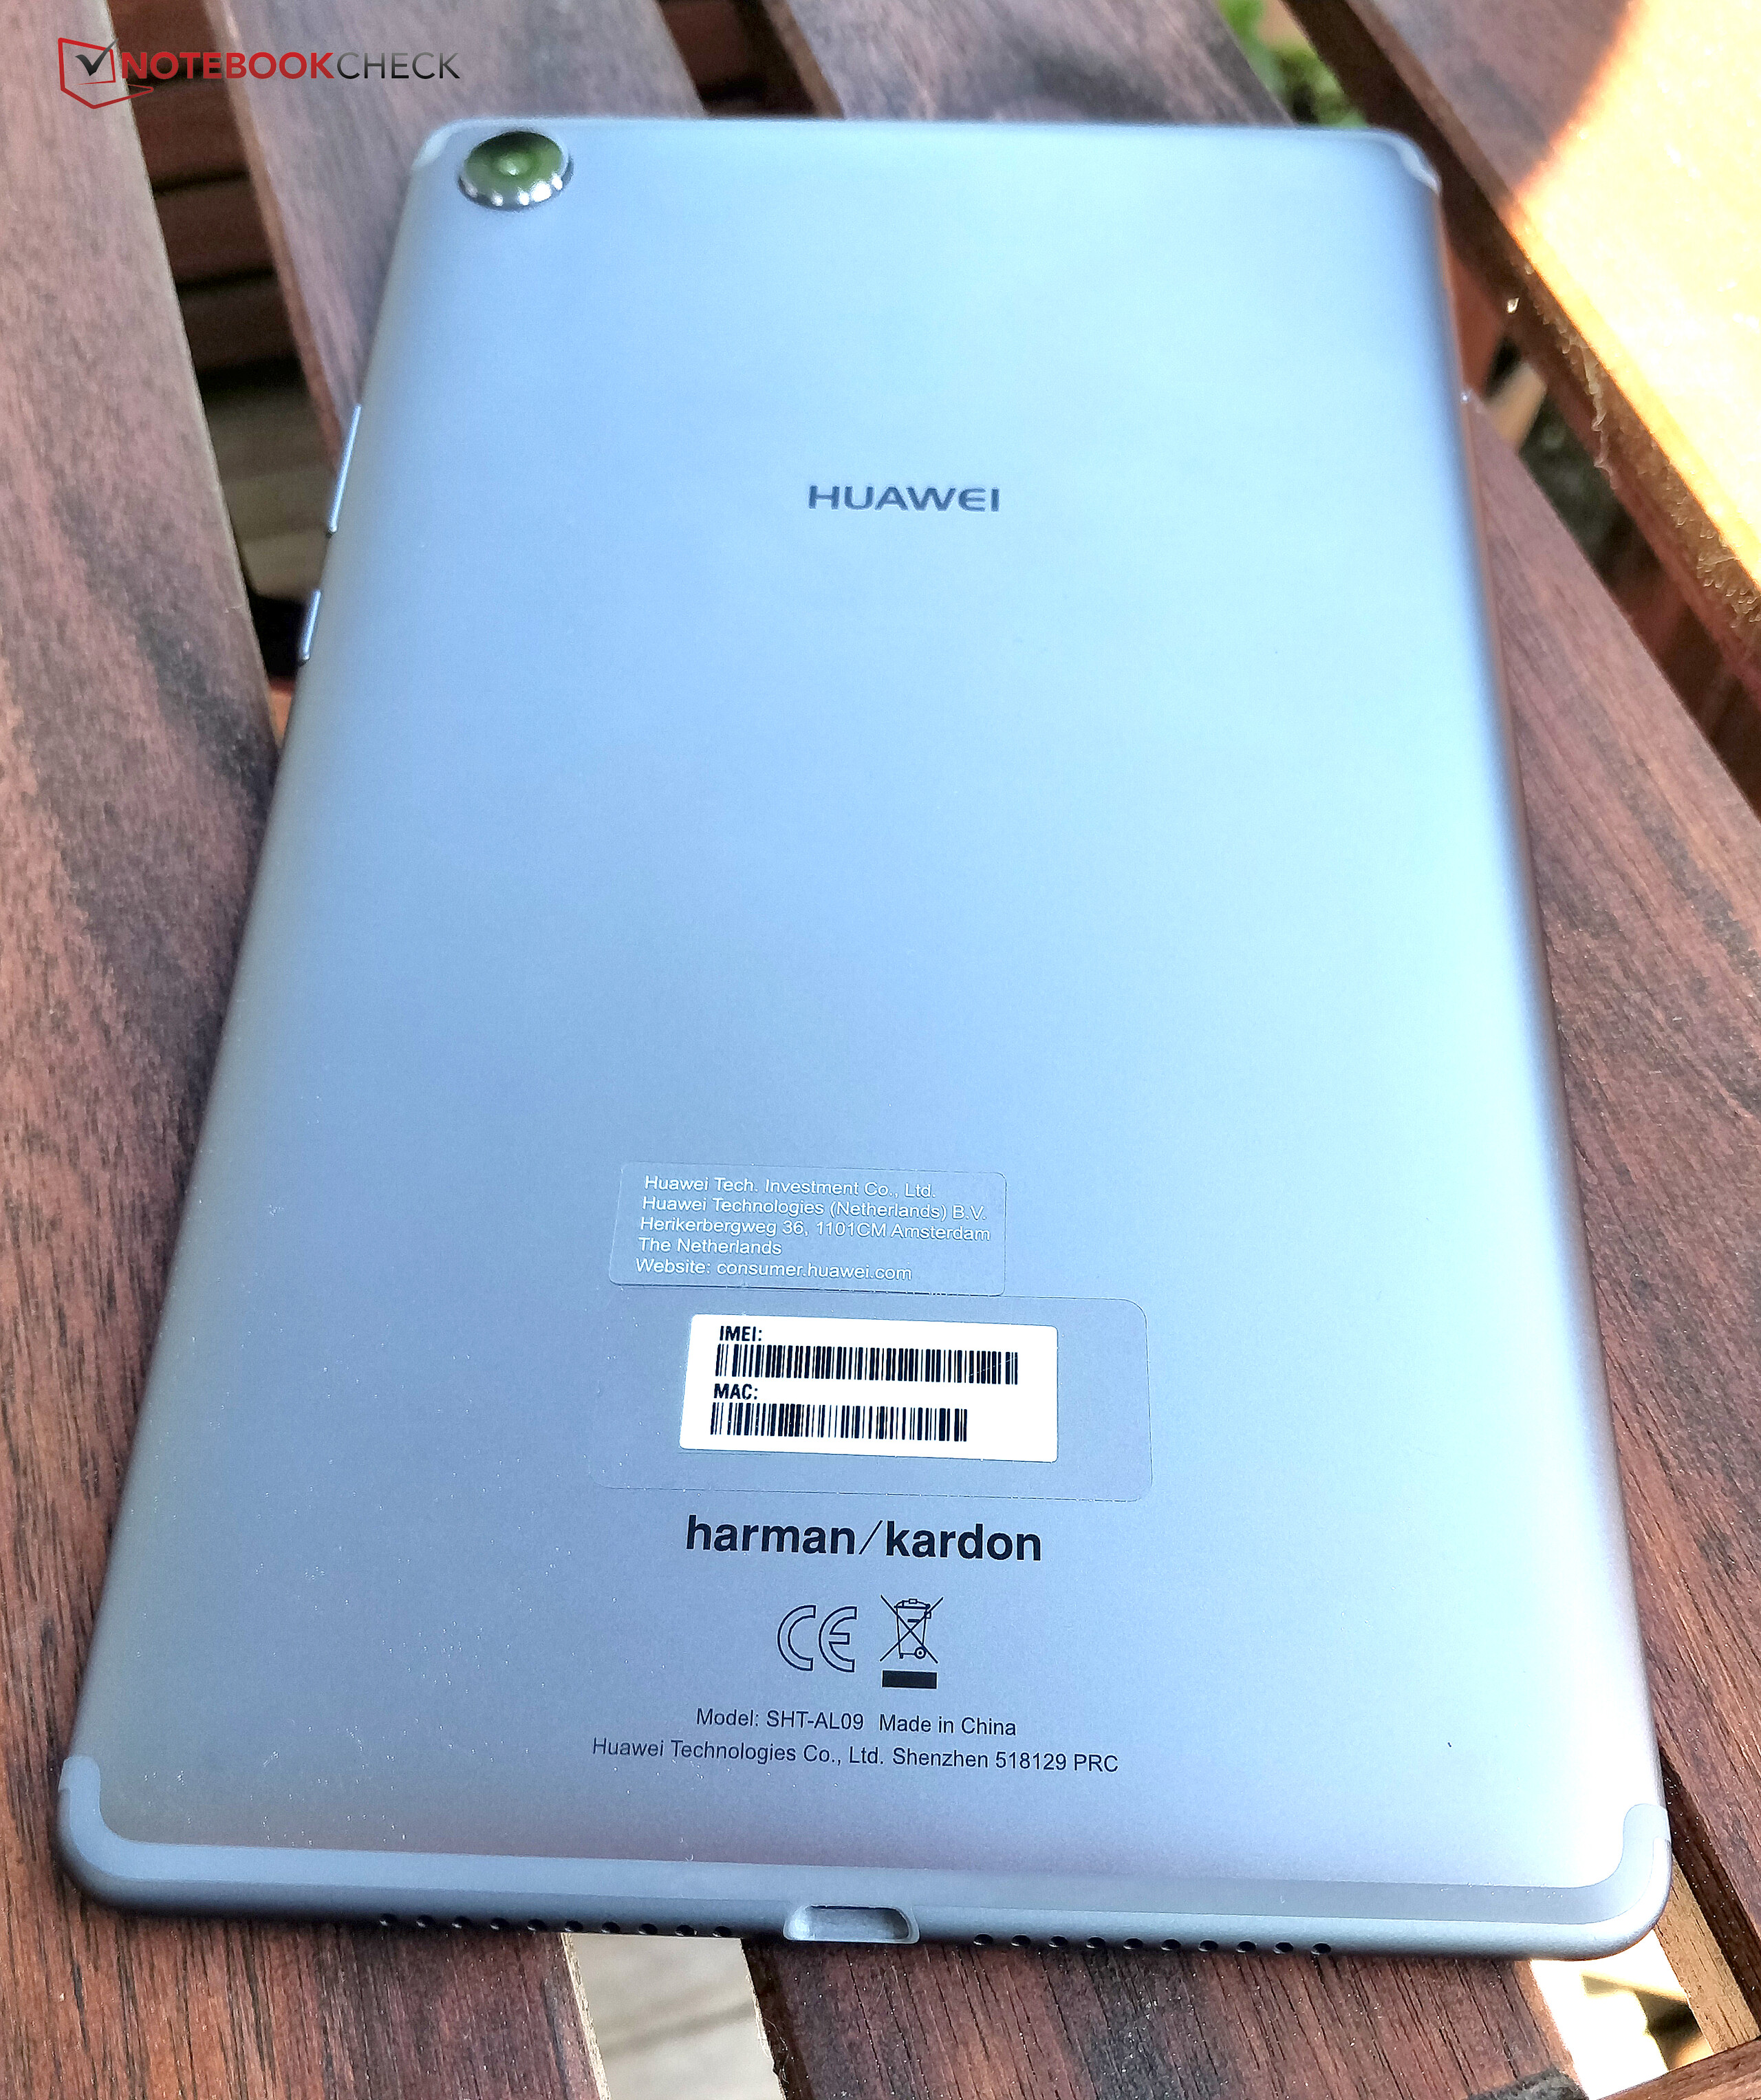
Huawei MediaPad M5 8.4 análise de áudio
(+) | os alto-falantes podem tocar relativamente alto (###valor### dB)
Graves 100 - 315Hz
(-) | quase nenhum baixo - em média 19.2% menor que a mediana
(±) | a linearidade dos graves é média (12.5% delta para a frequência anterior)
Médios 400 - 2.000 Hz
(+) | médios equilibrados - apenas 3.6% longe da mediana
(+) | médios são lineares (2.7% delta para frequência anterior)
Altos 2 - 16 kHz
(+) | agudos equilibrados - apenas 4.2% longe da mediana
(+) | os máximos são lineares (3.5% delta da frequência anterior)
Geral 100 - 16.000 Hz
(±) | a linearidade do som geral é média (15.9% diferença em relação à mediana)
Comparado com a mesma classe
» 35% de todos os dispositivos testados nesta classe foram melhores, 6% semelhantes, 59% piores
» O melhor teve um delta de 7%, a média foi 20%, o pior foi 129%
Comparado com todos os dispositivos testados
» 25% de todos os dispositivos testados foram melhores, 5% semelhantes, 70% piores
» O melhor teve um delta de 4%, a média foi 24%, o pior foi 134%
Huawei MediaPad M3 8.4 inch análise de áudio
(+) | os alto-falantes podem tocar relativamente alto (###valor### dB)
Graves 100 - 315Hz
(-) | quase nenhum baixo - em média 26.8% menor que a mediana
(±) | a linearidade dos graves é média (14.3% delta para a frequência anterior)
Médios 400 - 2.000 Hz
(+) | médios equilibrados - apenas 4.1% longe da mediana
(+) | médios são lineares (3.9% delta para frequência anterior)
Altos 2 - 16 kHz
(±) | máximos mais altos - em média 6.3% maior que a mediana
(±) | a linearidade dos máximos é média (8.1% delta para frequência anterior)
Geral 100 - 16.000 Hz
(±) | a linearidade do som geral é média (23% diferença em relação à mediana)
Comparado com a mesma classe
» 71% de todos os dispositivos testados nesta classe foram melhores, 5% semelhantes, 24% piores
» O melhor teve um delta de 7%, a média foi 20%, o pior foi 129%
Comparado com todos os dispositivos testados
» 69% de todos os dispositivos testados foram melhores, 5% semelhantes, 26% piores
» O melhor teve um delta de 4%, a média foi 24%, o pior foi 134%
| desligado | |
| Ocioso | |
| Carga |
|
Key:
min: | |
| Huawei MediaPad M5 8.4 5100 mAh | Amazon Fire HD 8 2017 mAh | Lenovo Tab 4 8 4850 mAh | Samsung Galaxy Tab Active 2 4450 mAh | Huawei MediaPad M3 8.4 inch 5100 mAh | |
|---|---|---|---|---|---|
| Power Consumption | 36% | 23% | 35% | 7% | |
| Idle Minimum * (Watt) | 2.1 | 0.99 53% | 1.1 48% | 0.89 58% | 1.51 28% |
| Idle Average * (Watt) | 3.74 | 2.74 27% | 3.51 6% | 3.13 16% | 3.64 3% |
| Idle Maximum * (Watt) | 4.33 | 2.83 35% | 4.14 4% | 3.36 22% | 3.68 15% |
| Load Average * (Watt) | 6.32 | 4.51 29% | 4.86 23% | 3.93 38% | 6.95 -10% |
| Load Maximum * (Watt) | 9.13 | 5.69 38% | 6.13 33% | 5.45 40% | 9.11 -0% |
* ... menor é melhor
| Huawei MediaPad M5 8.4 5100 mAh | Amazon Fire HD 8 2017 mAh | Lenovo Tab 4 8 4850 mAh | Samsung Galaxy Tab Active 2 4450 mAh | Huawei MediaPad M3 8.4 inch 5100 mAh | |
|---|---|---|---|---|---|
| Duração da bateria | 34% | -12% | 16% | -11% | |
| Reader / Idle (h) | 19.2 | 33.9 77% | 20.1 5% | 22.6 18% | 18.5 -4% |
| H.264 (h) | 11.7 | 12.4 6% | 10.1 -14% | 8.2 -30% | 9.7 -17% |
| WiFi v1.3 (h) | 10.5 | 12.8 22% | 7.5 -29% | 14.9 42% | 9.1 -13% |
| Load (h) | 5 | 6.6 32% | 4.6 -8% | 6.6 32% | 4.5 -10% |
Pro
Contra
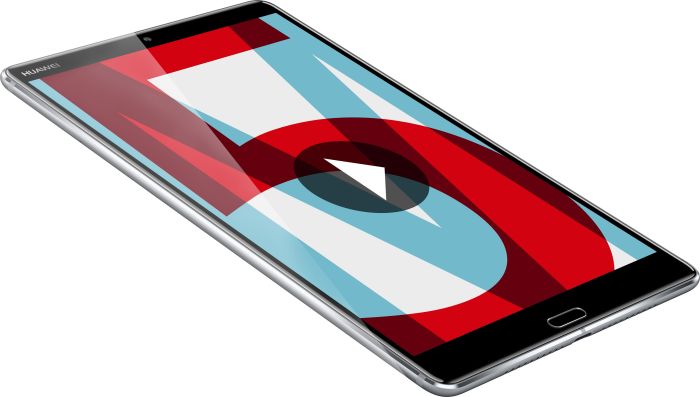
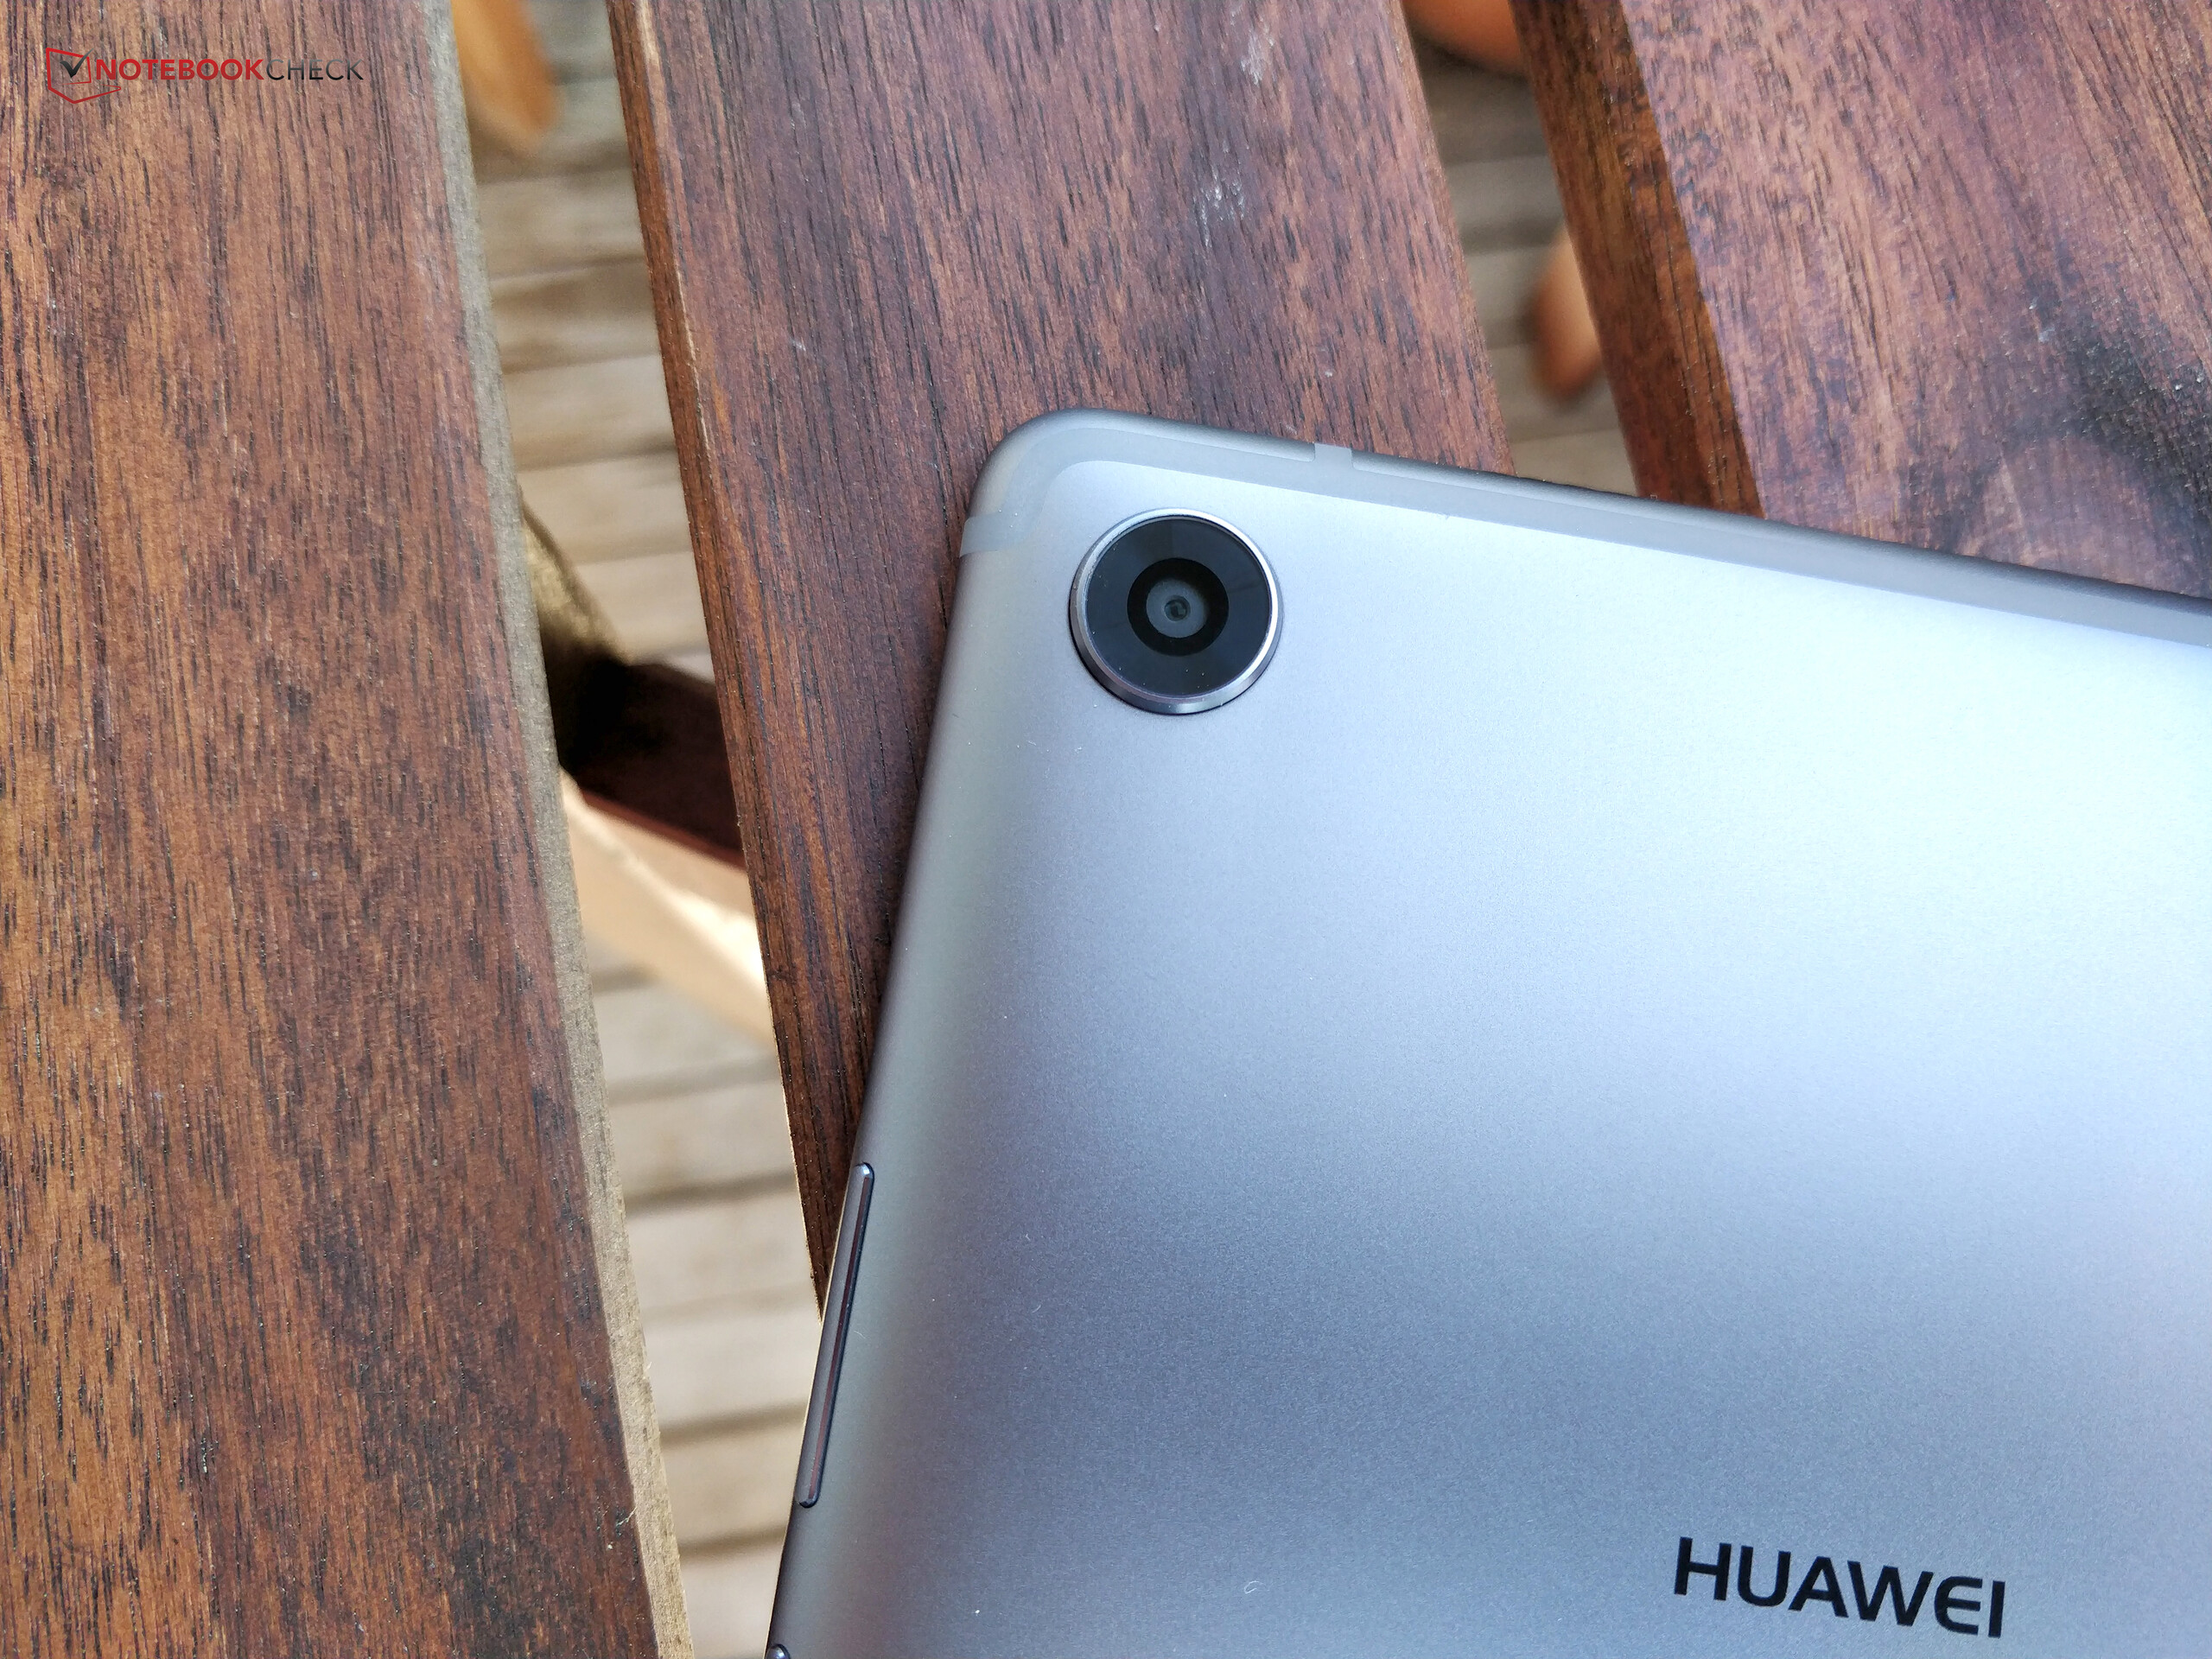
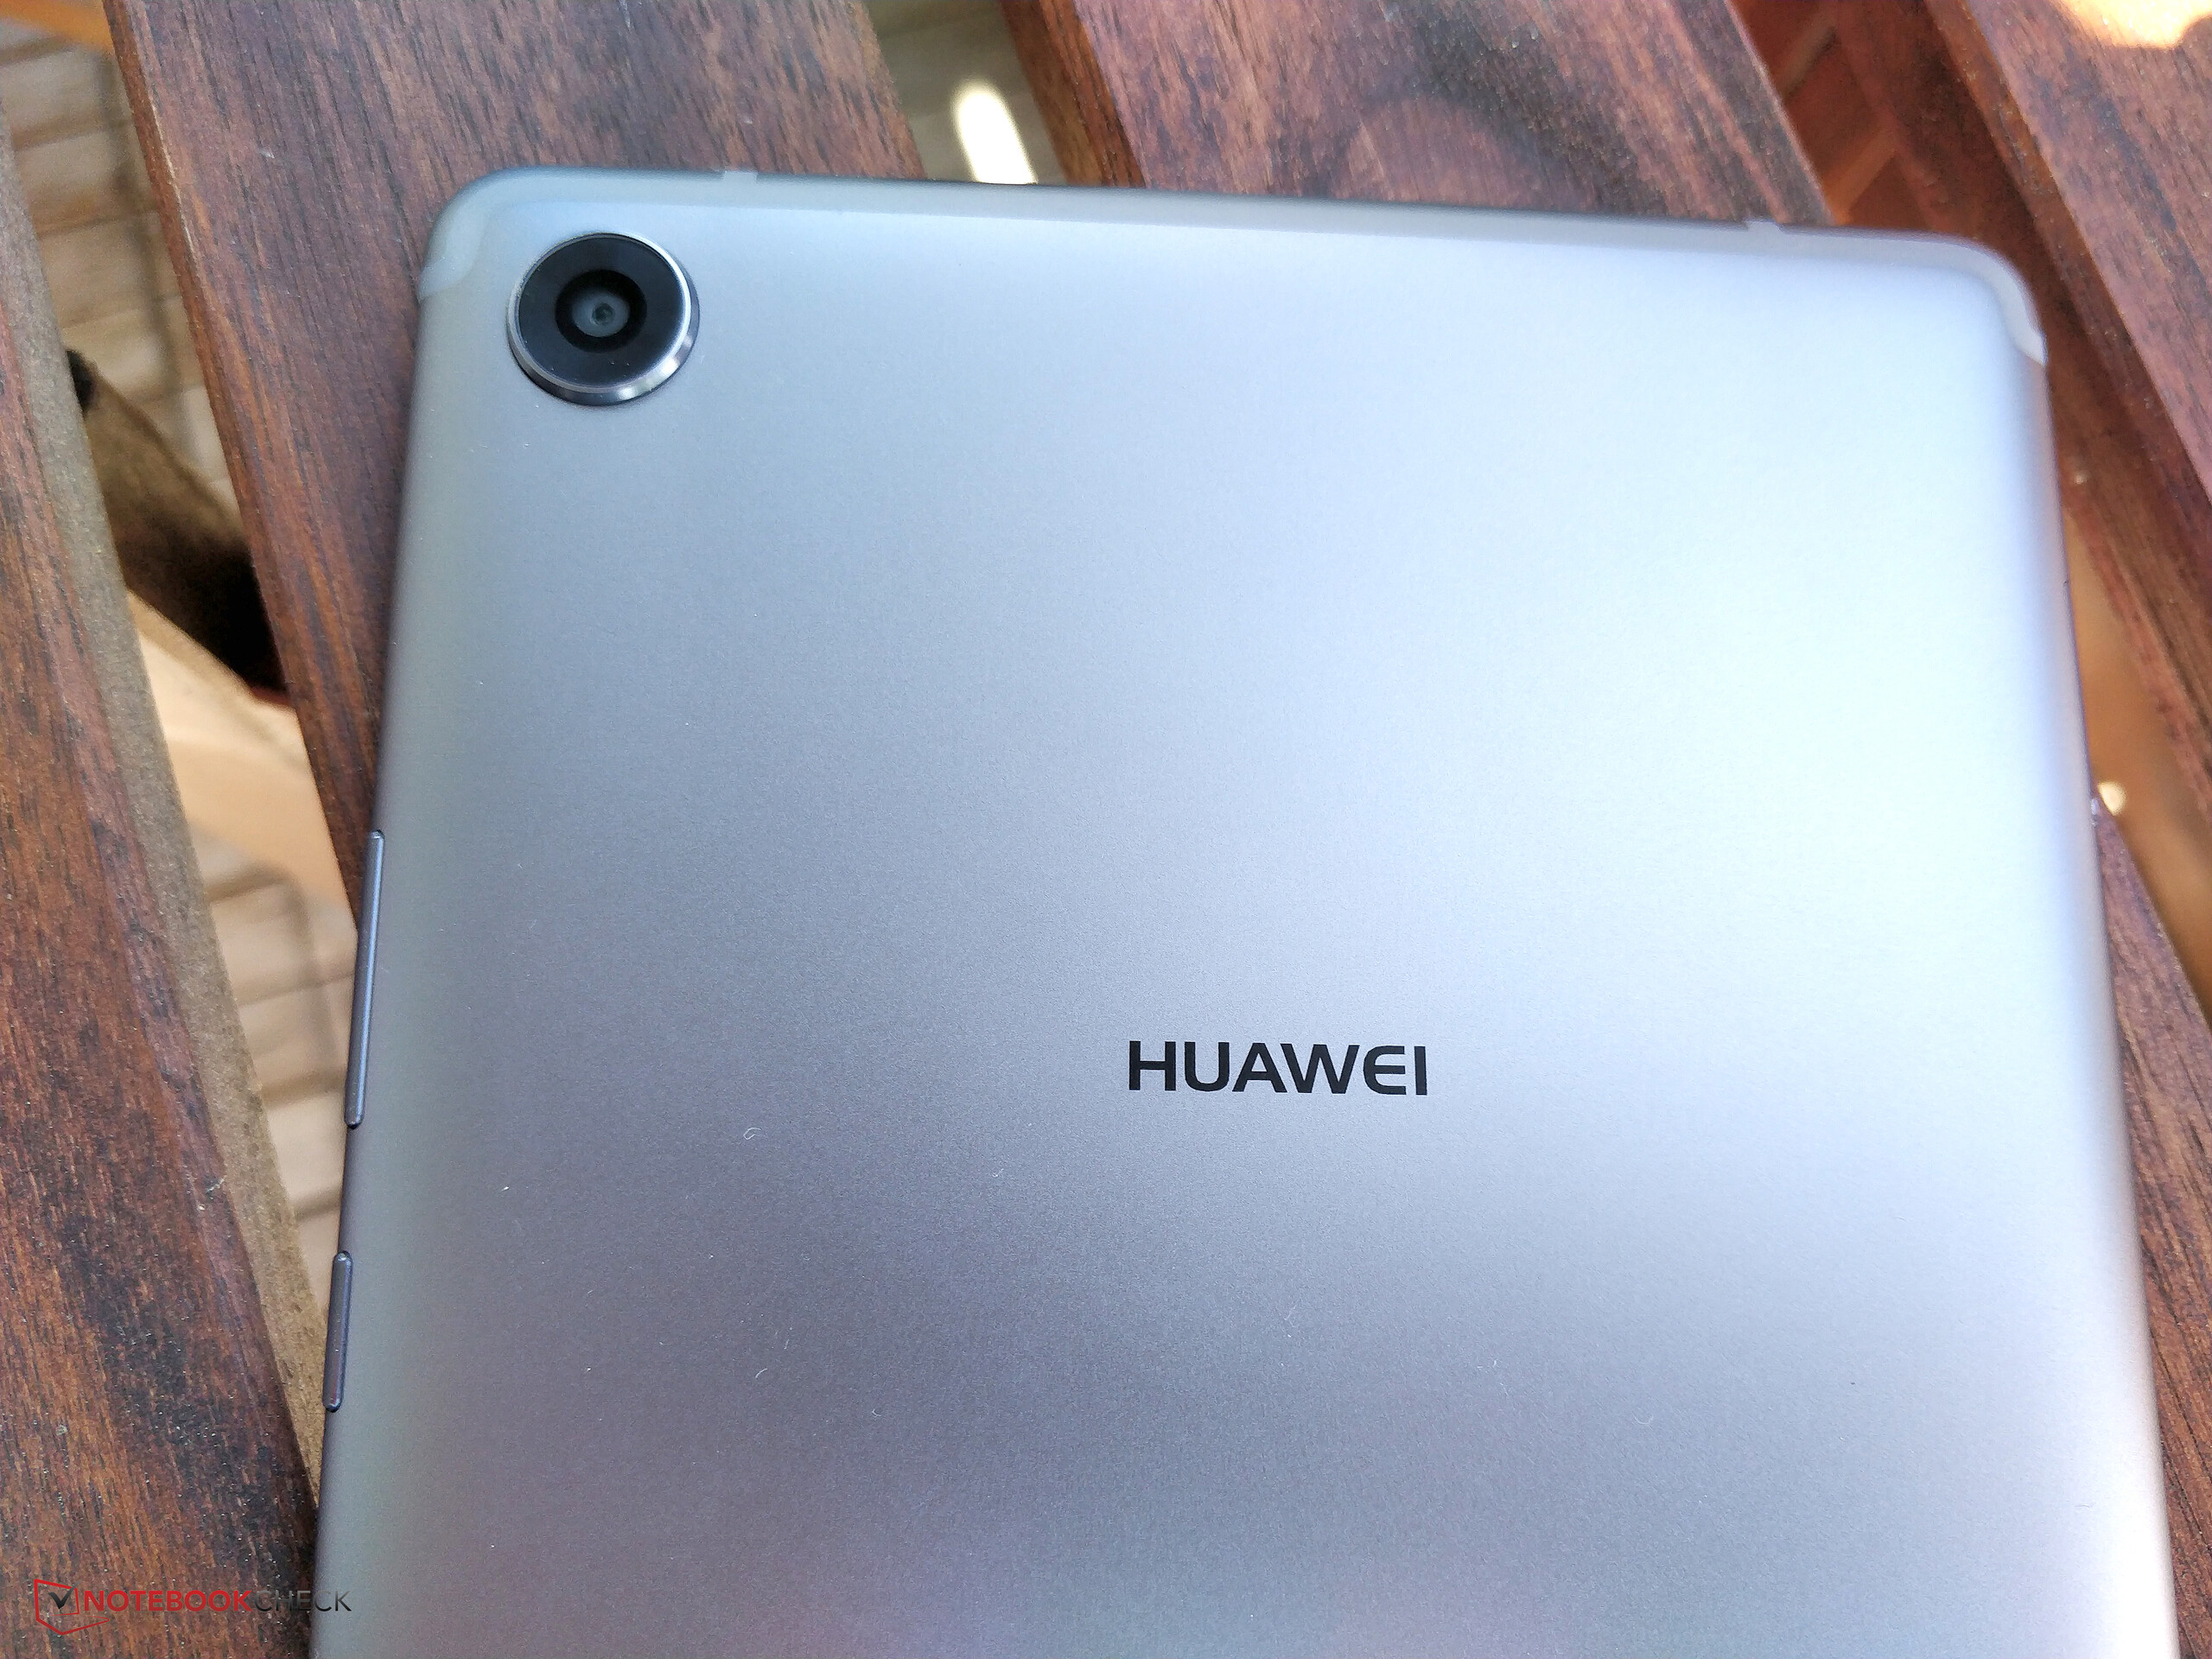
Com o MediaPad M5 8.4, a Huawei está oferecendo um tablet bastante elegante no mercado, que vale o seu preço um pouco mais alto. Isso é garantido pelas boas câmeras, pela tela de alta resolução, pelos poderosos alto-falantes e por alguns gimmicks como a capacidade de fazer chamadas telefônicas. Oferece um bom desempenho e a carcaça ergonômica de alta qualidade se sente bem nas mãos.
No entanto, você terá que se virar sem uma porta de áudio clássica no MediPad M5 8.4, às vezes a tela táctil é um pouco imprecisa perto das bordas, e a tela tem uma forte tonalidade azul, que você pode reduzir com ferramentas internas. Enquanto um cartão microSD adicional pode ajudar a expandir o armazenamento interno que é dimensionado um pouco pequeno, você dificilmente pode fazer algo com relação ao alto consumo de energia. Felizmente, ainda tem uma duração de bateria razoável, de modo que o alto consumo não importa muito. O pior é provavelmente o afogamento significativo sob usos intensos mais longos.
A boa relação preço-desempenho e muitas vantagens, como imagens de câmera ricas em detalhes e uma ótima carcaça, merecem uma recomendação de compra para o MediaPad M5 8.4.
No geral, o MediaPad M5 8.4 recebe nossa recomendação de compra, já que é um dispositivo com uma boa relação preço-desempenho que parece de alta qualidade e não tem fraquezas muito graves.
Huawei MediaPad M5 8.4
- 09/17/2019 v7 (old)
Florian Wimmer