Dell Latitude 3510 Revisão: Boa vida útil da bateria apesar da bateria pequena

Das Dell Latitude 3510 zählt zu den 15,6-Zoll-Business-Notebooks aus dem Einstiegssegment. Das uns vorliegende Testgerät ist mit einem-Prozessor bestückt. Zu den Konkurrenten zählen Geräte wie dasDell's Latitude 3510 é um caderno comercial de 15,6 polegadas de nível básico. Nossa unidade de revisão foi equipada com um Núcleo i3-10110U. Seus concorrentes são dispositivos como o HPProbook 455 G7, Acer Extensa 15 EX215-51, ou o Lenovo ThinkpadE15
Avaliação | Data | Modelo | Peso | Altura | Size | Resolução | Preço |
|---|---|---|---|---|---|---|---|
| 81 % v7 (old) | 12/2020 | Dell Latitude 15 3510 NK2MC i3-10110U, UHD Graphics 620 | 1.9 kg | 18 mm | 15.60" | 1920x1080 | |
| 83.9 % v7 (old) | 11/2020 | Lenovo ThinkPad E15 Gen2-20T9S00K00 R7 4700U, Vega 7 | 1.8 kg | 18.9 mm | 15.60" | 1920x1080 | |
| 82.6 % v7 (old) | 07/2020 | HP ProBook 455 G7-175W8EA R7 4700U, Vega 7 | 1.8 kg | 19 mm | 15.60" | 1920x1080 | |
| 76.6 % v7 (old) | 02/2020 | Acer Extensa 15 EX215-51-56UX i5-10210U, UHD Graphics 620 | 1.9 kg | 19.9 mm | 15.60" | 1920x1080 |
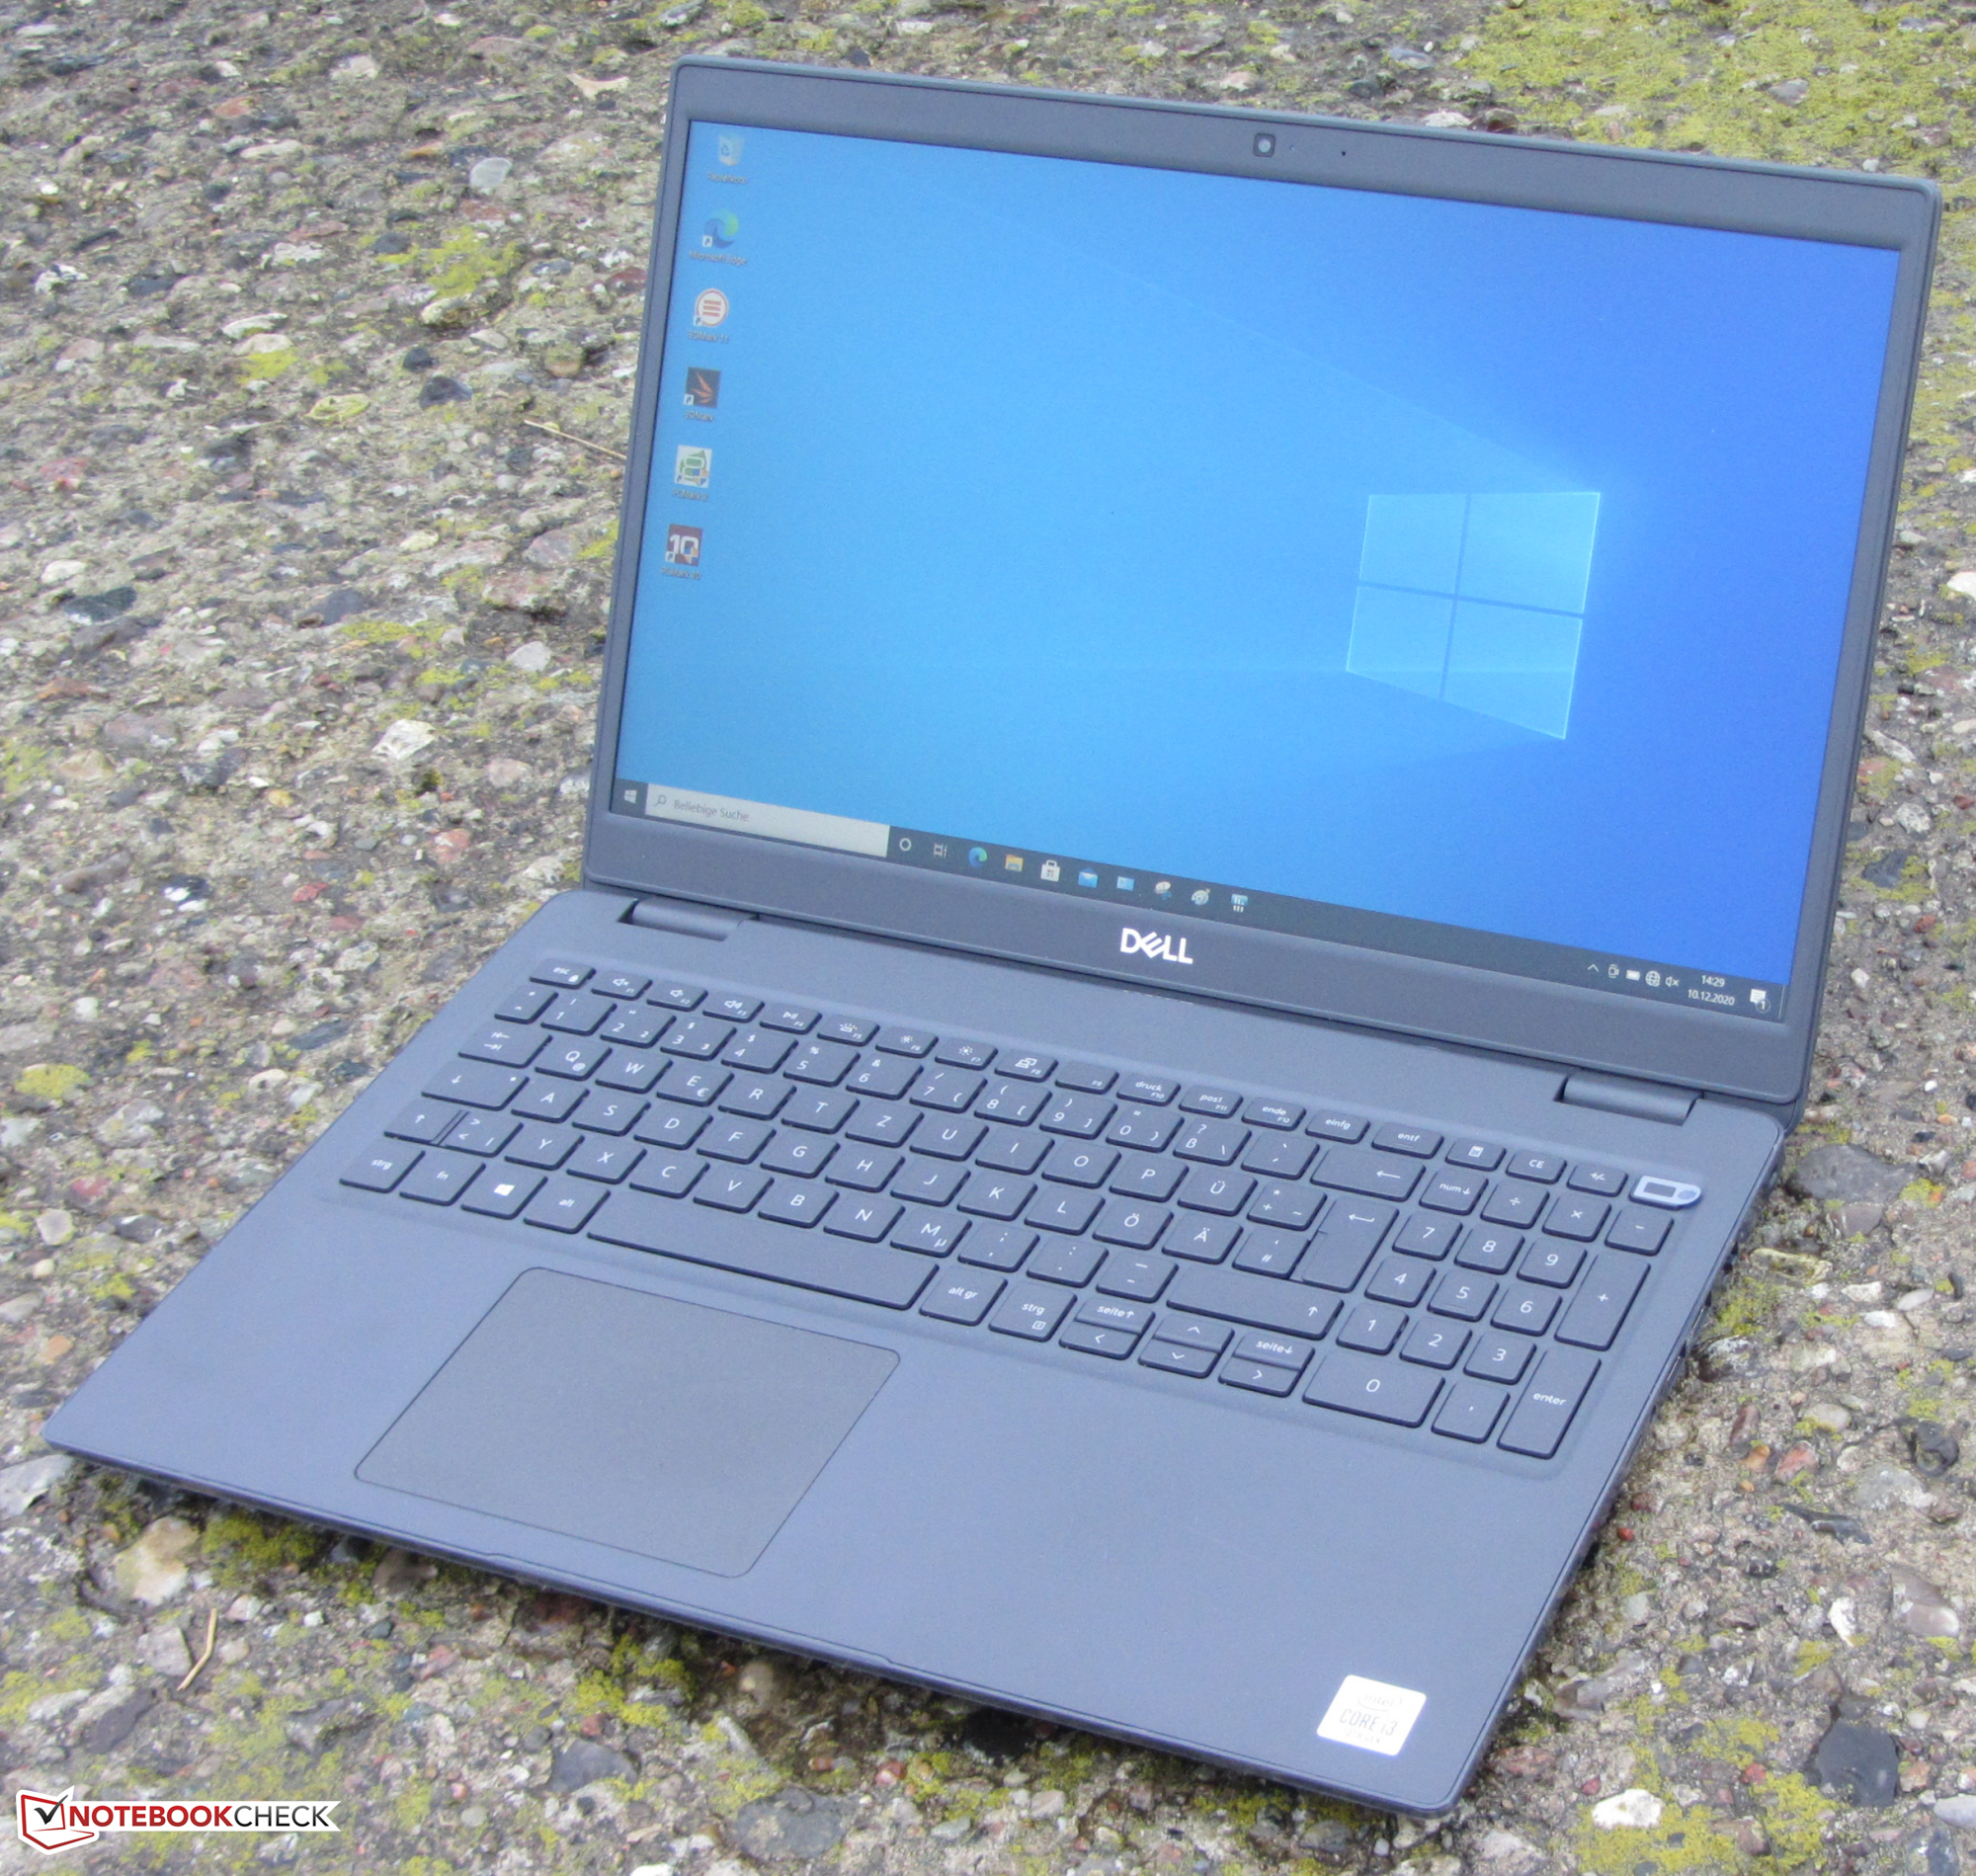
Estojo & Conectividade - Latitude em Plástico
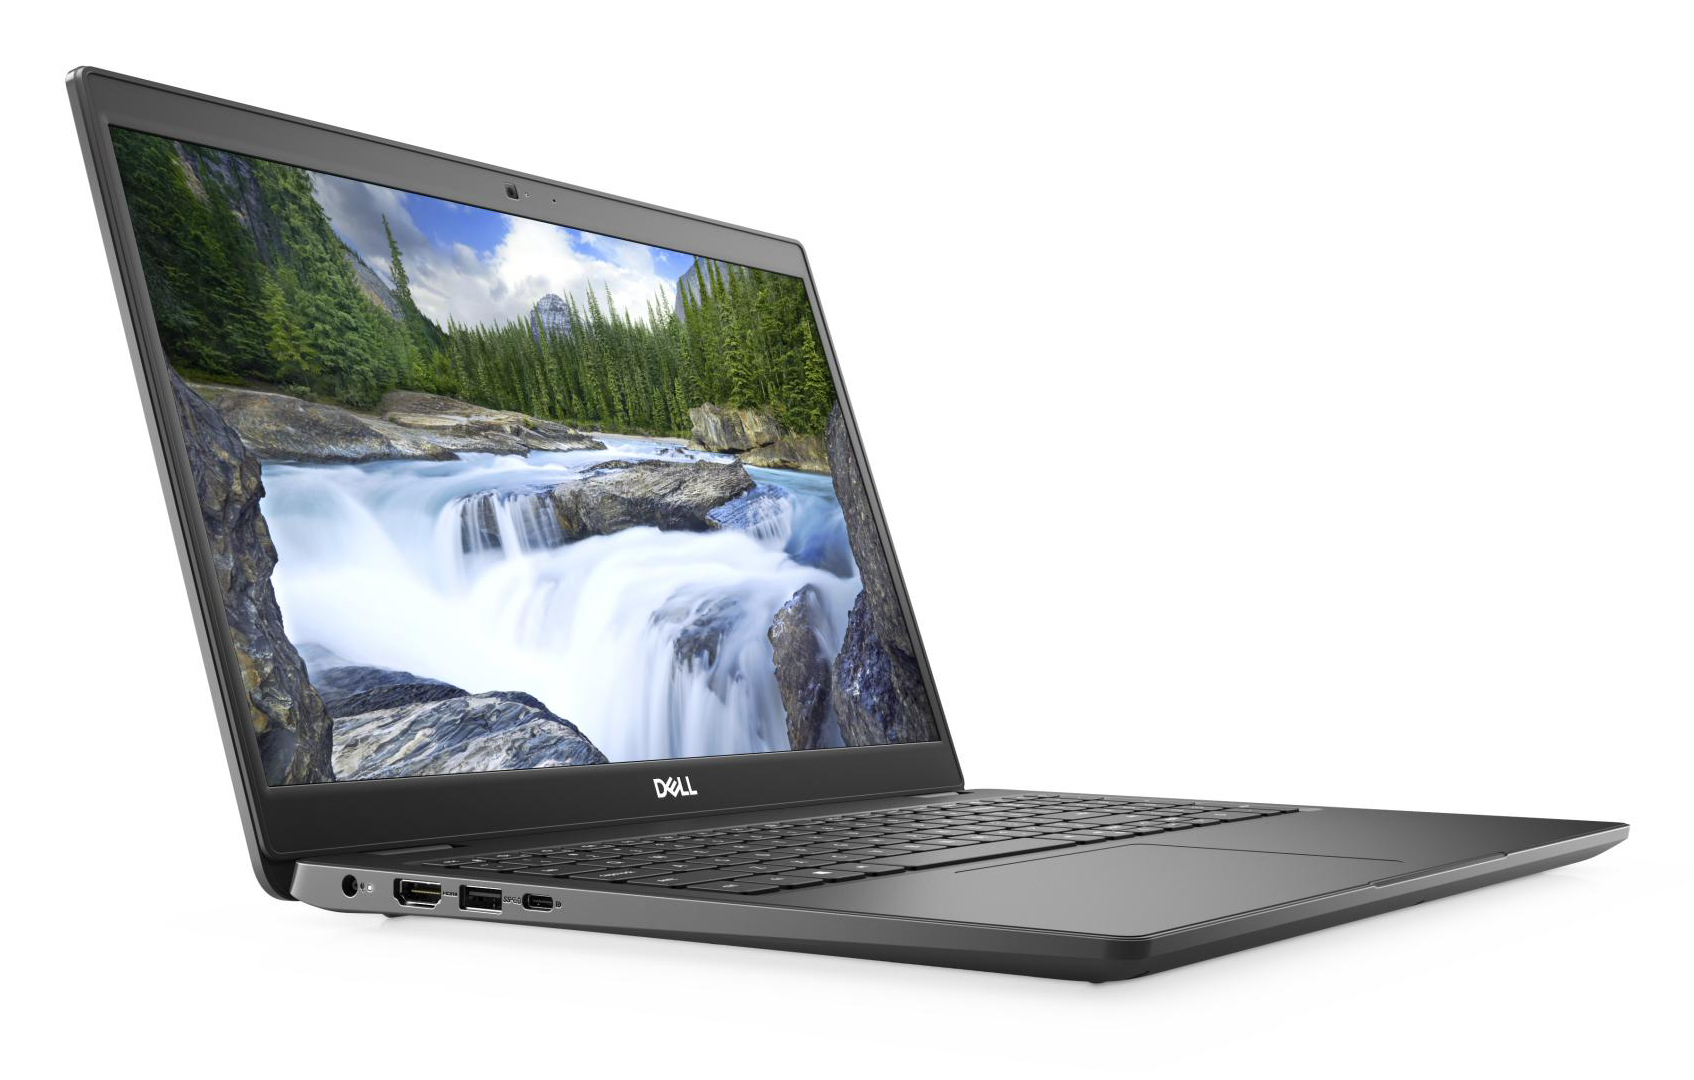
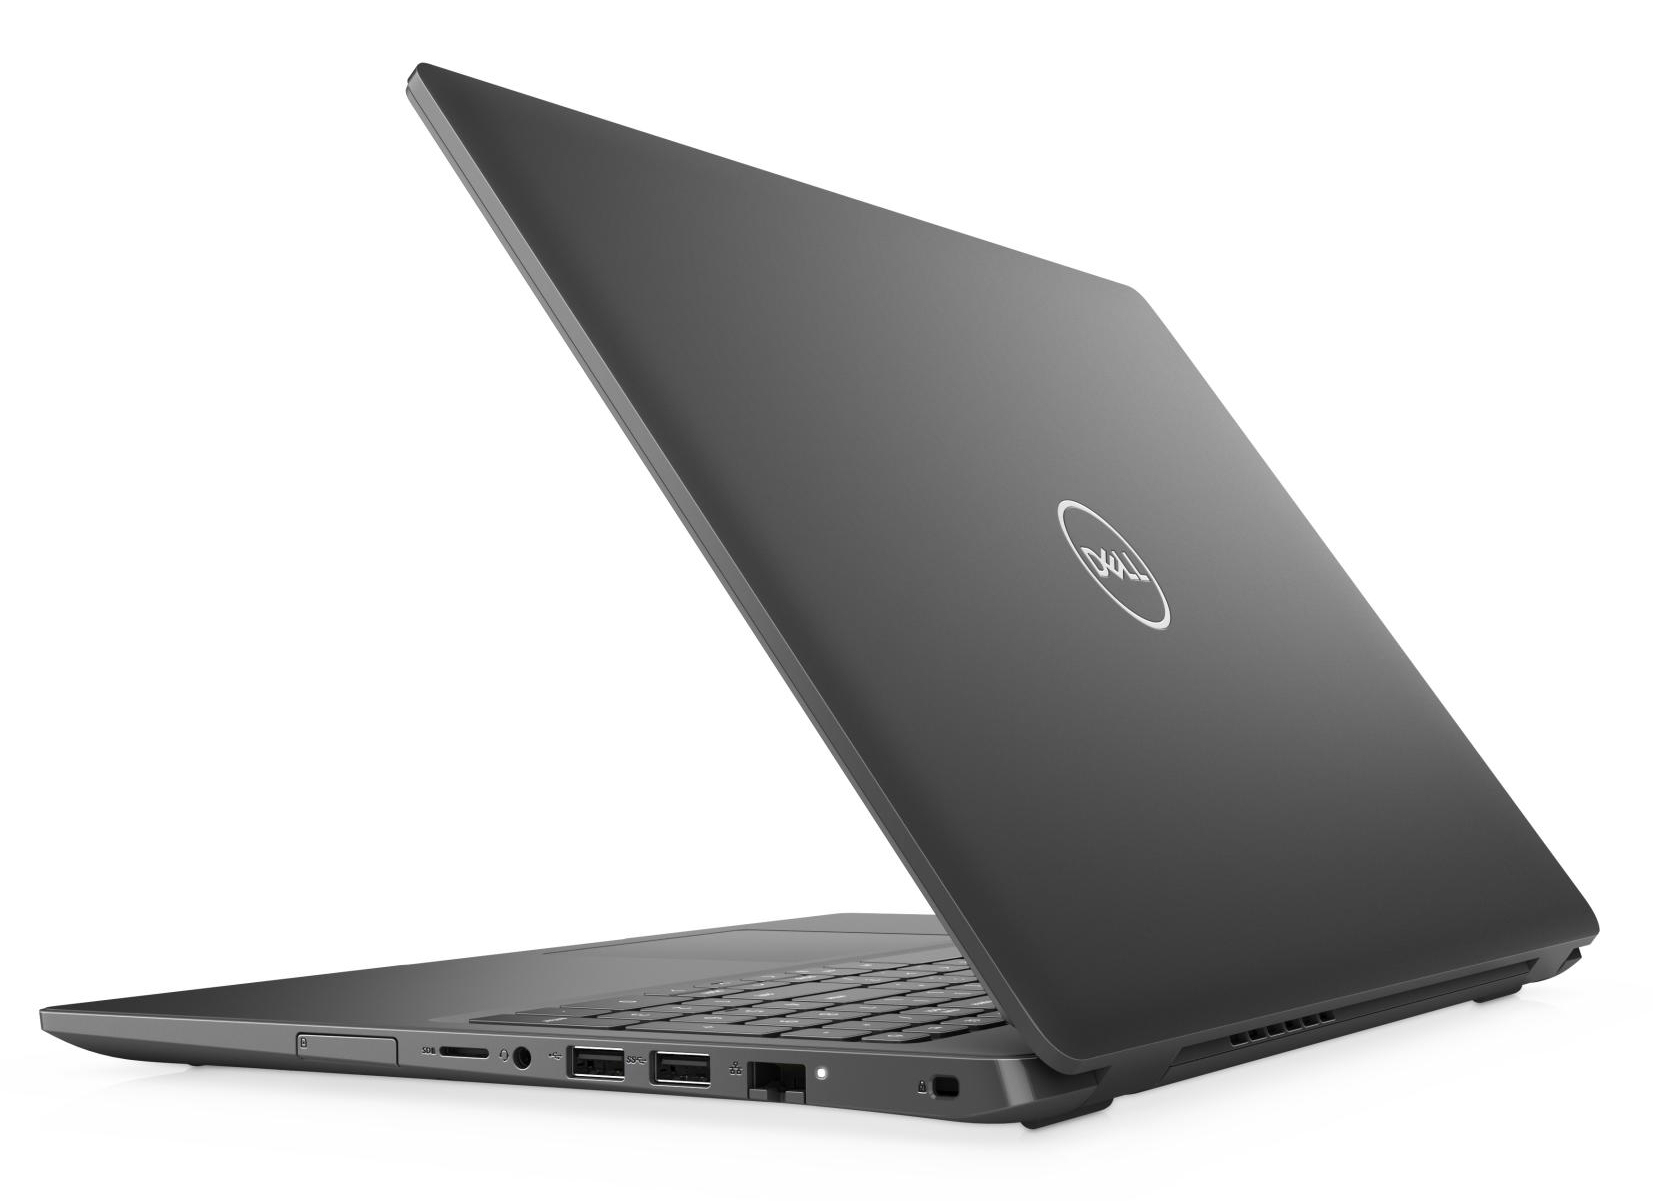
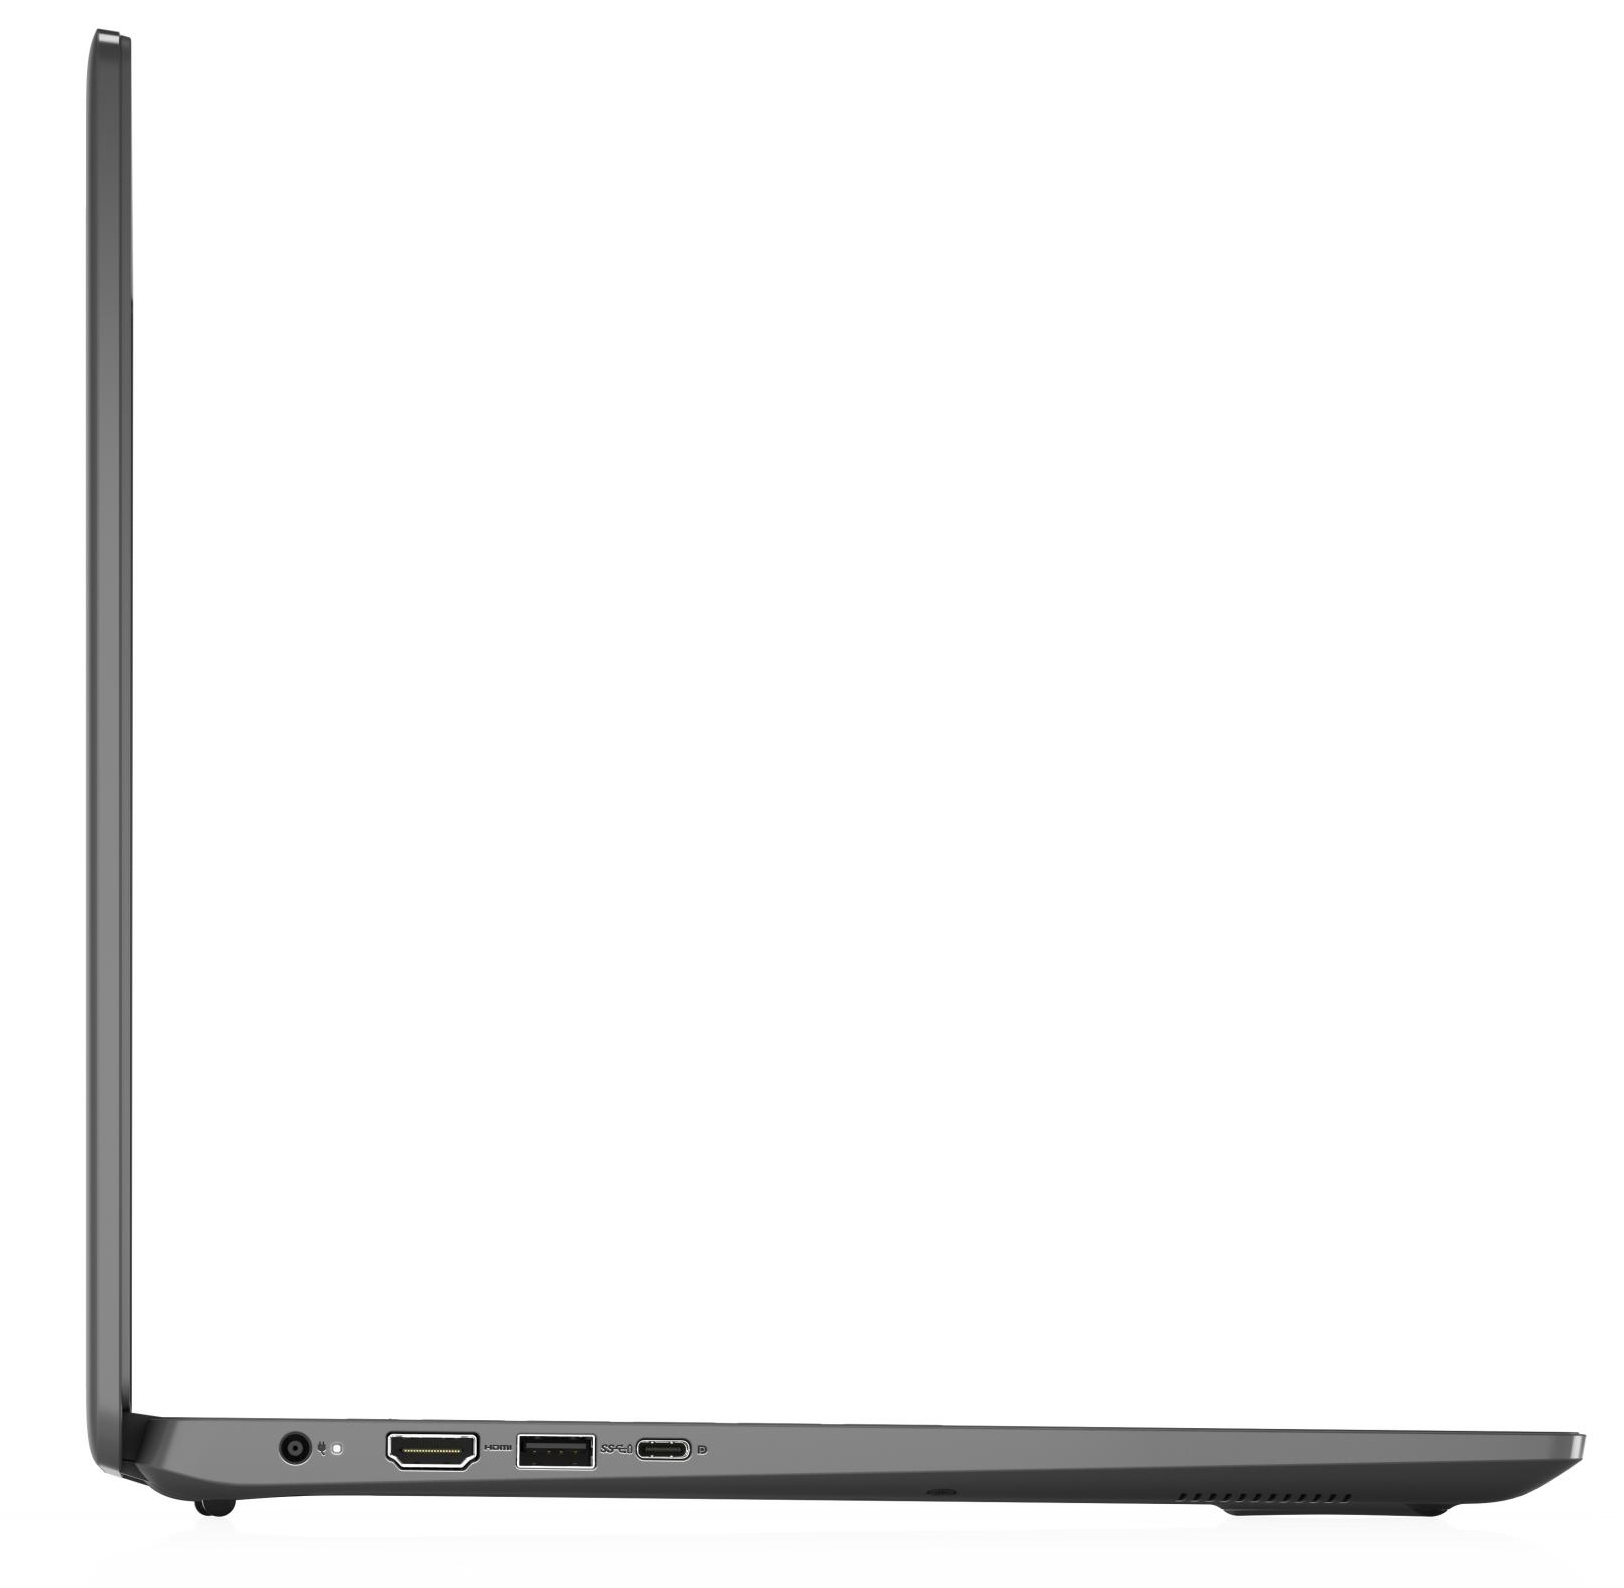
O estojo Latitudecarece de materiais premium de alta qualidade. Em vez disso, a Dell reveste seu notebook comercial de nível básico em plástico cinza com uma superfície rugosa fosca. Os lados são uma exceção, pois são feitos de plástico liso e brilhante. A qualidade geral do chassi foi boa. A robustez não foi. A bateria não pode ser substituída pelo usuário. O hardware interno pode ser acessado pela remoção da tampa inferior.
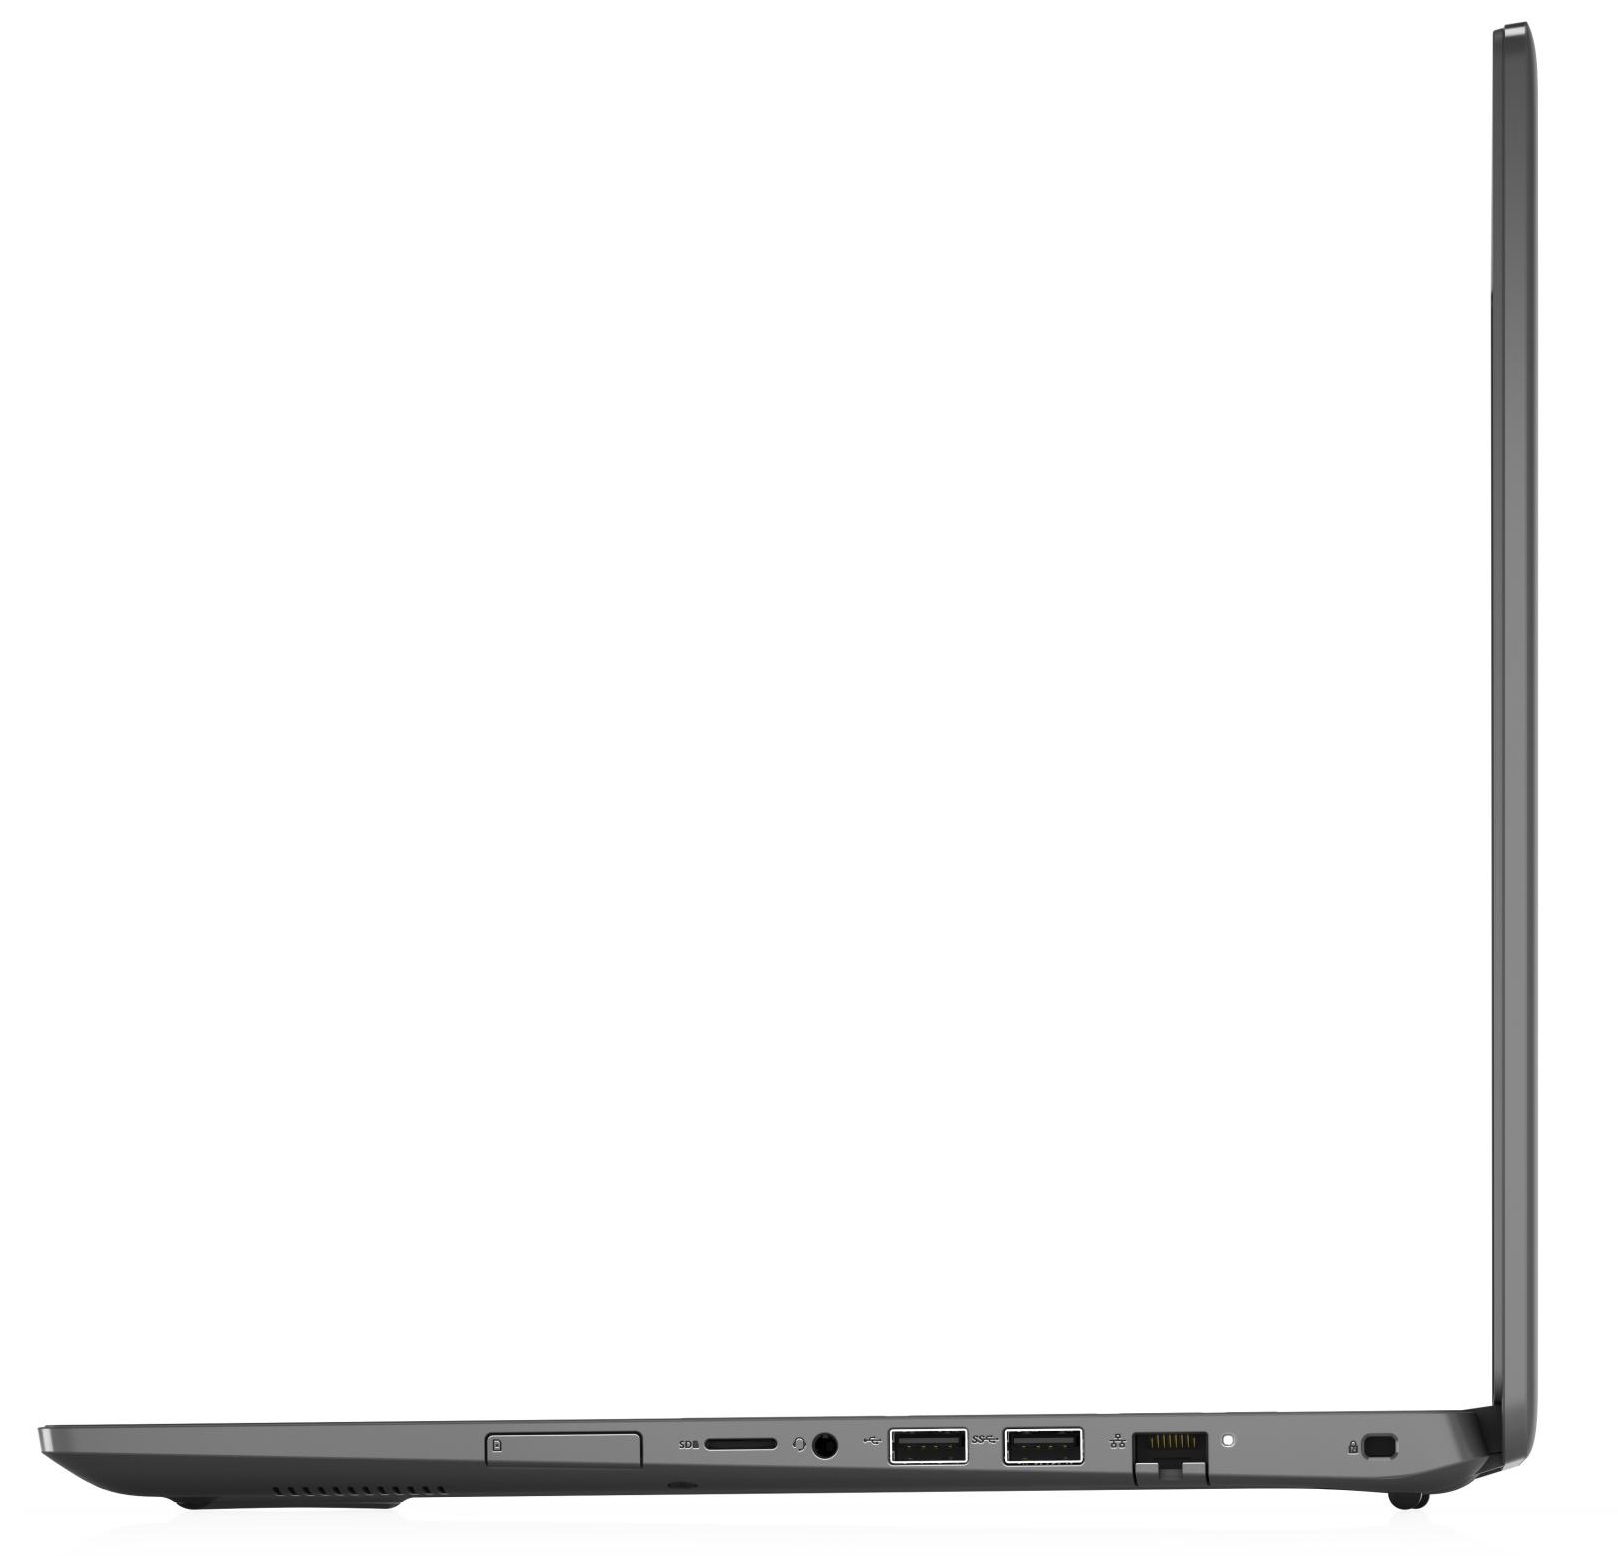
Um total de três portas USB-A (1x USB 2.0, 2x USB 3.2 Gen 1) assim como uma única porta USB-C (USB 3.2 Gen 1) estão disponíveis. Esta última suporta Power Delivery e DisplayPort via USB-C. Combinado com a porta HDMI, o Latitude 3510 apresenta um total de duas saídas de display.
Quando comparado com nossa placa de referência Toshiba Exceria Pro M501 microSDXC de 64 GB, o leitor de cartões atingiu o pico de apenas 27,5 MB/s (copiando grandes blocos de dados) e 20,5 MB/s (copiando 250 arquivos JPEG com 5 MB cada). Portanto, é da variedade mais lenta.
O chip Wi-Fi AX201 da Intel suporta 802.11 a/b/g/n/ac/ax, bem como Bluetooth 5. Ele funcionou bem em condições ideais (nenhum outro dispositivo Wi-Fi nas proximidades, baixa distância entre o notebook e o servidor, conectado ao nosso roteador de referência Netgear Nighthawk AX12).
A Dell também oferece Latitude SKUs com modems LTE integrados. Nossa unidade de revisão não possuía um. Ela também não pode ser adicionada retroativamente uma vez que o laptop não possui o slot SIM, as antenas e a porta necessária.

Conectividade


| SD Card Reader | |
| average JPG Copy Test (av. of 3 runs) | |
| HP ProBook 455 G7-175W8EA (Toshiba Exceria Pro SDXC 64 GB UHS-II) | |
| HP ProBook 450 G7 8WC04UT (Toshiba Exceria Pro SDXC 64 GB UHS-II) | |
| Média da turma Office (19.8 - 198.5, n=22, últimos 2 anos) | |
| Dell Latitude 15 3510 NK2MC (Toshiba Exceria Pro M501 microSDXC 64GB) | |
| maximum AS SSD Seq Read Test (1GB) | |
| HP ProBook 455 G7-175W8EA (Toshiba Exceria Pro SDXC 64 GB UHS-II) | |
| HP ProBook 450 G7 8WC04UT (Toshiba Exceria Pro SDXC 64 GB UHS-II) | |
| Média da turma Office (27.4 - 249, n=21, últimos 2 anos) | |
| Dell Latitude 15 3510 NK2MC (Toshiba Exceria Pro M501 microSDXC 64GB) | |


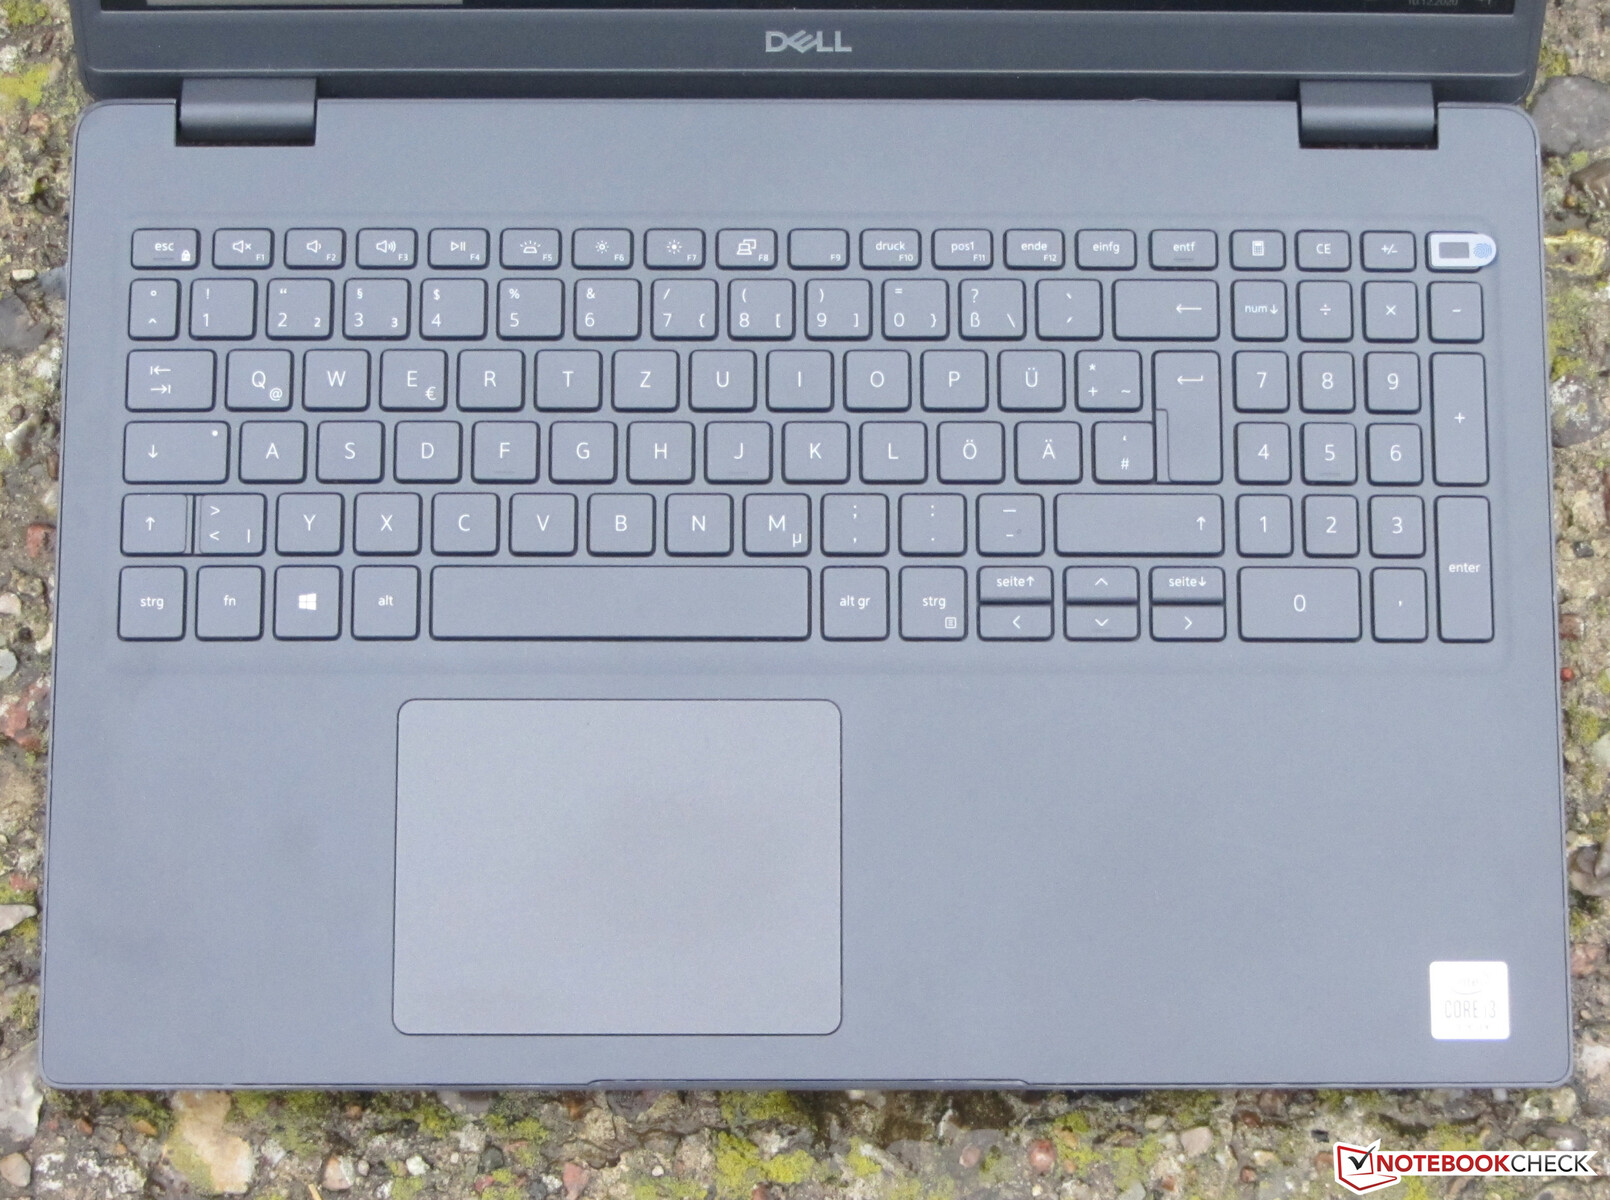
Dispositivos de entrada - 3510 Possui um teclado retroiluminado
As teclas até mesmo lisas do teclado chiclet oferecem um curso curto das teclas e um ponto de acentuação claro. A resistência geral das teclas foi boa. O teclado flexionou levemente enquanto digitava. Isto não foi um problema. A retroiluminação de dois estágios pode ser ligada ou desligada através de uma tecla de função. No geral, o teclado se mostrou adequado para uso diário.
O clickpad com capacidade multitoque (ca. 10,5 x 8 cm / 4,1 x 3,2 polegadas) registrou entradas até suas próprias bordas. A superfície lisa renderizada com ele é muito fácil e confortável. O tapete oferece um curso curto e um claro ponto de acentuação.
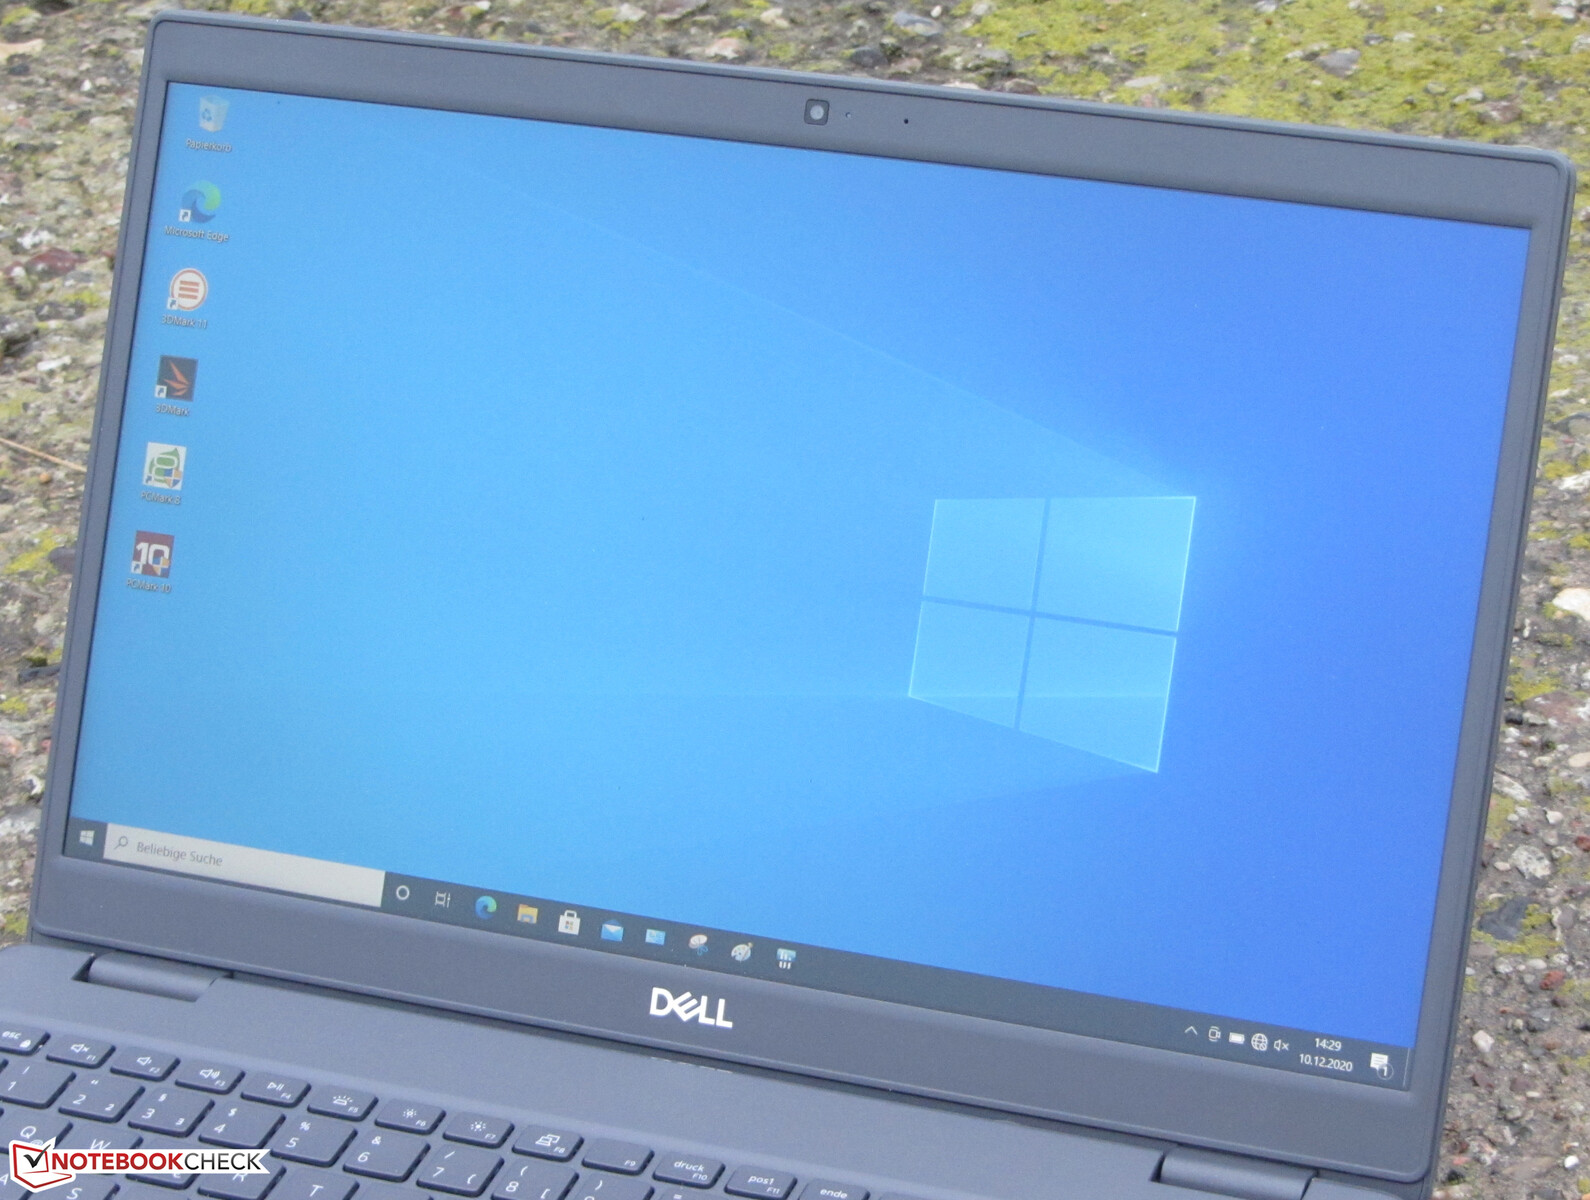
Display - Dell Laptop com visor Dim
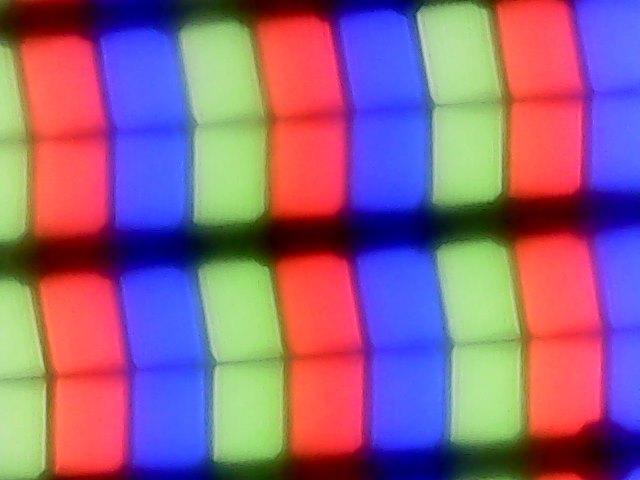
O display Latitude's mate de 15,6 polegadas funciona com uma resolução nativa de 1920 x 1080. Tanto o brilho (235,9 lêndeas) quanto a relação de contraste (845:1) são muito baixos. Para sermos considerados aceitáveis por nós, o brilho tem que estar ao norte de 300 lêndeas e a razão de contraste acima de 1.000:1.
A tela tremulava a uma freqüência de 250 Hz, o que poderia usar tensão ocular e/ou dores de cabeça em usuários sensíveis.
| |||||||||||||||||||||||||
iluminação: 86 %
iluminação com acumulador: 230 cd/m²
Contraste: 845:1 (Preto: 0.31 cd/m²)
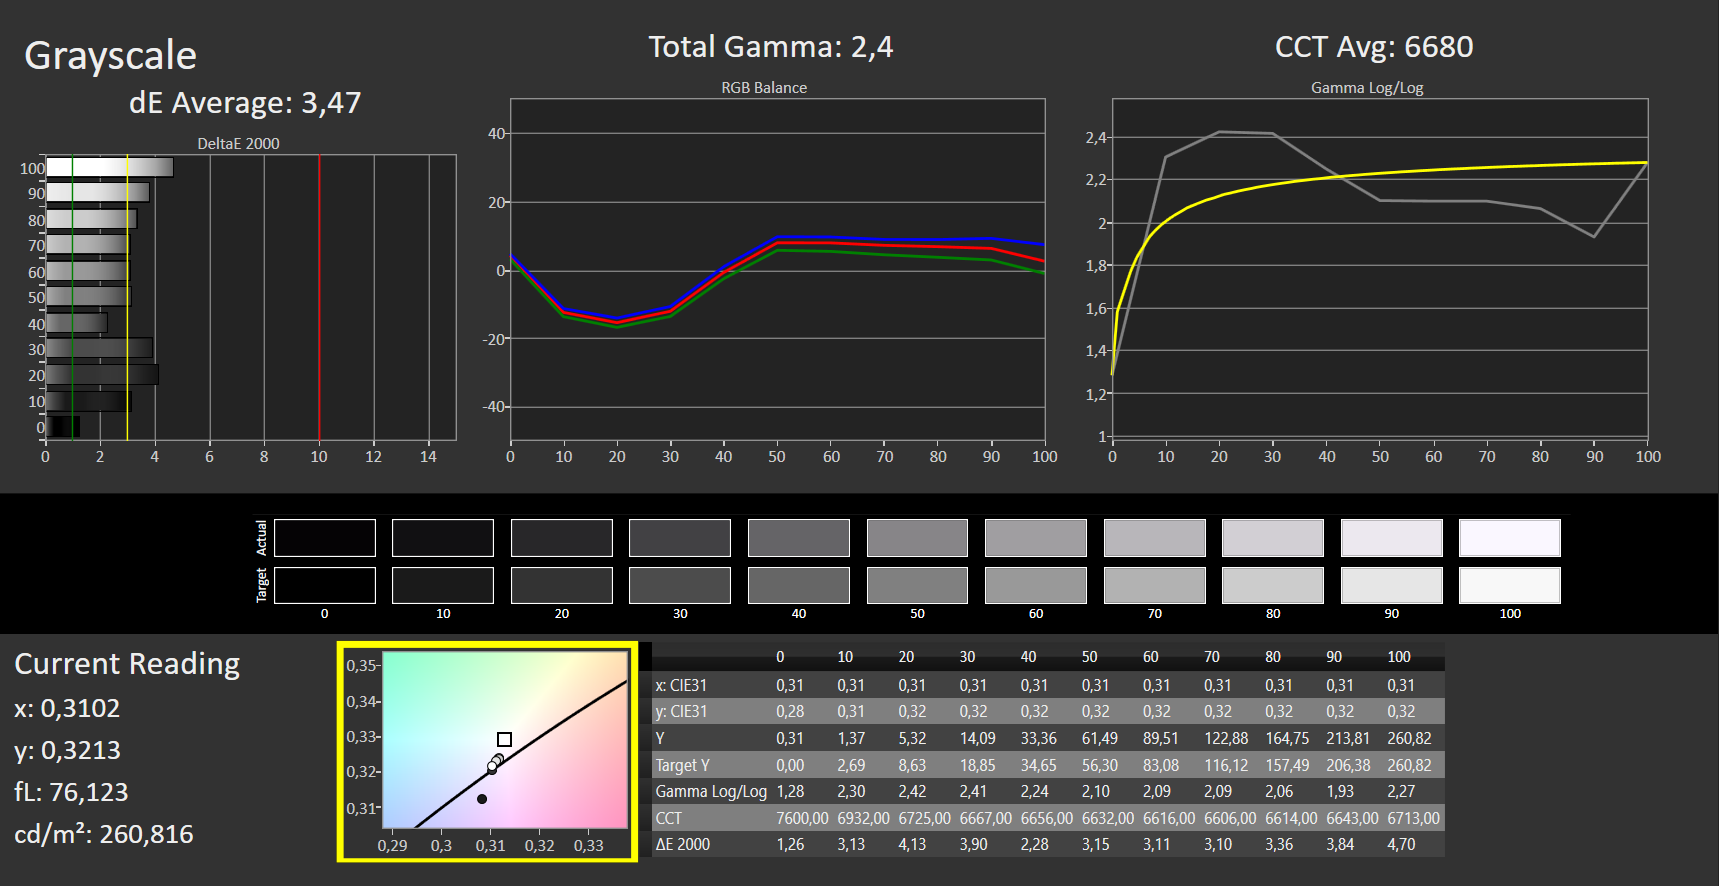
ΔE ColorChecker Calman: 4.92 | ∀{0.5-29.43 Ø4.71}
calibrated: 4.34
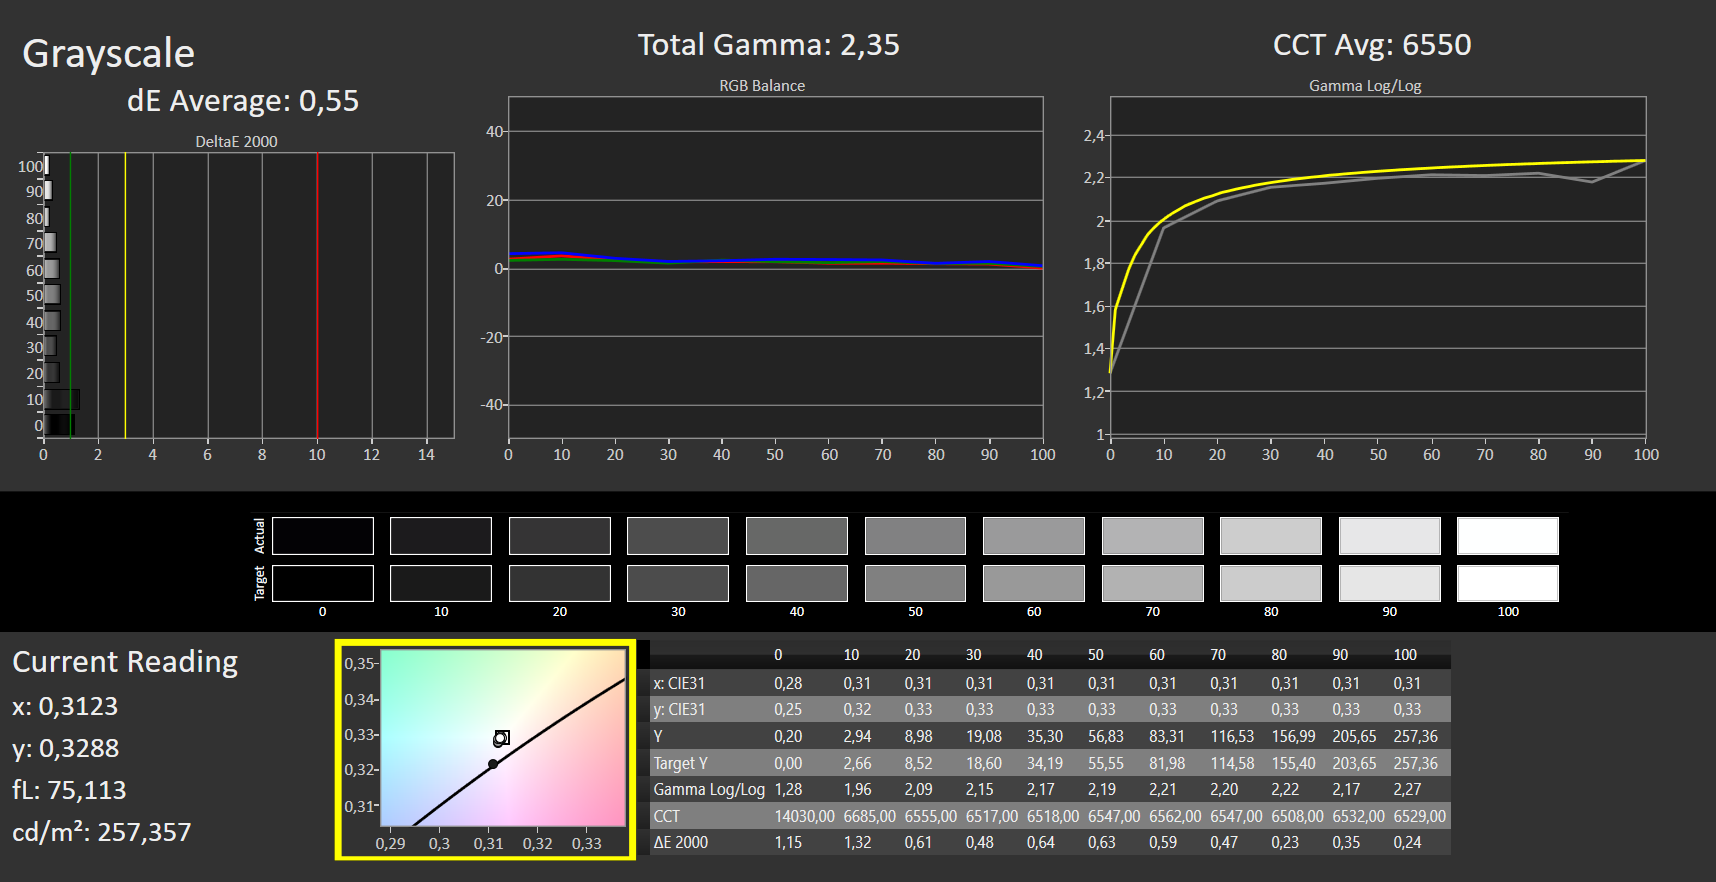
ΔE Greyscale Calman: 3.47 | ∀{0.09-98 Ø4.96}
61% sRGB (Argyll 1.6.3 3D)
39% AdobeRGB 1998 (Argyll 1.6.3 3D)
42.15% AdobeRGB 1998 (Argyll 3D)
61.3% sRGB (Argyll 3D)
40.78% Display P3 (Argyll 3D)
Gamma: 2.4
CCT: 6680 K
| Dell Latitude 15 3510 NK2MC Dell 156CL05, IPS, 1920x1080, 15.6" | Lenovo ThinkPad E15 Gen2-20T9S00K00 B156HAN02.1, IPS, 1920x1080, 15.6" | HP ProBook 450 G7 8WC04UT LG Philips LGD062E, IPS, 1920x1080, 15.6" | HP ProBook 455 G7-175W8EA AUO, B156HW02, IPS, 1920x1080, 15.6" | Acer Extensa 15 EX215-51-56UX BOE CQ NT156FHM-N61, TN LED, 1920x1080, 15.6" | |
|---|---|---|---|---|---|
| Display | -6% | -7% | -7% | -6% | |
| Display P3 Coverage (%) | 40.78 | 38.42 -6% | 37.9 -7% | 37.92 -7% | 38.17 -6% |
| sRGB Coverage (%) | 61.3 | 57.8 -6% | 56.5 -8% | 57.1 -7% | 57.5 -6% |
| AdobeRGB 1998 Coverage (%) | 42.15 | 39.69 -6% | 39.08 -7% | 39.18 -7% | 39.44 -6% |
| Response Times | -17% | -1% | -1% | 19% | |
| Response Time Grey 50% / Grey 80% * (ms) | 38 ? | 46.8 ? -23% | 35.2 ? 7% | 41 ? -8% | 41 ? -8% |
| Response Time Black / White * (ms) | 28 ? | 31.2 ? -11% | 30.4 ? -9% | 26 ? 7% | 15 ? 46% |
| PWM Frequency (Hz) | 250 | ||||
| Screen | -5% | -11% | 7% | -61% | |
| Brightness middle (cd/m²) | 262 | 249 -5% | 259.8 -1% | 282 8% | 203 -23% |
| Brightness (cd/m²) | 236 | 239 1% | 251 6% | 264 12% | 188 -20% |
| Brightness Distribution (%) | 86 | 87 1% | 91 6% | 88 2% | 87 1% |
| Black Level * (cd/m²) | 0.31 | 0.22 29% | 0.42 -35% | 0.19 39% | 0.635 -105% |
| Contrast (:1) | 845 | 1132 34% | 619 -27% | 1484 76% | 320 -62% |
| Colorchecker dE 2000 * | 4.92 | 6.7 -36% | 6.09 -24% | 5.56 -13% | 10.84 -120% |
| Colorchecker dE 2000 max. * | 15.83 | 19.7 -24% | 16.33 -3% | 19.07 -20% | 22.18 -40% |
| Colorchecker dE 2000 calibrated * | 4.34 | 4.4 -1% | 5.2 -20% | 4.5 -4% | 5.09 -17% |
| Greyscale dE 2000 * | 3.47 | 5.1 -47% | 3.7 -7% | 3.57 -3% | 12.87 -271% |
| Gamma | 2.4 92% | 2.48 89% | 2.56 86% | 2.61 84% | 2.58 85% |
| CCT | 6680 97% | 7277 89% | 6759 96% | 6895 94% | 15854 41% |
| Color Space (Percent of AdobeRGB 1998) (%) | 39 | 36.6 -6% | 35.7 -8% | 36 -8% | 36.4 -7% |
| Color Space (Percent of sRGB) (%) | 61 | 57.7 -5% | 56.2 -8% | 57 -7% | 57.4 -6% |
| Média Total (Programa/Configurações) | -9% /
-7% | -6% /
-9% | -0% /
4% | -16% /
-41% |
* ... menor é melhor
Exibir tempos de resposta
| ↔ Tempo de resposta preto para branco | ||
|---|---|---|
| 28 ms ... ascensão ↗ e queda ↘ combinadas | ↗ 17 ms ascensão | 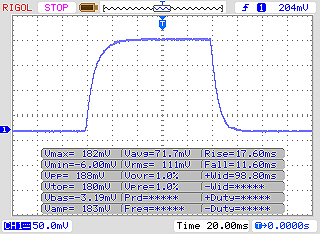 |
| ↘ 11 ms queda | ||
| A tela mostra taxas de resposta relativamente lentas em nossos testes e pode ser muito lenta para os jogadores. Em comparação, todos os dispositivos testados variam de 0.1 (mínimo) a 240 (máximo) ms. » 71 % de todos os dispositivos são melhores. Isso significa que o tempo de resposta medido é pior que a média de todos os dispositivos testados (19.8 ms). | ||
| ↔ Tempo de resposta 50% cinza a 80% cinza | ||
| 38 ms ... ascensão ↗ e queda ↘ combinadas | ↗ 19 ms ascensão | 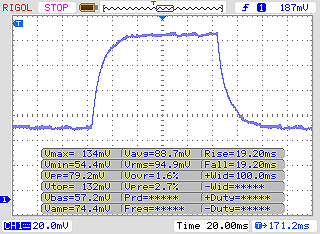 |
| ↘ 19 ms queda | ||
| A tela mostra taxas de resposta lentas em nossos testes e será insatisfatória para os jogadores. Em comparação, todos os dispositivos testados variam de 0.165 (mínimo) a 636 (máximo) ms. » 55 % de todos os dispositivos são melhores. Isso significa que o tempo de resposta medido é pior que a média de todos os dispositivos testados (31 ms). | ||
Cintilação da tela / PWM (modulação por largura de pulso)
| Tela tremeluzindo/PWM detectado | 250 Hz | 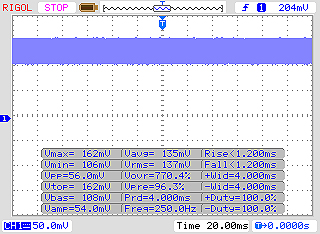 | |
A luz de fundo da tela pisca em 250 Hz (pior caso, por exemplo, utilizando PWM) . A frequência de 250 Hz é relativamente baixa, portanto, usuários sensíveis provavelmente notarão cintilação e sentirão fadiga ocular na configuração de brilho indicada e abaixo. [pwm_comparison] Em comparação: 52 % de todos os dispositivos testados não usam PWM para escurecer a tela. Se PWM foi detectado, uma média de 7754 (mínimo: 5 - máximo: 343500) Hz foi medida. | |||
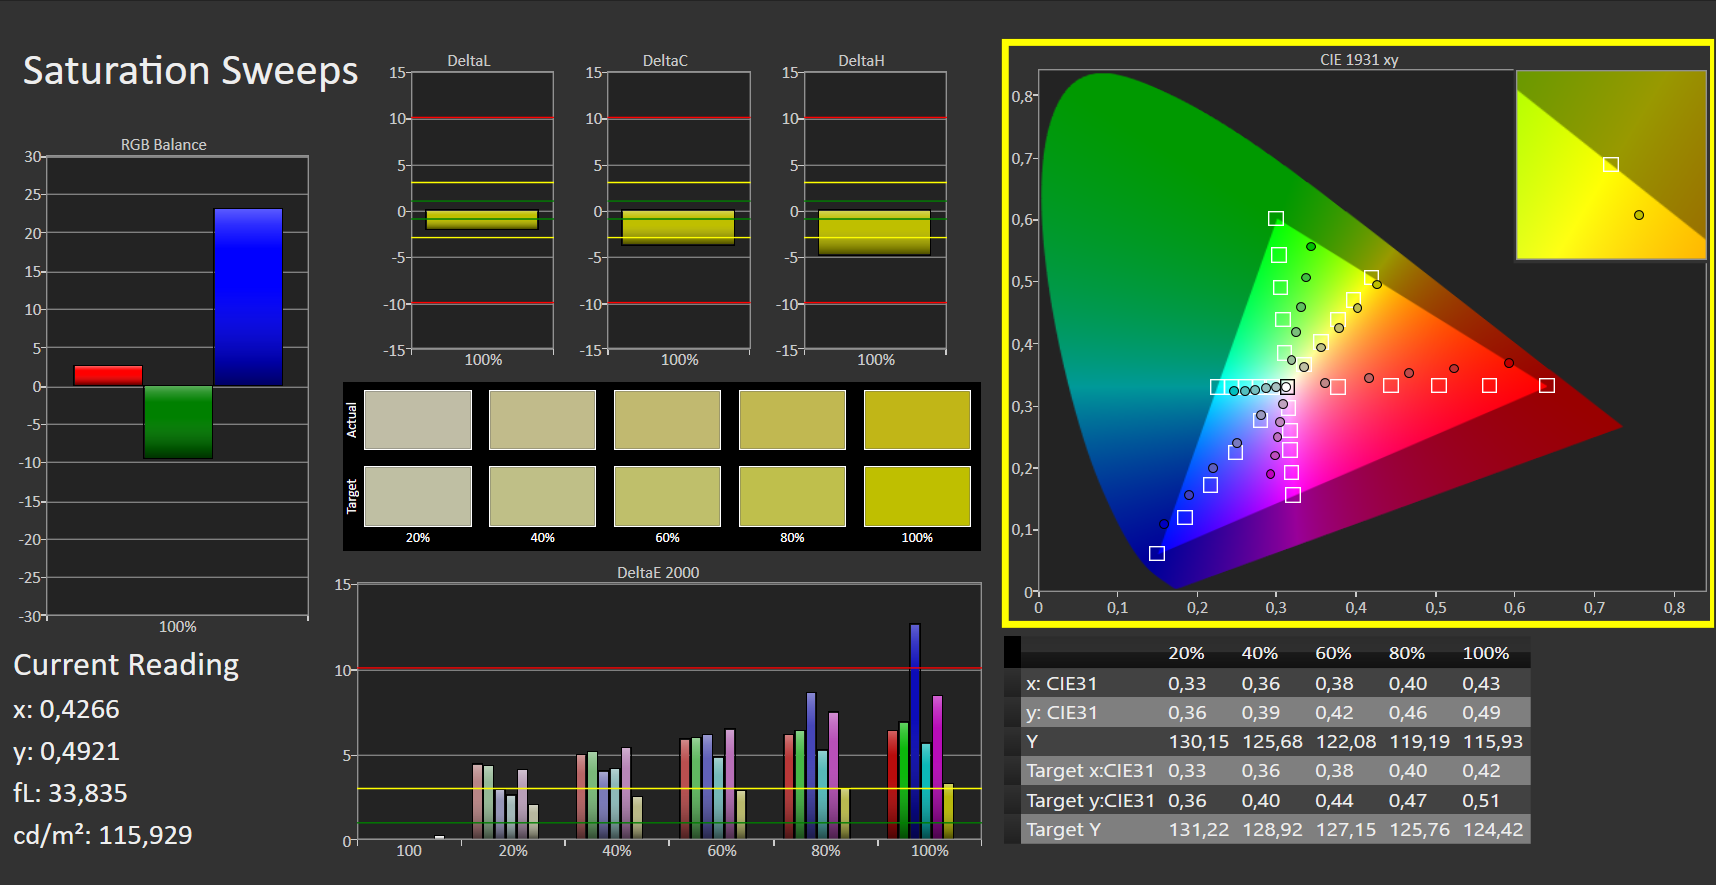
As cores foram bastante exatas fora da caixa, embora o desvio registrado DeltaE 2000 de 5 foi superior ao ideal de 3. Nem o AdobeRGB (39%) nem o sRGB (61%) estão completamente cobertos


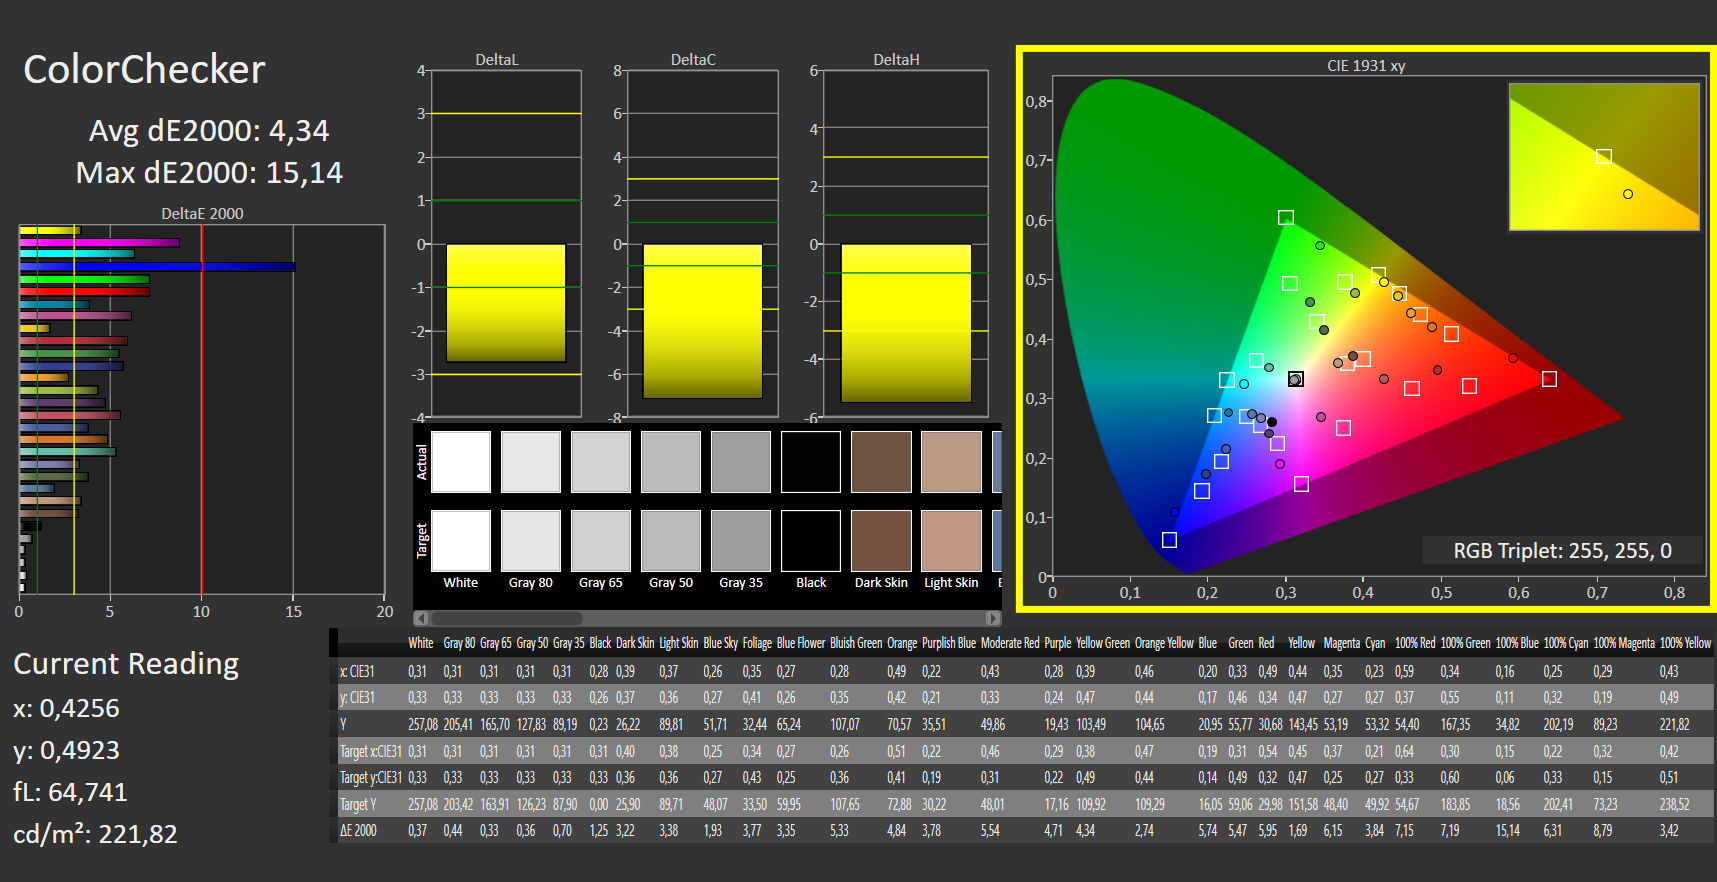
Graças a seus amplos ângulos de visão, o painel IPS permaneceu bem legível de todos os lados. Ao ar livre, ele só era utilizável em dias nublados devido a seu baixo brilho
Desempenho - Suficiente rápido para escritório e Internet
O Dell's Latitude 3510 é um notebook comercial de 15,6 polegadas de nível básico. Ele oferece desempenho suficiente para aplicações de escritório e internet. Nossa unidade de revisão foi vendida por menos de $650 no momento em que foi escrito. Outros SKUs também estão disponíveis
Condições de teste
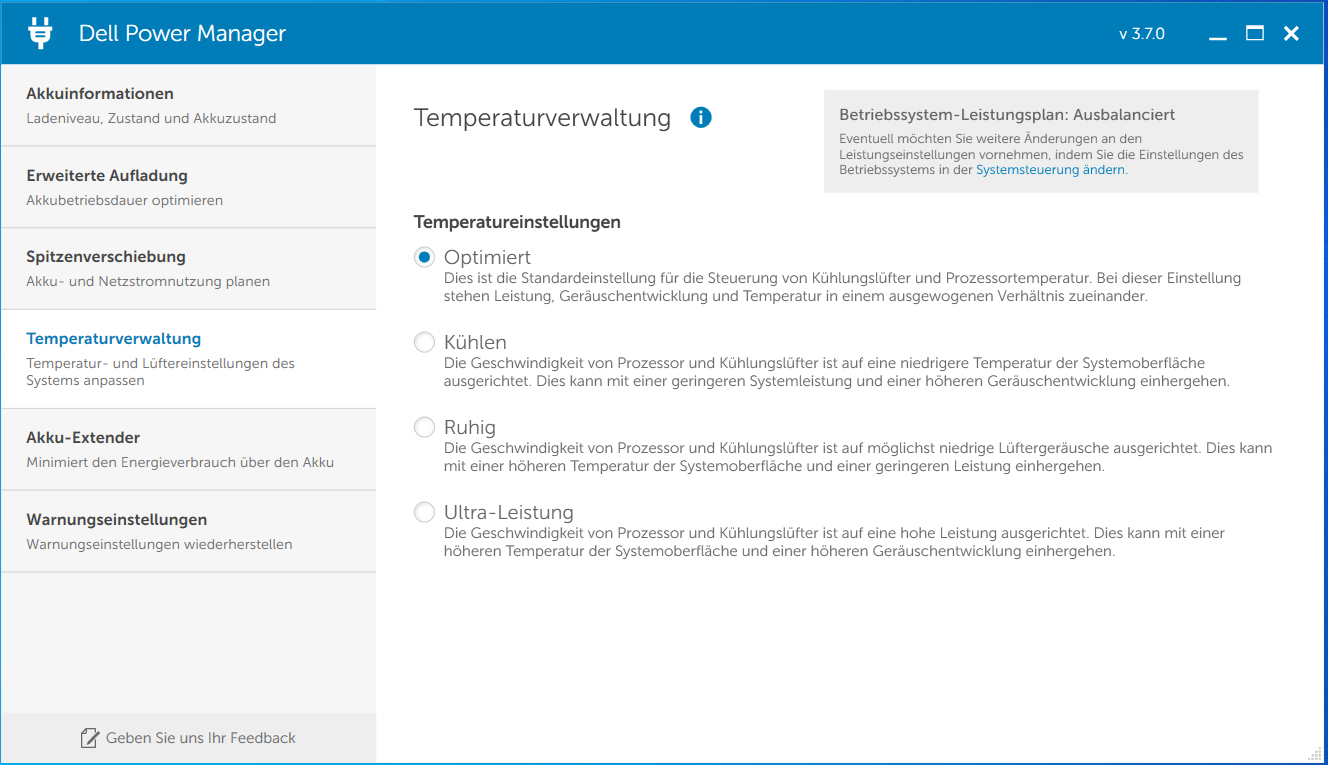
O Power Manager da Dell apresenta vários perfis que afetam a temperatura e o desempenho. Executamos nossos testes no perfil "Otimizado". Não encontramos nenhum ganho de desempenho ao selecionar "Ultra Performance"
Processador
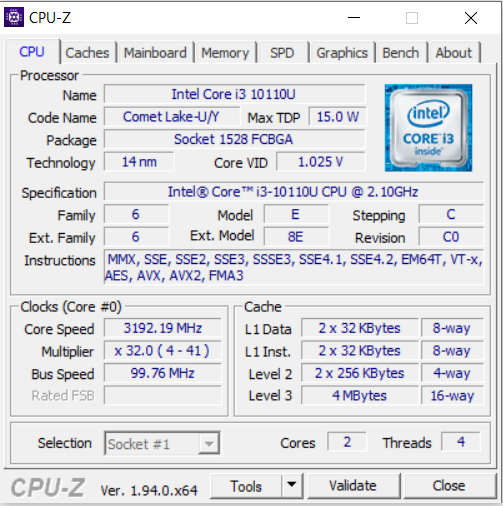
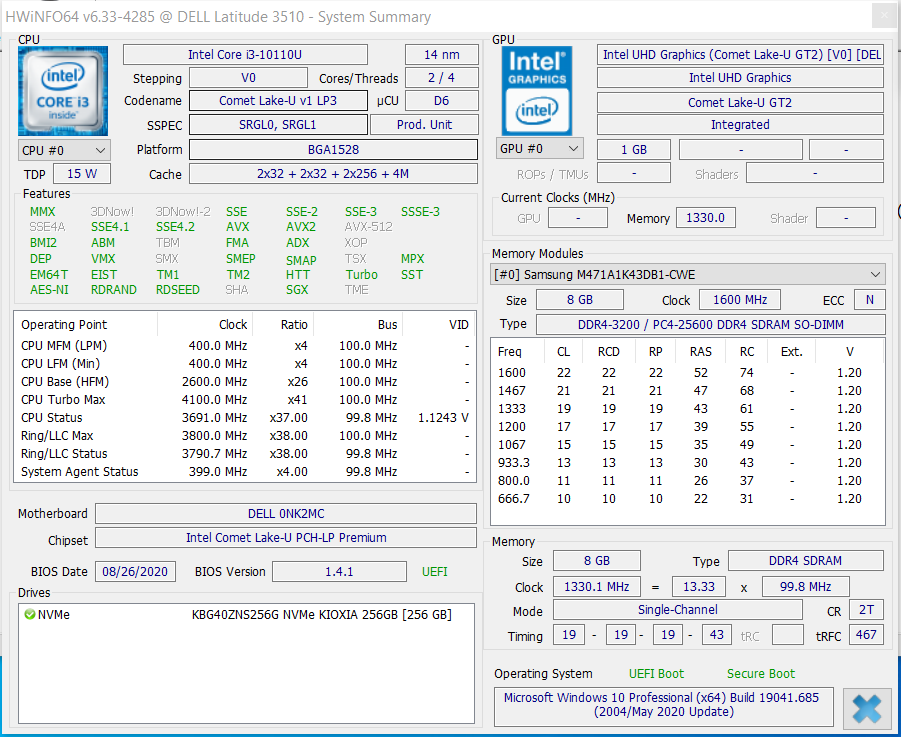
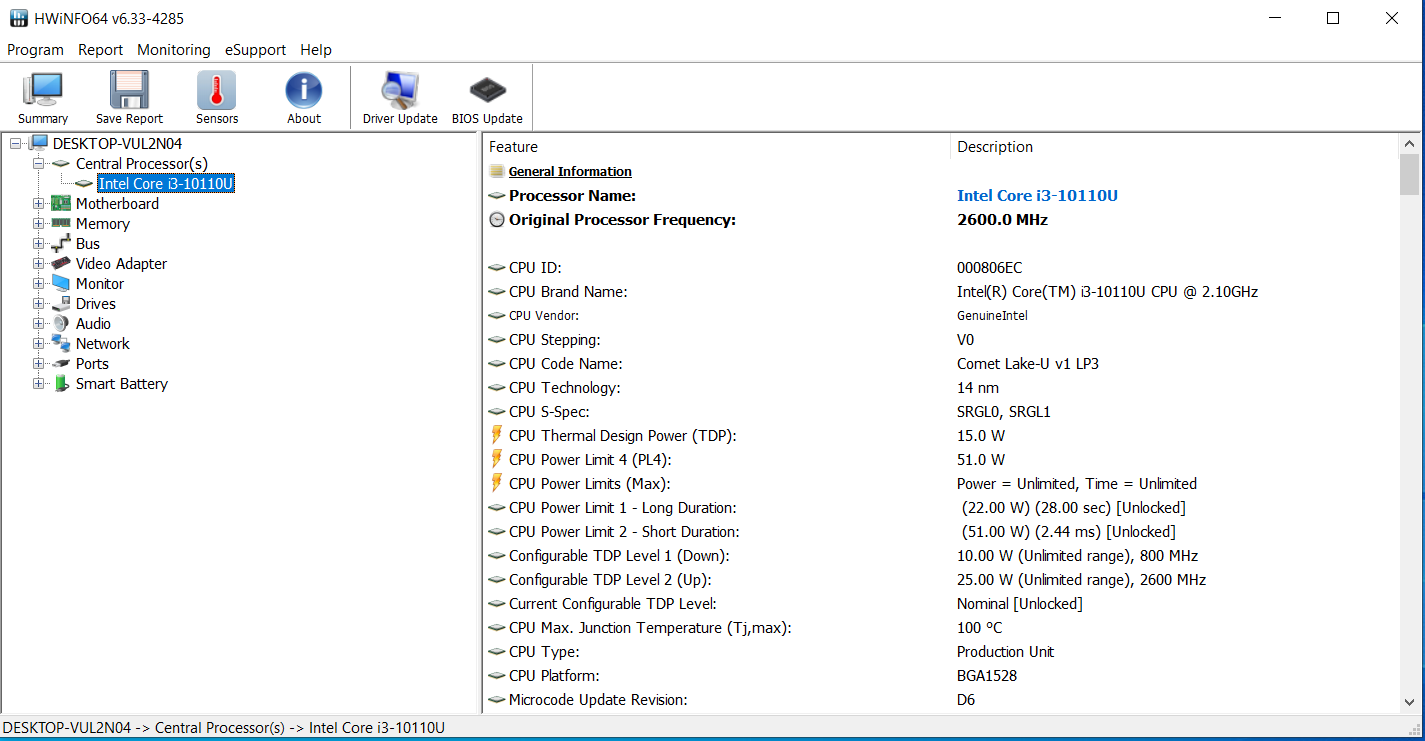
O Latitude apresenta umNúcleo i3-10110U (Comet Lake) processador dual-core rodando a uma velocidade de 2,1 GHz com um turboalimentação de até 4,1 GHz. Suporta hiperthreading (dois núcleos por rosca).
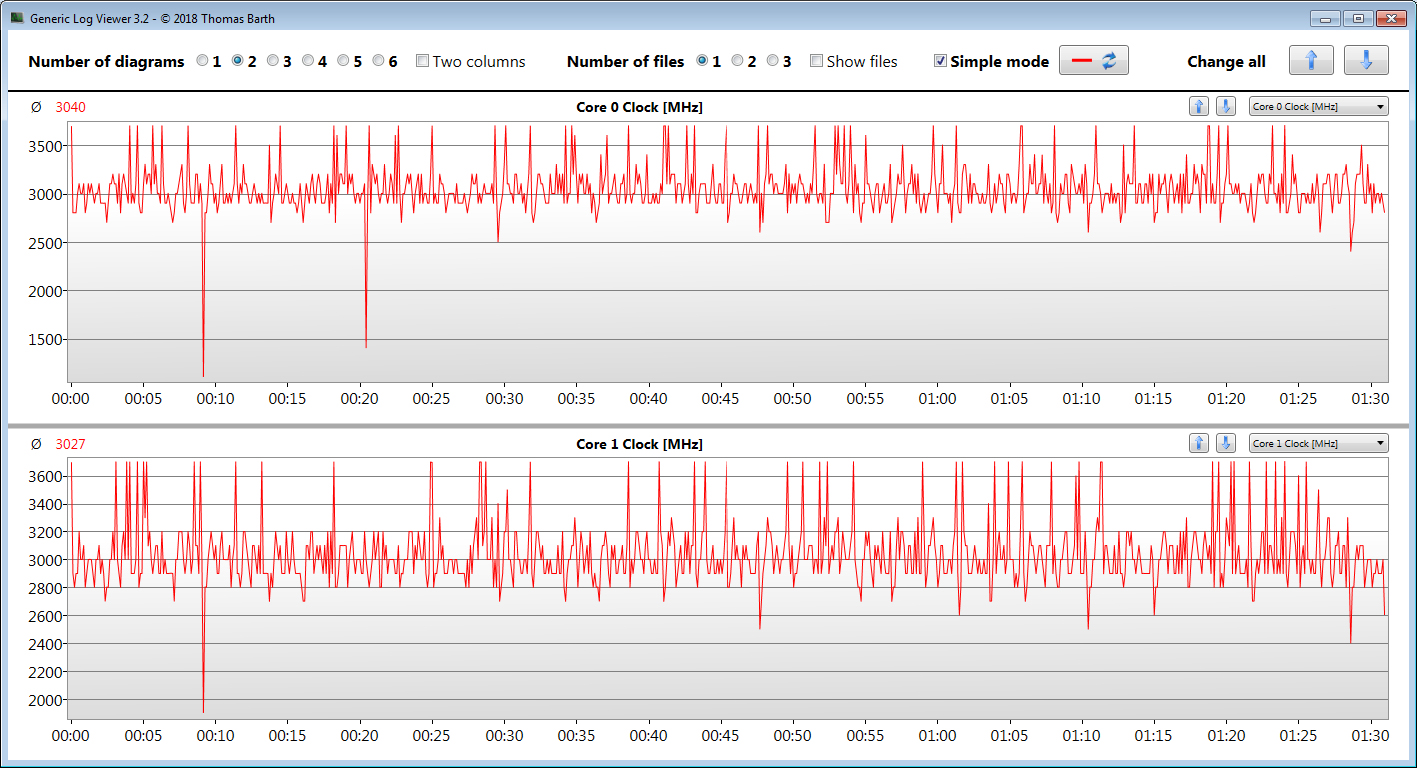
Nossos testes de CPU CineBench foram realizados em 2,8 a 3,7 GHz (mono e multi-tarefa). Na bateria, as velocidades de relógio estavam entre 1,9 a 2,3 GHz (multifios) e 1,5 a 2,3 GHz (mono-fios).
Executamos o teste multi-tarefa CineBench R15 por pelo menos 30 minutos em um loop para determinar se um processador é capaz de utilizar ou não altas velocidades de relógio turbo-boost sob carga sustentada. Neste caso, o turboalimentação foi aplicado durante todo o teste e flutuou, porém as pontuações obtidas foram consistentes
| HWBOT x265 Benchmark v2.2 - 4k Preset | |
| Média da turma Office (2.21 - 26, n=76, últimos 2 anos) | |
| Lenovo ThinkPad E15 Gen2-20T9S00K00 | |
| HP ProBook 455 G7-175W8EA | |
| HP ProBook 450 G7 8WC04UT | |
| Dell Latitude 15 3510 NK2MC | |
| Média Intel Core i3-10110U (2.72 - 3.12, n=2) | |
| HP 17-by2437ng | |
| LibreOffice - 20 Documents To PDF | |
| HP ProBook 455 G7-175W8EA | |
| HP ProBook 450 G7 8WC04UT | |
| HP 17-by2437ng | |
| Lenovo ThinkPad E15 Gen2-20T9S00K00 | |
| Média da turma Office (39.9 - 102.3, n=76, últimos 2 anos) | |
| Média Intel Core i3-10110U (28.1 - 65.4, n=2) | |
| Dell Latitude 15 3510 NK2MC | |
* ... menor é melhor
Desempenho do sistema
O sistema foi suave e rápido. Nossa unidade de revisão certamente não foi feita para satisfazer os requisitos de alto desempenho. O computador foi mais que rápido o suficiente para aplicações de escritório e internet. A adição de um módulo de RAM secundário melhoraria ligeiramente o desempenho geral graças aos benefícios de uma interface RAM de canal duplo
| PCMark 8 Home Score Accelerated v2 | 2898 pontos | |
| PCMark 8 Creative Score Accelerated v2 | 2958 pontos | |
| PCMark 8 Work Score Accelerated v2 | 4314 pontos | |
| PCMark 10 Score | 3360 pontos | |
Ajuda | ||
Latências DPC
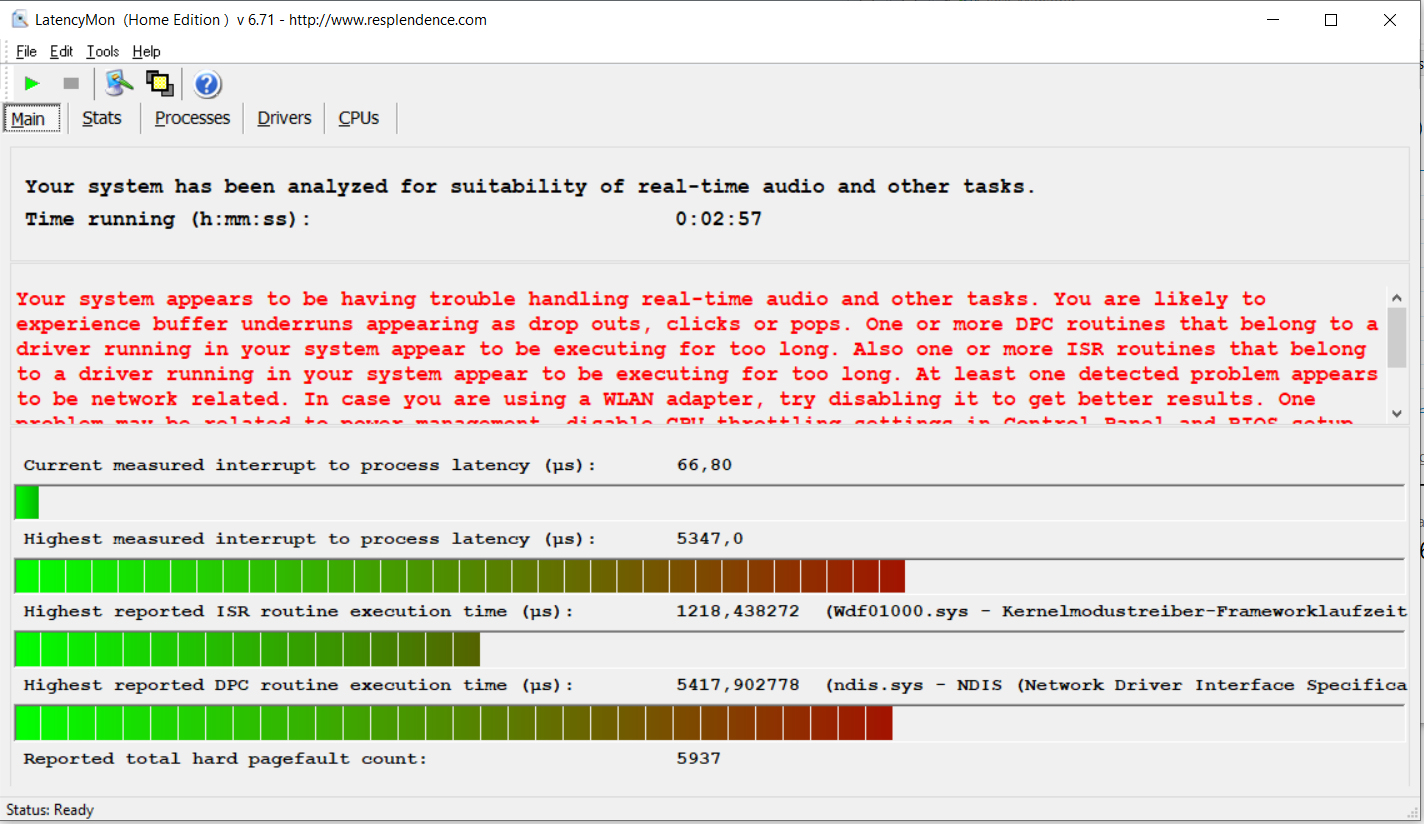
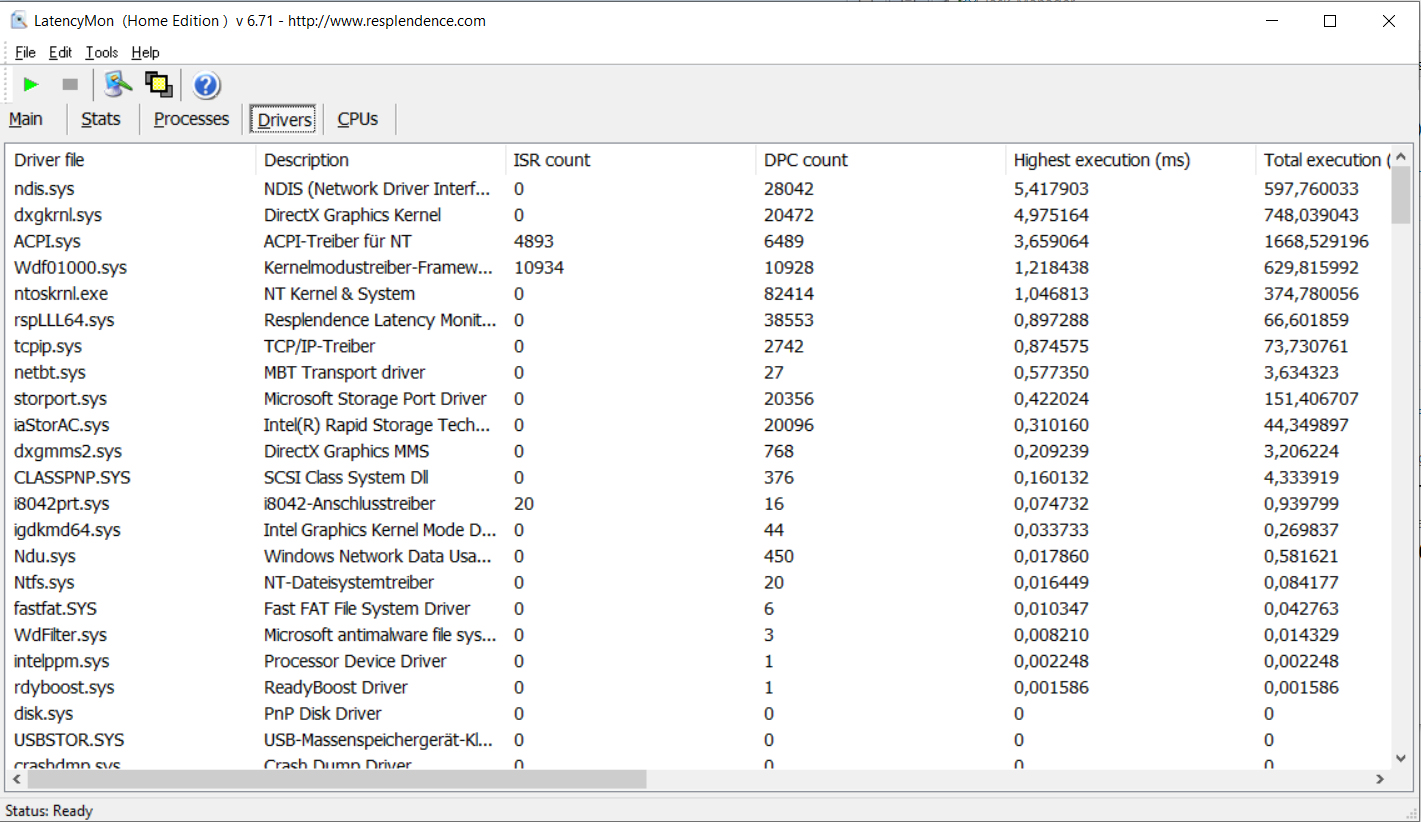
| DPC Latencies / LatencyMon - interrupt to process latency (max), Web, Youtube, Prime95 | |
| Dell Latitude 15 3510 NK2MC | |
| HP ProBook 450 G7 8WC04UT | |
| HP ProBook 455 G7-175W8EA | |
* ... menor é melhor
Dispositivos de armazenamento
O SSD de escolha da Dell é um SSD de 256 GB M.2-2230 Kioxia NVMe. Embora seu desempenho tenha sido adequado e decente, certamente não foi um dos principais competidores nesta categoria

| Dell Latitude 15 3510 NK2MC Toshiba KBG40ZNS256G NVMe | Lenovo ThinkPad E15 Gen2-20T9S00K00 Samsung PM991 MZALQ512HALU | HP ProBook 450 G7 8WC04UT Crucial P1 SSD CT1000P1SSD8 | HP ProBook 455 G7-175W8EA Samsung PM991 MZVLQ512HALU | Acer Extensa 15 EX215-51-56UX WDC PC SN520 SDAPNUW-512G | Média Toshiba KBG40ZNS256G NVMe | Média da turma Office | |
|---|---|---|---|---|---|---|---|
| CrystalDiskMark 5.2 / 6 | 18% | -15% | 2% | 21% | -1% | 114% | |
| Write 4K (MB/s) | 150 | 104.9 -30% | 111.1 -26% | 141.9 -5% | 176.1 17% | 112.1 ? -25% | 153.2 ? 2% |
| Read 4K (MB/s) | 61.8 | 46.54 -25% | 56.3 -9% | 37.25 -40% | 50.4 -18% | 50.6 ? -18% | 73.4 ? 19% |
| Write Seq (MB/s) | 458 | 1333 191% | 559 22% | 998 118% | 1457 218% | 961 ? 110% | 2531 ? 453% |
| Read Seq (MB/s) | 1881 | 1565 -17% | 1348 -28% | 1233 -34% | 1424 -24% | 1562 ? -17% | 3292 ? 75% |
| Write 4K Q32T1 (MB/s) | 338.4 | 437.2 29% | 277.1 -18% | 338.4 0% | 381 13% | 299 ? -12% | 431 ? 27% |
| Read 4K Q32T1 (MB/s) | 447.3 | 498.9 12% | 312.1 -30% | 431.1 -4% | 436.5 -2% | 359 ? -20% | 516 ? 15% |
| Write Seq Q32T1 (MB/s) | 1563 | 1315 -16% | 1652 6% | 1367 -13% | 1455 -7% | 1366 ? -13% | 4178 ? 167% |
| Read Seq Q32T1 (MB/s) | 2422 | 2340 -3% | 1588 -34% | 2355 -3% | 1725 -29% | 2170 ? -10% | 6043 ? 150% |
| Write 4K Q8T8 (MB/s) | 877 | 380 ? | 952 ? | ||||
| Read 4K Q8T8 (MB/s) | 518 | 852 ? | 1346 ? | ||||
| AS SSD | 76% | 61% | 49% | 55% | 33% | 194% | |
| Seq Read (MB/s) | 1971 | 1934 -2% | 1155 -41% | 1929 -2% | 1542 -22% | 1752 ? -11% | 4326 ? 119% |
| Seq Write (MB/s) | 1130 | 1198 6% | 984 -13% | 1199 6% | 1249 11% | 720 ? -36% | 2771 ? 145% |
| 4K Read (MB/s) | 51.3 | 47.08 -8% | 48.85 -5% | 43.9 -14% | 38.79 -24% | 47.3 ? -8% | 58.1 ? 13% |
| 4K Write (MB/s) | 119.7 | 132.8 11% | 96.6 -19% | 116.2 -3% | 89.3 -25% | 118.6 ? -1% | 162.6 ? 36% |
| 4K-64 Read (MB/s) | 585 | 866 48% | 581 -1% | 897 53% | 966 65% | 866 ? 48% | 958 ? 64% |
| 4K-64 Write (MB/s) | 495.5 | 872 76% | 658 33% | 801 62% | 885 79% | 402 ? -19% | 1643 ? 232% |
| Access Time Read * (ms) | 0.107 | 0.116 -8% | 0.066 38% | 0.069 36% | 0.1034 ? 3% | 0.08448 ? 21% | |
| Access Time Write * (ms) | 0.22 | 0.03 86% | 0.207 6% | 0.033 85% | 0.044 80% | 0.3076 ? -40% | 0.05931 ? 73% |
| Score Read (Points) | 833 | 1106 33% | 745 -11% | 1134 36% | 1159 39% | 1088 ? 31% | 1449 ? 74% |
| Score Write (Points) | 728 | 1125 55% | 853 17% | 1037 42% | 1099 51% | 592 ? -19% | 2083 ? 186% |
| Score Total (Points) | 1962 | 2771 41% | 1986 1% | 2723 39% | 2842 45% | 2197 ? 12% | 4207 ? 114% |
| Copy ISO MB/s (MB/s) | 273.5 | 1258 360% | 2635 863% | 1409 415% | 894 227% | 926 ? 239% | 2541 ? 829% |
| Copy Program MB/s (MB/s) | 184.6 | 411.2 123% | 95.1 -48% | 70.2 -62% | 304.9 65% | 372 ? 102% | 790 ? 328% |
| Copy Game MB/s (MB/s) | 281 | 945 236% | 361.9 29% | 254.9 -9% | 642 128% | 714 ? 154% | 1627 ? 479% |
| Média Total (Programa/Configurações) | 47% /
54% | 23% /
33% | 26% /
32% | 38% /
42% | 16% /
20% | 154% /
165% |
* ... menor é melhor
Sustained Read: DiskSpd Read Loop, Queue Depth 8
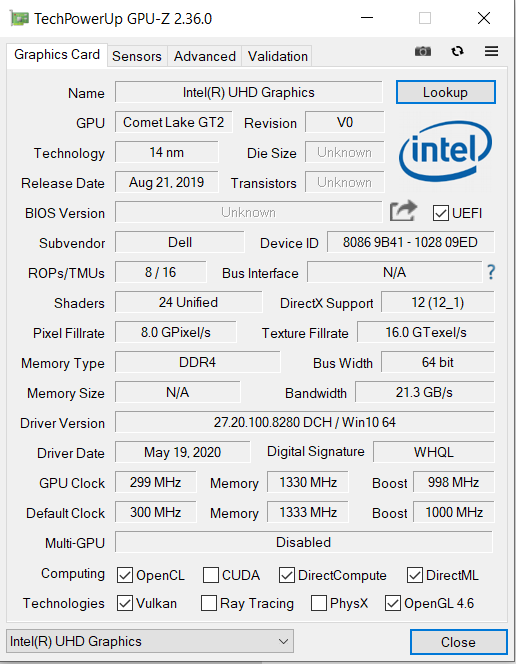
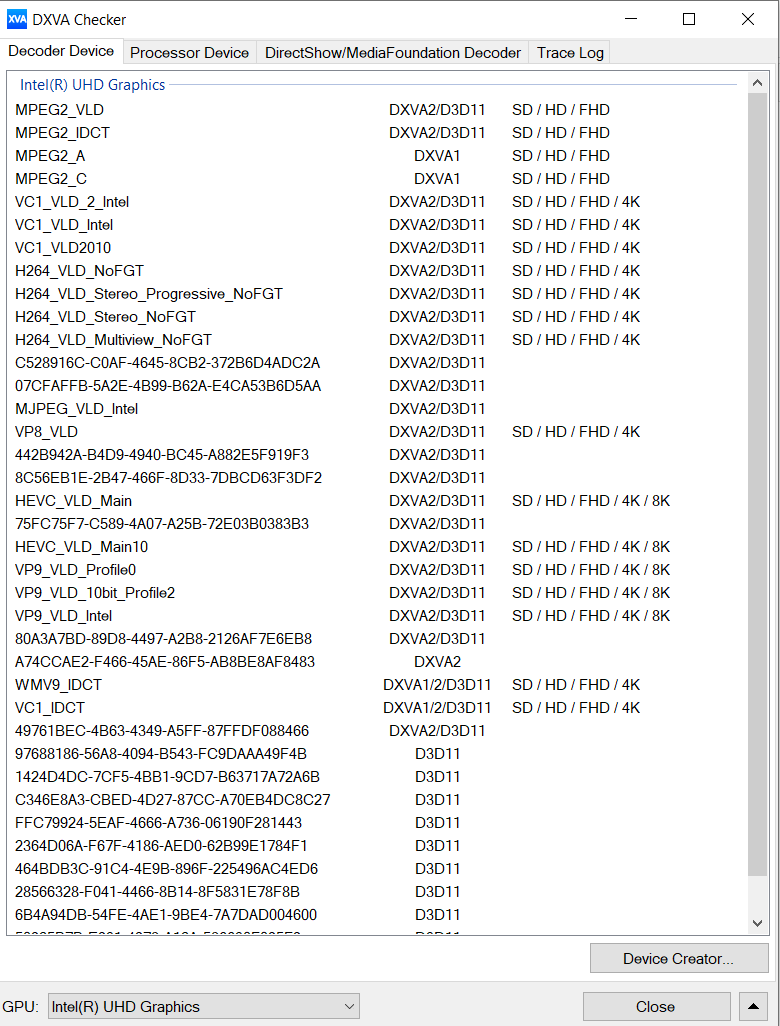
Desempenho da GPU
A IntelUHD Graphics 620 suporta DirectX 12 e funciona a velocidades de relógio entre 300 e 1.000 MHz. Seus resultados de benchmark 3DMark estavam a um nível esperado desta GPU. A adição de um módulo de RAM secundário melhoraria ligeiramente o desempenho geral graças aos benefícios de uma interface RAM de canal duplo
| 3DMark 11 Performance | 1690 pontos | |
| 3DMark Ice Storm Standard Score | 51185 pontos | |
| 3DMark Cloud Gate Standard Score | 5883 pontos | |
| 3DMark Fire Strike Score | 882 pontos | |
Ajuda | ||
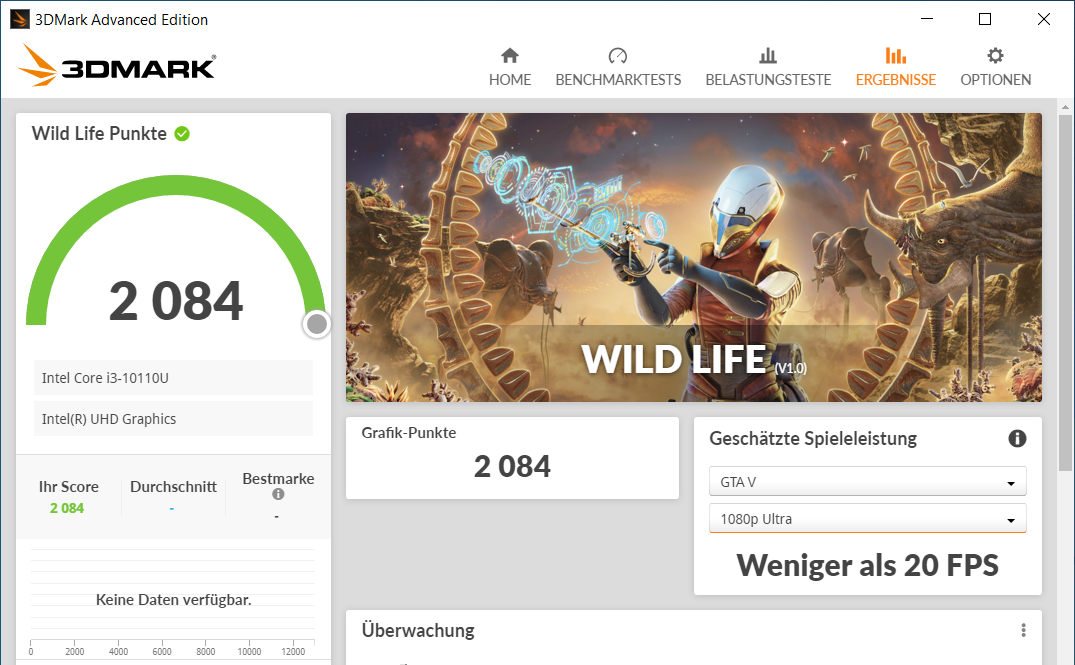
Desempenho nos jogos
O Latitude certamente não é um caderno de jogos. Ele é capaz de rodar jogos com requisitos de hardware baixos a moderados. A adição de um módulo de RAM secundário aumentaria ligeiramente as taxas de quadros graças aos benefícios de uma interface RAM de canal duplo. Os títulos atuais, como o Cyberpunk 2077, são inutilizáveis
| baixo | média | alto | ultra | |
|---|---|---|---|---|
| BioShock Infinite (2013) | 42 | 28.5 | 23.5 | 7.5 |
| Dota 2 Reborn (2015) | 60 | 31 | 15.6 | 13.9 |
Emissions & Energy – Quiet and Cool Dell Computer
Emissões sonoras
Os níveis gerais de ruído eram muito baixos. O ventilador estava desligado a maior parte do tempo quando o ventilador estava ocioso, e o dispositivo, portanto, silencioso. Sob carga, ele só se recuperou ligeiramente. O nível máximo de pressão sonora registrado por nós foi de apenas 35,1 dB(A)
Barulho
| Ocioso |
| 25 / 25 / 27.8 dB |
| Carga |
| 35.1 / 34.8 dB |
 | ||
30 dB silencioso 40 dB(A) audível 50 dB(A) ruidosamente alto |
||
min: | ||
Temperatura
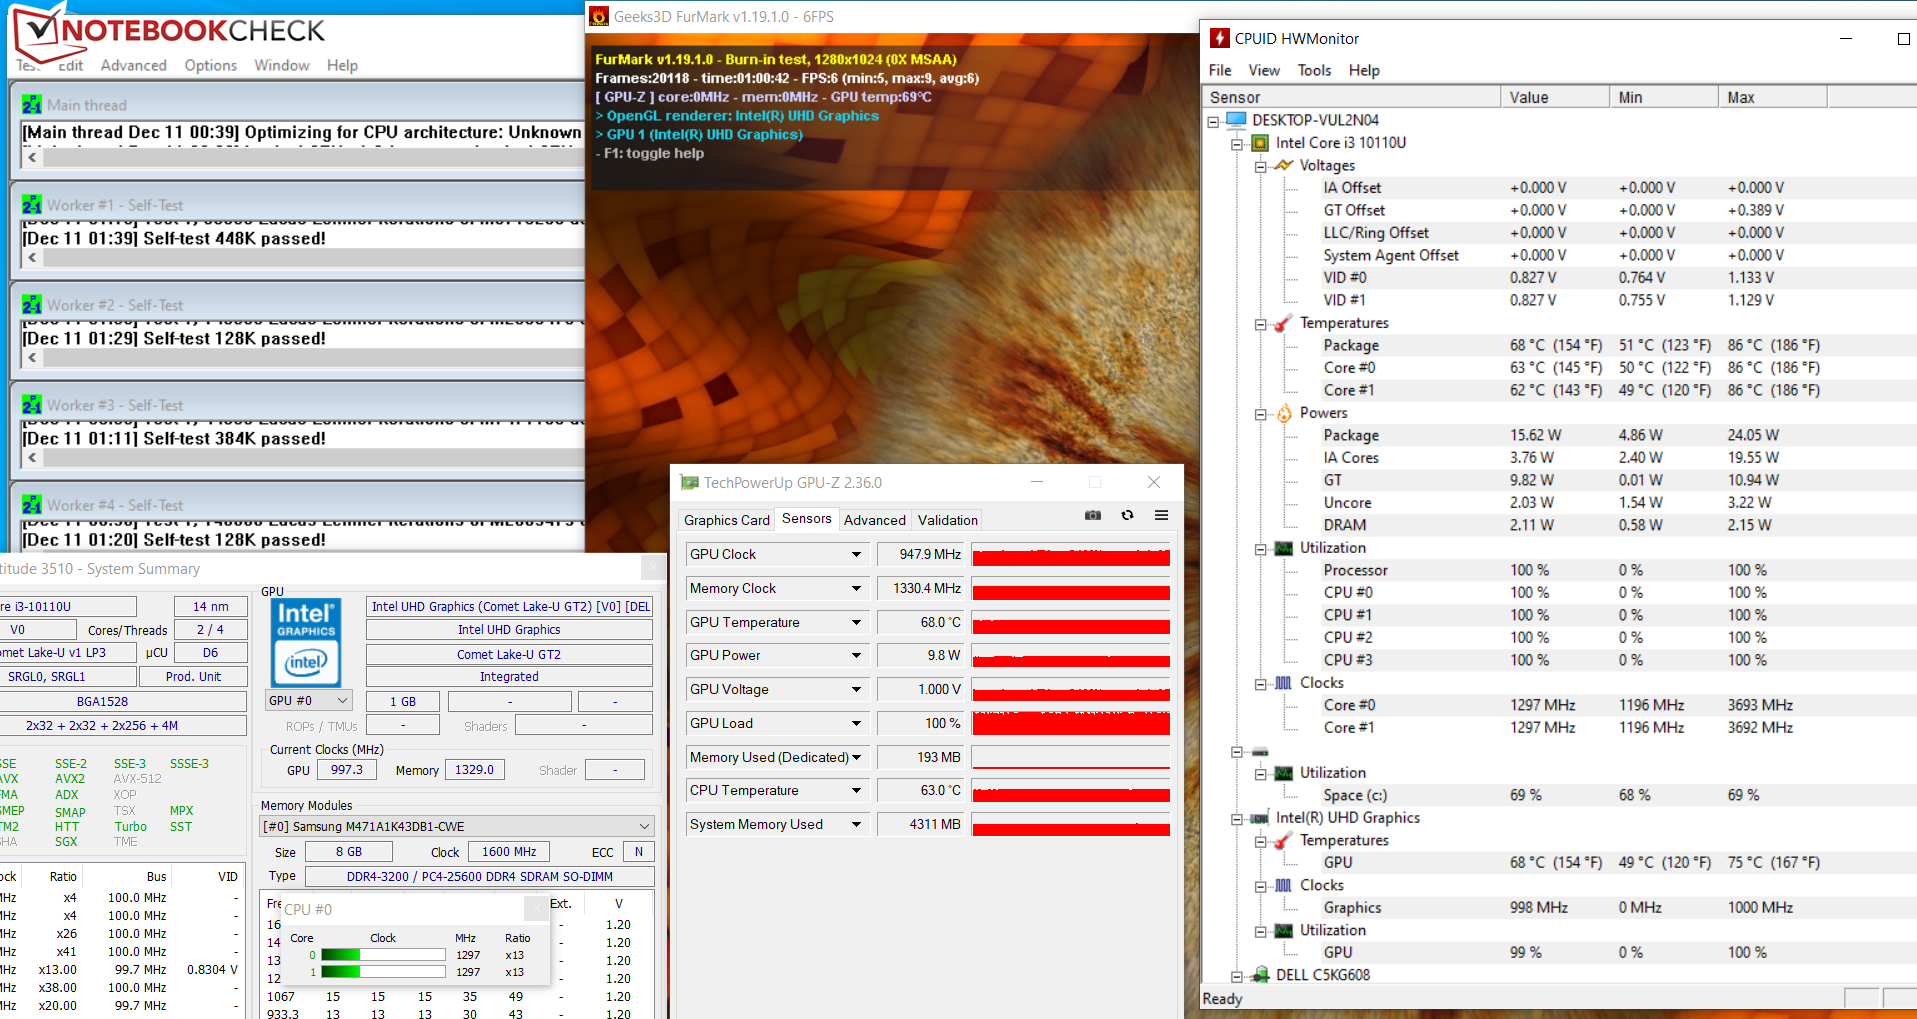
Ao executar nosso teste de estresse (Prime95 e FurMark simultaneamente por pelo menos uma hora) a CPU manteve altas velocidades de relógio durante os primeiros minutos antes de cair para 1,1 a 1,2 GHz. As velocidades da GPU diminuíram de uma alta inicial de 1.000 MHz para 900 a 950 MHz. As velocidades dos relógios eram idênticas tanto na rede elétrica quanto na bateria. Tenha em mente que nosso teste de estresse é um cenário de carga extrema que não ocorre durante o uso diário. Utilizamos este teste para determinar possíveis problemas de estrangulamento e estabilidade.
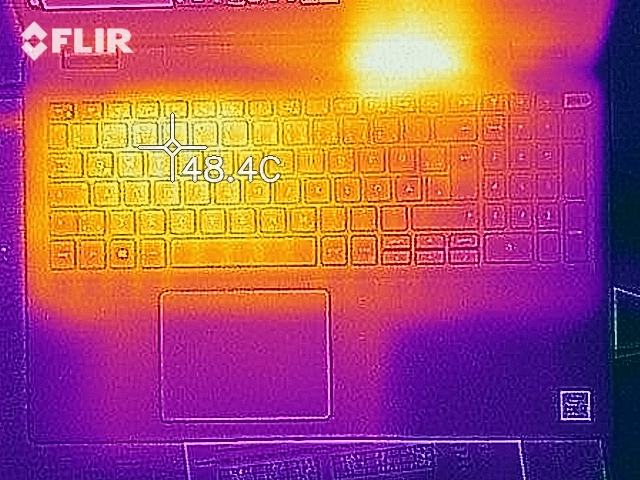
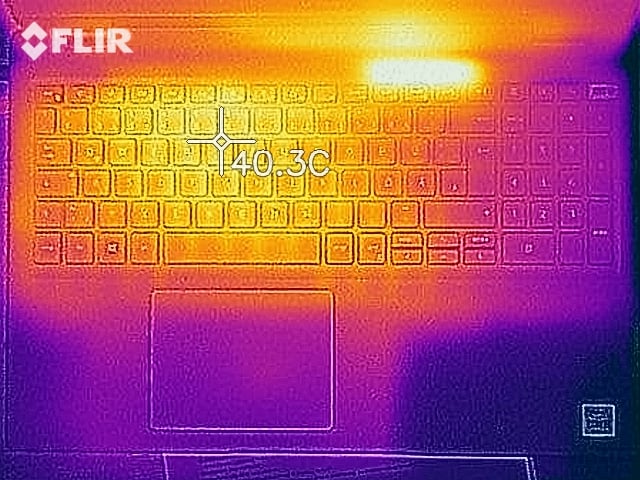
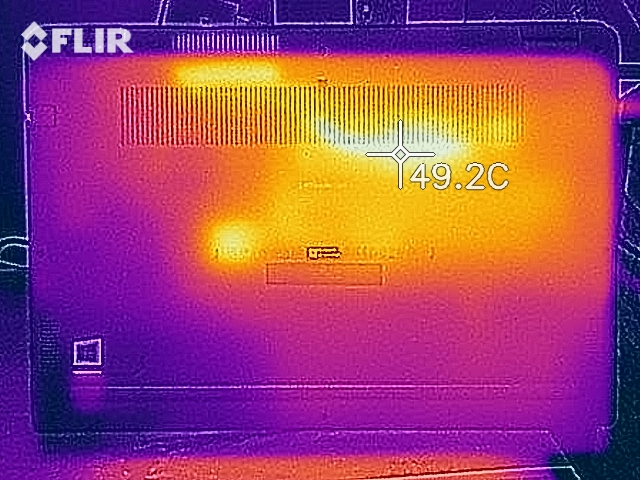
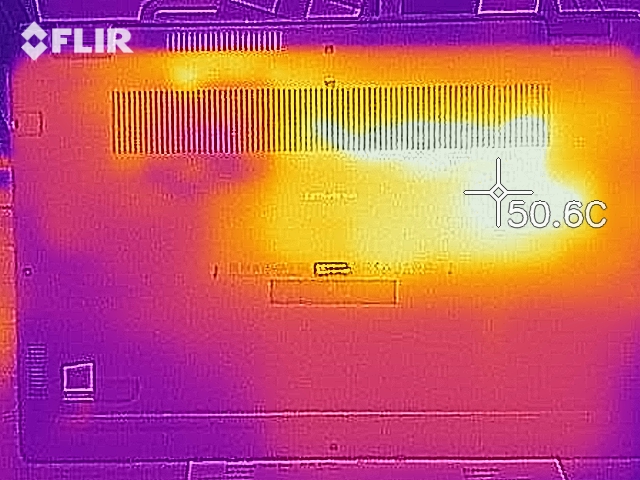
No geral, o notebook de 15,6 polegadas permaneceu comparativamente frio. Encontramos um único ponto quente com mais de 40 °C enquanto realizávamos nosso teste de estresse. As temperaturas eram muito mais baixas e discretas em condições normais
(+) A temperatura máxima no lado superior é 39 °C / 102 F, em comparação com a média de 34.3 °C / 94 F , variando de 21.2 a 62.5 °C para a classe Office.
(±) A parte inferior aquece até um máximo de 40.6 °C / 105 F, em comparação com a média de 36.8 °C / 98 F
(+) Em uso inativo, a temperatura média para o lado superior é 24.1 °C / 75 F, em comparação com a média do dispositivo de 29.5 °C / ### class_avg_f### F.
(+) Os apoios para as mãos e o touchpad são mais frios que a temperatura da pele, com um máximo de 25 °C / 77 F e, portanto, são frios ao toque.
(+) A temperatura média da área do apoio para as mãos de dispositivos semelhantes foi 27.5 °C / 81.5 F (+2.5 °C / 4.5 F).
Oradores
Os alto-falantes estéreo funcionaram bem e produziram uma paisagem sonora decente, sem graves
Dell Latitude 15 3510 NK2MC análise de áudio
(±) | o volume do alto-falante é médio, mas bom (###valor### dB)
Graves 100 - 315Hz
(-) | quase nenhum baixo - em média 25.9% menor que a mediana
(-) | graves não são lineares (16.7% delta para frequência anterior)
Médios 400 - 2.000 Hz
(±) | médios mais altos - em média 6.9% maior que a mediana
(+) | médios são lineares (6.4% delta para frequência anterior)
Altos 2 - 16 kHz
(+) | agudos equilibrados - apenas 1.6% longe da mediana
(+) | os máximos são lineares (3.9% delta da frequência anterior)
Geral 100 - 16.000 Hz
(±) | a linearidade do som geral é média (21.5% diferença em relação à mediana)
Comparado com a mesma classe
» 54% de todos os dispositivos testados nesta classe foram melhores, 8% semelhantes, 37% piores
» O melhor teve um delta de 7%, a média foi 21%, o pior foi 53%
Comparado com todos os dispositivos testados
» 61% de todos os dispositivos testados foram melhores, 7% semelhantes, 32% piores
» O melhor teve um delta de 4%, a média foi 23%, o pior foi 134%
Consumo de energia
O consumo de energia estava em um nível esperado, considerando seu hardware interno. Quando ocioso, atingiu um pico de 9,7 W, e aumentou para 45 W enquanto realizávamos nosso teste de estresse (Prime95 e FurMark simultaneamente por pelo menos uma hora). A fonte de energia é classificada em 65 W
| desligado | |
| Ocioso | |
| Carga |
|
Key:
min: | |
Vida útil da bateria
Nosso teste Wi-Fi simula a carga típica de navegação na web através de um script. Com todos os recursos de economia de energia desativados e o brilho da tela normalizado para 150 lêndeas, o Latitude 3510 funcionou por 7:45 horas
Pro
Contra
Veredicto
O Dell's Latitude 3510 é um notebook comercial discreto alimentado por um processador Core i3 suficientemente rápido para aplicações de escritório e internet. O dispositivo permaneceu muito silencioso e fresco de modo geral.
Sua baixa relação preço-desempenho torna o Dell Latitude 3510 pouco atrativo para os consumidores.
A CPU tem acesso a 8 GB de RAM rodando em modo monocanal, sacrificando assim algum desempenho. Isto pode ser aliviado graças ao fato de que o notebook possui dois slots de RAM. Ele suporta até 32 GB de RAM.
A vida útil da bateria foi decente e em um nível equivalente ao de seus concorrentes. SKUs mais caras e potentes podem funcionar ainda mais tempo graças a suas 53 Wh baterias. O Core i3-equipado Latitude tem que se contentar com uma bateria de 40 Wh.
A fonte de alimentação Dell incluída se encaixa na porta de carga proprietária. Entretanto, o dispositivo também pode ser carregado via USB-C graças a seu suporte para fornecimento de energia, o que tentamos com sucesso.
A tela FHD IPS é sua maior fraqueza. Demasiado escuro, contraste muito baixo, pouca cobertura de espaço de cor e PWM tremeluzindo até a inicialização. Em troca, ele oferece uma superfície fosca, bem como grandes ângulos de visão. Um notebook nesta faixa de preço tem que oferecer mais
Dell Latitude 15 3510 NK2MC
- 12/18/2020 v7 (old)
Sascha Mölck
Price comparison

