Breve Análise do Portátil HP ProBook 455 G7: Desempenho mais rápido graças ao Zen2
Avaliação | Data | Modelo | Peso | Altura | Size | Resolução | Preço |
|---|---|---|---|---|---|---|---|
| 82.6 % v7 (old) | 07/2020 | HP ProBook 455 G7-175W8EA R7 4700U, Vega 7 | 1.8 kg | 19 mm | 15.60" | 1920x1080 | |
| 79.5 % v7 (old) | 09/2019 | HP ProBook 455R G6 R5 3500U, Vega 8 | 2 kg | 19 mm | 15.60" | 1920x1080 | |
| 77.9 % v7 (old) | 06/2020 | HP 15s-fq1440ng i7-1065G7, Iris Plus Graphics G7 (Ice Lake 64 EU) | 1.6 kg | 17.9 mm | 15.60" | 1920x1080 | |
| 82.1 % v7 (old) | 03/2020 | Lenovo ThinkPad E15 20RD0011GE i7-10510U, Radeon RX 640 | 1.8 kg | 18.9 mm | 15.60" | 1920x1080 | |
| 81.8 % v7 (old) | 02/2020 | Lenovo ThinkBook 15 i5-10210U, UHD Graphics 620 | 1.9 kg | 18.9 mm | 15.60" | 1920x1080 | |
| 85.6 % v6 (old) | Dell Latitude 5590 i5-8250U, UHD Graphics 620 | 2 kg | 20.6 mm | 15.60" | 1920x1080 |
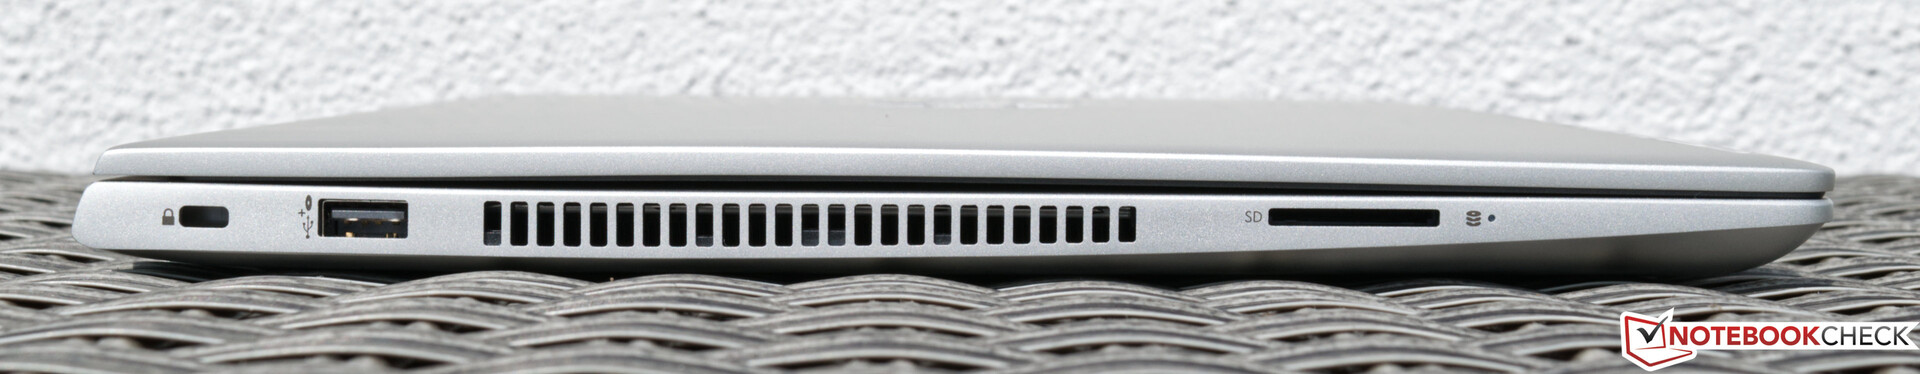
| SD Card Reader | |
| average JPG Copy Test (av. of 3 runs) | |
| Dell Latitude 5590 (Toshiba Exceria Pro SDXC 64 GB UHS-II) | |
| HP ProBook 455R G6 (Toshiba Exceria Pro SDXC 64 GB UHS-II) | |
| Lenovo ThinkBook 15 (Toshiba Exceria Pro SDXC 64 GB UHS-II) | |
| HP ProBook 455 G7-175W8EA (Toshiba Exceria Pro SDXC 64 GB UHS-II) | |
| Média da turma Office (19.8 - 198.5, n=22, últimos 2 anos) | |
| HP 15s-fq1440ng (Toshiba Exceria Pro SDXC 64 GB UHS-II) | |
| maximum AS SSD Seq Read Test (1GB) | |
| Dell Latitude 5590 (Toshiba Exceria Pro SDXC 64 GB UHS-II) | |
| HP ProBook 455R G6 (Toshiba Exceria Pro SDXC 64 GB UHS-II) | |
| HP ProBook 455 G7-175W8EA (Toshiba Exceria Pro SDXC 64 GB UHS-II) | |
| Lenovo ThinkBook 15 (Toshiba Exceria Pro SDXC 64 GB UHS-II) | |
| Média da turma Office (27.4 - 249, n=21, últimos 2 anos) | |
| Networking - iperf3 receive AX12 | |
| Média Intel Wi-Fi 6 AX200 (523 - 1684, n=128) | |
| Lenovo ThinkPad E15 20RD0011GE | |
| HP ProBook 455 G7-175W8EA | |
| Lenovo ThinkBook 15 | |
| HP 15s-fq1440ng | |
| HP ProBook 455R G6 | |
| Dell Latitude 5590 | |


| |||||||||||||||||||||||||
iluminação: 88 %
iluminação com acumulador: 210 cd/m²
Contraste: 1484:1 (Preto: 0.19 cd/m²)
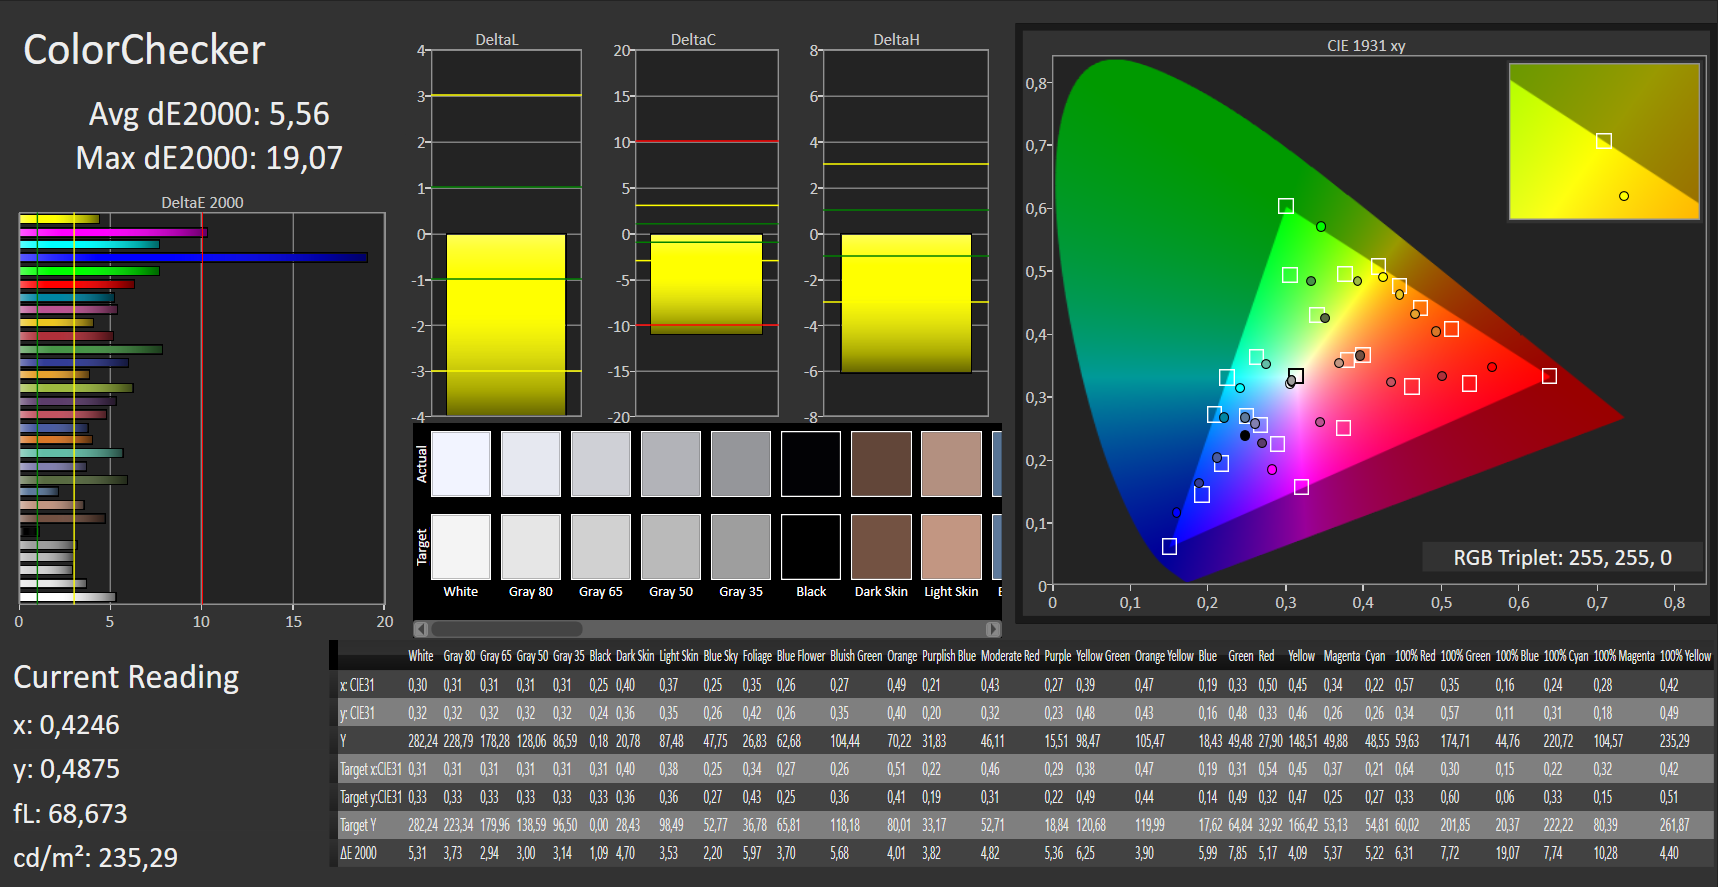
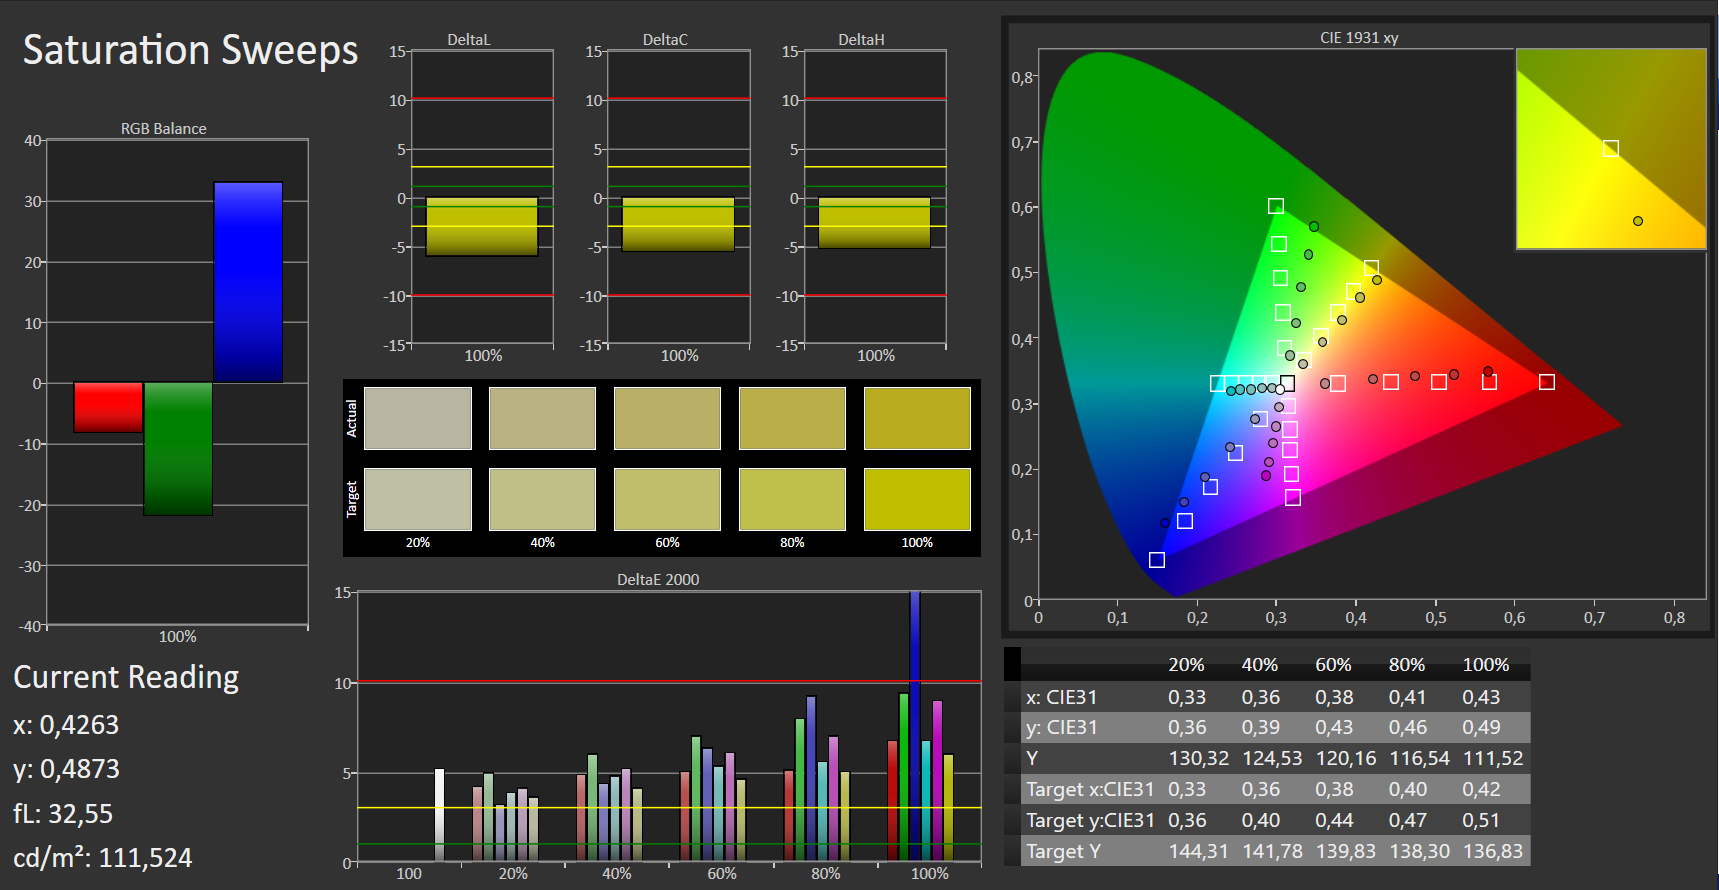
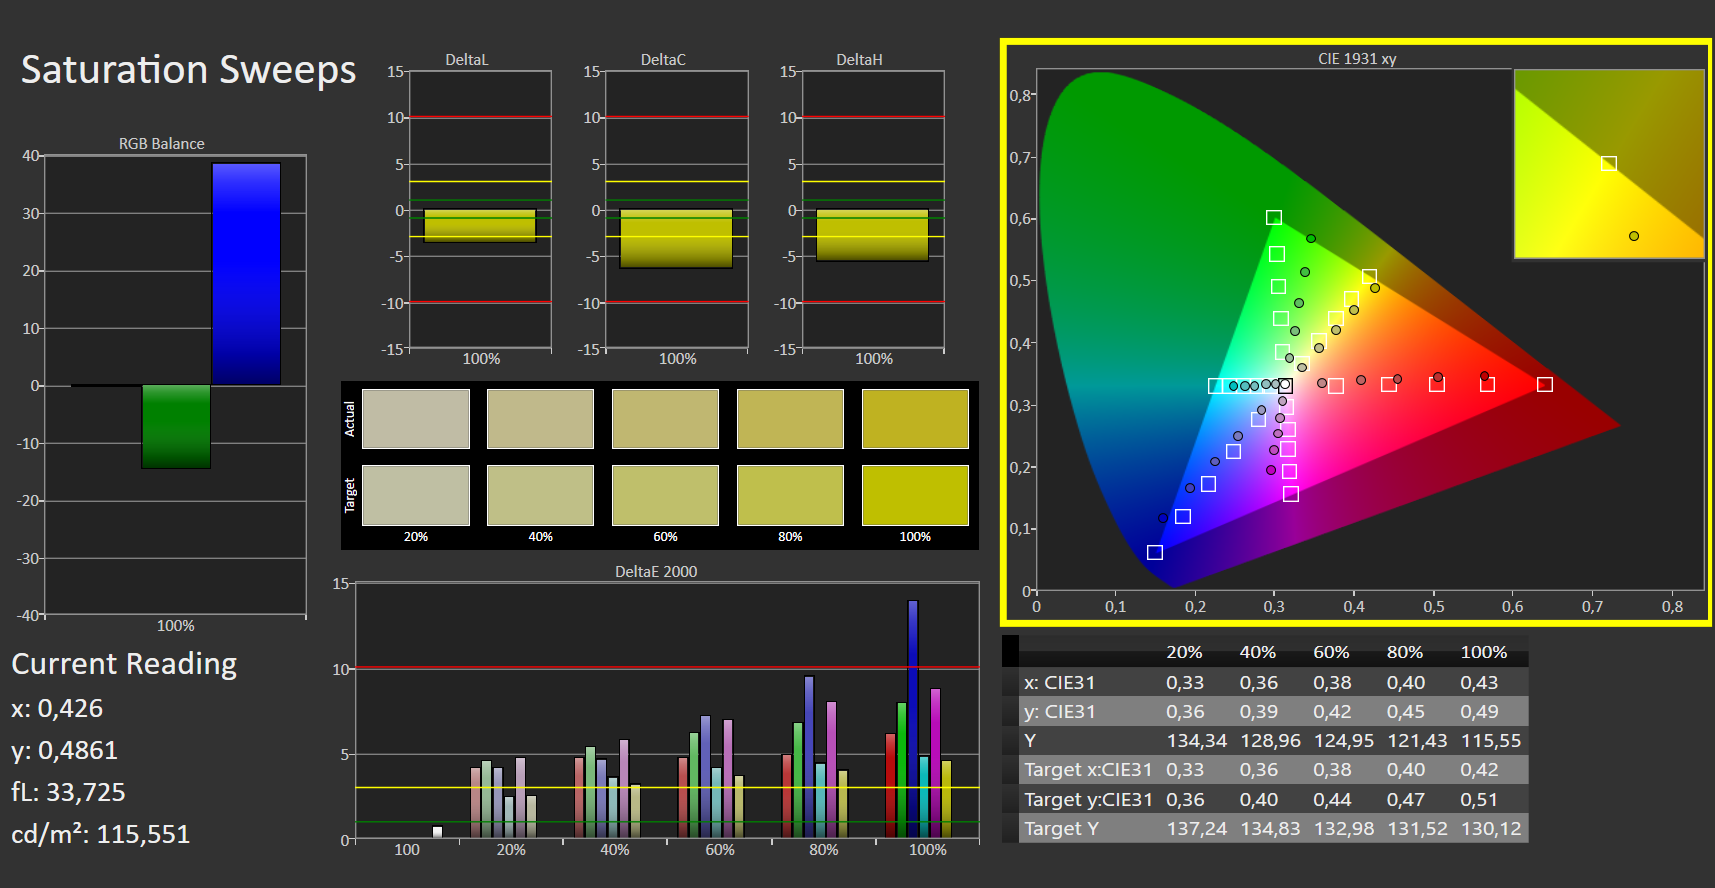
ΔE ColorChecker Calman: 5.56 | ∀{0.5-29.43 Ø4.71}
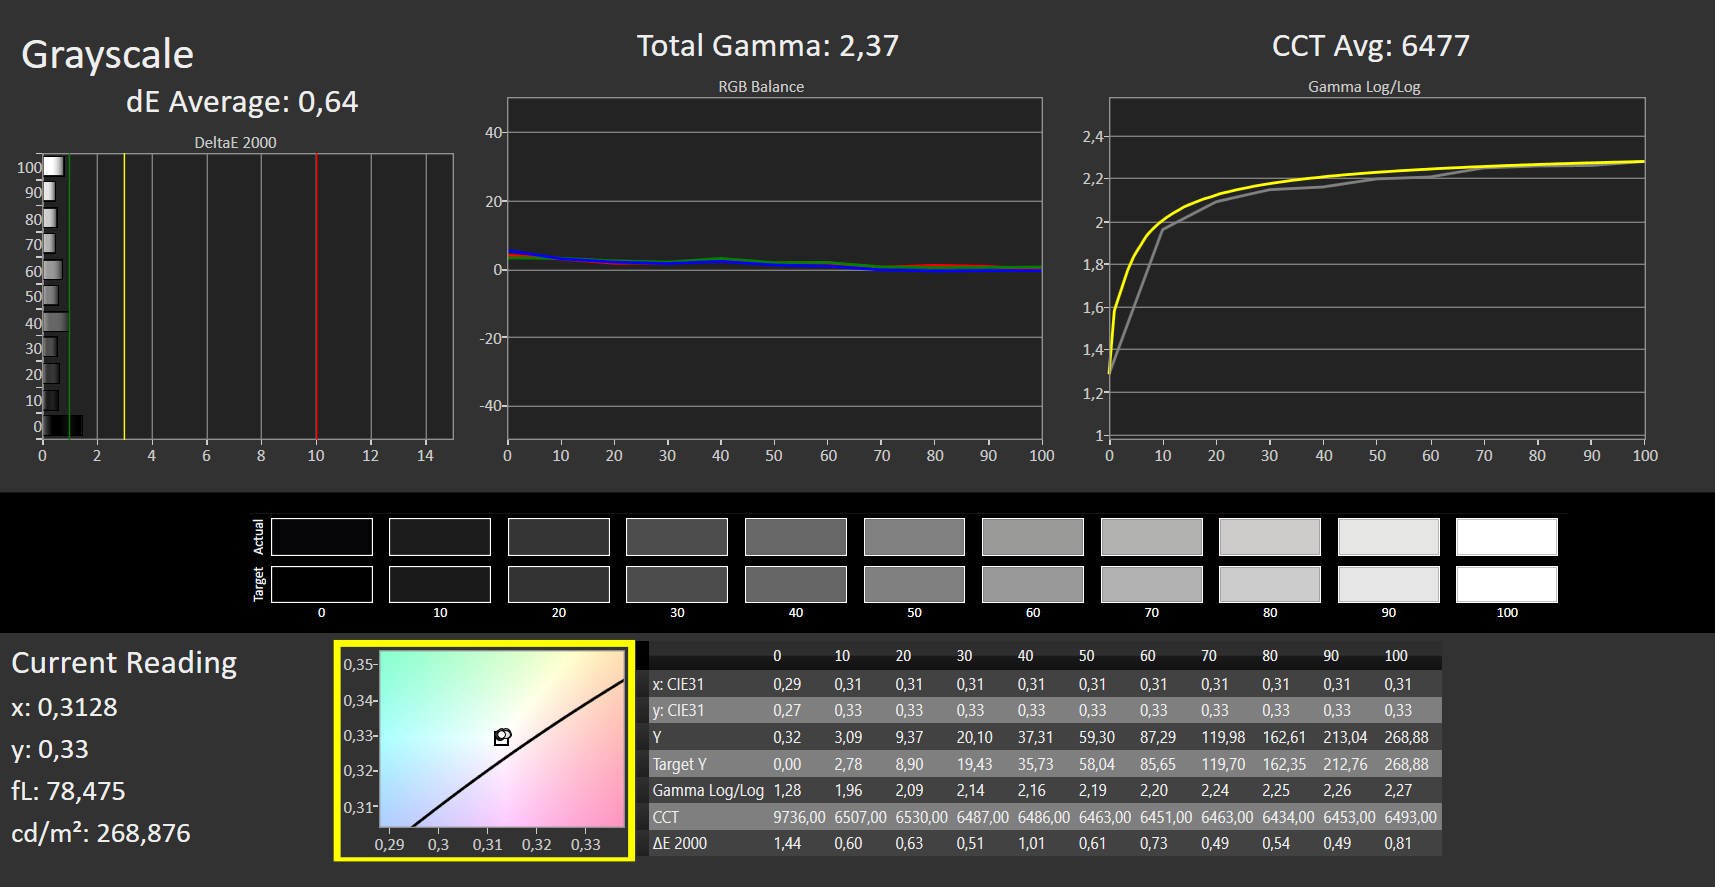
calibrated: 4.5
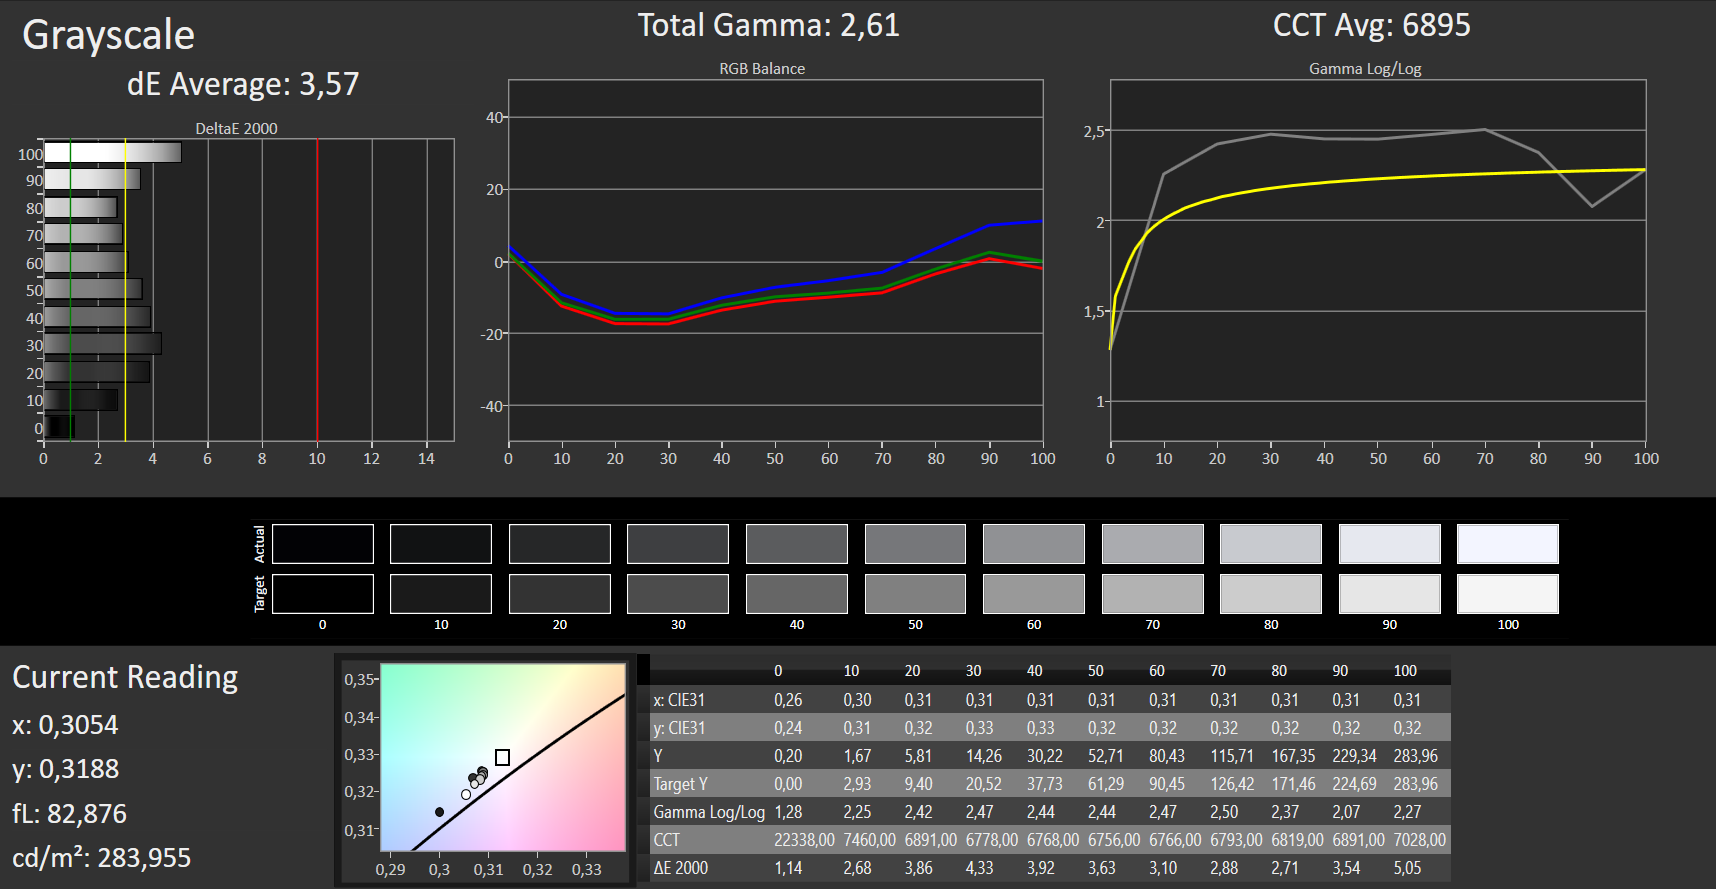
ΔE Greyscale Calman: 3.57 | ∀{0.09-98 Ø4.96}
57% sRGB (Argyll 1.6.3 3D)
36% AdobeRGB 1998 (Argyll 1.6.3 3D)
39.18% AdobeRGB 1998 (Argyll 3D)
57.1% sRGB (Argyll 3D)
37.92% Display P3 (Argyll 3D)
Gamma: 2.61
CCT: 6895 K
| HP ProBook 455 G7-175W8EA AUO, B156HW02, IPS, 1920x1080, 15.6" | HP ProBook 455R G6 LG Philips LGD05CE, IPS, 1920x1080, 15.6" | HP 15s-fq1440ng AU Optronics AUO61ED, TN, 1920x1080, 15.6" | Lenovo ThinkPad E15 20RD0011GE NV156FHM-N48, IPS LED, 1920x1080, 15.6" | Lenovo ThinkBook 15 LP156WFC-SPD1, IPS, 1920x1080, 15.6" | Dell Latitude 5590 NV15N42, IPS, 1920x1080, 15.6" | |
|---|---|---|---|---|---|---|
| Display | -1% | -5% | 4% | 1% | 9% | |
| Display P3 Coverage (%) | 37.92 | 37.44 -1% | 36.04 -5% | 40.25 6% | 38.38 1% | 41.56 10% |
| sRGB Coverage (%) | 57.1 | 56.3 -1% | 54.2 -5% | 57.7 1% | 57.7 1% | 61.3 7% |
| AdobeRGB 1998 Coverage (%) | 39.18 | 38.71 -1% | 37.24 -5% | 41.59 6% | 39.67 1% | 42.93 10% |
| Response Times | 13% | 25% | -30% | 0% | -41% | |
| Response Time Grey 50% / Grey 80% * (ms) | 41 ? | 34 ? 17% | 43 ? -5% | 49.6 ? -21% | 37.6 ? 8% | 53.2 ? -30% |
| Response Time Black / White * (ms) | 26 ? | 24 ? 8% | 12 ? 54% | 36 ? -38% | 28 ? -8% | 39.6 ? -52% |
| PWM Frequency (Hz) | 1250 ? | 1000 ? | ||||
| Screen | -9% | -54% | -20% | -7% | -11% | |
| Brightness middle (cd/m²) | 282 | 262 -7% | 227 -20% | 283 0% | 245 -13% | 243 -14% |
| Brightness (cd/m²) | 264 | 235 -11% | 215 -19% | 258 -2% | 239 -9% | 234 -11% |
| Brightness Distribution (%) | 88 | 83 -6% | 79 -10% | 81 -8% | 82 -7% | 83 -6% |
| Black Level * (cd/m²) | 0.19 | 0.27 -42% | 0.4 -111% | 0.22 -16% | 0.25 -32% | 0.19 -0% |
| Contrast (:1) | 1484 | 970 -35% | 568 -62% | 1286 -13% | 980 -34% | 1279 -14% |
| Colorchecker dE 2000 * | 5.56 | 6.34 -14% | 10.48 -88% | 7.9 -42% | 5.6 -1% | 6.6 -19% |
| Colorchecker dE 2000 max. * | 19.07 | 9.28 51% | 22.49 -18% | 23.6 -24% | 15.6 18% | 22.3 -17% |
| Colorchecker dE 2000 calibrated * | 4.5 | 4.82 -7% | 4.64 -3% | 5.8 -29% | 4.8 -7% | 5 -11% |
| Greyscale dE 2000 * | 3.57 | 4.33 -21% | 12.44 -248% | 6.6 -85% | 3.4 5% | 5.2 -46% |
| Gamma | 2.61 84% | 2.06 107% | 2.77 79% | 2.18 101% | 2.3 96% | 2.24 98% |
| CCT | 6895 94% | 7041 92% | 13027 50% | 5735 113% | 7156 91% | 6990 93% |
| Color Space (Percent of AdobeRGB 1998) (%) | 36 | 36 0% | 34 -6% | 37 3% | 36.5 1% | 39.2 9% |
| Color Space (Percent of sRGB) (%) | 57 | 56 -2% | 54 -5% | 57.1 0% | 57.5 1% | 60.8 7% |
| Média Total (Programa/Configurações) | 1% /
-5% | -11% /
-35% | -15% /
-16% | -2% /
-5% | -14% /
-11% |
* ... menor é melhor

Exibir tempos de resposta
| ↔ Tempo de resposta preto para branco | ||
|---|---|---|
| 26 ms ... ascensão ↗ e queda ↘ combinadas | ↗ 15 ms ascensão | 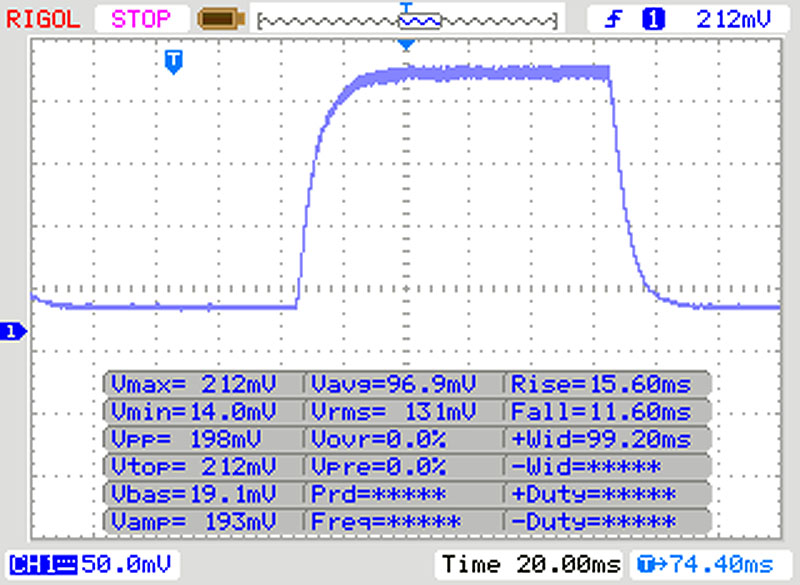 |
| ↘ 11 ms queda | ||
| A tela mostra taxas de resposta relativamente lentas em nossos testes e pode ser muito lenta para os jogadores. Em comparação, todos os dispositivos testados variam de 0.1 (mínimo) a 240 (máximo) ms. » 63 % de todos os dispositivos são melhores. Isso significa que o tempo de resposta medido é pior que a média de todos os dispositivos testados (19.8 ms). | ||
| ↔ Tempo de resposta 50% cinza a 80% cinza | ||
| 41 ms ... ascensão ↗ e queda ↘ combinadas | ↗ 22 ms ascensão | 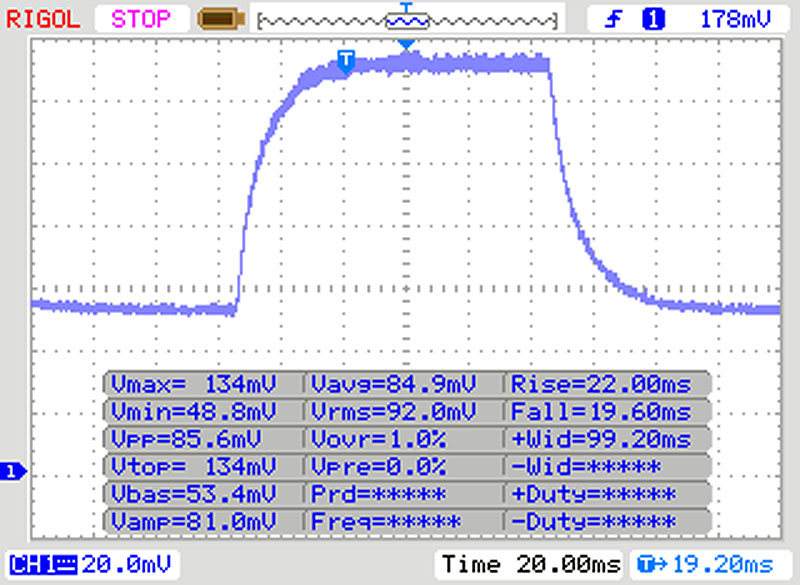 |
| ↘ 19 ms queda | ||
| A tela mostra taxas de resposta lentas em nossos testes e será insatisfatória para os jogadores. Em comparação, todos os dispositivos testados variam de 0.165 (mínimo) a 636 (máximo) ms. » 65 % de todos os dispositivos são melhores. Isso significa que o tempo de resposta medido é pior que a média de todos os dispositivos testados (31 ms). | ||
Cintilação da tela / PWM (modulação por largura de pulso)
| Tela tremeluzindo / PWM não detectado | 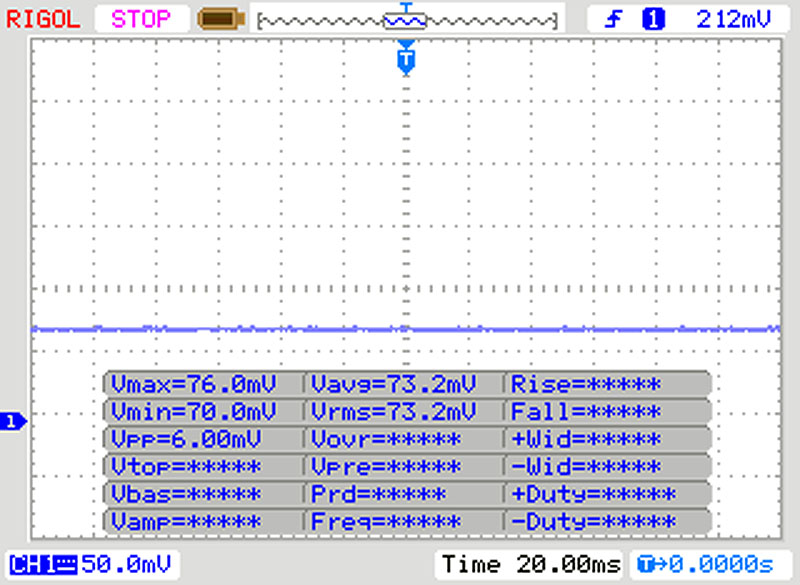 | ||
[pwm_comparison] Em comparação: 52 % de todos os dispositivos testados não usam PWM para escurecer a tela. Se PWM foi detectado, uma média de 7754 (mínimo: 5 - máximo: 343500) Hz foi medida. | |||
Cinebench R15: CPU Single 64Bit | CPU Multi 64Bit
Blender: v2.79 BMW27 CPU
7-Zip 18.03: 7z b 4 -mmt1 | 7z b 4
Geekbench 5.5: Single-Core | Multi-Core
HWBOT x265 Benchmark v2.2: 4k Preset
LibreOffice : 20 Documents To PDF
R Benchmark 2.5: Overall mean
| Cinebench R20 / CPU (Single Core) | |
| Média da turma Office (345 - 816, n=75, últimos 2 anos) | |
| Média AMD Ryzen 7 4700U (448 - 478, n=9) | |
| HP ProBook 455 G7-175W8EA | |
| HP 15s-fq1440ng | |
| Lenovo ThinkPad E15 20RD0011GE | |
| Lenovo ThinkBook 15 | |
| Cinebench R20 / CPU (Multi Core) | |
| Média da turma Office (648 - 8840, n=75, últimos 2 anos) | |
| Média AMD Ryzen 7 4700U (2401 - 3095, n=9) | |
| HP ProBook 455 G7-175W8EA | |
| Lenovo ThinkBook 15 | |
| HP 15s-fq1440ng | |
| Lenovo ThinkPad E15 20RD0011GE | |
| Cinebench R15 / CPU Single 64Bit | |
| Média da turma Office (99.5 - 316, n=77, últimos 2 anos) | |
| HP ProBook 455 G7-175W8EA | |
| Média AMD Ryzen 7 4700U (176 - 185, n=11) | |
| HP 15s-fq1440ng | |
| Lenovo ThinkPad E15 20RD0011GE | |
| Lenovo ThinkBook 15 | |
| Dell Latitude 5590 | |
| HP ProBook 455R G6 | |
| Cinebench R15 / CPU Multi 64Bit | |
| Média da turma Office (250 - 3380, n=77, últimos 2 anos) | |
| Média AMD Ryzen 7 4700U (801 - 1253, n=12) | |
| HP ProBook 455 G7-175W8EA | |
| Dell Latitude 5590 | |
| Lenovo ThinkBook 15 | |
| HP ProBook 455R G6 | |
| HP 15s-fq1440ng | |
| Lenovo ThinkPad E15 20RD0011GE | |
| Blender / v2.79 BMW27 CPU | |
| HP 15s-fq1440ng | |
| Lenovo ThinkPad E15 20RD0011GE | |
| Lenovo ThinkBook 15 | |
| HP ProBook 455 G7-175W8EA | |
| Média AMD Ryzen 7 4700U (407 - 537, n=8) | |
| Média da turma Office (158 - 1940, n=76, últimos 2 anos) | |
| 7-Zip 18.03 / 7z b 4 -mmt1 | |
| Média da turma Office (3387 - 6469, n=77, últimos 2 anos) | |
| Lenovo ThinkPad E15 20RD0011GE | |
| HP 15s-fq1440ng | |
| Média AMD Ryzen 7 4700U (4208 - 4470, n=8) | |
| HP ProBook 455 G7-175W8EA | |
| Lenovo ThinkBook 15 | |
| 7-Zip 18.03 / 7z b 4 | |
| Média da turma Office (7098 - 76886, n=77, últimos 2 anos) | |
| Média AMD Ryzen 7 4700U (26652 - 33890, n=8) | |
| HP ProBook 455 G7-175W8EA | |
| Lenovo ThinkBook 15 | |
| Lenovo ThinkPad E15 20RD0011GE | |
| HP 15s-fq1440ng | |
| Geekbench 5.5 / Single-Core | |
| Média da turma Office (811 - 2175, n=73, últimos 2 anos) | |
| HP 15s-fq1440ng | |
| Lenovo ThinkPad E15 20RD0011GE | |
| Média AMD Ryzen 7 4700U (1101 - 1168, n=8) | |
| HP ProBook 455 G7-175W8EA | |
| Geekbench 5.5 / Multi-Core | |
| Média da turma Office (1483 - 16999, n=73, últimos 2 anos) | |
| Média AMD Ryzen 7 4700U (4792 - 6502, n=8) | |
| HP ProBook 455 G7-175W8EA | |
| HP 15s-fq1440ng | |
| Lenovo ThinkPad E15 20RD0011GE | |
| HWBOT x265 Benchmark v2.2 / 4k Preset | |
| Média da turma Office (2.21 - 26, n=76, últimos 2 anos) | |
| Média AMD Ryzen 7 4700U (6.79 - 10.1, n=8) | |
| HP ProBook 455 G7-175W8EA | |
| Lenovo ThinkBook 15 | |
| Lenovo ThinkPad E15 20RD0011GE | |
| HP 15s-fq1440ng | |
| LibreOffice / 20 Documents To PDF | |
| HP ProBook 455 G7-175W8EA | |
| Média AMD Ryzen 7 4700U (55.5 - 115.7, n=8) | |
| Média da turma Office (39.9 - 102.3, n=76, últimos 2 anos) | |
| HP 15s-fq1440ng | |
| R Benchmark 2.5 / Overall mean | |
| HP 15s-fq1440ng | |
| Lenovo ThinkPad E15 20RD0011GE | |
| HP ProBook 455 G7-175W8EA | |
| Média AMD Ryzen 7 4700U (0.598 - 0.651, n=8) | |
| Média da turma Office (0.393 - 0.888, n=76, últimos 2 anos) | |
* ... menor é melhor
| PCMark 8 | |
| Home Score Accelerated v2 | |
| Média da turma Office (n=1últimos 2 anos) | |
| Lenovo ThinkBook 15 | |
| Média AMD Ryzen 7 4700U, AMD Radeon RX Vega 7 (4015 - 4402, n=6) | |
| Lenovo ThinkPad E15 20RD0011GE | |
| HP ProBook 455 G7-175W8EA | |
| Dell Latitude 5590 | |
| HP 15s-fq1440ng | |
| HP ProBook 455R G6 | |
| Work Score Accelerated v2 | |
| Média da turma Office (n=1últimos 2 anos) | |
| Lenovo ThinkPad E15 20RD0011GE | |
| Lenovo ThinkBook 15 | |
| HP ProBook 455 G7-175W8EA | |
| Média AMD Ryzen 7 4700U, AMD Radeon RX Vega 7 (3010 - 5361, n=5) | |
| Dell Latitude 5590 | |
| HP ProBook 455R G6 | |
| HP 15s-fq1440ng | |
| PCMark 8 Home Score Accelerated v2 | 4015 pontos | |
| PCMark 8 Creative Score Accelerated v2 | 5215 pontos | |
| PCMark 8 Work Score Accelerated v2 | 5101 pontos | |
| PCMark 10 Score | 4527 pontos | |
Ajuda | ||
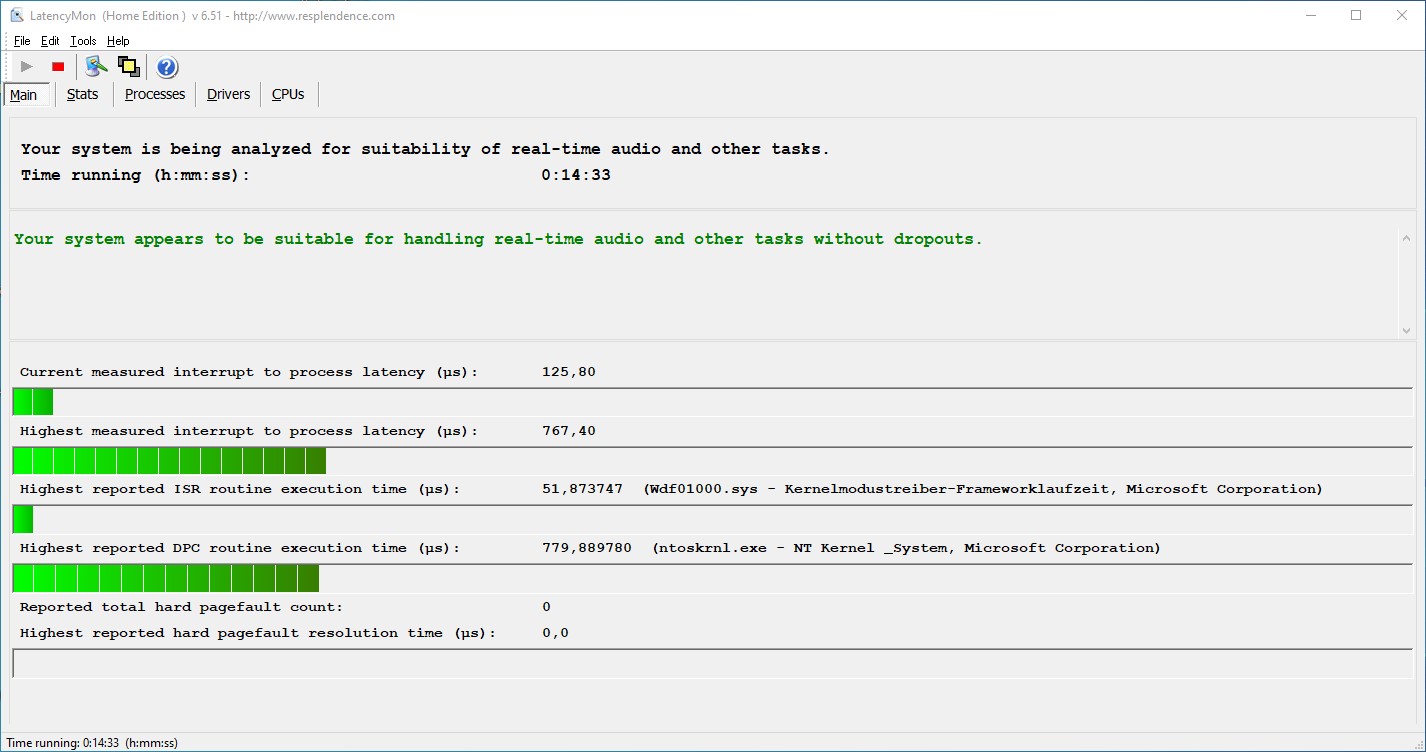
| DPC Latencies / LatencyMon - interrupt to process latency (max), Web, Youtube, Prime95 | |
| HP ProBook 455 G7-175W8EA | |
| HP 15s-fq1440ng | |
* ... menor é melhor
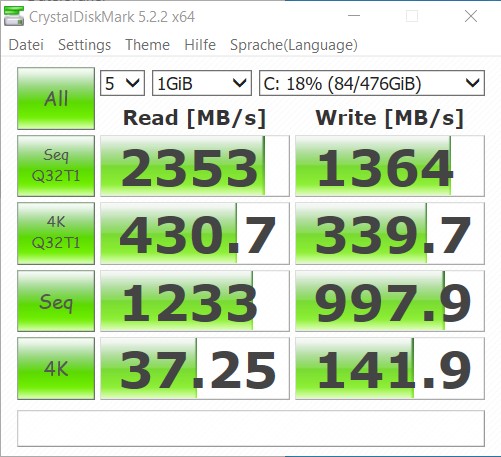
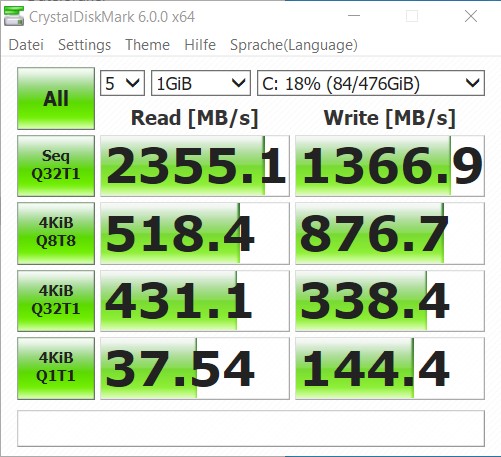
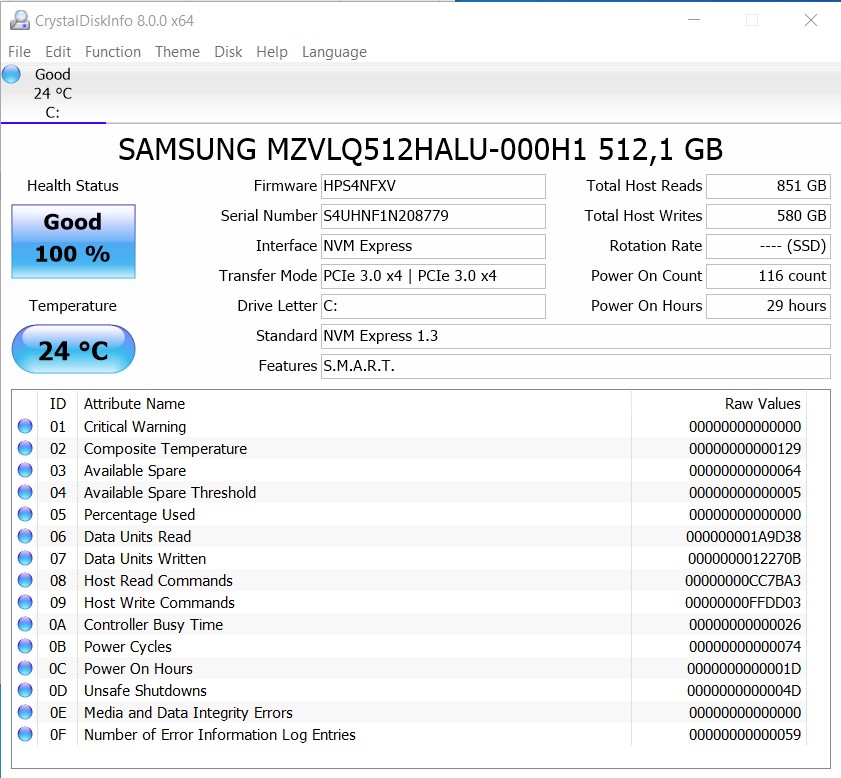
| HP ProBook 455 G7-175W8EA Samsung PM991 MZVLQ512HALU | HP ProBook 455R G6 SK hynix BC501 HFM256GDHTNG | HP 15s-fq1440ng Samsung PM991 MZVLQ512HALU | Lenovo ThinkPad E15 20RD0011GE Samsung PM991 MZALQ512HALU | Lenovo ThinkBook 15 Samsung SSD PM981 MZVLB512HAJQ | Dell Latitude 5590 SK hynix SC311 M.2 | Média Samsung PM991 MZVLQ512HALU | |
|---|---|---|---|---|---|---|---|
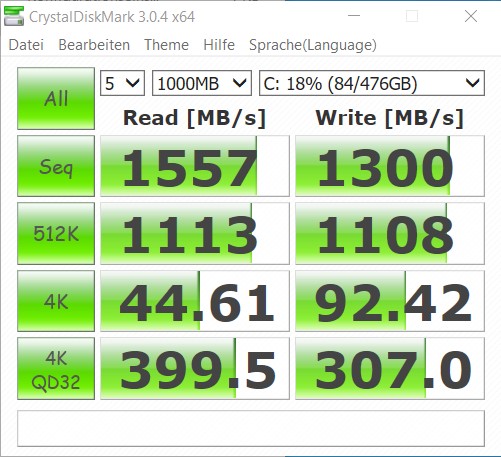
| CrystalDiskMark 5.2 / 6 | -18% | 2% | 17% | 58% | -47% | 18% | |
| Write 4K (MB/s) | 141.9 | 126.4 -11% | 156.2 10% | 144.4 2% | 176.3 24% | 76.7 -46% | 131.8 ? -7% |
| Read 4K (MB/s) | 37.25 | 40.45 9% | 40.32 8% | 52.3 40% | 48.98 31% | 28.41 -24% | 44.9 ? 21% |
| Write Seq (MB/s) | 998 | 702 -30% | 824 -17% | 946 -5% | 1789 79% | 436.7 -56% | 1162 ? 16% |
| Read Seq (MB/s) | 1233 | 1129 -8% | 1044 -15% | 1608 30% | 1671 36% | 508 -59% | 1473 ? 19% |
| Write 4K Q32T1 (MB/s) | 338.4 | 298.6 -12% | 437.2 29% | 592 75% | 433.5 28% | 288.1 -15% | 399 ? 18% |
| Read 4K Q32T1 (MB/s) | 431.1 | 344 -20% | 461.6 7% | 397.7 -8% | 526 22% | 271.9 -37% | 426 ? -1% |
| Write Seq Q32T1 (MB/s) | 1367 | 801 -41% | 1267 -7% | 1364 0% | 2983 118% | 503 -63% | 1348 ? -1% |
| Read Seq Q32T1 (MB/s) | 2355 | 1723 -27% | 2343 -1% | 2301 -2% | 3555 51% | 549 -77% | 2398 ? 2% |
| Write 4K Q8T8 (MB/s) | 877 | 1688 92% | 1040 ? 19% | ||||
| Read 4K Q8T8 (MB/s) | 518 | 1036 100% | 985 ? 90% | ||||
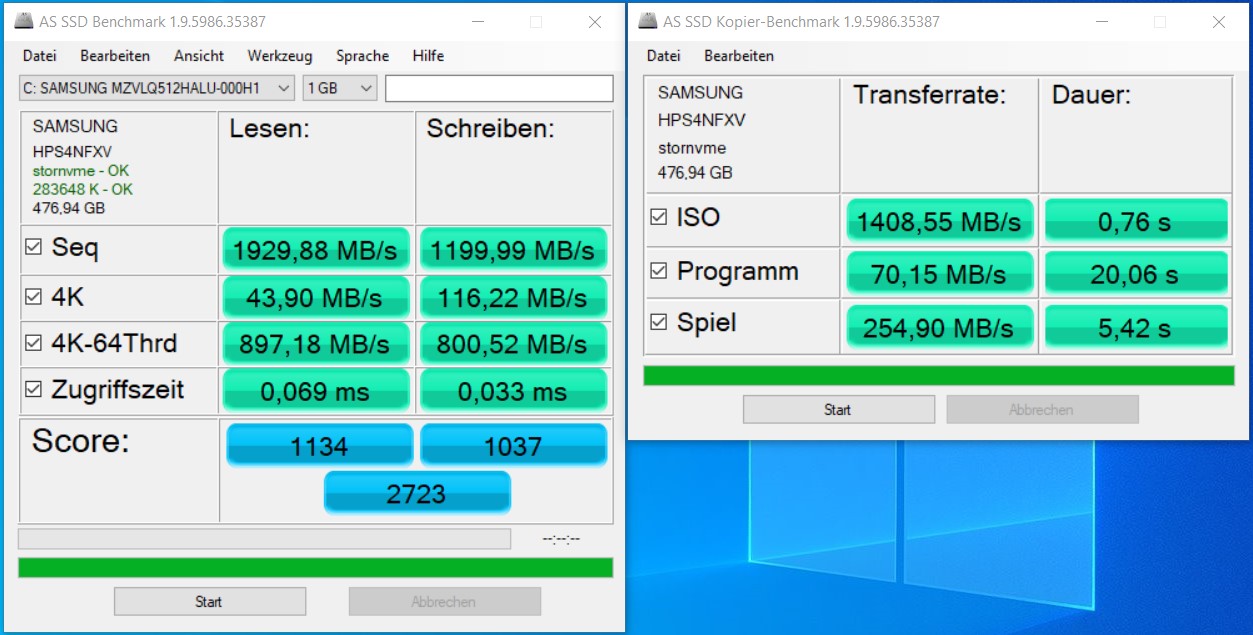
| AS SSD | -31% | 46% | 68% | 114% | -40% | 49% | |
| Seq Read (MB/s) | 1929 | 1503 -22% | 1925 0% | 1918 -1% | 2564 33% | 503 -74% | 1921 ? 0% |
| Seq Write (MB/s) | 1199 | 712 -41% | 1207 1% | 802 -33% | 2268 89% | 393 -67% | 1128 ? -6% |
| 4K Read (MB/s) | 43.9 | 36.63 -17% | 50.9 16% | 49.89 14% | 57 30% | 29.03 -34% | 47.6 ? 8% |
| 4K Write (MB/s) | 116.2 | 89.3 -23% | 144.7 25% | 151.7 31% | 141.4 22% | 73.5 -37% | 137.9 ? 19% |
| 4K-64 Read (MB/s) | 897 | 524 -42% | 886 -1% | 830 -7% | 1175 31% | 306 -66% | 878 ? -2% |
| 4K-64 Write (MB/s) | 801 | 334.3 -58% | 811 1% | 736 -8% | 1665 108% | 212.7 -73% | 782 ? -2% |
| Access Time Read * (ms) | 0.069 | 0.057 17% | 0.066 4% | 0.095 -38% | 0.032 54% | 0.111 -61% | 0.09367 ? -36% |
| Access Time Write * (ms) | 0.033 | 0.041 -24% | 0.027 18% | 0.025 24% | 0.025 24% | 0.047 -42% | 0.03708 ? -12% |
| Score Read (Points) | 1134 | 711 -37% | 1130 0% | 1072 -5% | 1488 31% | 385 -66% | 1118 ? -1% |
| Score Write (Points) | 1037 | 495 -52% | 1076 4% | 968 -7% | 2033 96% | 326 -69% | 1033 ? 0% |
| Score Total (Points) | 2723 | 1540 -43% | 2760 1% | 2545 -7% | 4279 57% | 912 -67% | 2694 ? -1% |
| Copy ISO MB/s (MB/s) | 1409 | 1384 -2% | 1287 -9% | 2118 50% | 311.5 -78% | 1347 ? -4% | |
| Copy Program MB/s (MB/s) | 70.2 | 344.8 391% | 529 654% | 495.6 606% | 208.6 197% | 421 ? 500% | |
| Copy Game MB/s (MB/s) | 254.9 | 741 191% | 1113 337% | 1174 361% | 210 -18% | 825 ? 224% | |
| Média Total (Programa/Configurações) | -25% /
-25% | 24% /
30% | 43% /
49% | 86% /
91% | -44% /
-42% | 34% /
36% |
* ... menor é melhor

Dauerleistung Lesen: DiskSpd Read Loop, Queue Depth 8
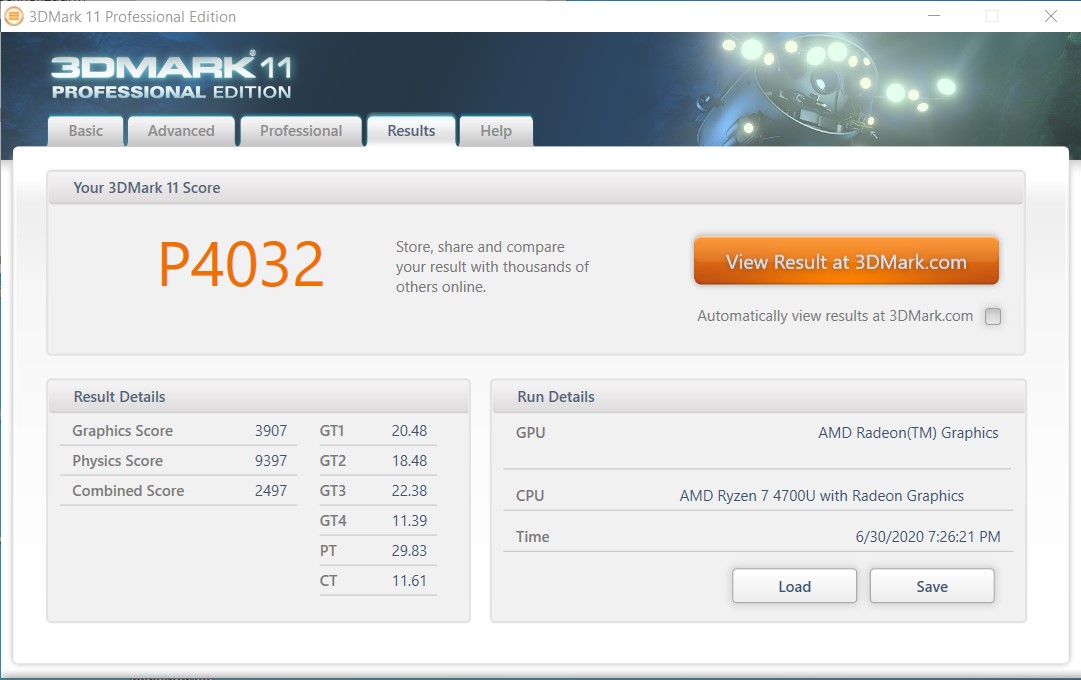
| 3DMark 11 - 1280x720 Performance GPU | |
| Média da turma Office (2551 - 18313, n=72, últimos 2 anos) | |
| Média AMD Radeon RX Vega 7 (3353 - 6249, n=62) | |
| Lenovo ThinkPad E15 20RD0011GE | |
| HP ProBook 455 G7-175W8EA | |
| HP 15s-fq1440ng | |
| HP ProBook 455R G6 | |
| Lenovo ThinkBook 15 | |
| Dell Latitude 5590 | |
| 3DMark | |
| 1280x720 Cloud Gate Standard Graphics | |
| Média da turma Office (11640 - 118515, n=38, últimos 2 anos) | |
| Média AMD Radeon RX Vega 7 (13713 - 31437, n=47) | |
| Lenovo ThinkPad E15 20RD0011GE | |
| HP ProBook 455 G7-175W8EA | |
| HP ProBook 455R G6 | |
| HP 15s-fq1440ng | |
| Lenovo ThinkBook 15 | |
| Dell Latitude 5590 | |
| 1920x1080 Fire Strike Graphics | |
| Média da turma Office (736 - 21871, n=75, últimos 2 anos) | |
| Lenovo ThinkPad E15 20RD0011GE | |
| Média AMD Radeon RX Vega 7 (1772 - 4037, n=66) | |
| HP ProBook 455 G7-175W8EA | |
| HP ProBook 455R G6 | |
| HP 15s-fq1440ng | |
| Lenovo ThinkBook 15 | |
| Dell Latitude 5590 | |
| 2560x1440 Time Spy Graphics | |
| Média da turma Office (493 - 6679, n=70, últimos 2 anos) | |
| Lenovo ThinkPad E15 20RD0011GE | |
| Média AMD Radeon RX Vega 7 (496 - 1249, n=61) | |
| HP ProBook 455 G7-175W8EA | |
| HP 15s-fq1440ng | |
| Lenovo ThinkBook 15 | |
| Dell Latitude 5590 | |
| 3DMark 11 Performance | 4148 pontos | |
| 3DMark Ice Storm Standard Score | 91066 pontos | |
| 3DMark Cloud Gate Standard Score | 13855 pontos | |
| 3DMark Fire Strike Score | 2164 pontos | |
| 3DMark Fire Strike Extreme Score | 999 pontos | |
| 3DMark Time Spy Score | 848 pontos | |
Ajuda | ||
| baixo | média | alto | ultra | |
|---|---|---|---|---|
| BioShock Infinite (2013) | 92 | 63 | 49 | 17 |
| Dota 2 Reborn (2015) | 84.2 | 65 | 35.5 | 33.5 |
| Rise of the Tomb Raider (2016) | 39.9 | 17.7 | 14 | 11.8 |
| X-Plane 11.11 (2018) | 30.9 | 24.4 | 21.9 | |
| Far Cry 5 (2018) | 27 | 13 | 12 | 11 |
| Far Cry New Dawn (2019) | 24 | 13 | 12 | 11 |
Barulho
| Ocioso |
| 30.7 / 30.7 / 30.7 dB |
| Carga |
| 33.9 / 36.8 dB |
 | ||
30 dB silencioso 40 dB(A) audível 50 dB(A) ruidosamente alto |
||
min: | ||
(+) A temperatura máxima no lado superior é 35.3 °C / 96 F, em comparação com a média de 34.3 °C / 94 F , variando de 21.2 a 62.5 °C para a classe Office.
(+) A parte inferior aquece até um máximo de 37.7 °C / 100 F, em comparação com a média de 36.8 °C / 98 F
(+) Em uso inativo, a temperatura média para o lado superior é 25.1 °C / 77 F, em comparação com a média do dispositivo de 29.5 °C / ### class_avg_f### F.
(+) Os apoios para as mãos e o touchpad são mais frios que a temperatura da pele, com um máximo de 29.4 °C / 84.9 F e, portanto, são frios ao toque.
(±) A temperatura média da área do apoio para as mãos de dispositivos semelhantes foi 27.5 °C / 81.5 F (-1.9 °C / -3.4 F).
| HP ProBook 455 G7-175W8EA Vega 7, R7 4700U, Samsung PM991 MZVLQ512HALU | HP ProBook 455R G6 Vega 8, R5 3500U, SK hynix BC501 HFM256GDHTNG | HP 15s-fq1440ng Iris Plus Graphics G7 (Ice Lake 64 EU), i7-1065G7, Samsung PM991 MZVLQ512HALU | Lenovo ThinkPad E15 20RD0011GE Radeon RX 640, i7-10510U, Samsung PM991 MZALQ512HALU | Lenovo ThinkBook 15 UHD Graphics 620, i5-10210U, Samsung SSD PM981 MZVLB512HAJQ | Dell Latitude 5590 UHD Graphics 620, i5-8250U, SK hynix SC311 M.2 | |
|---|---|---|---|---|---|---|
| Heat | -12% | -10% | -24% | -2% | -1% | |
| Maximum Upper Side * (°C) | 35.3 | 40.1 -14% | 38.6 -9% | 46.1 -31% | 38 -8% | 36.6 -4% |
| Maximum Bottom * (°C) | 37.7 | 43.3 -15% | 40.2 -7% | 67.8 -80% | 43.9 -16% | 47.5 -26% |
| Idle Upper Side * (°C) | 26.2 | 27.9 -6% | 28 -7% | 24.7 6% | 24.5 6% | 23.2 11% |
| Idle Bottom * (°C) | 28 | 31.2 -11% | 33 -18% | 25.4 9% | 25.4 9% | 24.2 14% |
* ... menor é melhor
HP ProBook 455 G7-175W8EA análise de áudio
(-) | alto-falantes não muito altos (###valor### dB)
Graves 100 - 315Hz
(-) | quase nenhum baixo - em média 23% menor que a mediana
(±) | a linearidade dos graves é média (10.9% delta para a frequência anterior)
Médios 400 - 2.000 Hz
(+) | médios equilibrados - apenas 2.5% longe da mediana
(±) | a linearidade dos médios é média (9.7% delta para frequência anterior)
Altos 2 - 16 kHz
(+) | agudos equilibrados - apenas 2.5% longe da mediana
(+) | os máximos são lineares (2.6% delta da frequência anterior)
Geral 100 - 16.000 Hz
(±) | a linearidade do som geral é média (18.7% diferença em relação à mediana)
Comparado com a mesma classe
» 35% de todos os dispositivos testados nesta classe foram melhores, 6% semelhantes, 59% piores
» O melhor teve um delta de 7%, a média foi 21%, o pior foi 53%
Comparado com todos os dispositivos testados
» 43% de todos os dispositivos testados foram melhores, 8% semelhantes, 49% piores
» O melhor teve um delta de 4%, a média foi 23%, o pior foi 134%
Lenovo ThinkPad E15 20RD0011GE análise de áudio
(±) | o volume do alto-falante é médio, mas bom (###valor### dB)
Graves 100 - 315Hz
(-) | quase nenhum baixo - em média 17% menor que a mediana
(±) | a linearidade dos graves é média (14.6% delta para a frequência anterior)
Médios 400 - 2.000 Hz
(±) | médios mais altos - em média 5.9% maior que a mediana
(±) | a linearidade dos médios é média (11% delta para frequência anterior)
Altos 2 - 16 kHz
(+) | agudos equilibrados - apenas 4.1% longe da mediana
(±) | a linearidade dos máximos é média (8.6% delta para frequência anterior)
Geral 100 - 16.000 Hz
(±) | a linearidade do som geral é média (24.6% diferença em relação à mediana)
Comparado com a mesma classe
» 73% de todos os dispositivos testados nesta classe foram melhores, 7% semelhantes, 20% piores
» O melhor teve um delta de 7%, a média foi 21%, o pior foi 53%
Comparado com todos os dispositivos testados
» 75% de todos os dispositivos testados foram melhores, 5% semelhantes, 20% piores
» O melhor teve um delta de 4%, a média foi 23%, o pior foi 134%
| desligado | |
| Ocioso | |
| Carga |
|
Key:
min: | |
| HP ProBook 455 G7-175W8EA R7 4700U, Vega 7, Samsung PM991 MZVLQ512HALU, IPS, 1920x1080, 15.6" | HP ProBook 455R G6 R5 3500U, Vega 8, SK hynix BC501 HFM256GDHTNG, IPS, 1920x1080, 15.6" | HP 15s-fq1440ng i7-1065G7, Iris Plus Graphics G7 (Ice Lake 64 EU), Samsung PM991 MZVLQ512HALU, TN, 1920x1080, 15.6" | Lenovo ThinkPad E15 20RD0011GE i7-10510U, Radeon RX 640, Samsung PM991 MZALQ512HALU, IPS LED, 1920x1080, 15.6" | Lenovo ThinkBook 15 i5-10210U, UHD Graphics 620, Samsung SSD PM981 MZVLB512HAJQ, IPS, 1920x1080, 15.6" | Dell Latitude 5590 i5-8250U, UHD Graphics 620, SK hynix SC311 M.2, IPS, 1920x1080, 15.6" | Média AMD Radeon RX Vega 7 | Média da turma Office | |
|---|---|---|---|---|---|---|---|---|
| Power Consumption | -3% | -18% | -9% | -5% | -9% | -9% | -13% | |
| Idle Minimum * (Watt) | 3.8 | 4.8 -26% | 6.9 -82% | 3.2 16% | 3.5 8% | 3.6 5% | 4.79 ? -26% | 4.26 ? -12% |
| Idle Average * (Watt) | 7.7 | 7.6 1% | 9.2 -19% | 6.8 12% | 7.1 8% | 6.5 16% | 7.72 ? -0% | 7.31 ? 5% |
| Idle Maximum * (Watt) | 10.5 | 10.9 -4% | 9.5 10% | 9.5 10% | 7.8 26% | 7.2 31% | 9.12 ? 13% | 8.55 ? 19% |
| Load Average * (Watt) | 32 | 30.2 6% | 31 3% | 44 -38% | 38.9 -22% | 46.2 -44% | 38.4 ? -20% | 43.8 ? -37% |
| Load Maximum * (Watt) | 45.4 | 42.2 7% | 45.4 -0% | 66.4 -46% | 65.4 -44% | 68.8 -52% | 51.7 ? -14% | 64.5 ? -42% |
* ... menor é melhor

| HP ProBook 455 G7-175W8EA R7 4700U, Vega 7, 45 Wh | HP ProBook 455R G6 R5 3500U, Vega 8, 45 Wh | HP 15s-fq1440ng i7-1065G7, Iris Plus Graphics G7 (Ice Lake 64 EU), 41 Wh | Lenovo ThinkPad E15 20RD0011GE i7-10510U, Radeon RX 640, 45 Wh | Lenovo ThinkBook 15 i5-10210U, UHD Graphics 620, 45 Wh | Dell Latitude 5590 i5-8250U, UHD Graphics 620, 51 Wh | Média da turma Office | |
|---|---|---|---|---|---|---|---|
| Duração da bateria | -15% | -2% | 20% | 5% | 3% | 75% | |
| Reader / Idle (h) | 12.6 | 8.8 -30% | 15.2 21% | 17.9 42% | 17.4 38% | 24.5 ? 94% | |
| H.264 (h) | 6.7 | 6 -10% | 10.4 55% | 7 4% | 6.7 0% | 15.5 ? 131% | |
| WiFi v1.3 (h) | 7.6 | 7.7 1% | 5.3 -30% | 7.5 -1% | 6.8 -11% | 7.4 -3% | 13.2 ? 74% |
| Load (h) | 1.8 | 1.5 -17% | 2 11% | 1.9 6% | 1.5 -17% | 1.4 -22% | 1.808 ? 0% |
Pro
Contra
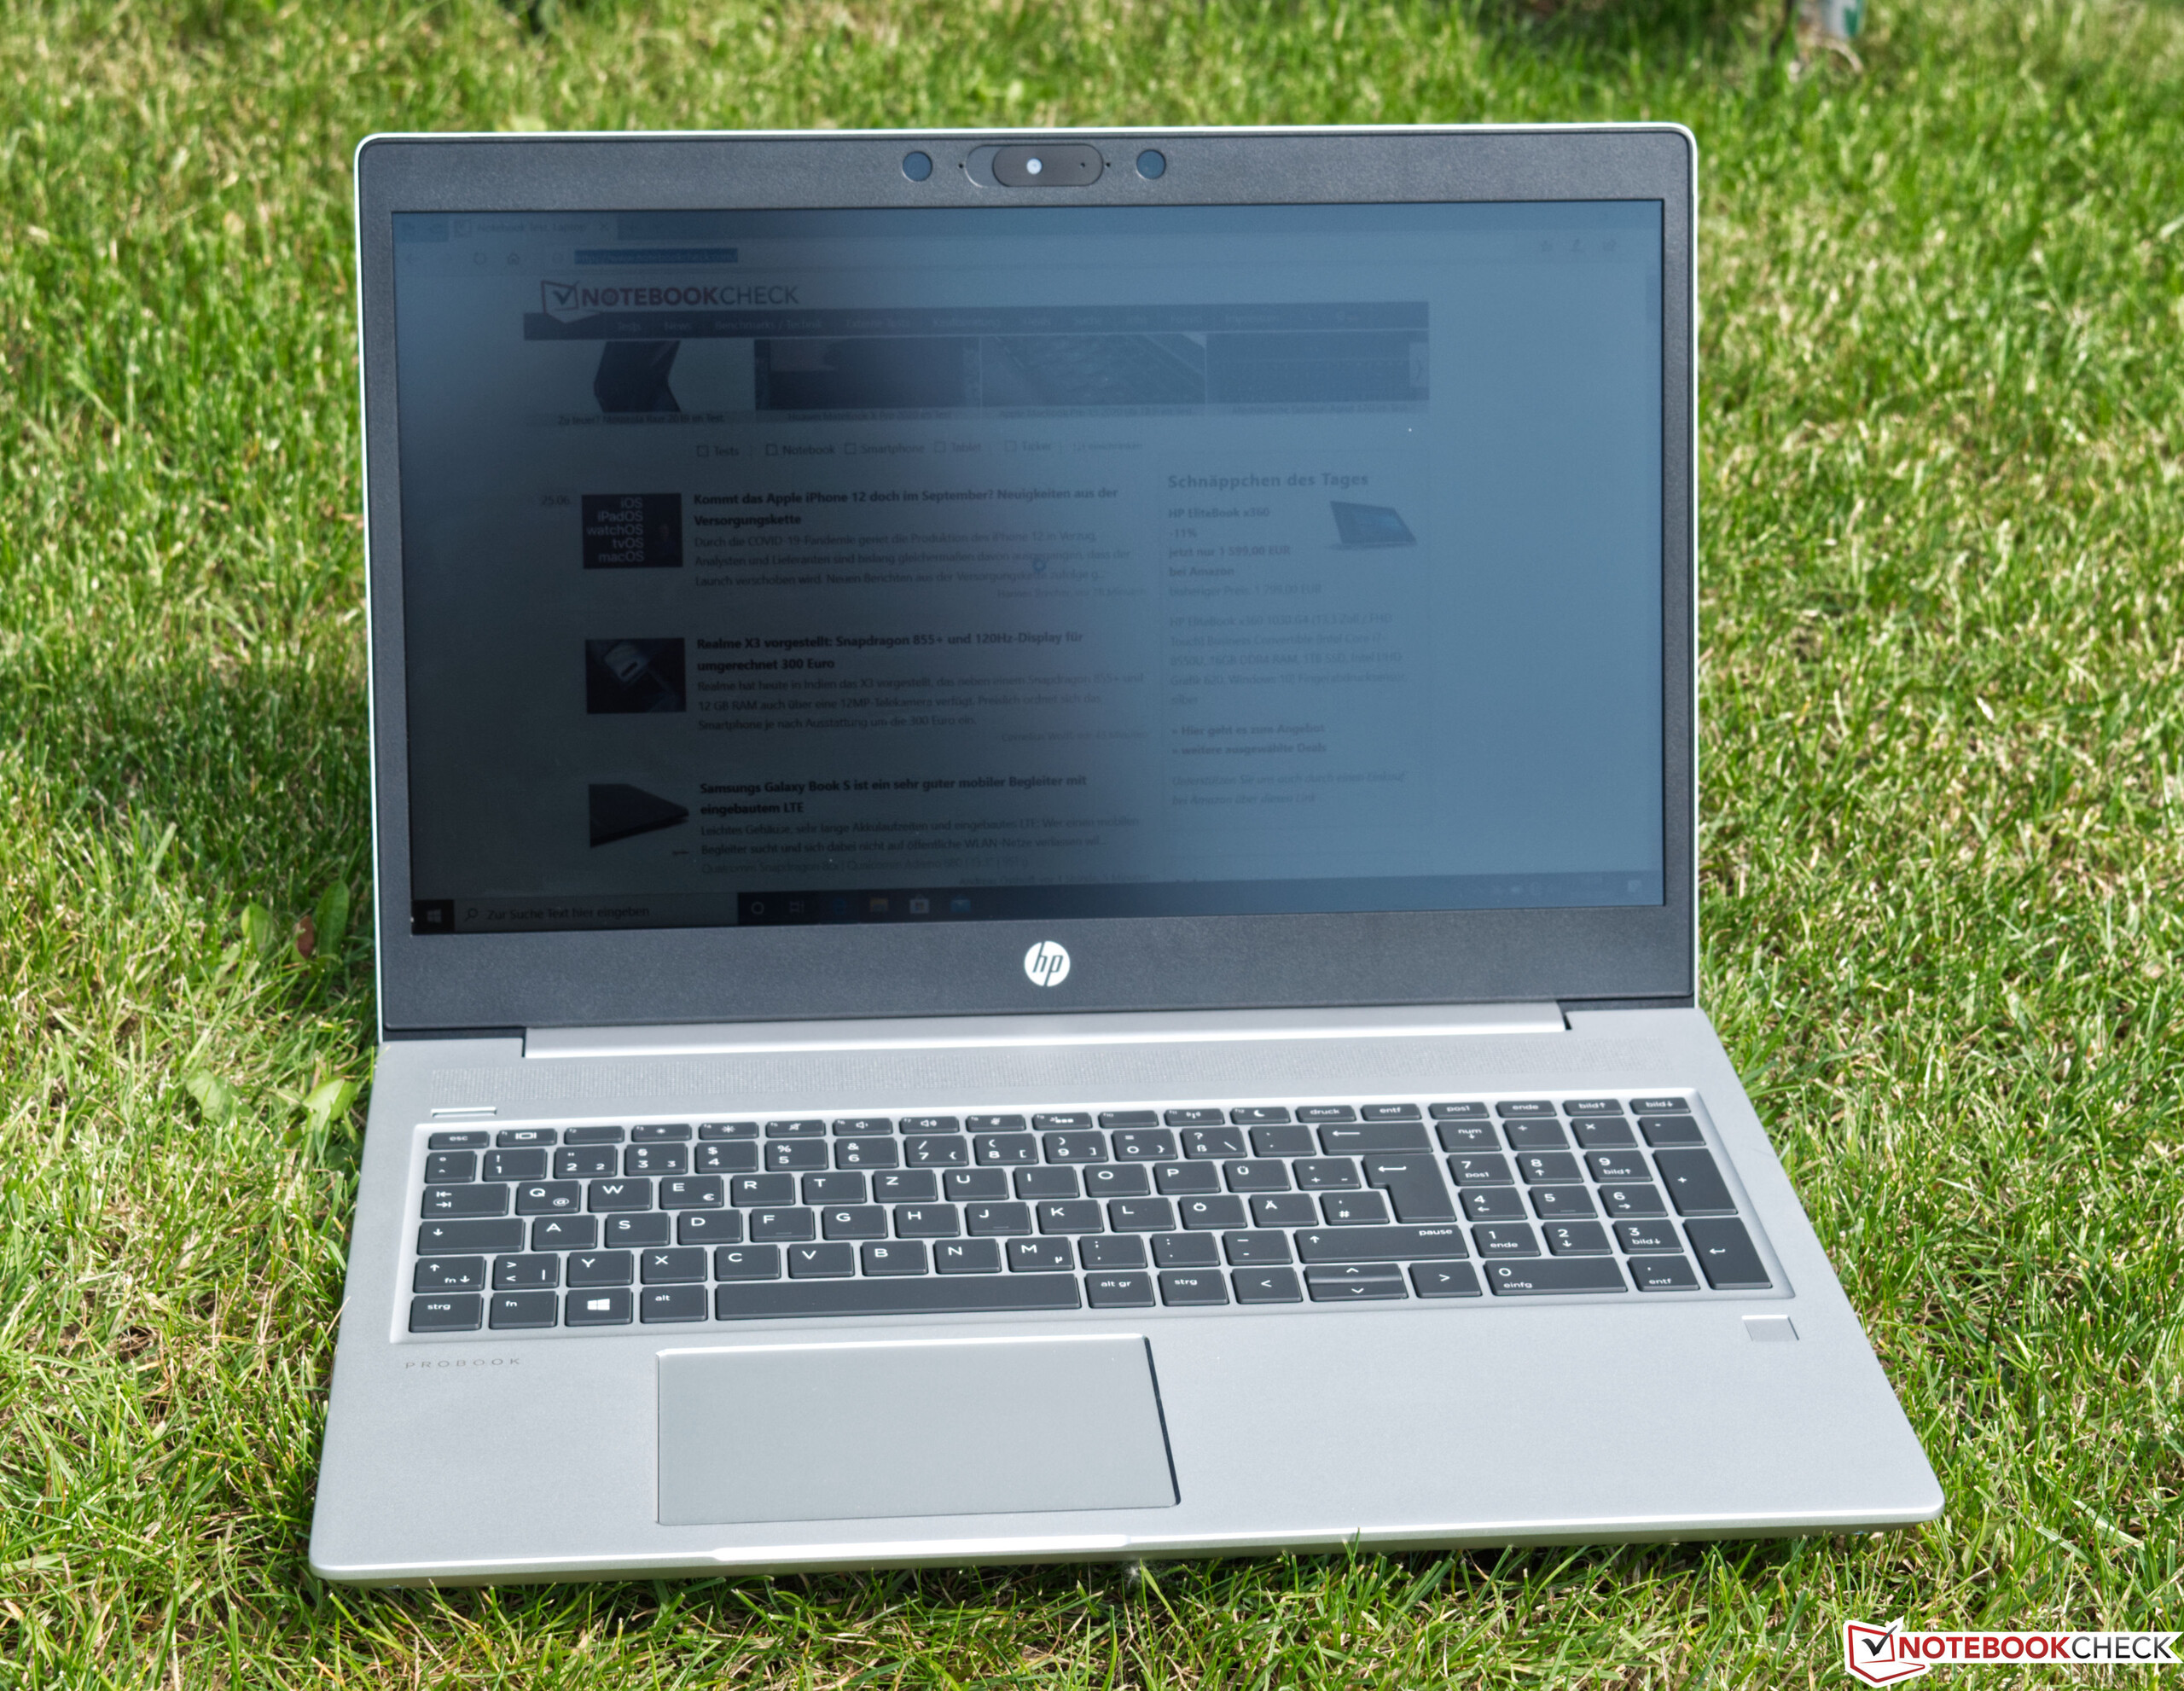
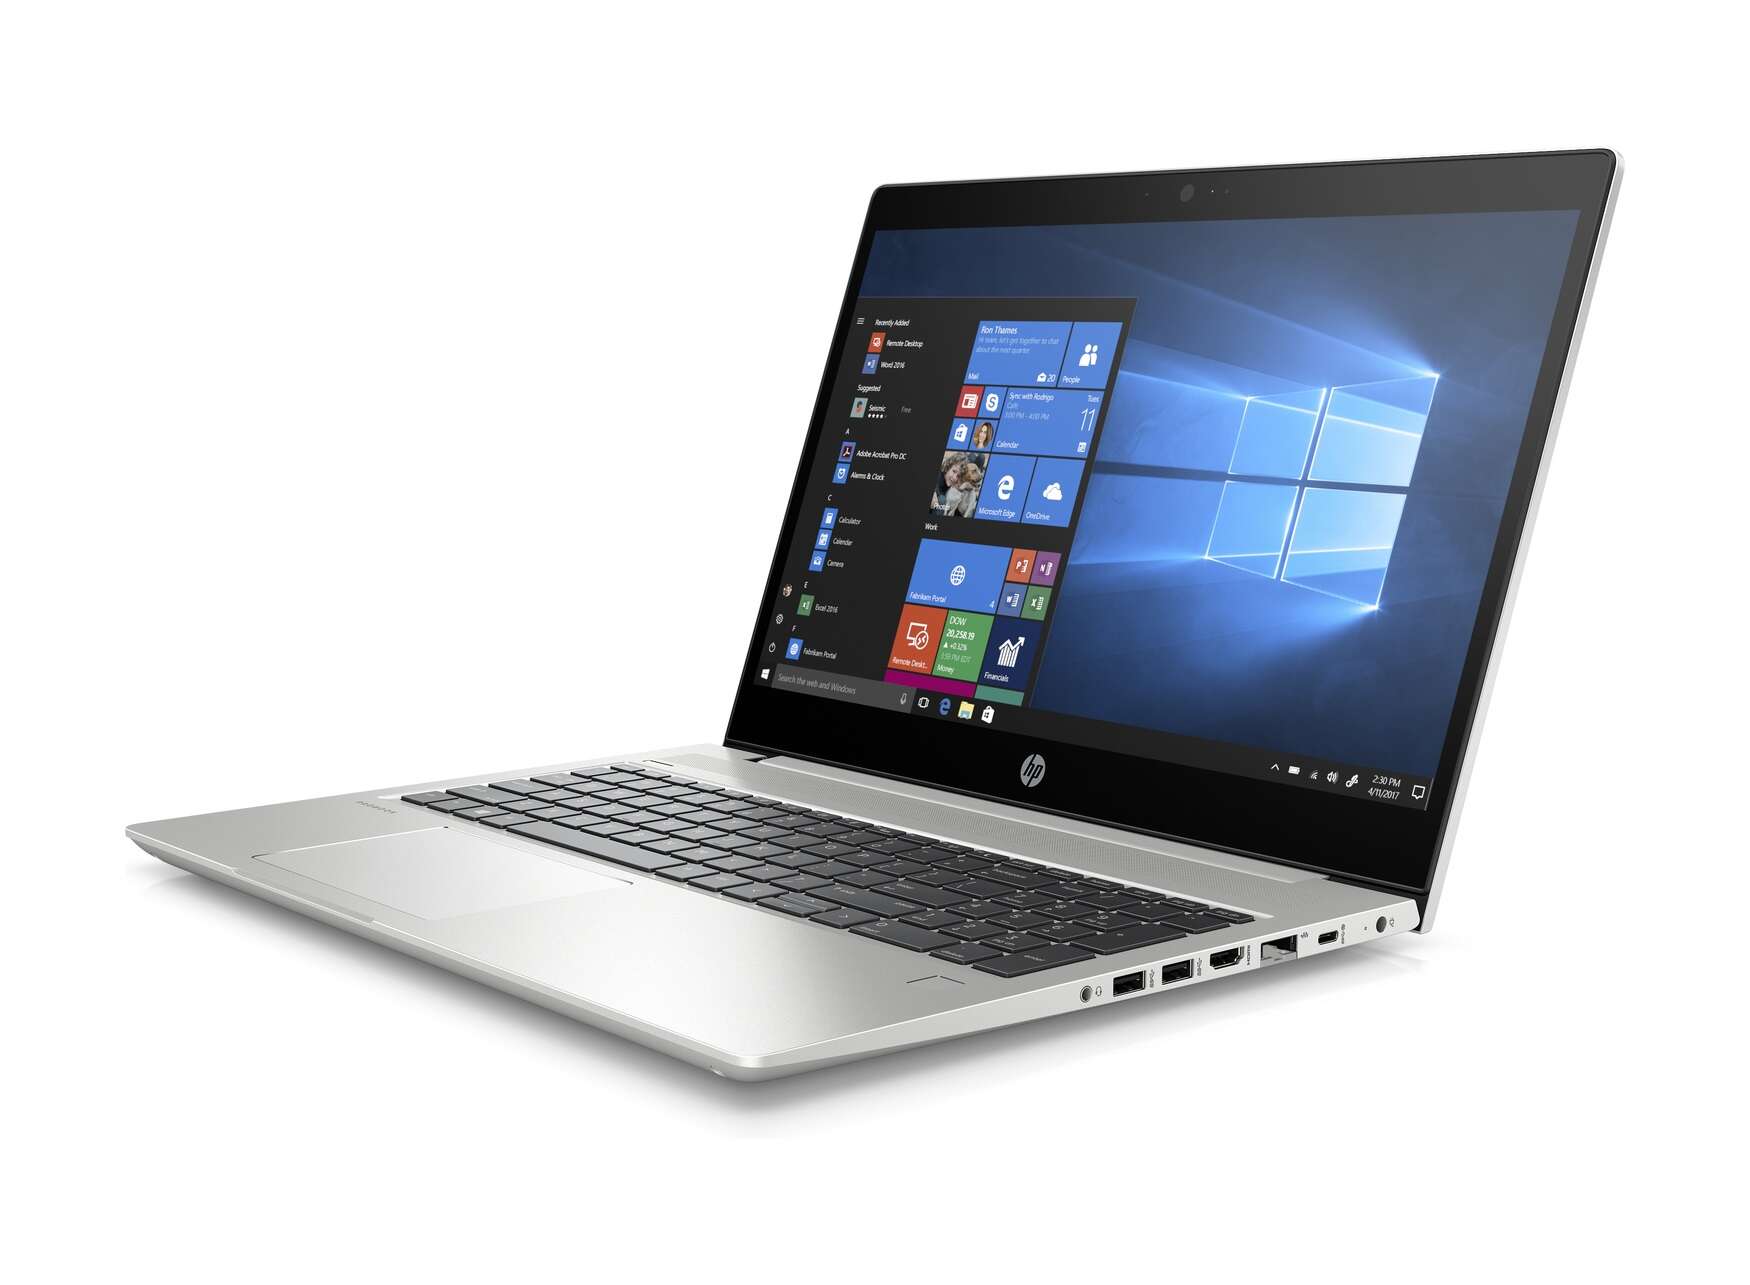
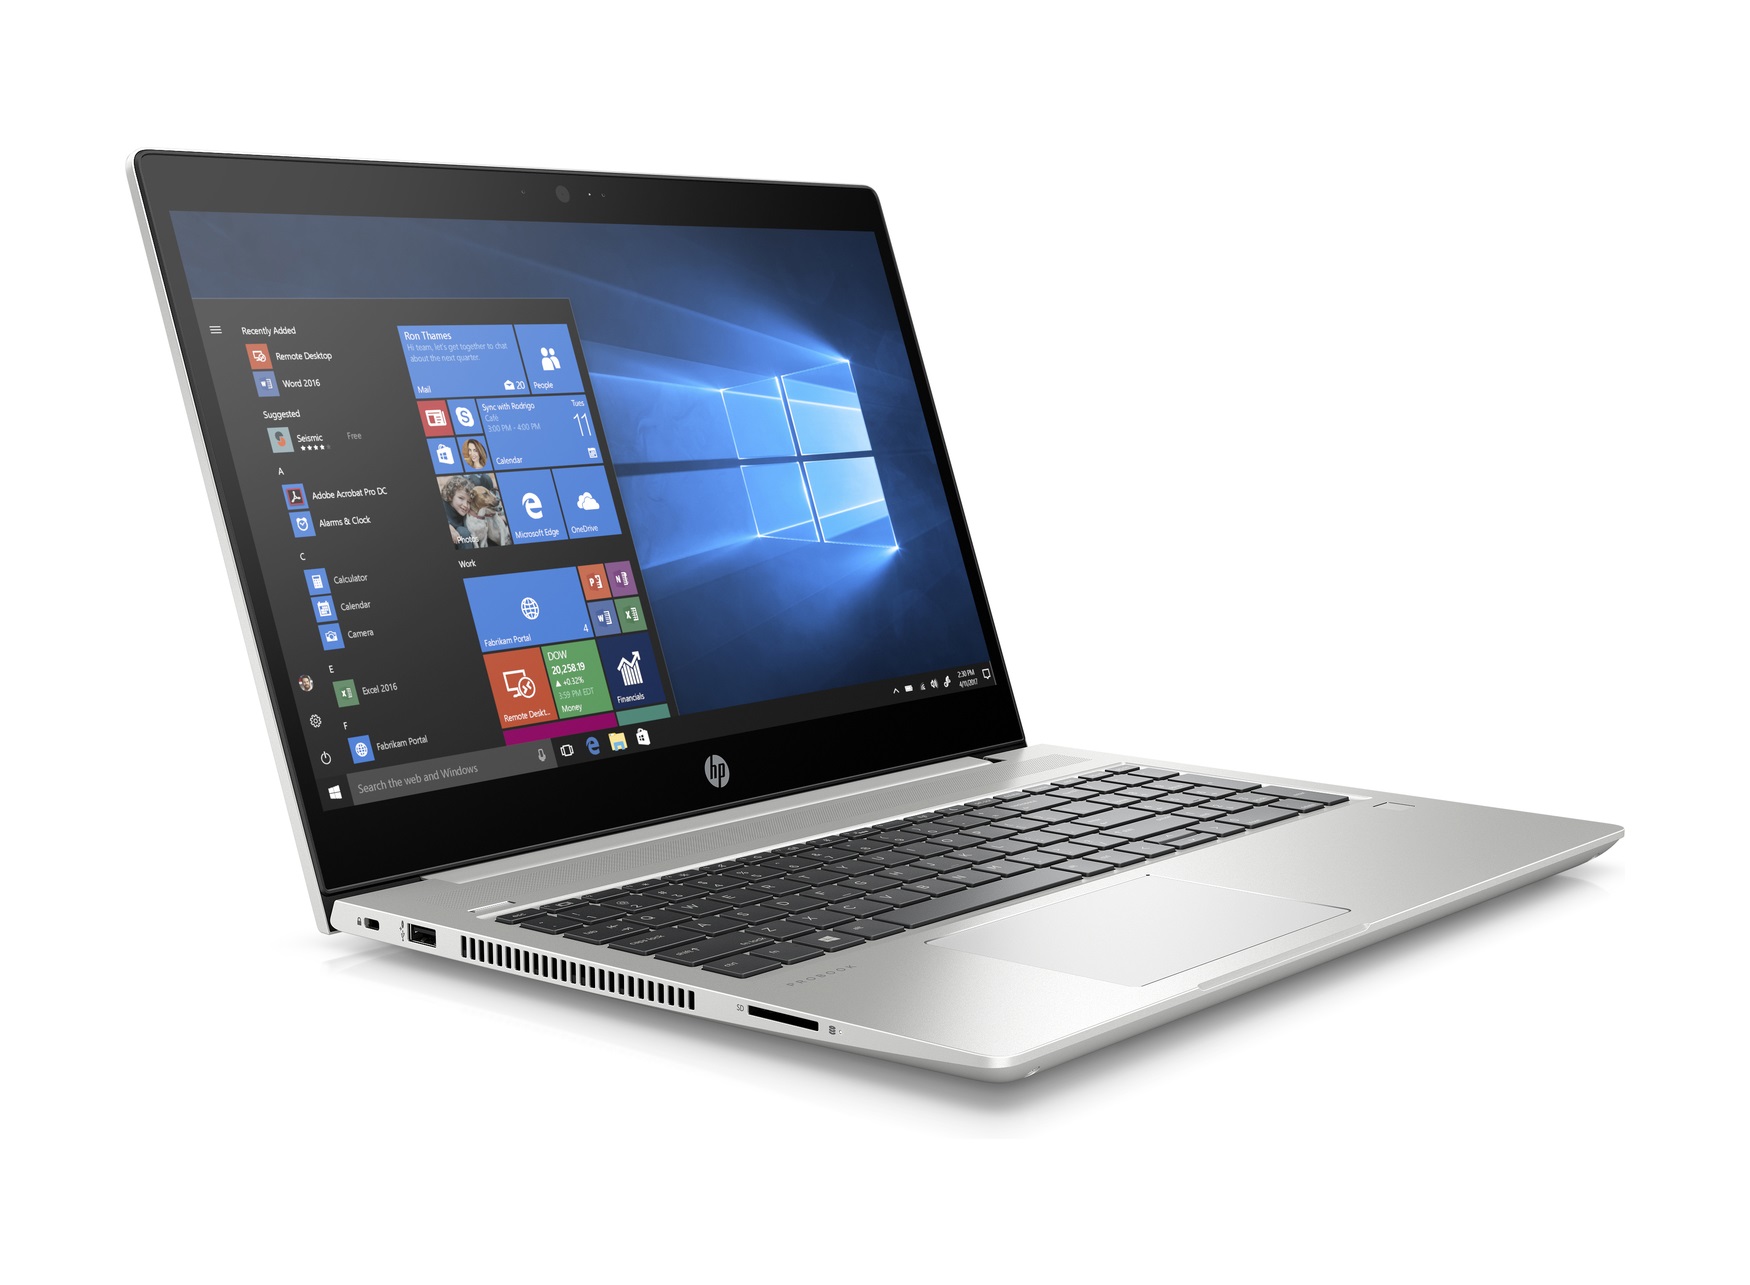
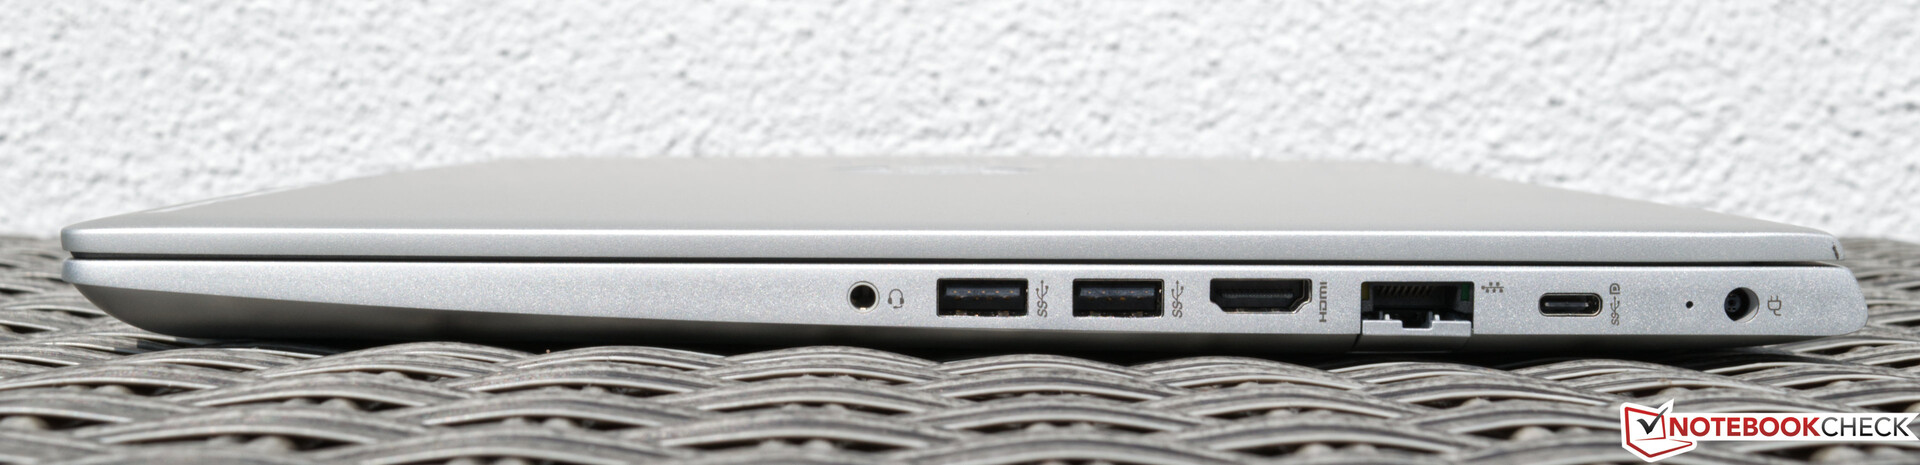
O HP ProBook 455 G7 é um acessível portátil de escritório com bom desempenho graças à nova AMD Ryzen 7 4700U. O dispositivo pode ser comprado por pouco menos de 1.000 Euros (~US$ 1.128), pelos quais os compradores recebem não apenas o SoC veloz, mas também 16 GB de RAM e um SSD de 512 GB. As propriedades da tela mate são convincentes e não há PWM. Dito isto, o nível máximo de brilho poderia ser maior. Quando se trata da seleção de portas, o ProBook mal difere do seu antecessor. Graças ao suporte Wi-Fi 6, os usuários agora se beneficiam de transferências de dados sem fio mais rápidas. O número de portas USB é alto e provavelmente suficiente para a rotina diária de um usuário médio. Embora muitos usuários esperem por um, ainda não existe uma porta Thunderbolt 3 no ProBook 455 G7 e, em qualquer caso, a interface deve se tornar um recurso padrão.
Por outro lado, o sensor de digitais e a câmera infravermelha são ótimos extras que tornam o dispositivo uma oferta mais interessante. Ambos funcionam perfeitamente e simplificam os fluxos de trabalho diários. Graças à AMD Ryzen 7 4700U, o desempenho percorreu um longo caminho em comparação com a geração anterior. Mesmo a CPU quad-core Hyper-Threading da Intel não pode competir com este novo SoC.
A HP continua a tomar boas decisões com sua abordagem do ProBook 455 G7. No entanto, gostaríamos de ver uma bateria um pouco maior e uma porta Thunderbolt 3.
Seu sólido desempenho e preço competitivo fazem o HP ProBook 455 G7 valer a pena considerar. No entanto, a HP pode se esforçar para manter a vantagem quando os concorrentes começarem a enviar seus modelos baseados em AMD.
Além disso, ficamos satisfeitos com a duração da bateria, embora 7 horas em nosso teste de Wi-Fi signifiquem que ele não passará um dia de trabalho completo. Dito isto, os concorrentes também não se saem muito melhor nessa categoria. Os dispositivos de entrada são confiáveis e agradáveis de usar, e a unidade base é robusta, sem falhas em termos de qualidade de construção.
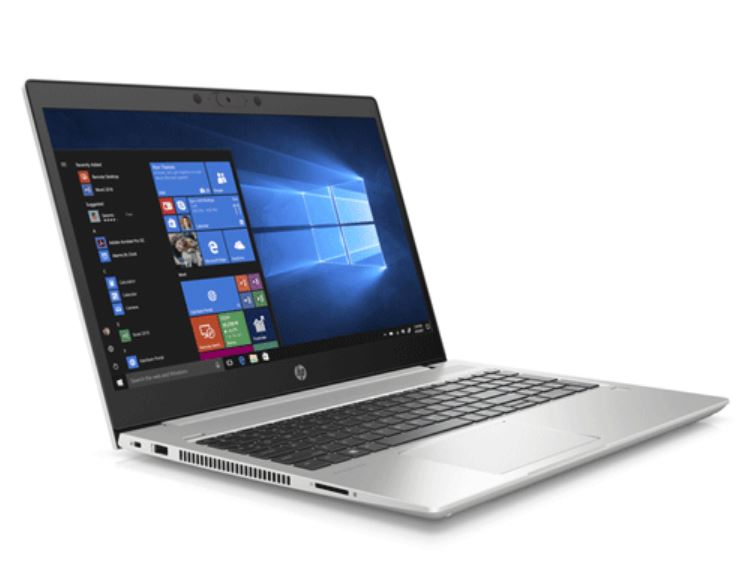
The HP ProBook 455 G7 is an affordable office laptop with good performance thanks to the new AMD Ryzen 7 4700U. The device can be purchased for just under 1,000 Euros (~$1,128), for which buyers receive not only the fast SoC but also 16 GB of RAM and a 512-GB SSD. The properties of the matte display are convincing and there is no PWM. That being said, the maximum brightness level could be higher. When it comes to the port selection, the ProBook barely differs from its predecessor. Thanks to Wi-Fi 6 support, users now benefit from faster wireless data transfers. The number of USB ports is high and more than likely sufficient for an average user's daily routine. Even though many users have been hoping for one, there is still no Thunderbolt 3 port on the ProBook 455 G7, and in any case the interface should eventually become a standard feature.
By contrast, the fingerprint sensor and IR camera are nice extras that make the device a more interesting offer. Both work flawlessly and simplify day-to-day workflows. Thanks to the AMD Ryzen 7 4700U, the performance has come a long way compared to the previous generation. Even Intel's Hyper-Threading quad-core CPU cannot compete with this new SoC.
HP continues to make good decisions with its approach to the ProBook 455 G7. However, we would have liked to see a slightly larger battery and a Thunderbolt 3 port.
Its solid performance and competitive price make the HP ProBook 455 G7 worth considering. However, HP may struggle to keep the upper hand once competitors begin to ship their AMD-based models.
Furthermore, we were pleased with the battery life, although 7 hours in our Wi-Fi test means that it will not make it through a full workday. That being said, competitors do not fare much better in this category, either. The input devices are reliable and pleasant to use, and the base unit is robust with no flaws in terms of the build quality.
HP ProBook 455 G7-175W8EA
- 07/06/2020 v7 (old)
Sebastian Bade
Price comparison
