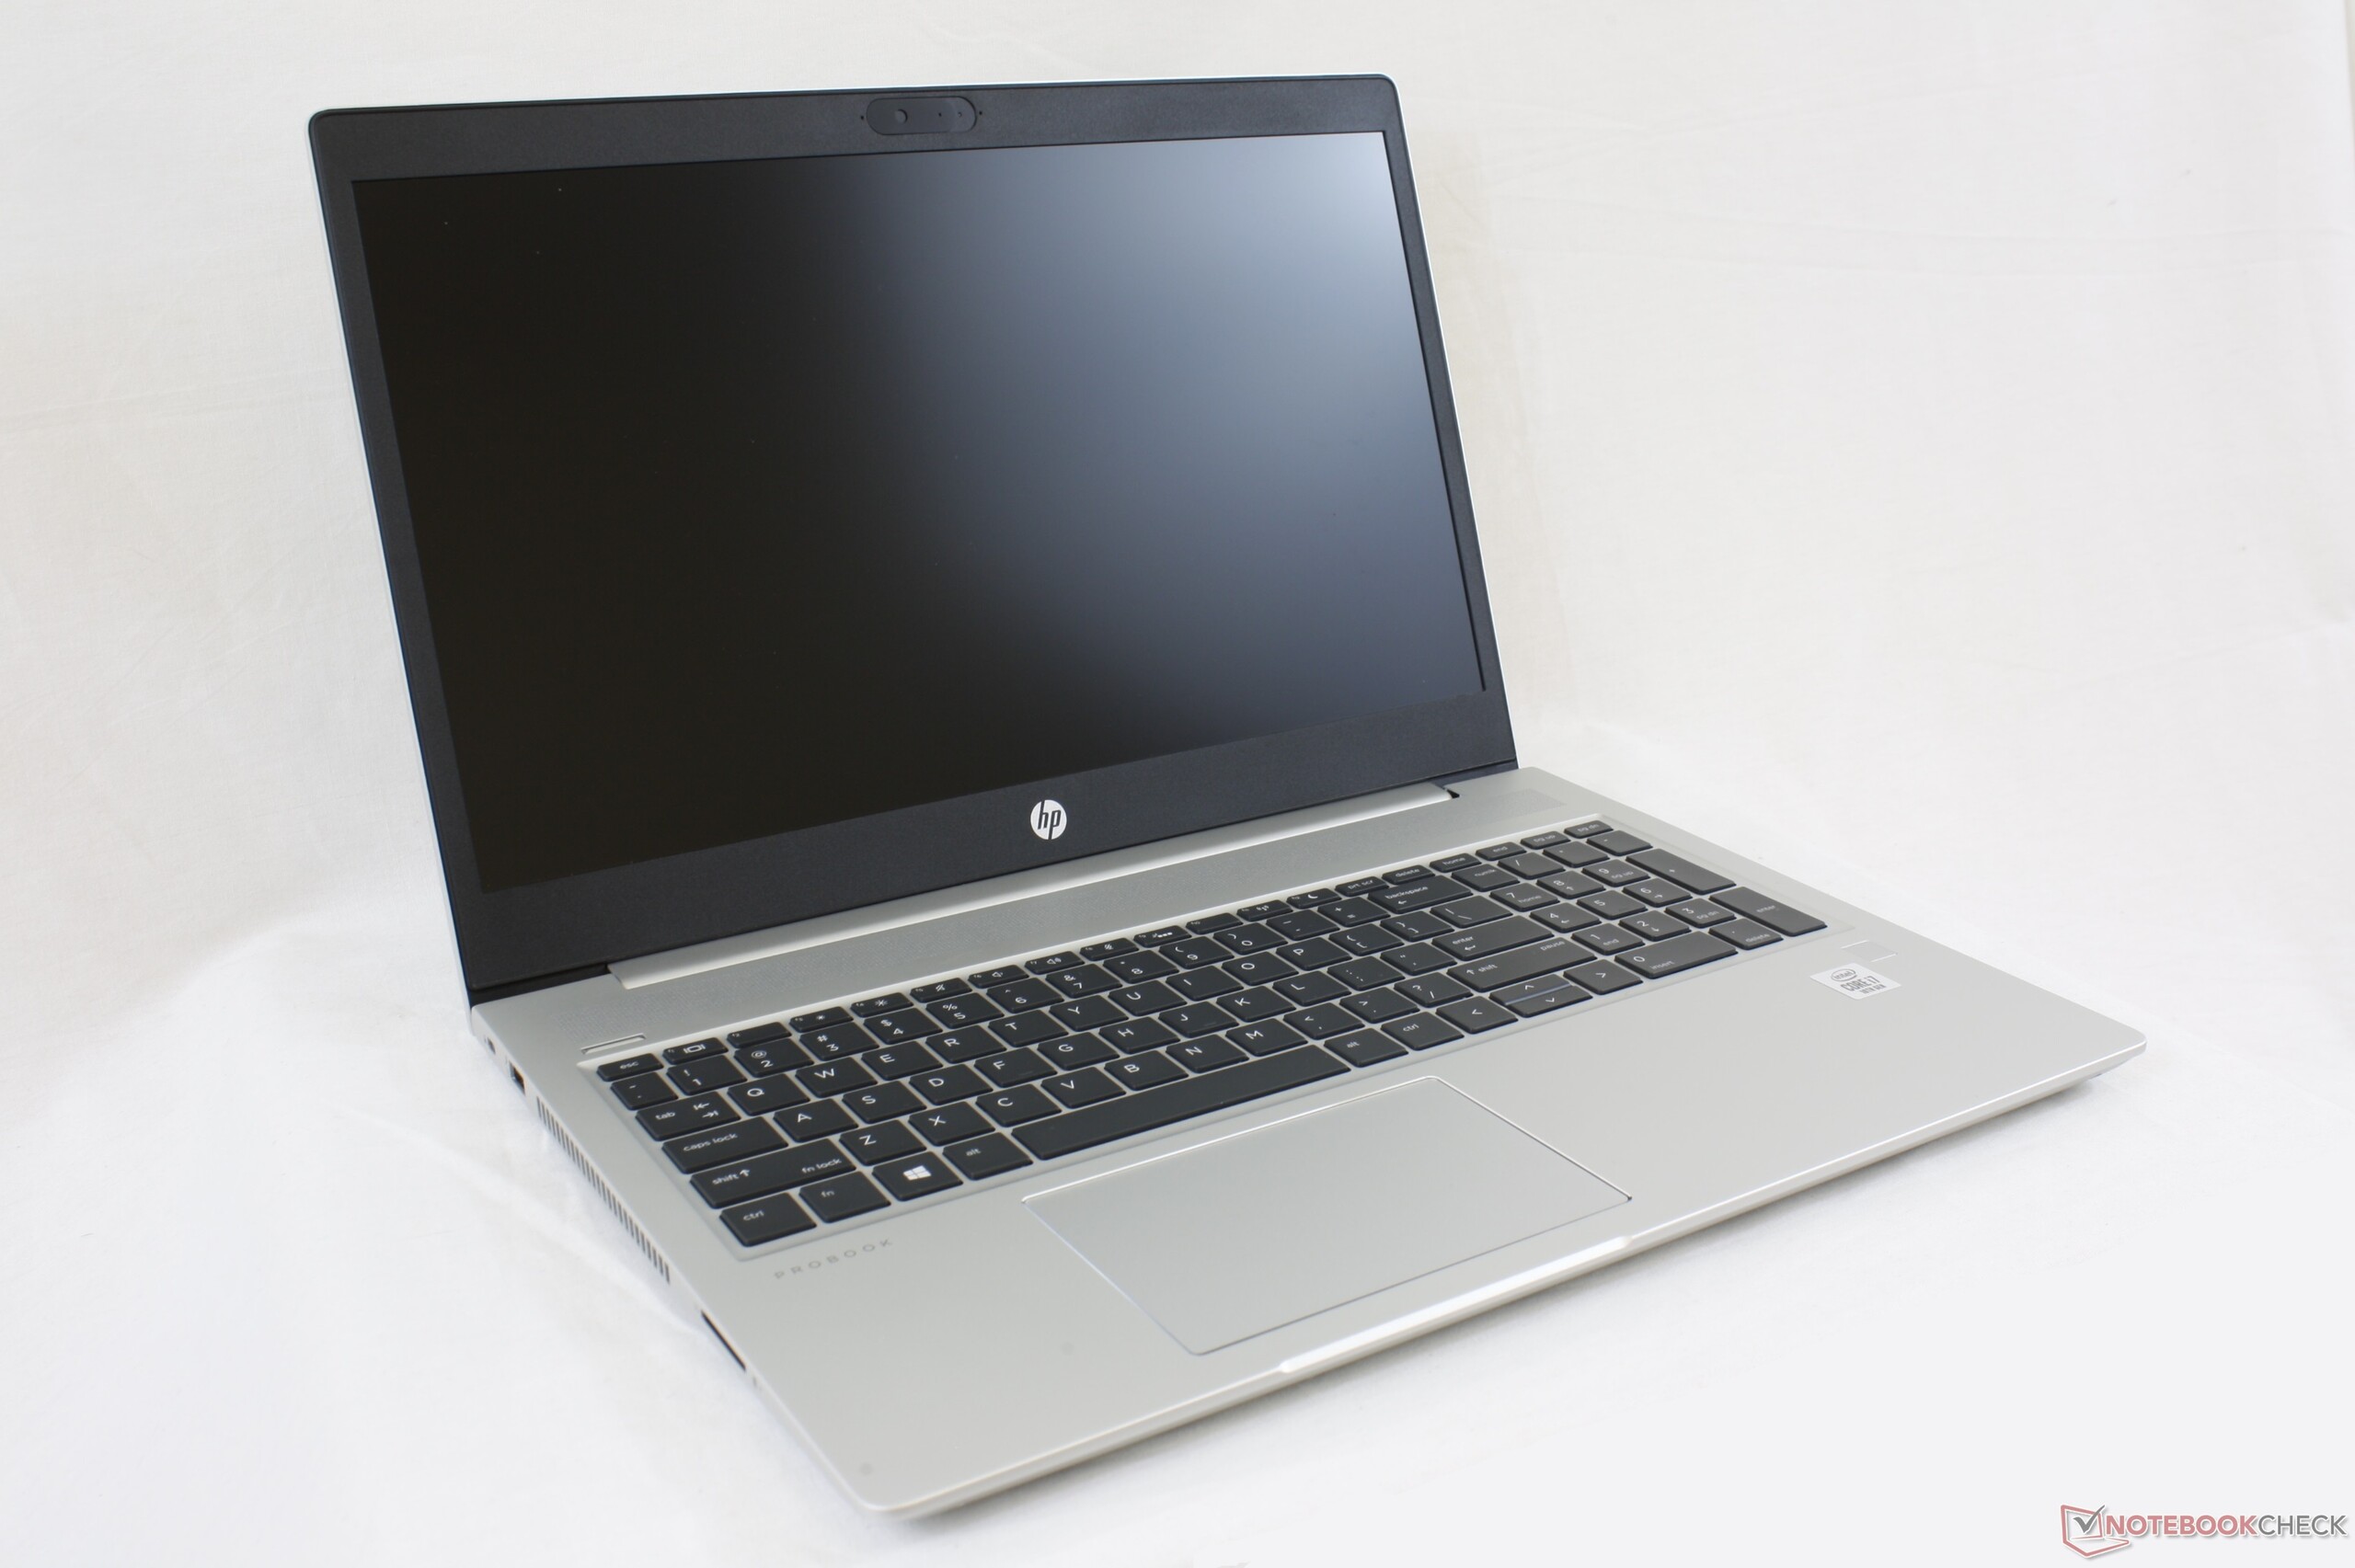
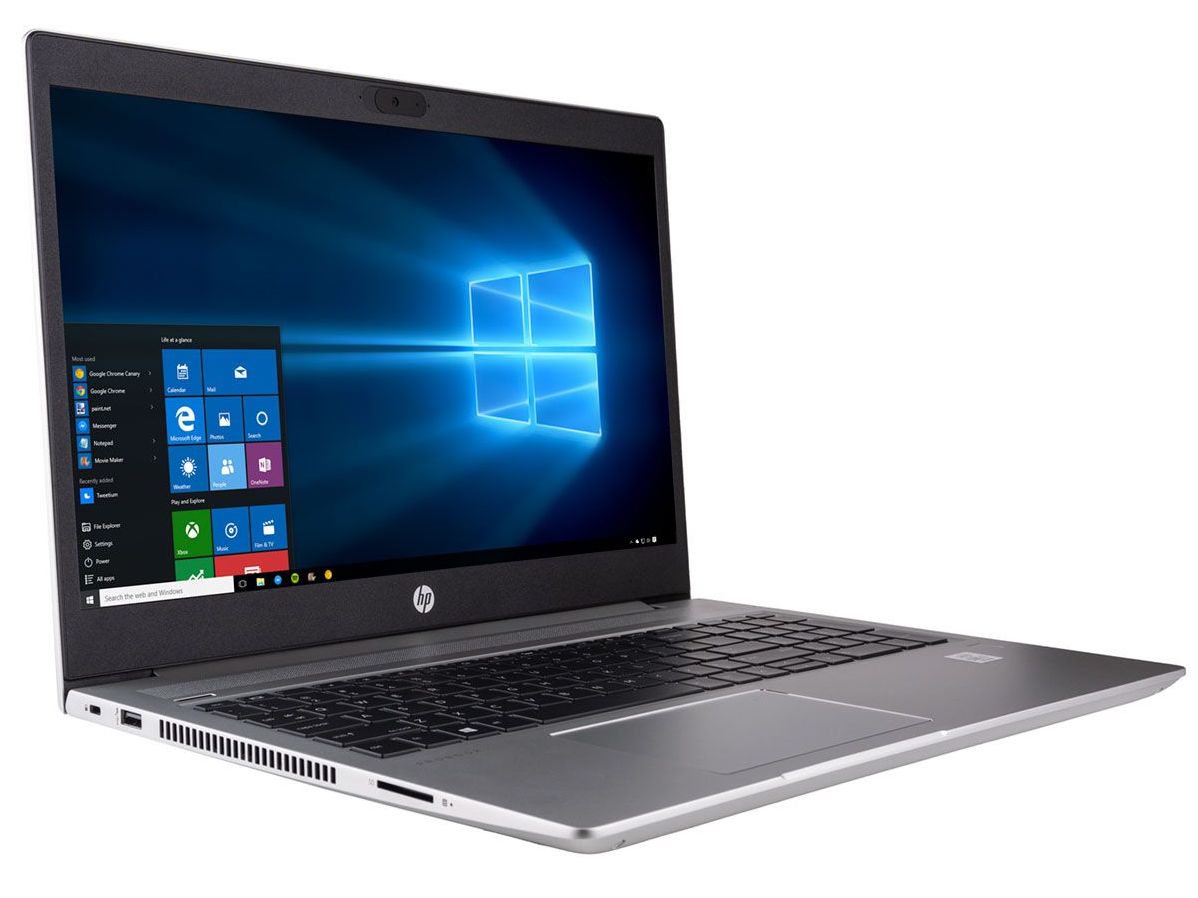
Breve Análise do Portátil HP ProBook 450 G7 Core i7: É melhor que o Ryzen 7 ProBook 455 G7?
Avaliação | Data | Modelo | Peso | Altura | Size | Resolução | Preço |
|---|---|---|---|---|---|---|---|
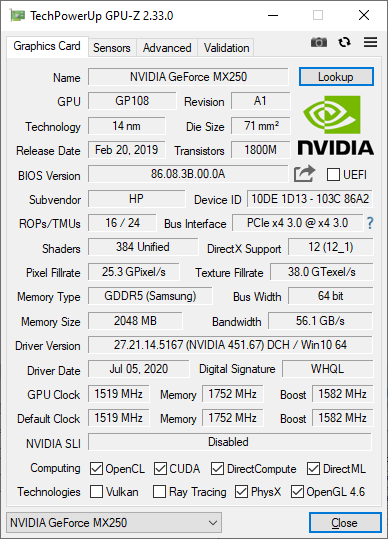
| 81.4 % v7 (old) | 08/2020 | HP ProBook 450 G7 8WC04UT i7-10510U, GeForce MX250 | 1.9 kg | 19 mm | 15.60" | 1920x1080 | |
| 82.6 % v7 (old) | 07/2020 | HP ProBook 455 G7-175W8EA R7 4700U, Vega 7 | 1.8 kg | 19 mm | 15.60" | 1920x1080 | |
| 80.1 % v7 (old) | 02/2020 | MSI Modern 15 A10RB i7-10510U, GeForce MX250 | 1.6 kg | 15.9 mm | 15.60" | 1920x1080 | |
| 79.6 % v6 (old) | Dell Latitude 15 3590 i5-8250U, UHD Graphics 620 | 2.1 kg | 22 mm | 15.60" | 1920x1080 | ||
| 83.2 % v7 (old) | 11/2019 | Lenovo ThinkPad L590-20Q70019GE i5-8265U, UHD Graphics 620 | 2 kg | 23 mm | 15.60" | 1920x1080 | |
| 82.9 % v7 (old) | Dynabook Tecra X50-F i7-8665U, UHD Graphics 620 | 1.4 kg | 17.6 mm | 15.60" | 1920x1080 |
| SD Card Reader | |
| average JPG Copy Test (av. of 3 runs) | |
| HP EliteBook 1050 G1-4QY20EA (Toshiba Exceria Pro SDXC 64 GB UHS-II) | |
| HP ProBook 455 G7-175W8EA (Toshiba Exceria Pro SDXC 64 GB UHS-II) | |
| HP ProBook 450 G7 8WC04UT (Toshiba Exceria Pro SDXC 64 GB UHS-II) | |
| Lenovo ThinkPad L590-20Q70019GE (Toshiba Exceria Pro M501 64 GB UHS-II) | |
| MSI Modern 15 A10RB (Toshiba Exceria Pro M501 UHS-II) | |
| Dell Latitude 15 3590 (Toshiba Exceria Pro SDXC 64 GB UHS-II) | |
| maximum AS SSD Seq Read Test (1GB) | |
| HP EliteBook 1050 G1-4QY20EA (Toshiba Exceria Pro SDXC 64 GB UHS-II) | |
| HP ProBook 455 G7-175W8EA (Toshiba Exceria Pro SDXC 64 GB UHS-II) | |
| Lenovo ThinkPad L590-20Q70019GE (Toshiba Exceria Pro M501 64 GB UHS-II) | |
| HP ProBook 450 G7 8WC04UT (Toshiba Exceria Pro SDXC 64 GB UHS-II) | |
| MSI Modern 15 A10RB (Toshiba Exceria Pro M501 UHS-II) | |
| Dell Latitude 15 3590 (Toshiba Exceria Pro SDXC 64 GB UHS-II) | |


| |||||||||||||||||||||||||
iluminação: 91 %
iluminação com acumulador: 224.3 cd/m²
Contraste: 619:1 (Preto: 0.42 cd/m²)
ΔE ColorChecker Calman: 6.09 | ∀{0.5-29.43 Ø4.71}
calibrated: 5.2
ΔE Greyscale Calman: 3.7 | ∀{0.09-98 Ø4.96}
56.2% sRGB (Argyll 1.6.3 3D)
35.7% AdobeRGB 1998 (Argyll 1.6.3 3D)
39.08% AdobeRGB 1998 (Argyll 3D)
56.5% sRGB (Argyll 3D)
37.9% Display P3 (Argyll 3D)
Gamma: 2.56
CCT: 6759 K
| HP ProBook 450 G7 8WC04UT LG Philips LGD062E, IPS, 15.6", 1920x1080 | HP ProBook 455 G7-175W8EA AUO, B156HW02, IPS, 15.6", 1920x1080 | MSI Modern 15 A10RB Chi Mei N156HCE-EN1, IPS, 15.6", 1920x1080 | Dell Latitude 15 3590 BOE0802 / NT15N41 / Dell: M9P74, TN LED, 15.6", 1920x1080 | Lenovo ThinkPad L590-20Q70019GE N156HCE-EAA, IPS, 15.6", 1920x1080 | Dynabook Tecra X50-F Toshiba TOS508F, IPS, 15.6", 1920x1080 | |
|---|---|---|---|---|---|---|
| Display | 0% | 69% | 5% | 14% | -3% | |
| Display P3 Coverage (%) | 37.9 | 37.92 0% | 66 74% | 39.67 5% | 43.3 14% | 36.68 -3% |
| sRGB Coverage (%) | 56.5 | 57.1 1% | 92.1 63% | 59.7 6% | 64.4 14% | 55 -3% |
| AdobeRGB 1998 Coverage (%) | 39.08 | 39.18 0% | 66.5 70% | 40.99 5% | 44.81 15% | 37.92 -3% |
| Response Times | -1% | -18% | 23% | -12% | 4% | |
| Response Time Grey 50% / Grey 80% * (ms) | 35.2 ? | 41 ? -16% | 43.2 ? -23% | 41 ? -16% | 42.8 ? -22% | 38 ? -8% |
| Response Time Black / White * (ms) | 30.4 ? | 26 ? 14% | 34.4 ? -13% | 12 ? 61% | 30.8 ? -1% | 25.6 ? 16% |
| PWM Frequency (Hz) | 26040 ? | 250 ? | 24510 ? | |||
| Screen | 20% | 41% | -28% | 11% | 3% | |
| Brightness middle (cd/m²) | 259.8 | 282 9% | 289.4 11% | 215 -17% | 247 -5% | 295.9 14% |
| Brightness (cd/m²) | 251 | 264 5% | 273 9% | 214 -15% | 228 -9% | 270 8% |
| Brightness Distribution (%) | 91 | 88 -3% | 82 -10% | 91 0% | 81 -11% | 86 -5% |
| Black Level * (cd/m²) | 0.42 | 0.19 55% | 0.27 36% | 0.385 8% | 0.18 57% | 0.3 29% |
| Contrast (:1) | 619 | 1484 140% | 1072 73% | 558 -10% | 1372 122% | 986 59% |
| Colorchecker dE 2000 * | 6.09 | 5.56 9% | 2.32 62% | 10.31 -69% | 5.9 3% | 6.55 -8% |
| Colorchecker dE 2000 max. * | 16.33 | 19.07 -17% | 5.76 65% | 20.44 -25% | 22.9 -40% | 21.52 -32% |
| Colorchecker dE 2000 calibrated * | 5.2 | 4.5 13% | 2.49 52% | 3.88 25% | 4.7 10% | 5.73 -10% |
| Greyscale dE 2000 * | 3.7 | 3.57 4% | 3 19% | 11.84 -220% | 5.1 -38% | 4.3 -16% |
| Gamma | 2.56 86% | 2.61 84% | 2.22 99% | 2.67 82% | 2.21 100% | 2.475 89% |
| CCT | 6759 96% | 6895 94% | 6867 95% | 13398 49% | 6398 102% | 7002 93% |
| Color Space (Percent of AdobeRGB 1998) (%) | 35.7 | 36 1% | 59.8 68% | 39 9% | 41.2 15% | 35 -2% |
| Color Space (Percent of sRGB) (%) | 56.2 | 57 1% | 92 64% | 61 9% | 64.1 14% | 54 -4% |
| Média Total (Programa/Configurações) | 6% /
14% | 31% /
39% | 0% /
-15% | 4% /
9% | 1% /
2% |
* ... menor é melhor
Exibir tempos de resposta
| ↔ Tempo de resposta preto para branco | ||
|---|---|---|
| 30.4 ms ... ascensão ↗ e queda ↘ combinadas | ↗ 19.6 ms ascensão | 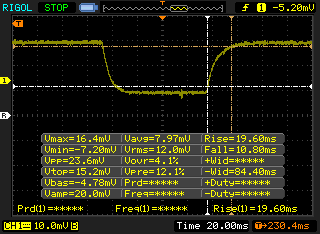 |
| ↘ 10.8 ms queda | ||
| A tela mostra taxas de resposta lentas em nossos testes e será insatisfatória para os jogadores. Em comparação, todos os dispositivos testados variam de 0.1 (mínimo) a 240 (máximo) ms. » 82 % de todos os dispositivos são melhores. Isso significa que o tempo de resposta medido é pior que a média de todos os dispositivos testados (19.8 ms). | ||
| ↔ Tempo de resposta 50% cinza a 80% cinza | ||
| 35.2 ms ... ascensão ↗ e queda ↘ combinadas | ↗ 19.6 ms ascensão | 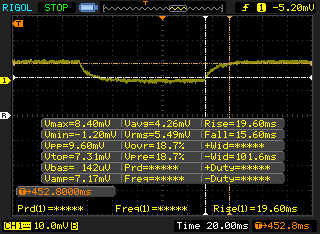 |
| ↘ 15.6 ms queda | ||
| A tela mostra taxas de resposta lentas em nossos testes e será insatisfatória para os jogadores. Em comparação, todos os dispositivos testados variam de 0.165 (mínimo) a 636 (máximo) ms. » 49 % de todos os dispositivos são melhores. Isso significa que o tempo de resposta medido é pior que a média de todos os dispositivos testados (31 ms). | ||
Cintilação da tela / PWM (modulação por largura de pulso)
| Tela tremeluzindo / PWM não detectado | 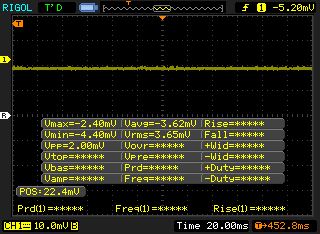 | ||
[pwm_comparison] Em comparação: 52 % de todos os dispositivos testados não usam PWM para escurecer a tela. Se PWM foi detectado, uma média de 7754 (mínimo: 5 - máximo: 343500) Hz foi medida. | |||
Cinebench R15: CPU Multi 64Bit | CPU Single 64Bit
Blender: v2.79 BMW27 CPU
7-Zip 18.03: 7z b 4 -mmt1 | 7z b 4
Geekbench 5.5: Single-Core | Multi-Core
HWBOT x265 Benchmark v2.2: 4k Preset
LibreOffice : 20 Documents To PDF
R Benchmark 2.5: Overall mean
| Cinebench R20 / CPU (Multi Core) | |
| HP ProBook 455 G7-175W8EA | |
| MSI Prestige 15 A10SC | |
| Microsoft Surface Laptop 3 15 i7-1065G7 | |
| Lenovo ThinkBook 15 | |
| Média Intel Core i7-10510U (1015 - 1897, n=38) | |
| Lenovo ThinkPad L590-20Q70019GE | |
| Lenovo ThinkPad E590-20NB0012GE | |
| HP ProBook 450 G7 8WC04UT | |
| LG Gram 15Z90N | |
| Lenovo IdeaPad 3 14IIL05 | |
| HP 17-by2437ng | |
| Cinebench R20 / CPU (Single Core) | |
| HP ProBook 455 G7-175W8EA | |
| MSI Prestige 15 A10SC | |
| Microsoft Surface Laptop 3 15 i7-1065G7 | |
| Média Intel Core i7-10510U (362 - 497, n=37) | |
| Lenovo ThinkPad E590-20NB0012GE | |
| Lenovo ThinkBook 15 | |
| Lenovo ThinkPad L590-20Q70019GE | |
| HP 17-by2437ng | |
| HP ProBook 450 G7 8WC04UT | |
| LG Gram 15Z90N | |
| Lenovo IdeaPad 3 14IIL05 | |
| Cinebench R15 / CPU Multi 64Bit | |
| MSI Prestige 15 A10SC | |
| HP ProBook 455 G7-175W8EA | |
| Microsoft Surface Laptop 3 15 i7-1065G7 | |
| Lenovo ThinkBook 15 | |
| Média Intel Core i7-10510U (482 - 856, n=45) | |
| LG Gram 15Z90N | |
| Lenovo ThinkPad E590-20NB0012GE | |
| Lenovo ThinkPad L590-20Q70019GE | |
| HP ProBook 450 G7 8WC04UT | |
| Lenovo IdeaPad 3 14IIL05 | |
| HP 17-by2437ng | |
| Cinebench R15 / CPU Single 64Bit | |
| MSI Prestige 15 A10SC | |
| Microsoft Surface Laptop 3 15 i7-1065G7 | |
| Lenovo ThinkPad E590-20NB0012GE | |
| HP ProBook 455 G7-175W8EA | |
| Média Intel Core i7-10510U (113 - 202, n=42) | |
| Lenovo ThinkBook 15 | |
| Lenovo ThinkPad L590-20Q70019GE | |
| HP 17-by2437ng | |
| Lenovo IdeaPad 3 14IIL05 | |
| LG Gram 15Z90N | |
| HP ProBook 450 G7 8WC04UT | |
| Blender / v2.79 BMW27 CPU | |
| HP 17-by2437ng | |
| Lenovo IdeaPad 3 14IIL05 | |
| LG Gram 15Z90N | |
| HP ProBook 450 G7 8WC04UT | |
| Lenovo ThinkPad L590-20Q70019GE | |
| Lenovo ThinkPad E590-20NB0012GE | |
| Média Intel Core i7-10510U (628 - 1051, n=31) | |
| Lenovo ThinkBook 15 | |
| HP ProBook 455 G7-175W8EA | |
| 7-Zip 18.03 / 7z b 4 -mmt1 | |
| Lenovo ThinkPad E590-20NB0012GE | |
| Média Intel Core i7-10510U (3747 - 4981, n=31) | |
| HP 17-by2437ng | |
| HP ProBook 455 G7-175W8EA | |
| Lenovo ThinkBook 15 | |
| LG Gram 15Z90N | |
| Lenovo IdeaPad 3 14IIL05 | |
| HP ProBook 450 G7 8WC04UT | |
| Lenovo ThinkPad L590-20Q70019GE | |
| 7-Zip 18.03 / 7z b 4 | |
| HP ProBook 455 G7-175W8EA | |
| Lenovo ThinkBook 15 | |
| Média Intel Core i7-10510U (12196 - 21298, n=31) | |
| Lenovo ThinkPad E590-20NB0012GE | |
| Lenovo ThinkPad L590-20Q70019GE | |
| LG Gram 15Z90N | |
| HP ProBook 450 G7 8WC04UT | |
| Lenovo IdeaPad 3 14IIL05 | |
| HP 17-by2437ng | |
| Geekbench 5.5 / Single-Core | |
| HP ProBook 450 G7 8WC04UT | |
| Média Intel Core i7-10510U (977 - 1287, n=31) | |
| LG Gram 15Z90N | |
| Lenovo IdeaPad 3 14IIL05 | |
| HP ProBook 455 G7-175W8EA | |
| HP 17-by2437ng | |
| Geekbench 5.5 / Multi-Core | |
| HP ProBook 455 G7-175W8EA | |
| Média Intel Core i7-10510U (2474 - 4484, n=31) | |
| HP ProBook 450 G7 8WC04UT | |
| LG Gram 15Z90N | |
| Lenovo IdeaPad 3 14IIL05 | |
| HP 17-by2437ng | |
| HWBOT x265 Benchmark v2.2 / 4k Preset | |
| HP ProBook 455 G7-175W8EA | |
| Lenovo ThinkBook 15 | |
| Média Intel Core i7-10510U (3.41 - 6.04, n=31) | |
| Lenovo ThinkPad E590-20NB0012GE | |
| Lenovo ThinkPad L590-20Q70019GE | |
| Lenovo IdeaPad 3 14IIL05 | |
| HP ProBook 450 G7 8WC04UT | |
| HP 17-by2437ng | |
| LibreOffice / 20 Documents To PDF | |
| HP ProBook 455 G7-175W8EA | |
| HP ProBook 450 G7 8WC04UT | |
| HP 17-by2437ng | |
| Média Intel Core i7-10510U (50.7 - 77.8, n=27) | |
| Lenovo IdeaPad 3 14IIL05 | |
| LG Gram 15Z90N | |
| R Benchmark 2.5 / Overall mean | |
| LG Gram 15Z90N | |
| Lenovo IdeaPad 3 14IIL05 | |
| HP ProBook 450 G7 8WC04UT | |
| HP 17-by2437ng | |
| Média Intel Core i7-10510U (0.637 - 0.81, n=28) | |
| HP ProBook 455 G7-175W8EA | |
* ... menor é melhor
| PCMark 10 | |
| Score | |
| MSI Modern 15 A10RB | |
| HP ProBook 455 G7-175W8EA | |
| Média Intel Core i7-10510U, NVIDIA GeForce MX250 (3861 - 5409, n=11) | |
| HP ProBook 450 G7 8WC04UT | |
| Dynabook Tecra X50-F | |
| Dell Latitude 15 3590 | |
| Lenovo ThinkPad L590-20Q70019GE | |
| Essentials | |
| MSI Modern 15 A10RB | |
| Média Intel Core i7-10510U, NVIDIA GeForce MX250 (8021 - 9764, n=11) | |
| HP ProBook 450 G7 8WC04UT | |
| Dynabook Tecra X50-F | |
| HP ProBook 455 G7-175W8EA | |
| Dell Latitude 15 3590 | |
| Lenovo ThinkPad L590-20Q70019GE | |
| Productivity | |
| MSI Modern 15 A10RB | |
| HP ProBook 450 G7 8WC04UT | |
| Média Intel Core i7-10510U, NVIDIA GeForce MX250 (6625 - 7972, n=11) | |
| HP ProBook 455 G7-175W8EA | |
| Dynabook Tecra X50-F | |
| Dell Latitude 15 3590 | |
| Lenovo ThinkPad L590-20Q70019GE | |
| Digital Content Creation | |
| MSI Modern 15 A10RB | |
| HP ProBook 455 G7-175W8EA | |
| HP ProBook 450 G7 8WC04UT | |
| Média Intel Core i7-10510U, NVIDIA GeForce MX250 (2621 - 5547, n=11) | |
| Dynabook Tecra X50-F | |
| Dell Latitude 15 3590 | |
| Lenovo ThinkPad L590-20Q70019GE | |
| PCMark 8 | |
| Home Score Accelerated v2 | |
| HP ProBook 455 G7-175W8EA | |
| MSI Modern 15 A10RB | |
| Média Intel Core i7-10510U, NVIDIA GeForce MX250 (3214 - 3958, n=8) | |
| HP ProBook 450 G7 8WC04UT | |
| Dell Latitude 15 3590 | |
| Lenovo ThinkPad L590-20Q70019GE | |
| Work Score Accelerated v2 | |
| MSI Modern 15 A10RB | |
| HP ProBook 455 G7-175W8EA | |
| Média Intel Core i7-10510U, NVIDIA GeForce MX250 (4599 - 5443, n=8) | |
| HP ProBook 450 G7 8WC04UT | |
| Dell Latitude 15 3590 | |
| Lenovo ThinkPad L590-20Q70019GE | |
| PCMark 8 Home Score Accelerated v2 | 3585 pontos | |
| PCMark 8 Work Score Accelerated v2 | 4992 pontos | |
| PCMark 10 Score | 4231 pontos | |
Ajuda | ||
| DPC Latencies / LatencyMon - interrupt to process latency (max), Web, Youtube, Prime95 | |
| LG Gram 15Z90N | |
| HP Envy x360 15-dr1679cl | |
| HP ProBook 450 G7 8WC04UT | |
| HP 17-by2437ng | |
| Asus VivoBook 17 S712FA-DS76 | |
| HP ProBook 455 G7-175W8EA | |
| Lenovo IdeaPad 3 14IIL05 | |
* ... menor é melhor
| HP ProBook 450 G7 8WC04UT Crucial P1 SSD CT1000P1SSD8 | HP ProBook 455 G7-175W8EA Samsung PM991 MZVLQ512HALU | MSI Modern 15 A10RB WDC PC SN730 SDBPNTY-512G | Dell Latitude 15 3590 Samsung SSD PM871b MZ7LN256HAJQ | Lenovo ThinkPad L590-20Q70019GE Toshiba XG6 KXG6AZNV512G | Dynabook Tecra X50-F Samsung SSD PM981 MZVLB512HAJQ | |
|---|---|---|---|---|---|---|
| AS SSD | 19% | 113% | -29% | 67% | 31% | |
| Seq Read (MB/s) | 1155 | 1929 67% | 2084 80% | 498.7 -57% | 1383 20% | 1461 26% |
| Seq Write (MB/s) | 984 | 1199 22% | 2442 148% | 361.7 -63% | 852 -13% | 1039 6% |
| 4K Read (MB/s) | 48.85 | 43.9 -10% | 47.52 -3% | 34.65 -29% | 45.72 -6% | 45.98 -6% |
| 4K Write (MB/s) | 96.6 | 116.2 20% | 135.8 41% | 79.8 -17% | 120.2 24% | 125.5 30% |
| 4K-64 Read (MB/s) | 581 | 897 54% | 1043 80% | 372.5 -36% | 1344 131% | 560 -4% |
| 4K-64 Write (MB/s) | 658 | 801 22% | 955 45% | 247.7 -62% | 926 41% | 1162 77% |
| Access Time Read * (ms) | 0.066 | 0.069 -5% | 0.062 6% | 0.06 9% | 0.063 5% | 0.045 32% |
| Access Time Write * (ms) | 0.207 | 0.033 84% | 0.076 63% | 0.042 80% | 0.036 83% | 0.032 85% |
| Score Read (Points) | 745 | 1134 52% | 1299 74% | 457 -39% | 1528 105% | 752 1% |
| Score Write (Points) | 853 | 1037 22% | 1335 57% | 364 -57% | 1132 33% | 1391 63% |
| Score Total (Points) | 1986 | 2723 37% | 3326 67% | 1060 -47% | 3420 72% | 2521 27% |
| Copy ISO MB/s (MB/s) | 2635 | 1409 -47% | 1926 -27% | 1147 -56% | ||
| Copy Program MB/s (MB/s) | 95.1 | 70.2 -26% | 714 651% | 419.8 341% | ||
| Copy Game MB/s (MB/s) | 361.9 | 254.9 -30% | 1425 294% | 928 156% | ||
| CrystalDiskMark 5.2 / 6 | 19% | 108% | -36% | 21% | 10% | |
| Write 4K (MB/s) | 111.1 | 141.9 28% | 208.4 88% | 79.5 -28% | 115.3 4% | 100.1 -10% |
| Read 4K (MB/s) | 56.3 | 37.25 -34% | 51 -9% | 32.72 -42% | 43.34 -23% | 42.4 -25% |
| Write Seq (MB/s) | 559 | 998 79% | 2687 381% | 472.5 -15% | 1014 81% | |
| Read Seq (MB/s) | 1348 | 1233 -9% | 2168 61% | 504 -63% | 1481 10% | |
| Write 4K Q32T1 (MB/s) | 277.1 | 338.4 22% | 489.2 77% | 322.6 16% | 495.4 79% | 245.9 -11% |
| Read 4K Q32T1 (MB/s) | 312.1 | 431.1 38% | 600 92% | 249.9 -20% | 332.6 7% | 230.3 -26% |
| Write Seq Q32T1 (MB/s) | 1652 | 1367 -17% | 2699 63% | 531 -68% | 1654 0% | 1910 16% |
| Read Seq Q32T1 (MB/s) | 1588 | 2355 48% | 3374 112% | 544 -66% | 1746 10% | 3454 118% |
| Write 4K Q8T8 (MB/s) | 877 | 1033 | ||||
| Read 4K Q8T8 (MB/s) | 518 | 892 | ||||
| Média Total (Programa/Configurações) | 19% /
19% | 111% /
111% | -33% /
-32% | 44% /
50% | 21% /
23% |
* ... menor é melhor

Disk Throttling: DiskSpd Read Loop, Queue Depth 8
| 3DMark 11 | |
| 1280x720 Performance GPU | |
| Lenovo ThinkPad E590-20NB0012GE | |
| MSI Modern 15 A10RB | |
| Lenovo ThinkPad T15 Gen1-20S7S02U00 | |
| Microsoft Surface Laptop 3 15 i7-1065G7 | |
| Média NVIDIA GeForce MX250 (3585 - 4942, n=29) | |
| HP ProBook 450 G7 8WC04UT | |
| HP ProBook 455 G7-175W8EA | |
| LG Gram 15Z90N | |
| Lenovo IdeaPad 3 14IIL05 | |
| Asus VivoBook 17 S712FA-DS76 | |
| Lenovo ThinkBook 15 | |
| HP Envy x360 15-dr1679cl | |
| Lenovo ThinkPad L590-20Q70019GE | |
| Dell Latitude 15 3590 | |
| HP 17-by2437ng | |
| 1280x720 Performance Combined | |
| Lenovo ThinkPad E590-20NB0012GE | |
| MSI Modern 15 A10RB | |
| Lenovo ThinkPad T15 Gen1-20S7S02U00 | |
| HP ProBook 450 G7 8WC04UT | |
| Média NVIDIA GeForce MX250 (3532 - 4638, n=29) | |
| Microsoft Surface Laptop 3 15 i7-1065G7 | |
| HP ProBook 455 G7-175W8EA | |
| Lenovo IdeaPad 3 14IIL05 | |
| Lenovo ThinkBook 15 | |
| Asus VivoBook 17 S712FA-DS76 | |
| HP Envy x360 15-dr1679cl | |
| Lenovo ThinkPad L590-20Q70019GE | |
| LG Gram 15Z90N | |
| HP 17-by2437ng | |
| Dell Latitude 15 3590 | |
| 3DMark 11 Performance | 4452 pontos | |
| 3DMark Cloud Gate Standard Score | 13121 pontos | |
| 3DMark Fire Strike Score | 3072 pontos | |
| 3DMark Time Spy Score | 1119 pontos | |
Ajuda | ||
| baixo | média | alto | ultra | |
|---|---|---|---|---|
| The Witcher 3 (2015) | 66.7 | 34.7 | 21 | 11.2 |
| Dota 2 Reborn (2015) | 110 | 96.2 | 68 | 60.7 |
| X-Plane 11.11 (2018) | 44.3 | 38.7 | 35.5 |
| HP ProBook 450 G7 8WC04UT GeForce MX250, i7-10510U, Crucial P1 SSD CT1000P1SSD8 | HP ProBook 455 G7-175W8EA Vega 7, R7 4700U, Samsung PM991 MZVLQ512HALU | MSI Modern 15 A10RB GeForce MX250, i7-10510U, WDC PC SN730 SDBPNTY-512G | Dell Latitude 15 3590 UHD Graphics 620, i5-8250U, Samsung SSD PM871b MZ7LN256HAJQ | Lenovo ThinkPad L590-20Q70019GE UHD Graphics 620, i5-8265U, Toshiba XG6 KXG6AZNV512G | Dynabook Tecra X50-F UHD Graphics 620, i7-8665U, Samsung SSD PM981 MZVLB512HAJQ | |
|---|---|---|---|---|---|---|
| Noise | -6% | -11% | -11% | 1% | -5% | |
| desligado / ambiente * (dB) | 26.2 | 30.7 -17% | 28.3 -8% | 30.6 -17% | 29 -11% | 30.2 -15% |
| Idle Minimum * (dB) | 26.2 | 30.7 -17% | 32 -22% | 30.6 -17% | 29 -11% | 30.2 -15% |
| Idle Average * (dB) | 26.2 | 30.7 -17% | 32 -22% | 31.9 -22% | 29 -11% | 30.2 -15% |
| Idle Maximum * (dB) | 26.2 | 30.7 -17% | 32 -22% | 31.9 -22% | 29 -11% | 30.2 -15% |
| Load Average * (dB) | 38.1 | 33.9 11% | 34.5 9% | 39 -2% | 29 24% | 33.4 12% |
| Witcher 3 ultra * (dB) | 37.5 | 39.5 -5% | ||||
| Load Maximum * (dB) | 47 | 36.8 22% | 50.9 -8% | 39.1 17% | 33.8 28% | 39 17% |
* ... menor é melhor
Barulho
| Ocioso |
| 26.2 / 26.2 / 26.2 dB |
| Carga |
| 38.1 / 47 dB |
 | ||
30 dB silencioso 40 dB(A) audível 50 dB(A) ruidosamente alto |
||
min: | ||
(±) A temperatura máxima no lado superior é 40 °C / 104 F, em comparação com a média de 34.3 °C / 94 F , variando de 21.2 a 62.5 °C para a classe Office.
(-) A parte inferior aquece até um máximo de 56.6 °C / 134 F, em comparação com a média de 36.8 °C / 98 F
(+) Em uso inativo, a temperatura média para o lado superior é 26 °C / 79 F, em comparação com a média do dispositivo de 29.5 °C / ### class_avg_f### F.
(±) Jogando The Witcher 3, a temperatura média para o lado superior é 35.2 °C / 95 F, em comparação com a média do dispositivo de 29.5 °C / ## #class_avg_f### F.
(+) Os apoios para as mãos e o touchpad são mais frios que a temperatura da pele, com um máximo de 29.8 °C / 85.6 F e, portanto, são frios ao toque.
(-) A temperatura média da área do apoio para as mãos de dispositivos semelhantes foi 27.5 °C / 81.5 F (-2.3 °C / -4.1 F).
HP ProBook 450 G7 8WC04UT análise de áudio
(±) | o volume do alto-falante é médio, mas bom (###valor### dB)
Graves 100 - 315Hz
(-) | quase nenhum baixo - em média 18.4% menor que a mediana
(±) | a linearidade dos graves é média (12.2% delta para a frequência anterior)
Médios 400 - 2.000 Hz
(+) | médios equilibrados - apenas 2.9% longe da mediana
(+) | médios são lineares (5.4% delta para frequência anterior)
Altos 2 - 16 kHz
(+) | agudos equilibrados - apenas 2.8% longe da mediana
(+) | os máximos são lineares (5.4% delta da frequência anterior)
Geral 100 - 16.000 Hz
(+) | o som geral é linear (14.5% diferença em relação à mediana)
Comparado com a mesma classe
» 12% de todos os dispositivos testados nesta classe foram melhores, 4% semelhantes, 84% piores
» O melhor teve um delta de 7%, a média foi 21%, o pior foi 53%
Comparado com todos os dispositivos testados
» 18% de todos os dispositivos testados foram melhores, 4% semelhantes, 77% piores
» O melhor teve um delta de 4%, a média foi 23%, o pior foi 134%
Apple MacBook 12 (Early 2016) 1.1 GHz análise de áudio
(+) | os alto-falantes podem tocar relativamente alto (###valor### dB)
Graves 100 - 315Hz
(±) | graves reduzidos - em média 11.3% menor que a mediana
(±) | a linearidade dos graves é média (14.2% delta para a frequência anterior)
Médios 400 - 2.000 Hz
(+) | médios equilibrados - apenas 2.4% longe da mediana
(+) | médios são lineares (5.5% delta para frequência anterior)
Altos 2 - 16 kHz
(+) | agudos equilibrados - apenas 2% longe da mediana
(+) | os máximos são lineares (4.5% delta da frequência anterior)
Geral 100 - 16.000 Hz
(+) | o som geral é linear (10.2% diferença em relação à mediana)
Comparado com a mesma classe
» 7% de todos os dispositivos testados nesta classe foram melhores, 2% semelhantes, 90% piores
» O melhor teve um delta de 5%, a média foi 18%, o pior foi 53%
Comparado com todos os dispositivos testados
» 5% de todos os dispositivos testados foram melhores, 1% semelhantes, 94% piores
» O melhor teve um delta de 4%, a média foi 23%, o pior foi 134%
| desligado | |
| Ocioso | |
| Carga |
|
Key:
min: | |
| HP ProBook 450 G7 8WC04UT i7-10510U, GeForce MX250, Crucial P1 SSD CT1000P1SSD8, IPS, 1920x1080, 15.6" | HP ProBook 455 G7-175W8EA R7 4700U, Vega 7, Samsung PM991 MZVLQ512HALU, IPS, 1920x1080, 15.6" | MSI Modern 15 A10RB i7-10510U, GeForce MX250, WDC PC SN730 SDBPNTY-512G, IPS, 1920x1080, 15.6" | Dell Latitude 15 3590 i5-8250U, UHD Graphics 620, Samsung SSD PM871b MZ7LN256HAJQ, TN LED, 1920x1080, 15.6" | Lenovo ThinkPad L590-20Q70019GE i5-8265U, UHD Graphics 620, Toshiba XG6 KXG6AZNV512G, IPS, 1920x1080, 15.6" | Dynabook Tecra X50-F i7-8665U, UHD Graphics 620, Samsung SSD PM981 MZVLB512HAJQ, IPS, 1920x1080, 15.6" | |
|---|---|---|---|---|---|---|
| Power Consumption | 25% | -32% | 29% | 27% | 28% | |
| Idle Minimum * (Watt) | 4.8 | 3.8 21% | 6.6 -38% | 4.3 10% | 3.96 17% | 3.9 19% |
| Idle Average * (Watt) | 9.5 | 7.7 19% | 9.9 -4% | 7.2 24% | 6.9 27% | 7 26% |
| Idle Maximum * (Watt) | 10.7 | 10.5 2% | 14.7 -37% | 9.8 8% | 9.8 8% | 7.3 32% |
| Load Average * (Watt) | 61.8 | 32 48% | 82.9 -34% | 38 39% | 31.4 49% | 32.7 47% |
| Witcher 3 ultra * (Watt) | 50 | 59.4 -19% | ||||
| Load Maximum * (Watt) | 69 | 45.4 34% | 109.3 -58% | 24 65% | 45.4 34% | 57.8 16% |
* ... menor é melhor
| HP ProBook 450 G7 8WC04UT i7-10510U, GeForce MX250, 45 Wh | HP ProBook 455 G7-175W8EA R7 4700U, Vega 7, 45 Wh | MSI Modern 15 A10RB i7-10510U, GeForce MX250, 52 Wh | Dell Latitude 15 3590 i5-8250U, UHD Graphics 620, 56 Wh | Lenovo ThinkPad L590-20Q70019GE i5-8265U, UHD Graphics 620, 45 Wh | Dynabook Tecra X50-F i7-8665U, UHD Graphics 620, 48 Wh | |
|---|---|---|---|---|---|---|
| Duração da bateria | -6% | -7% | 24% | 19% | -37% | |
| Reader / Idle (h) | 14.8 | 12.6 -15% | 15.4 4% | 20.2 36% | 17.4 18% | 5.8 -61% |
| WiFi v1.3 (h) | 7.2 | 7.6 6% | 6.5 -10% | 9.1 26% | 7.2 0% | 4.6 -36% |
| Load (h) | 2 | 1.8 -10% | 1.7 -15% | 2.2 10% | 2.8 40% | 1.7 -15% |
Pro
Contra

Quando configurado com a CPU Core i7, sem GPU GeForce, tela 1080p, 8 GB de RAM e HDD de 500 GB, o ProBook 450 G7 é vendido por cerca de $1.200 USD na HP.com. Ao configurar o ProBook 455 G7 com as mesmas especificações, mas com a CPU Ryzen 7, o sistema seria vendido por apenas cerca de $800 USD. Esses preços podem muito bem mudar no futuro, mas a mensagem permanece clara: o ProBook 455 G7 com Ryzen é a opção mais rápida e mais barata para torná-lo o melhor sistema, especialmente em termos de desempenho por dólar.
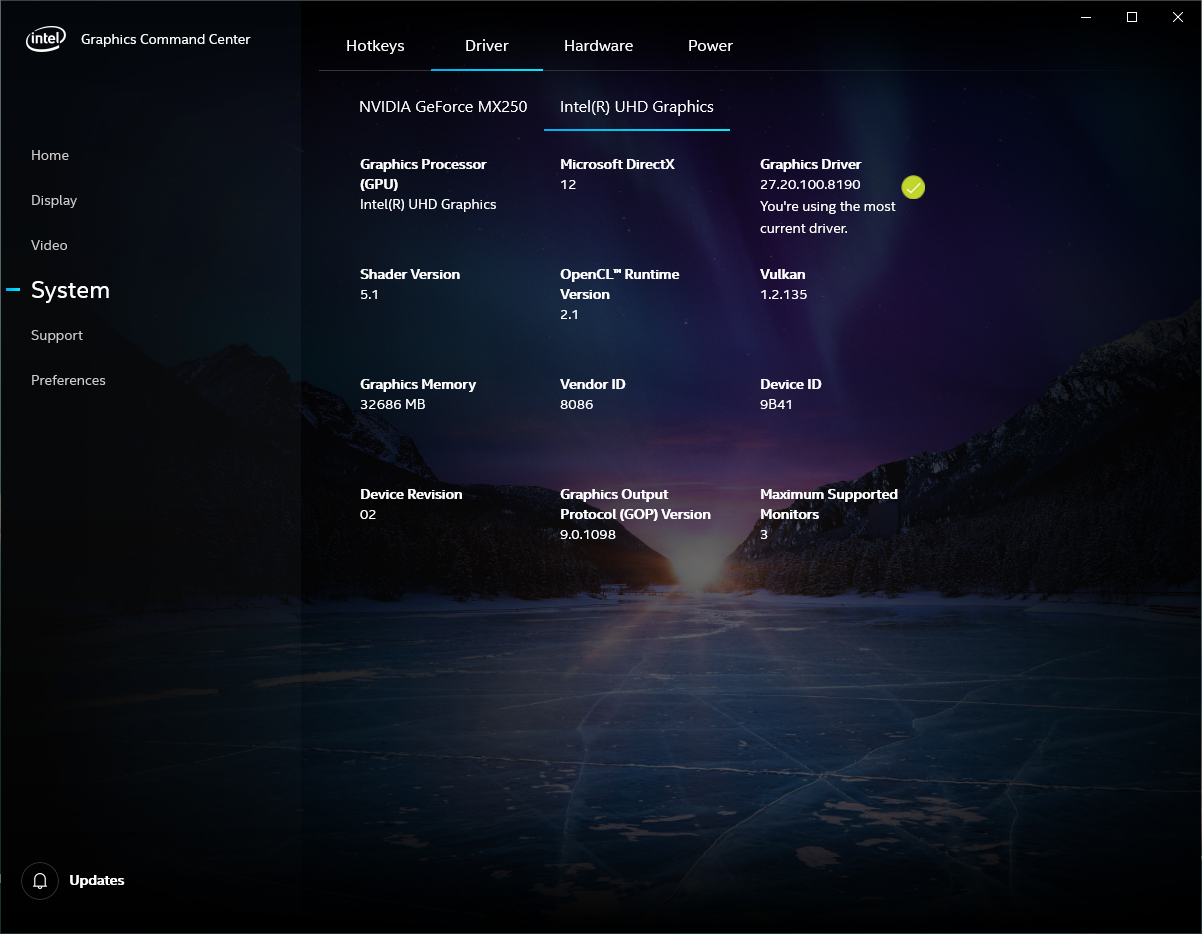
Ainda vale a pena comprar o ProBook 450 G7 com processador Intel? As opções Nvidia GeForce estão disponíveis apenas em SKUs Intel, que oferecem desempenho gráfico mais rápido do que a solução AMD integrada para quem precisa. Ofertas potenciais do ProBook 450 G7 como aquela na CUKUSA também pode fazer o sistema valer a pena considerar. Caso contrário, a Intel terá uma longa batalha difícil contra a AMD e suas alternativas Ryzen emergentes.
O HP ProBook 450 G7 integra muitos recursos para um portátil empresarial econômico, incluindo uma GPU GeForce MX dedicada. Se o último não for importante para suas cargas de trabalho, entretanto, o ProBook 455 G7 será a opção superior em quase todos os aspectos.
HP ProBook 450 G7 8WC04UT
- 08/02/2020 v7 (old)
Allen Ngo
Price comparison
