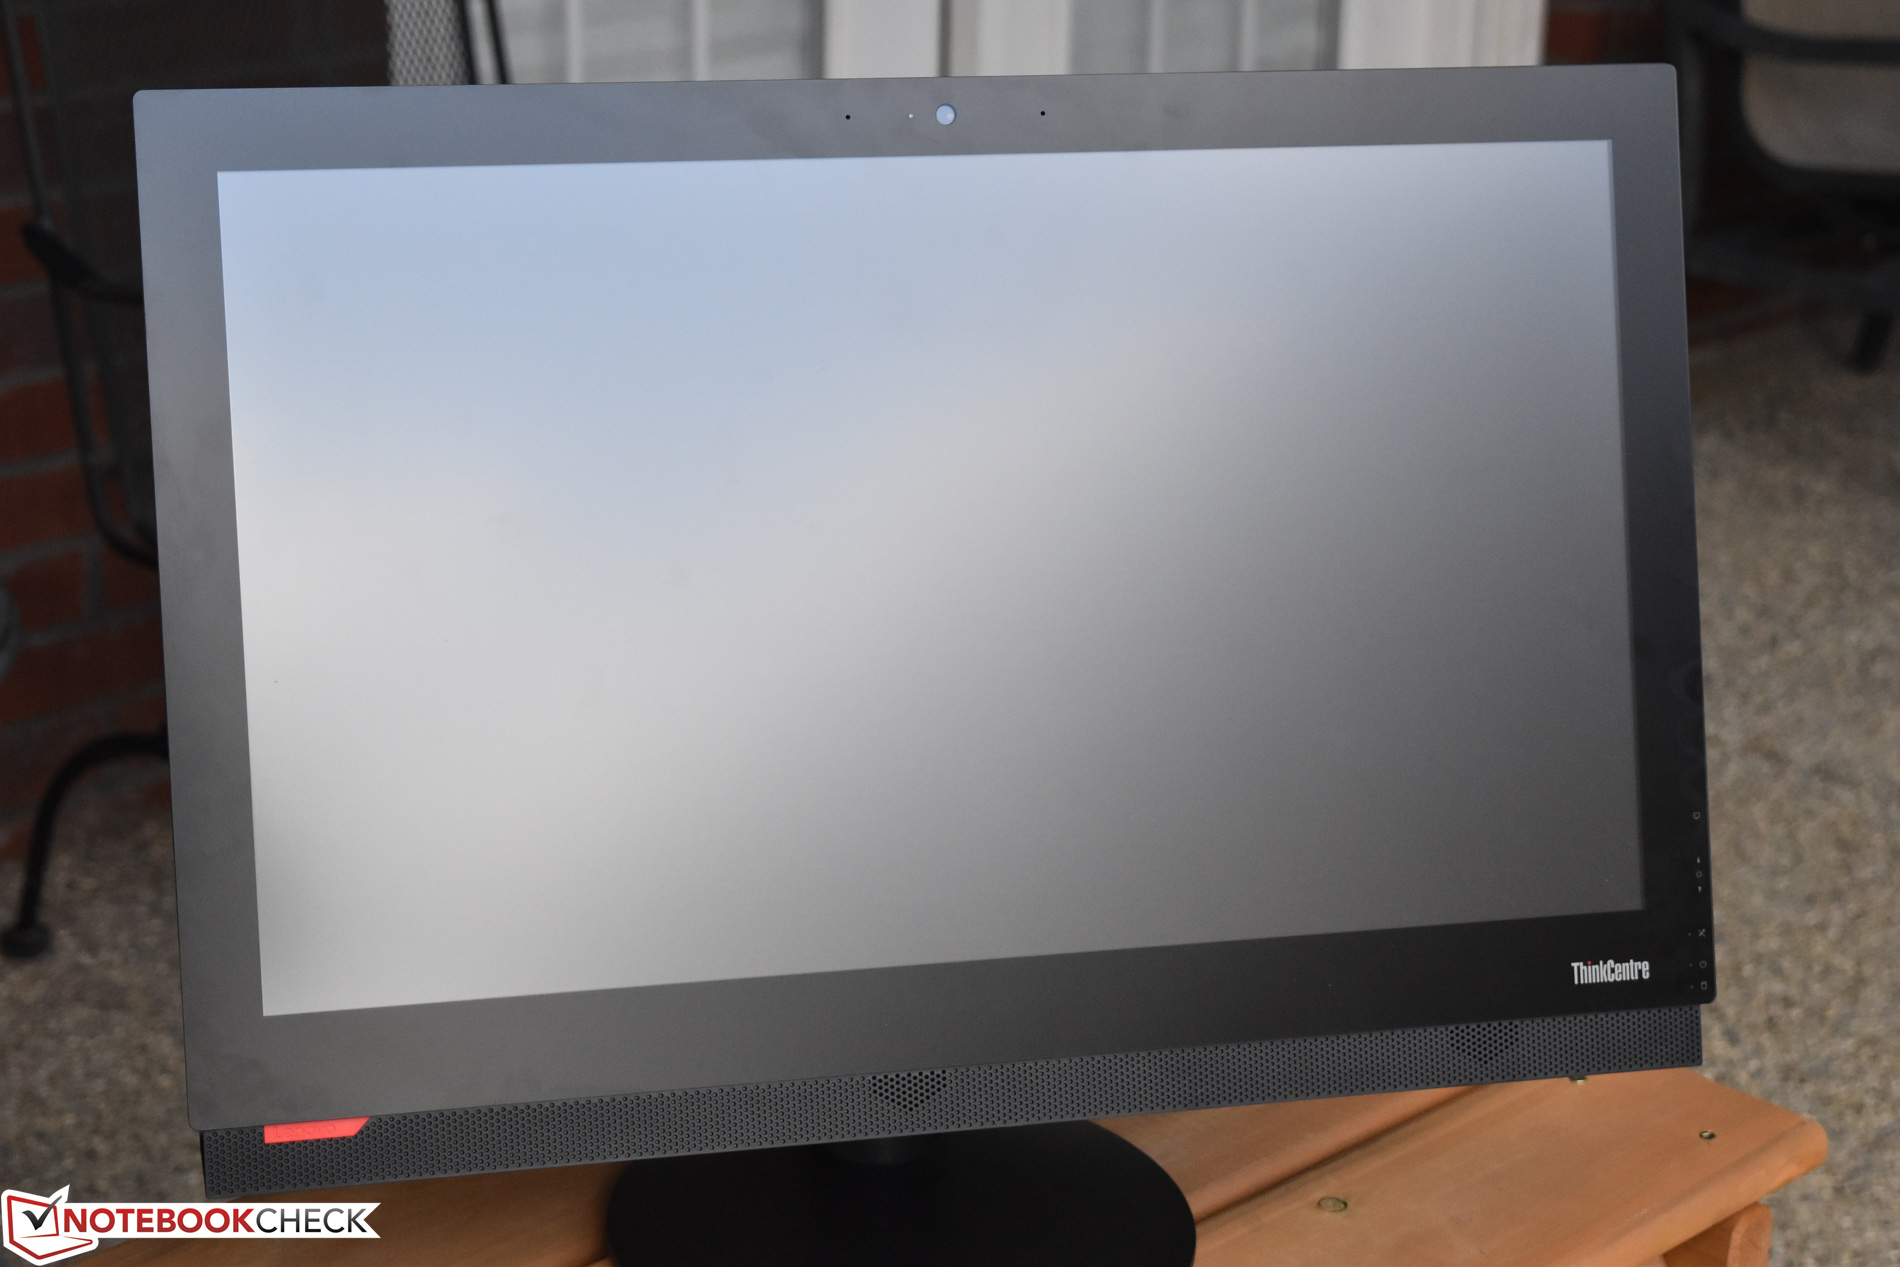
Breve Análise do Desktop Tudo-em-um Lenovo ThinkCentre M910z
| SD Card Reader | |
| average JPG Copy Test (av. of 3 runs) | |
| Dell Latitude 5580 | |
| HP Z1 G2 G1X47EA | |
| Lenovo ThinkPad T470p-20J7S00000 | |
| Lenovo ThinkCentre M910z-10NR000KUS | |
| maximum AS SSD Seq Read Test (1GB) | |
| Dell Latitude 5580 | |
| Lenovo ThinkPad T470p-20J7S00000 | |
| HP Z1 G2 G1X47EA | |
| Lenovo ThinkCentre M910z-10NR000KUS | |
| Networking | |
| iperf3 transmit AX12 | |
| Lenovo ThinkCentre M910z-10NR000KUS | |
| Lenovo ThinkPad T470p-20J7S00000 | |
| Dell Latitude 5580 | |
| iperf3 receive AX12 | |
| Lenovo ThinkCentre M910z-10NR000KUS | |
| Lenovo ThinkPad T470p-20J7S00000 | |
| Dell Latitude 5580 | |
| |||||||||||||||||||||||||
iluminação: 93 %
Contraste: 961:1 (Preto: 0.23 cd/m²)
ΔE ColorChecker Calman: 3.8 | ∀{0.5-29.43 Ø4.73}
ΔE Greyscale Calman: 3.7 | ∀{0.09-98 Ø4.97}
90.3% sRGB (Argyll 1.6.3 3D)
58.44% AdobeRGB 1998 (Argyll 1.6.3 3D)
65.6% AdobeRGB 1998 (Argyll 3D)
90.3% sRGB (Argyll 3D)
64.4% Display P3 (Argyll 3D)
Gamma: 2.38
CCT: 6701 K
| Lenovo ThinkCentre M910z-10NR000KUS LEN-M910z-B, IPS, 23.8", 1920x1080 | HP Z1 G2 G1X47EA HWP192F, IPS LED, 27", 2560x1440 | Apple iMac Retina 5K 27 Late 2015 3.2 GHz M390 MK472D/A 27", 5120x2880 | |
|---|---|---|---|
| Display | 14% | 33% | |
| Display P3 Coverage (%) | 64.4 | 76.8 19% | 99.3 54% |
| sRGB Coverage (%) | 90.3 | 99.7 10% | 100 11% |
| AdobeRGB 1998 Coverage (%) | 65.6 | 74.4 13% | 88.2 34% |
| Response Times | -49% | -2% | |
| Response Time Grey 50% / Grey 80% * (ms) | 35.2 ? | 44.4 ? -26% | 30.4 ? 14% |
| Response Time Black / White * (ms) | 17.6 ? | 30.2 ? -72% | 20.8 ? -18% |
| PWM Frequency (Hz) | 21740 ? | 200 ? | |
| Screen | -3% | 15% | |
| Brightness middle (cd/m²) | 221 | 365 65% | 429 94% |
| Brightness (cd/m²) | 214 | 367 71% | 424 98% |
| Brightness Distribution (%) | 93 | 87 -6% | 95 2% |
| Black Level * (cd/m²) | 0.23 | 0.4 -74% | 0.58 -152% |
| Contrast (:1) | 961 | 913 -5% | 740 -23% |
| Colorchecker dE 2000 * | 3.8 | 4.68 -23% | 2.8 26% |
| Colorchecker dE 2000 max. * | 7.3 | ||
| Greyscale dE 2000 * | 3.7 | 6.6 -78% | 1.97 47% |
| Gamma | 2.38 92% | 2.34 94% | 2.13 103% |
| CCT | 6701 97% | 6094 107% | 6889 94% |
| Color Space (Percent of AdobeRGB 1998) (%) | 58.44 | 66.26 13% | 79 35% |
| Color Space (Percent of sRGB) (%) | 90.3 | 99.69 10% | 99.97 11% |
| Média Total (Programa/Configurações) | -13% /
-6% | 15% /
17% |
* ... menor é melhor
Exibir tempos de resposta
| ↔ Tempo de resposta preto para branco | ||
|---|---|---|
| 17.6 ms ... ascensão ↗ e queda ↘ combinadas | ↗ 10.8 ms ascensão | 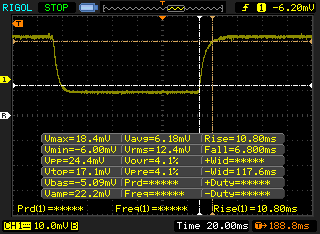 |
| ↘ 6.8 ms queda | ||
| A tela mostra boas taxas de resposta em nossos testes, mas pode ser muito lenta para jogadores competitivos. Em comparação, todos os dispositivos testados variam de 0.1 (mínimo) a 240 (máximo) ms. » 39 % de todos os dispositivos são melhores. Isso significa que o tempo de resposta medido é melhor que a média de todos os dispositivos testados (19.9 ms). | ||
| ↔ Tempo de resposta 50% cinza a 80% cinza | ||
| 35.2 ms ... ascensão ↗ e queda ↘ combinadas | ↗ 15.2 ms ascensão | 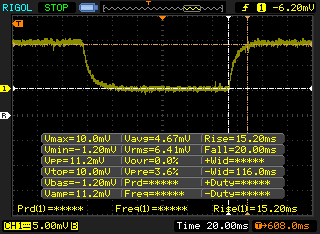 |
| ↘ 20 ms queda | ||
| A tela mostra taxas de resposta lentas em nossos testes e será insatisfatória para os jogadores. Em comparação, todos os dispositivos testados variam de 0.165 (mínimo) a 636 (máximo) ms. » 49 % de todos os dispositivos são melhores. Isso significa que o tempo de resposta medido é pior que a média de todos os dispositivos testados (31.1 ms). | ||
Cintilação da tela / PWM (modulação por largura de pulso)
| Tela tremeluzindo/PWM detectado | 21740 Hz | ≤ 20 % configuração de brilho | 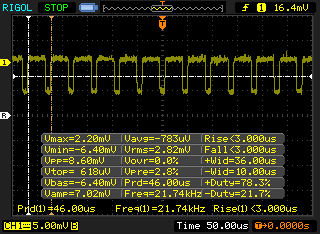 |
A luz de fundo da tela pisca em 21740 Hz (pior caso, por exemplo, utilizando PWM) Cintilação detectada em uma configuração de brilho de 20 % e abaixo. Não deve haver cintilação ou PWM acima desta configuração de brilho. A frequência de 21740 Hz é bastante alta, então a maioria dos usuários sensíveis ao PWM não deve notar nenhuma oscilação. [pwm_comparison] Em comparação: 52 % de todos os dispositivos testados não usam PWM para escurecer a tela. Se PWM foi detectado, uma média de 7798 (mínimo: 5 - máximo: 343500) Hz foi medida. | |||
| Cinebench R11.5 | |
| CPU Single 64Bit | |
| Lenovo ThinkCentre M910z-10NR000KUS | |
| Lenovo ThinkPad T470p-20J7S00000 | |
| CPU Multi 64Bit | |
| Lenovo ThinkPad T470p-20J7S00000 | |
| Lenovo ThinkCentre M910z-10NR000KUS | |
| wPrime 2.10 - 1024m | |
| HP Z1 G2 G1X47EA | |
| Lenovo ThinkCentre M910z-10NR000KUS | |
* ... menor é melhor
| PCMark 8 | |
| Home Score Accelerated v2 | |
| Lenovo ThinkCentre M910z-10NR000KUS | |
| Lenovo ThinkPad T470p-20J7S00000 | |
| HP Z1 G2 G1X47EA | |
| Dell Latitude 5580 | |
| Work Score Accelerated v2 | |
| Lenovo ThinkCentre M910z-10NR000KUS | |
| Lenovo ThinkPad T470p-20J7S00000 | |
| HP Z1 G2 G1X47EA | |
| Creative Score Accelerated v2 | |
| Lenovo ThinkCentre M910z-10NR000KUS | |
| Lenovo ThinkPad T470p-20J7S00000 | |
| HP Z1 G2 G1X47EA | |
| PCMark 8 Home Score Accelerated v2 | 3916 pontos | |
| PCMark 8 Creative Score Accelerated v2 | 5077 pontos | |
| PCMark 8 Work Score Accelerated v2 | 5053 pontos | |
| PCMark 10 Score | 3910 pontos | |
Ajuda | ||

| 3DMark 11 | |
| 1280x720 Performance GPU | |
| Lenovo ThinkPad T470p-20J7S00000 | |
| Lenovo ThinkCentre M910z-10NR000KUS | |
| Dell Latitude 5580 | |
| 1280x720 Performance Combined | |
| Lenovo ThinkPad T470p-20J7S00000 | |
| Lenovo ThinkCentre M910z-10NR000KUS | |
| Dell Latitude 5580 | |
| 3DMark | |
| 1280x720 Cloud Gate Standard Graphics | |
| Lenovo ThinkPad T470p-20J7S00000 | |
| HP Z1 G2 G1X47EA | |
| Lenovo ThinkCentre M910z-10NR000KUS | |
| 1920x1080 Fire Strike Graphics | |
| Lenovo ThinkPad T470p-20J7S00000 | |
| HP Z1 G2 G1X47EA | |
| Lenovo ThinkCentre M910z-10NR000KUS | |
| 1920x1080 Ice Storm Extreme Graphics | |
| Lenovo ThinkPad T470p-20J7S00000 | |
| 3DMark 06 Standard Score | 10165 pontos | |
| 3DMark 11 Performance | 1782 pontos | |
| 3DMark Cloud Gate Standard Score | 7160 pontos | |
| 3DMark Fire Strike Score | 907 pontos | |
Ajuda | ||
| baixo | média | alto | ultra | |
|---|---|---|---|---|
| BioShock Infinite (2013) | 52 | 35 | 23 | 8 |
Barulho
| Ocioso |
| 34.5 / 34.6 / 34.6 dB |
| Carga |
| 34.6 / 34.6 dB |
 | ||
30 dB silencioso 40 dB(A) audível 50 dB(A) ruidosamente alto |
||
min: | ||
| Lenovo ThinkCentre M910z-10NR000KUS HD Graphics 630, i5-7500, Toshiba NVMe THNSF5512GPUK | HP Z1 G2 G1X47EA Quadro K2100M, E3-1226 v3, Micron M600 MTFDDAT256MBF mSATA | Apple iMac Retina 5K 27 Late 2015 3.2 GHz M390 MK472D/A Radeon R9 M390, 6500, Apple Fusion Drive 1TB (24 GB SSD + 1 TB HDD) | Lenovo ThinkPad T470p-20J7S00000 GeForce 940MX, i7-7700HQ, Samsung PM961 NVMe MZVLW512HMJP | Dell Latitude 5580 HD Graphics 620, i5-7300U, Toshiba MQ01ACF050 | |
|---|---|---|---|---|---|
| Noise | 5% | -7% | 4% | -2% | |
| desligado / ambiente * (dB) | 28 | 30 -7% | 29 -4% | 30.6 -9% | |
| Idle Minimum * (dB) | 34.5 | 32.4 6% | 32.5 6% | 29 16% | 32.8 5% |
| Idle Average * (dB) | 34.6 | 32.4 6% | 32.5 6% | 29 16% | 32.8 5% |
| Idle Maximum * (dB) | 34.6 | 32.4 6% | 32.5 6% | 29 16% | 33.6 3% |
| Load Average * (dB) | 34.6 | 33.7 3% | 39 -13% | 35.6 -3% | 37.6 -9% |
| Load Maximum * (dB) | 34.6 | 33.7 3% | 48.2 -39% | 39.7 -15% | 37.6 -9% |
* ... menor é melhor
(+) A temperatura máxima no lado superior é 39.8 °C / 104 F, em comparação com a média de 33.9 °C / 93 F , variando de 25 a 47 °C para a classe Desktop.
(-) A parte inferior aquece até um máximo de 54.8 °C / 131 F, em comparação com a média de 33.6 °C / 92 F
(+) Em uso inativo, a temperatura média para o lado superior é 26.6 °C / 80 F, em comparação com a média do dispositivo de 29.5 °C / ### class_avg_f### F.
Lenovo ThinkCentre M910z-10NR000KUS análise de áudio
(±) | o volume do alto-falante é médio, mas bom (###valor### dB)
Graves 100 - 315Hz
(+) | bons graves - apenas 4.7% longe da mediana
(-) | graves não são lineares (15.9% delta para frequência anterior)
Médios 400 - 2.000 Hz
(±) | médios mais altos - em média 5.7% maior que a mediana
(±) | a linearidade dos médios é média (9.1% delta para frequência anterior)
Altos 2 - 16 kHz
(±) | máximos reduzidos - em média 6.8% menor que a mediana
(±) | a linearidade dos máximos é média (11% delta para frequência anterior)
Geral 100 - 16.000 Hz
(±) | a linearidade do som geral é média (19.9% diferença em relação à mediana)
Comparado com a mesma classe
» 67% de todos os dispositivos testados nesta classe foram melhores, 22% semelhantes, 11% piores
» O melhor teve um delta de 6%, a média foi 16%, o pior foi 46%
Comparado com todos os dispositivos testados
» 51% de todos os dispositivos testados foram melhores, 7% semelhantes, 42% piores
» O melhor teve um delta de 4%, a média foi 24%, o pior foi 134%
Lenovo ThinkPad T470p-20J7S00000 análise de áudio
(+) | os alto-falantes podem tocar relativamente alto (###valor### dB)
Graves 100 - 315Hz
(-) | quase nenhum baixo - em média 18.1% menor que a mediana
(±) | a linearidade dos graves é média (14.6% delta para a frequência anterior)
Médios 400 - 2.000 Hz
(+) | médios equilibrados - apenas 4.2% longe da mediana
(+) | médios são lineares (5.9% delta para frequência anterior)
Altos 2 - 16 kHz
(+) | agudos equilibrados - apenas 3.3% longe da mediana
(+) | os máximos são lineares (6.5% delta da frequência anterior)
Geral 100 - 16.000 Hz
(±) | a linearidade do som geral é média (19.6% diferença em relação à mediana)
Comparado com a mesma classe
» 40% de todos os dispositivos testados nesta classe foram melhores, 8% semelhantes, 52% piores
» O melhor teve um delta de 7%, a média foi 21%, o pior foi 53%
Comparado com todos os dispositivos testados
» 49% de todos os dispositivos testados foram melhores, 7% semelhantes, 44% piores
» O melhor teve um delta de 4%, a média foi 24%, o pior foi 134%
| desligado | |
| Ocioso | |
| Carga |
|
Key:
min: | |
| Lenovo ThinkCentre M910z-10NR000KUS i5-7500, HD Graphics 630, Toshiba NVMe THNSF5512GPUK, IPS, 1920x1080, 23.8" | HP Z1 G2 G1X47EA E3-1226 v3, Quadro K2100M, Micron M600 MTFDDAT256MBF mSATA, IPS LED, 2560x1440, 27" | Apple iMac Retina 5K 27 Late 2015 3.2 GHz M390 MK472D/A 6500, Radeon R9 M390, Apple Fusion Drive 1TB (24 GB SSD + 1 TB HDD), , 5120x2880, 27" | Lenovo ThinkPad T470p-20J7S00000 i7-7700HQ, GeForce 940MX, Samsung PM961 NVMe MZVLW512HMJP, IPS, 2560x1440, 14" | Dell Latitude 5580 i5-7300U, HD Graphics 620, Toshiba MQ01ACF050, IPS, 1920x1080, 15.6" | |
|---|---|---|---|---|---|
| Power Consumption | -109% | -119% | 43% | 63% | |
| Idle Minimum * (Watt) | 14.4 | 36.8 -156% | 29.5 -105% | 3.8 74% | 4.3 70% |
| Idle Average * (Watt) | 29.4 | 65.3 -122% | 59.2 -101% | 6.5 78% | 10.1 66% |
| Idle Maximum * (Watt) | 29.7 | 67 -126% | 68 -129% | 7.2 76% | 11.8 60% |
| Load Average * (Watt) | 64.1 | 114 -78% | 126 -97% | 62.5 2% | 32 50% |
| Load Maximum * (Watt) | 88.4 | 142 -61% | 231 -161% | 99.6 -13% | 29 67% |
* ... menor é melhor
Pro
Contra
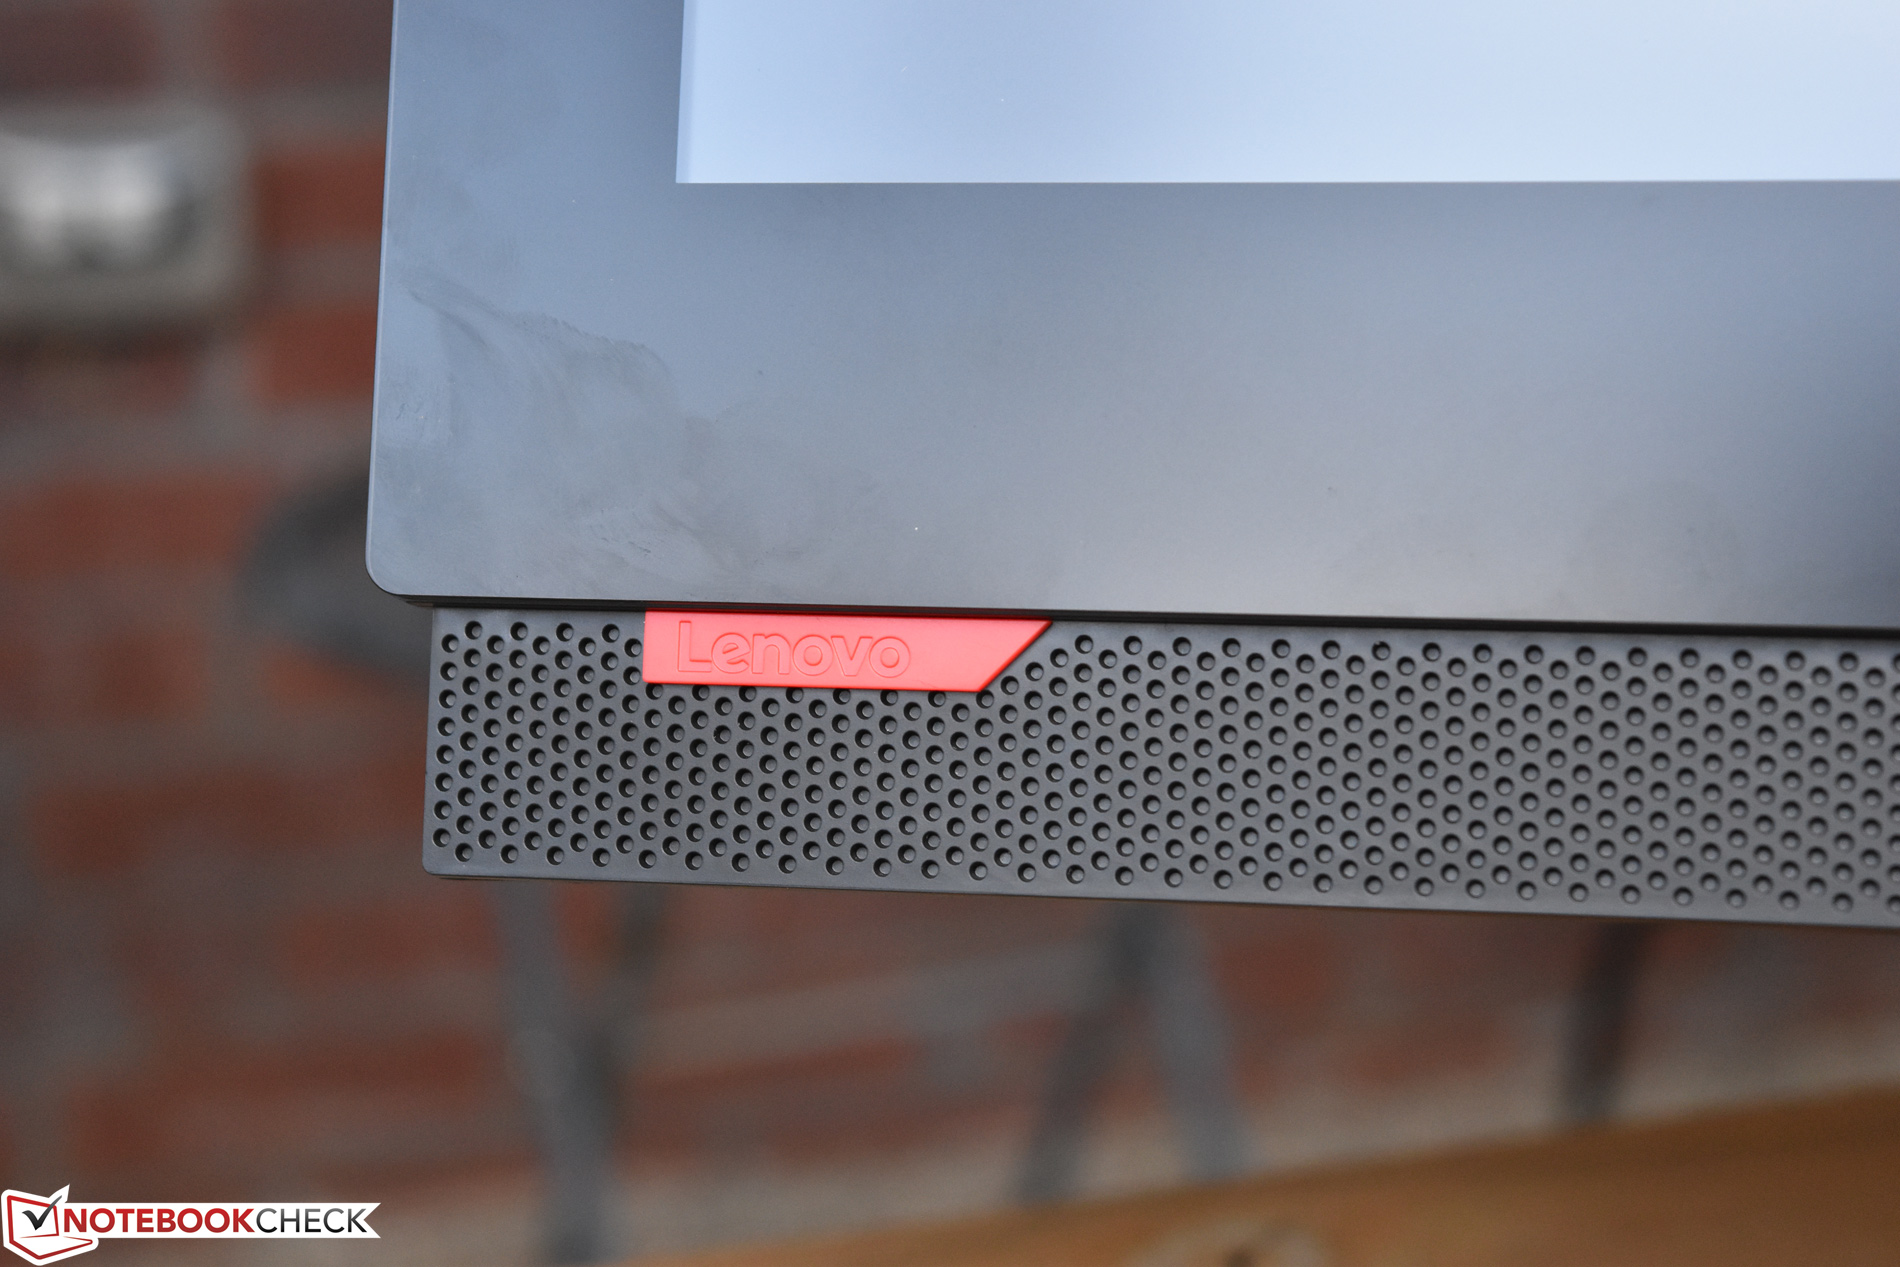
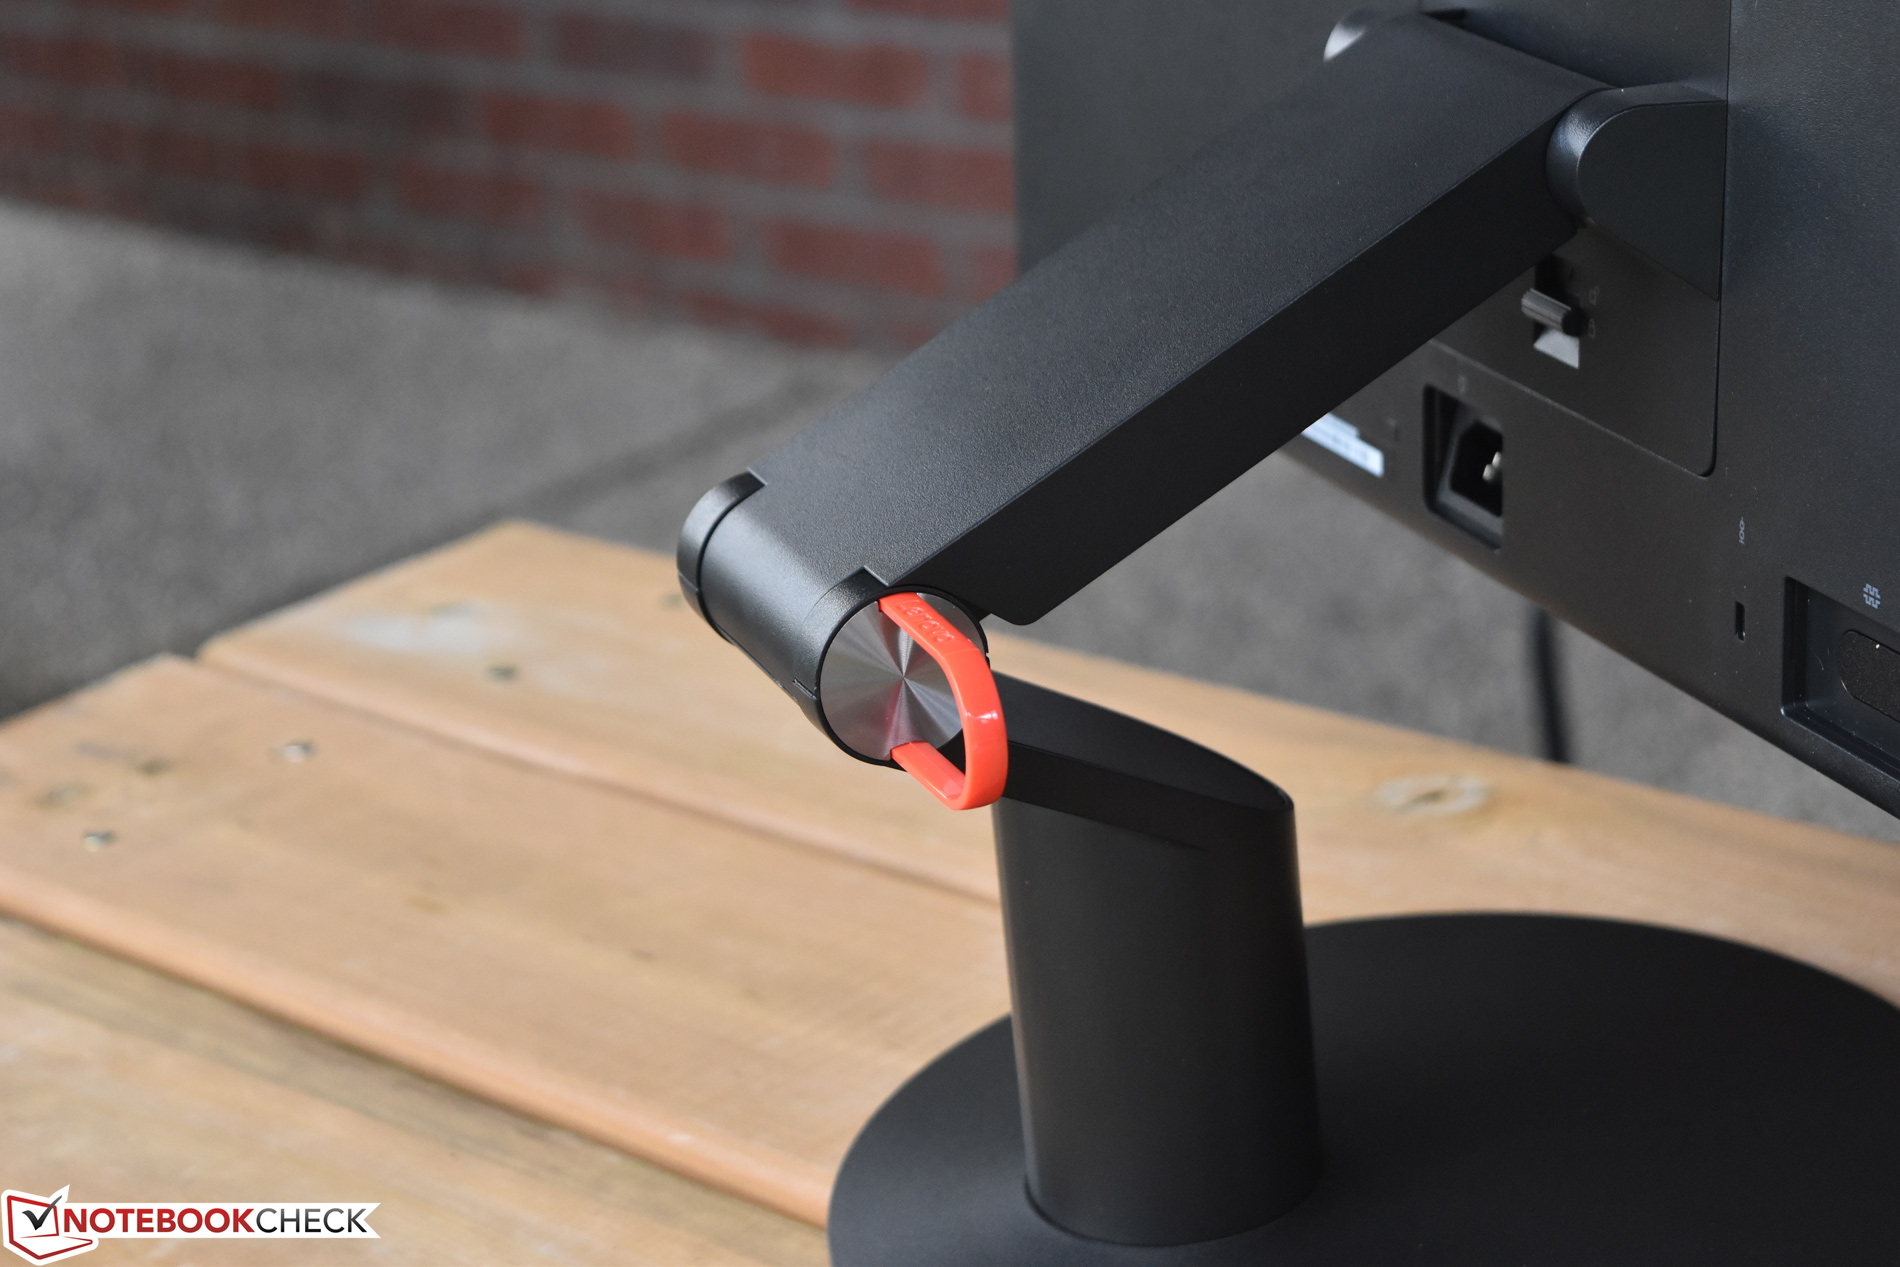
Os desktops empresariais, incluindo o todo-em-um, fazem parte de um mercado que é mais fácil de analisar do que o mercado lotado e diverso de portáteis de negócios. Aliás, não há nada particularmente interessante sobre o ThinkCentre M910z (nossa configuração: $1.285), que vai com segurança com um design funcional e discreto e verifica todas as caixas de uma máquina de escritório convencional.
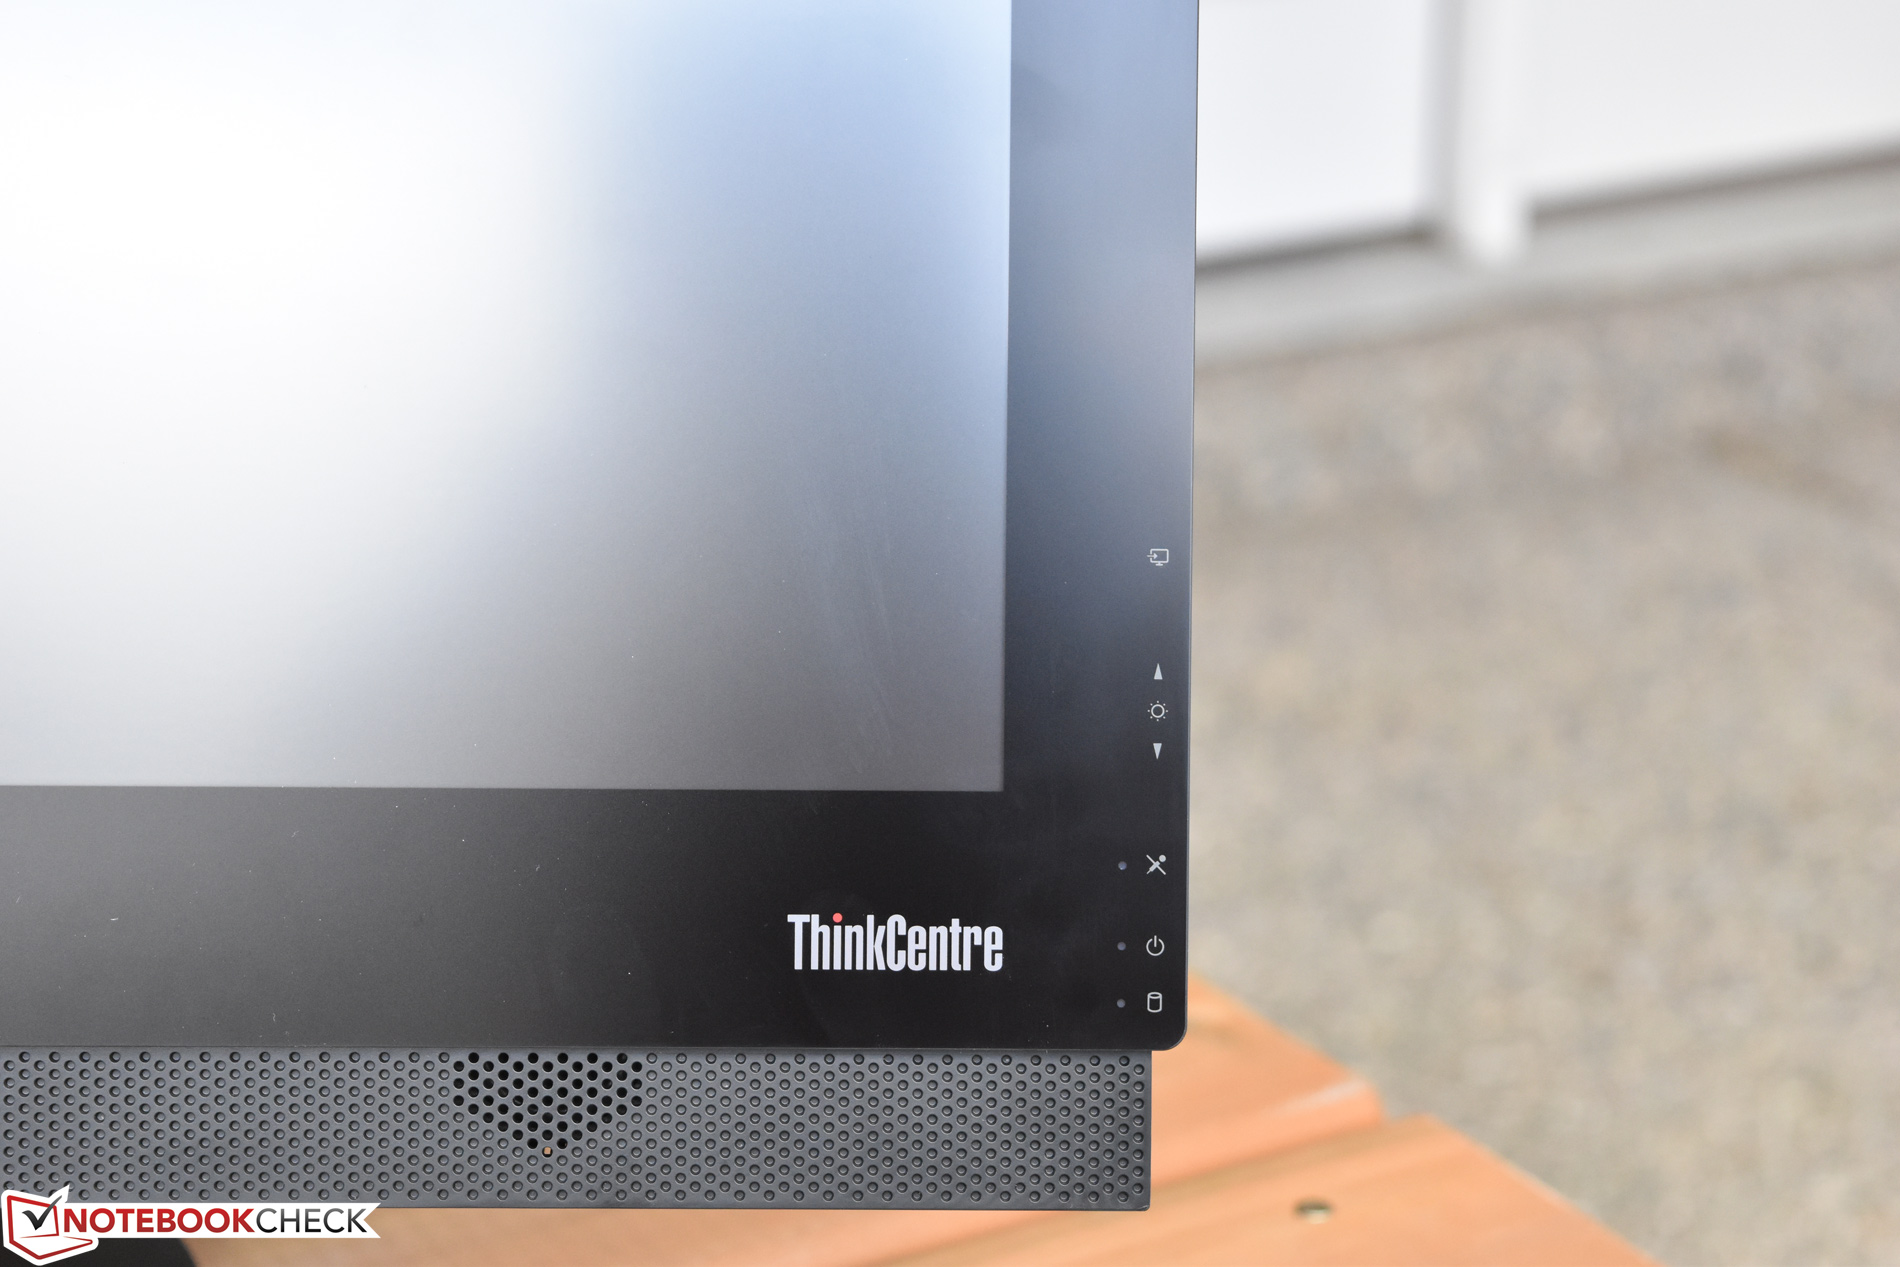
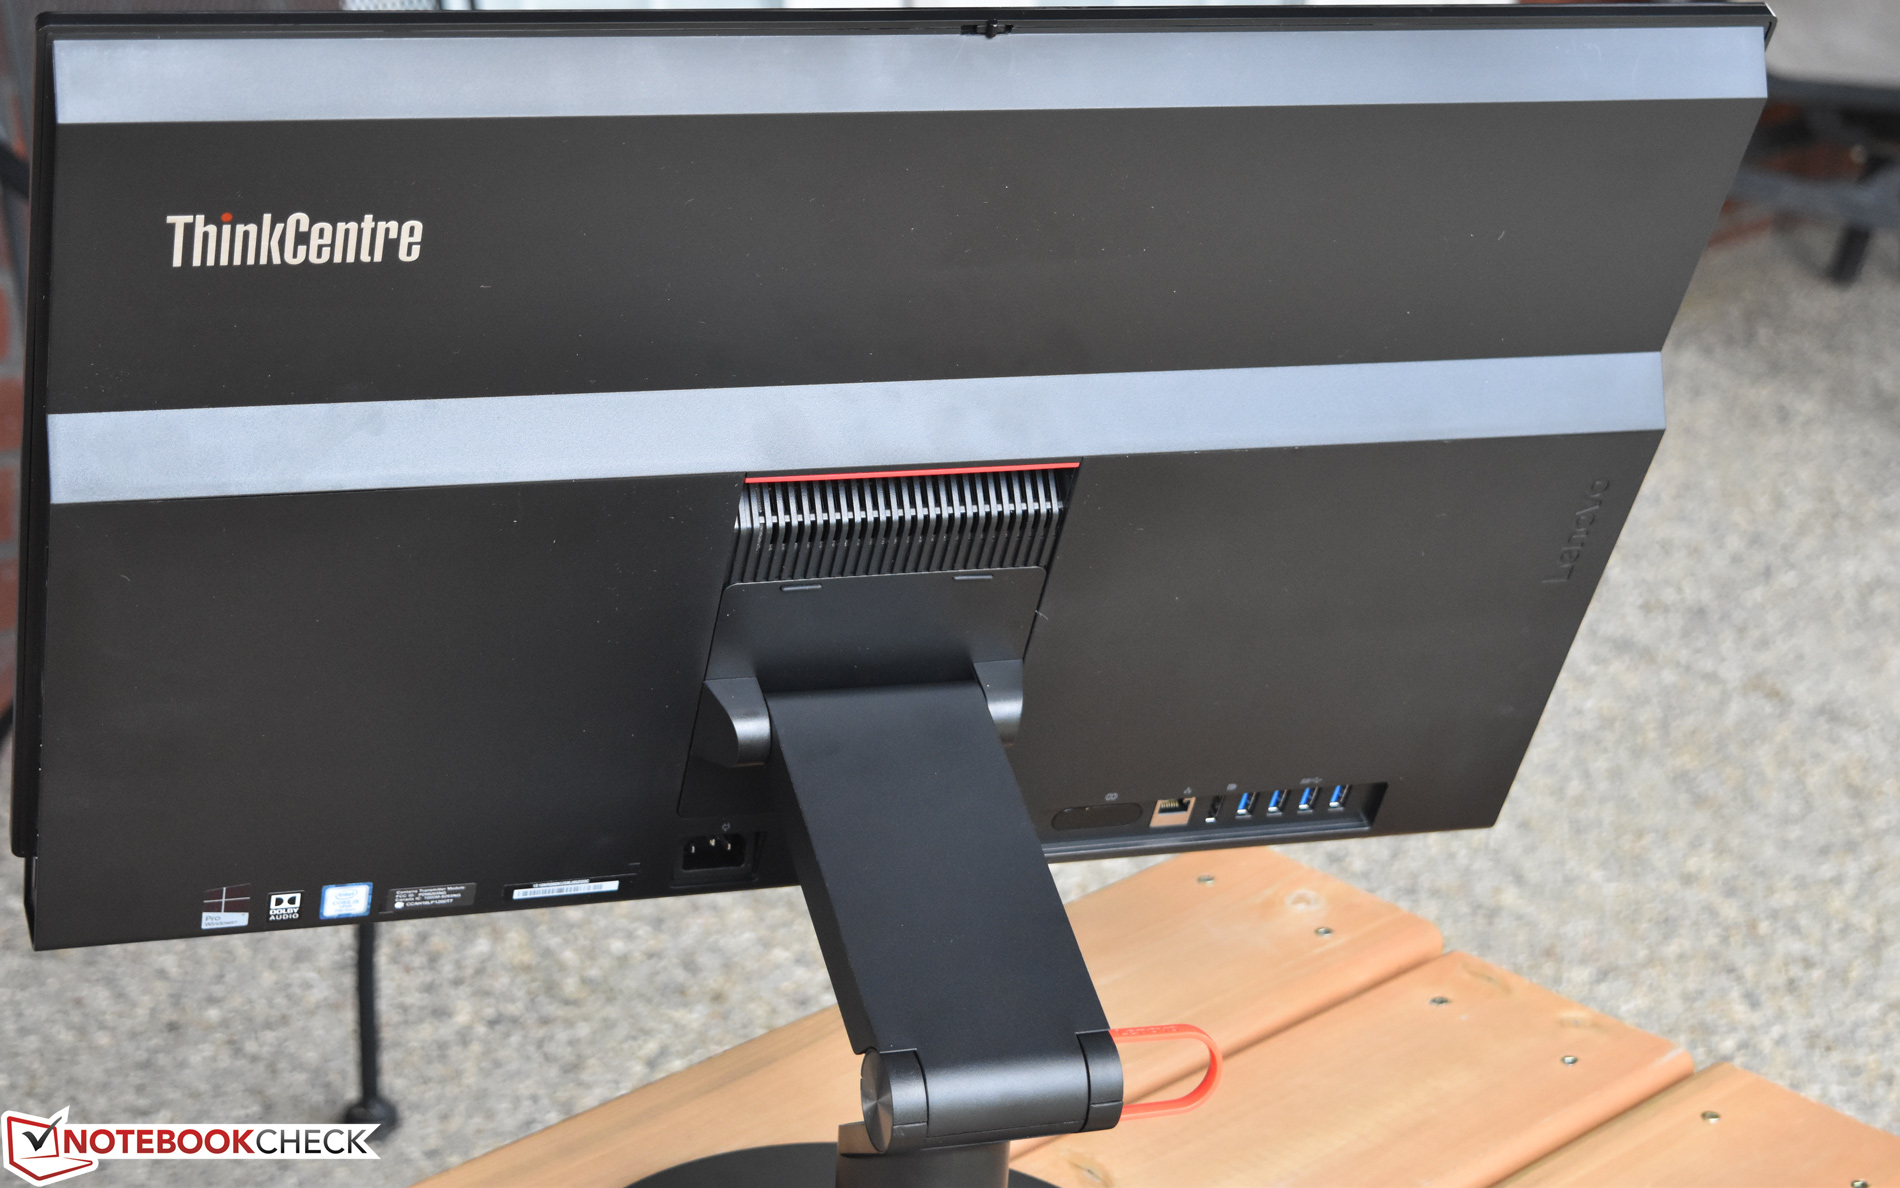
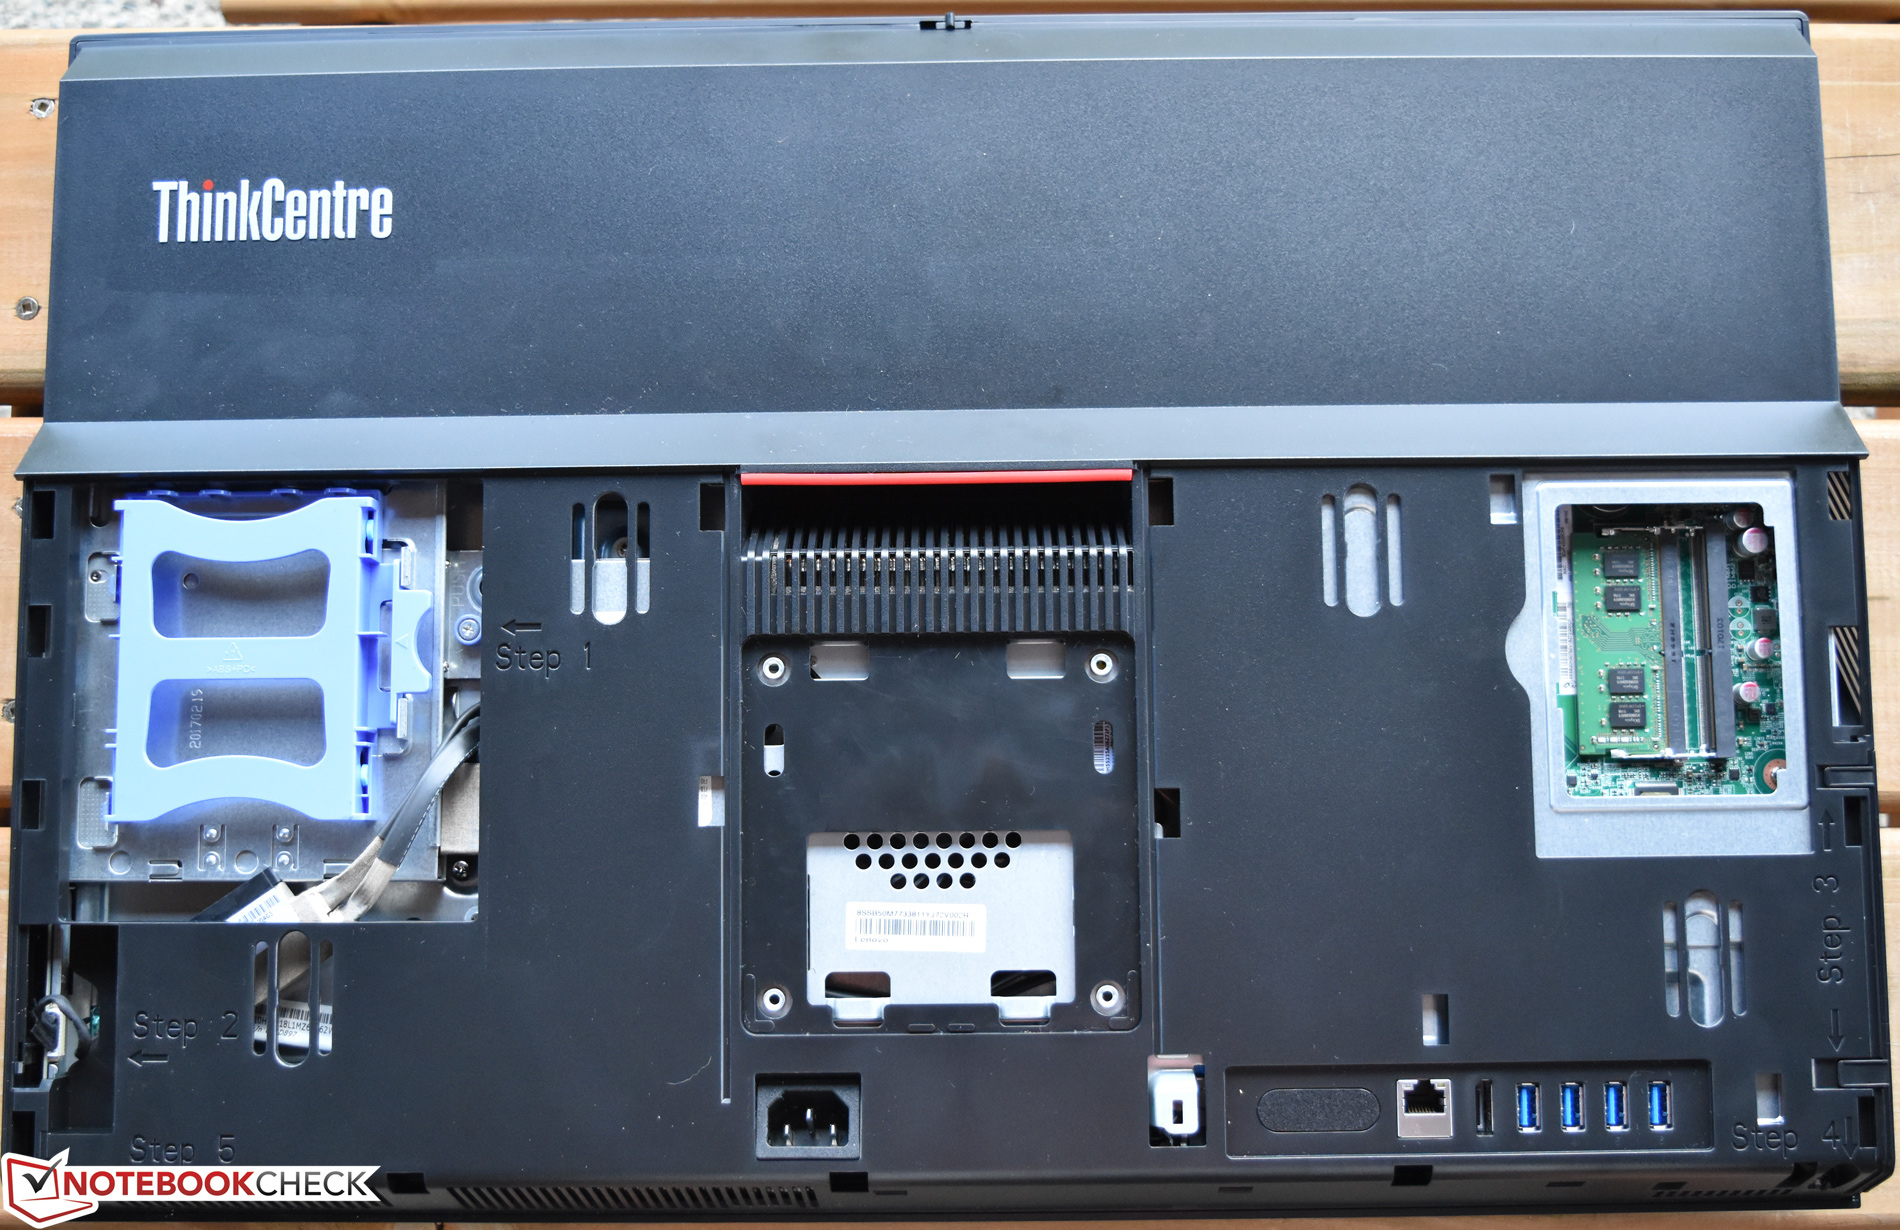
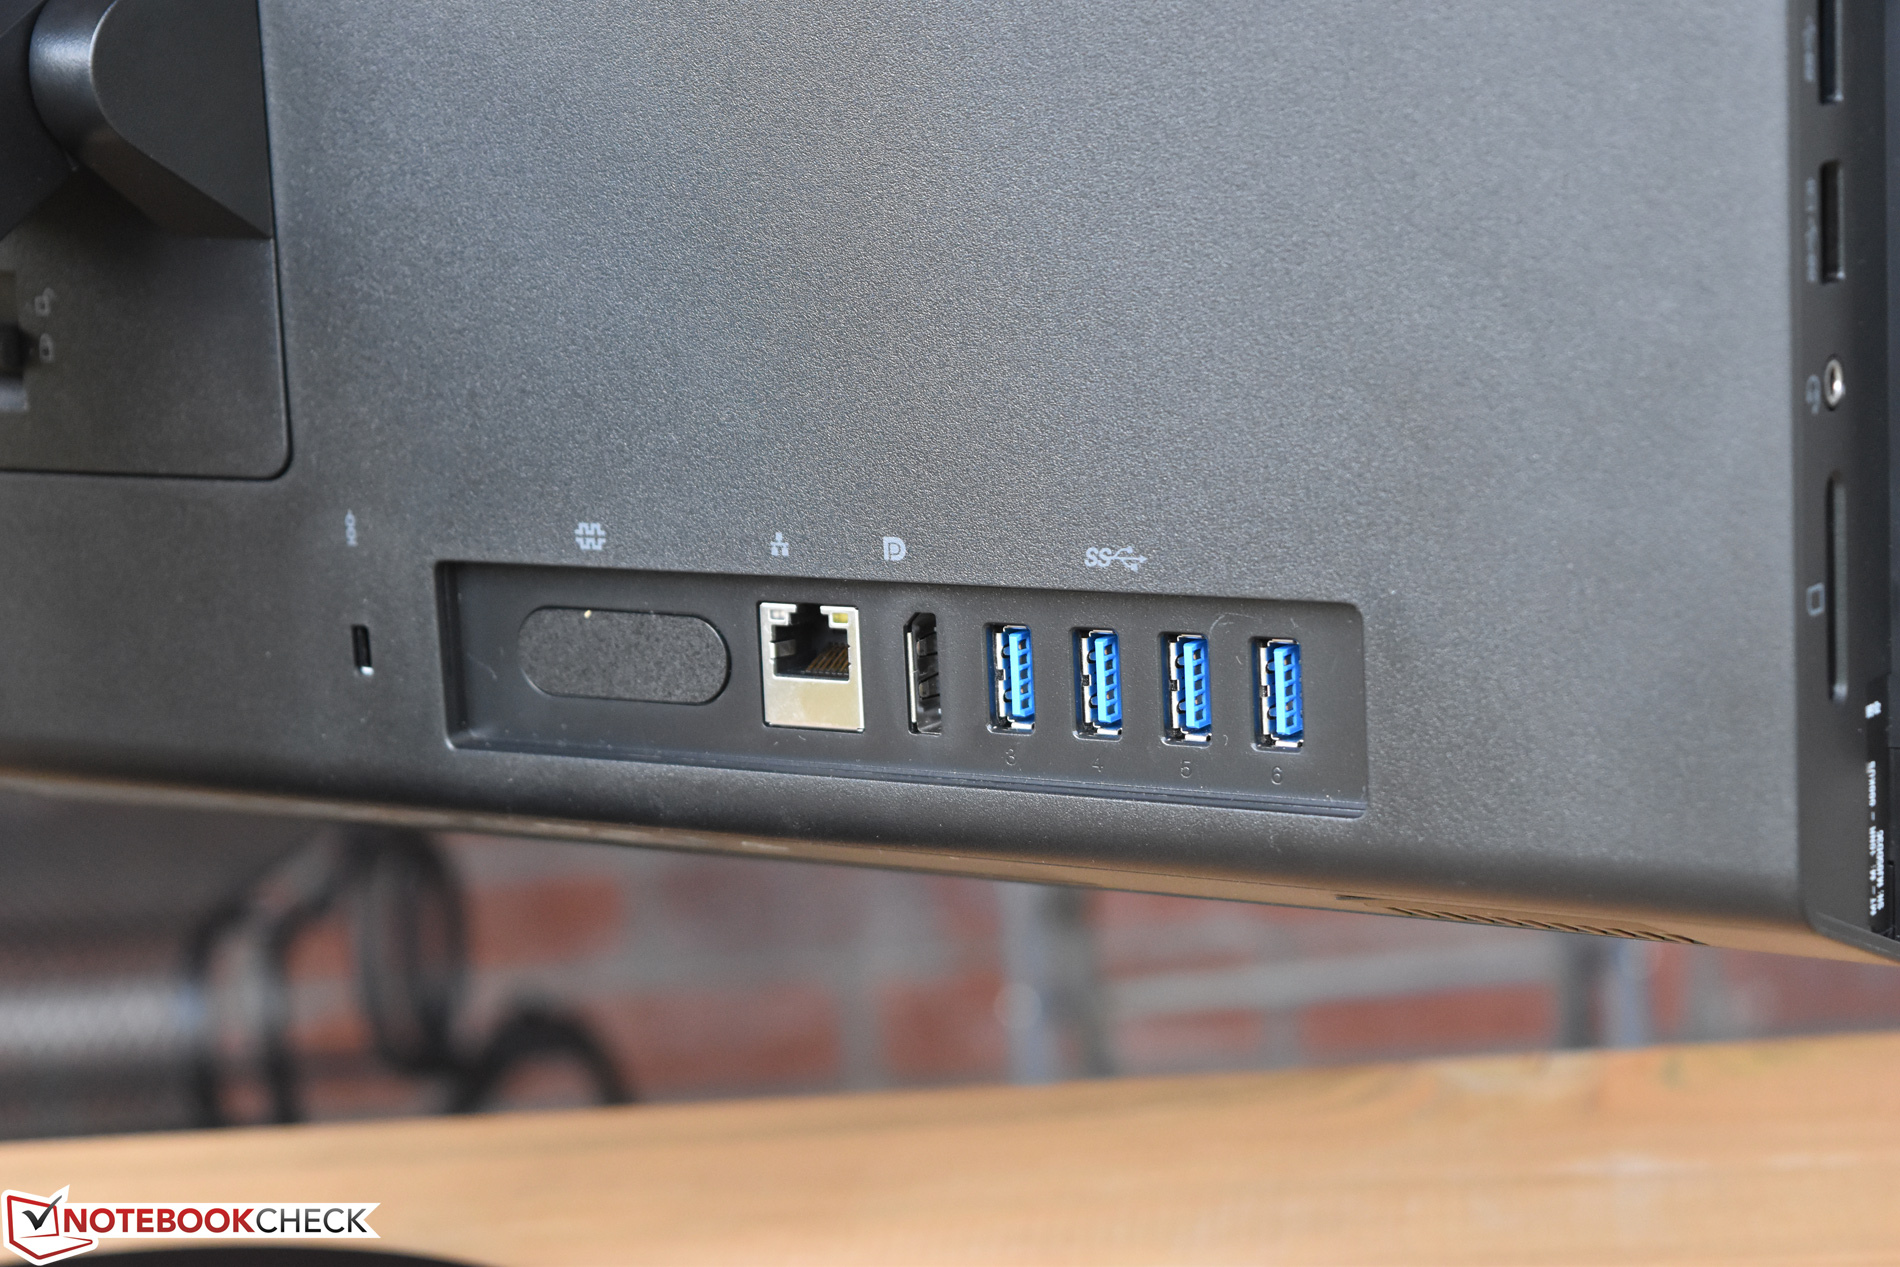
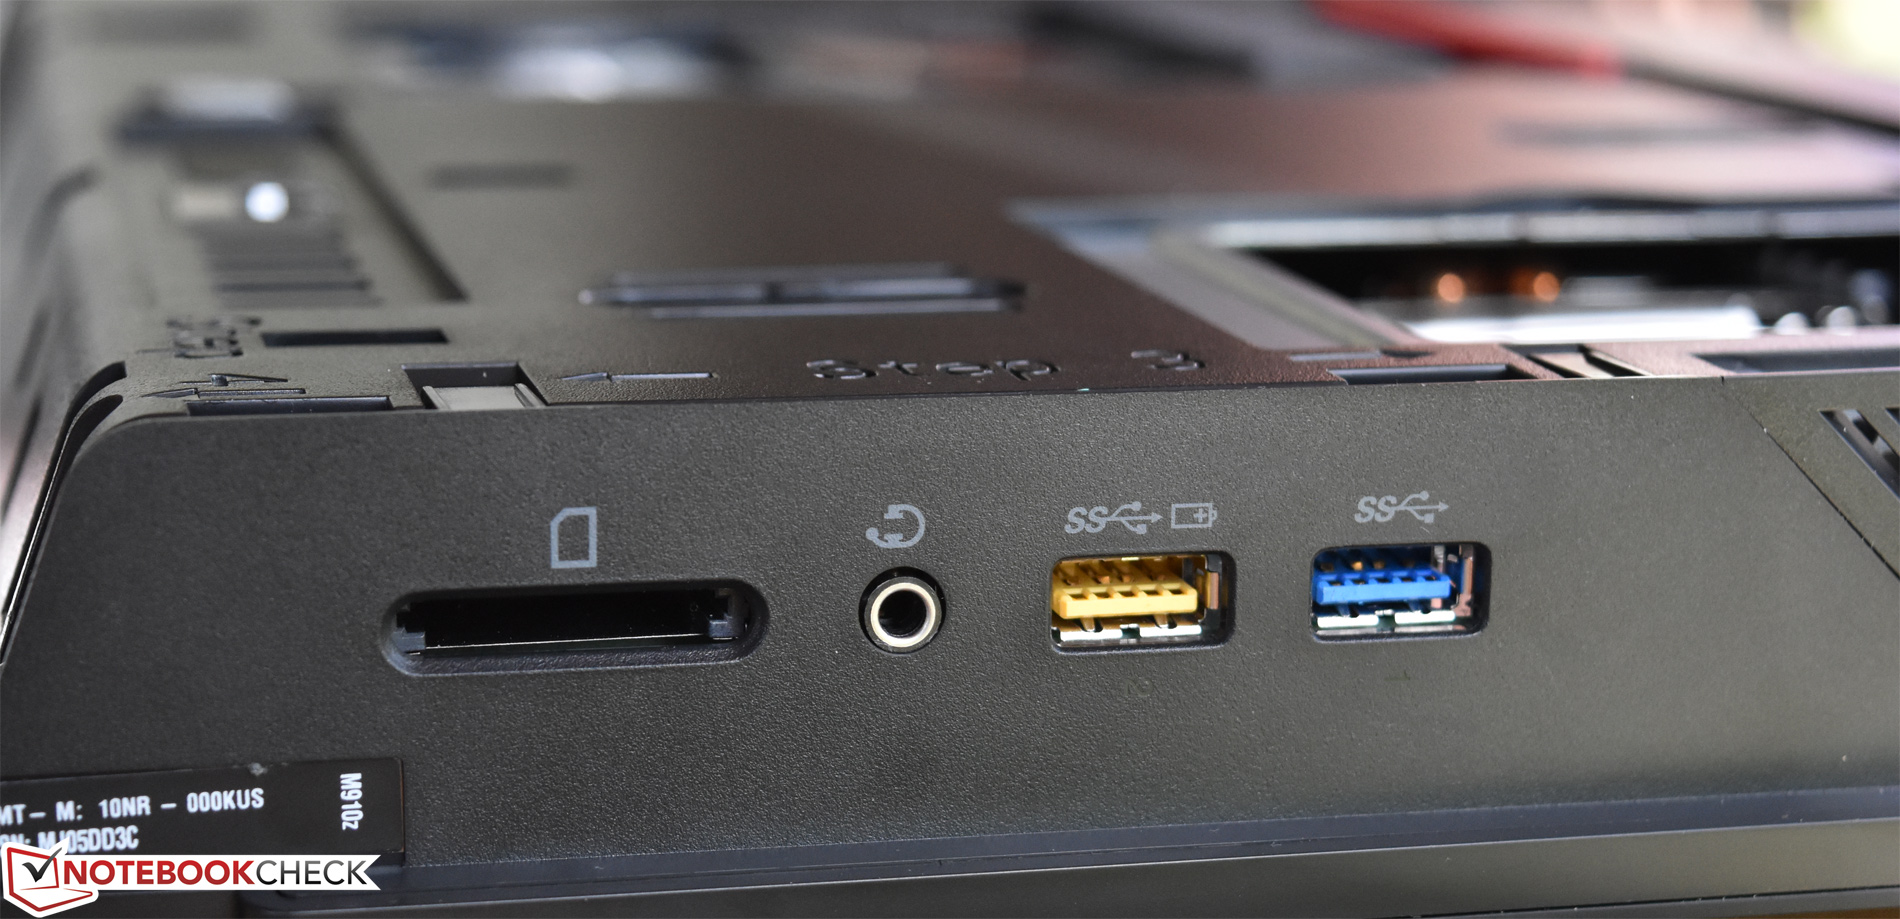
Mas isso não é ruim: de acordo com sua herança, o ThinkCentre faz o trabalho com um design de função sobre formato que oferece recursos tão apreciados quanto a manutenção e atualizações (relativamente) fáceis e um design de suporte de articulação versátil e robusto. Mas também é silencioso (mesmo sob carga), rápido em operação geral, graças à sua CPU quad-core e ao SSD NVMe, e possui um conjunto de alto-falantes que acreditam a reputação tipicamente pobre de seus irmãos empresariais com um bom som na maior parte do espectro (depois de um pouco de ajustes). A tela é um saco misto, graças principalmente a um brilho geral fraco e a uma camada de tela sensível ao toque (que coloca em questão se o comprador deve incomodar com interface de toque quando provavelmente é culpado por essa deficiência), mas pelo menos ela permanece anti refletiva mesmo quando configurado para tocar! Finalmente, o consumo de energia é confortavelmente baixo, então qualquer pessoa que considere a implantação em massa de uma frota de máquinas M910z deve estar tranquilo, pois a conta elétrica não aumentará terrivelmente.
Não há nada particularmente interessante sobre o ThinkCentre M910z, mas isso não é ruim; ele joga com segurança com um design funcional e discreto e verifica todas as caixas de verificação de uma máquina de escritório convencional.
Em última análise, não há grandes pontos negativos associados ao ThinkCentre M910z; é um desktop de negócios capaz que, apesar de não ter um design excitante, abrange todas as suas bases no mercado de negócios e é fácil de manter e implantar que deveria aproveitar o suporte de muitos departamentos de TI.
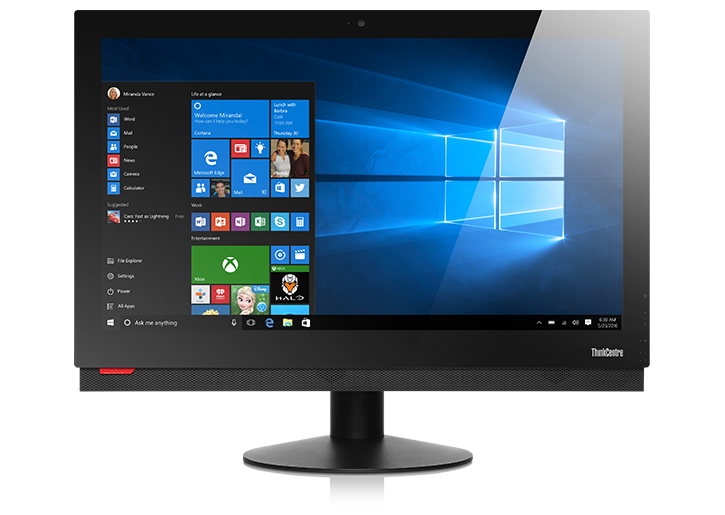
Lenovo ThinkCentre M910z-10NR000KUS
- 09/22/2017 v6 (old)
Steve Schardein
Price comparison
