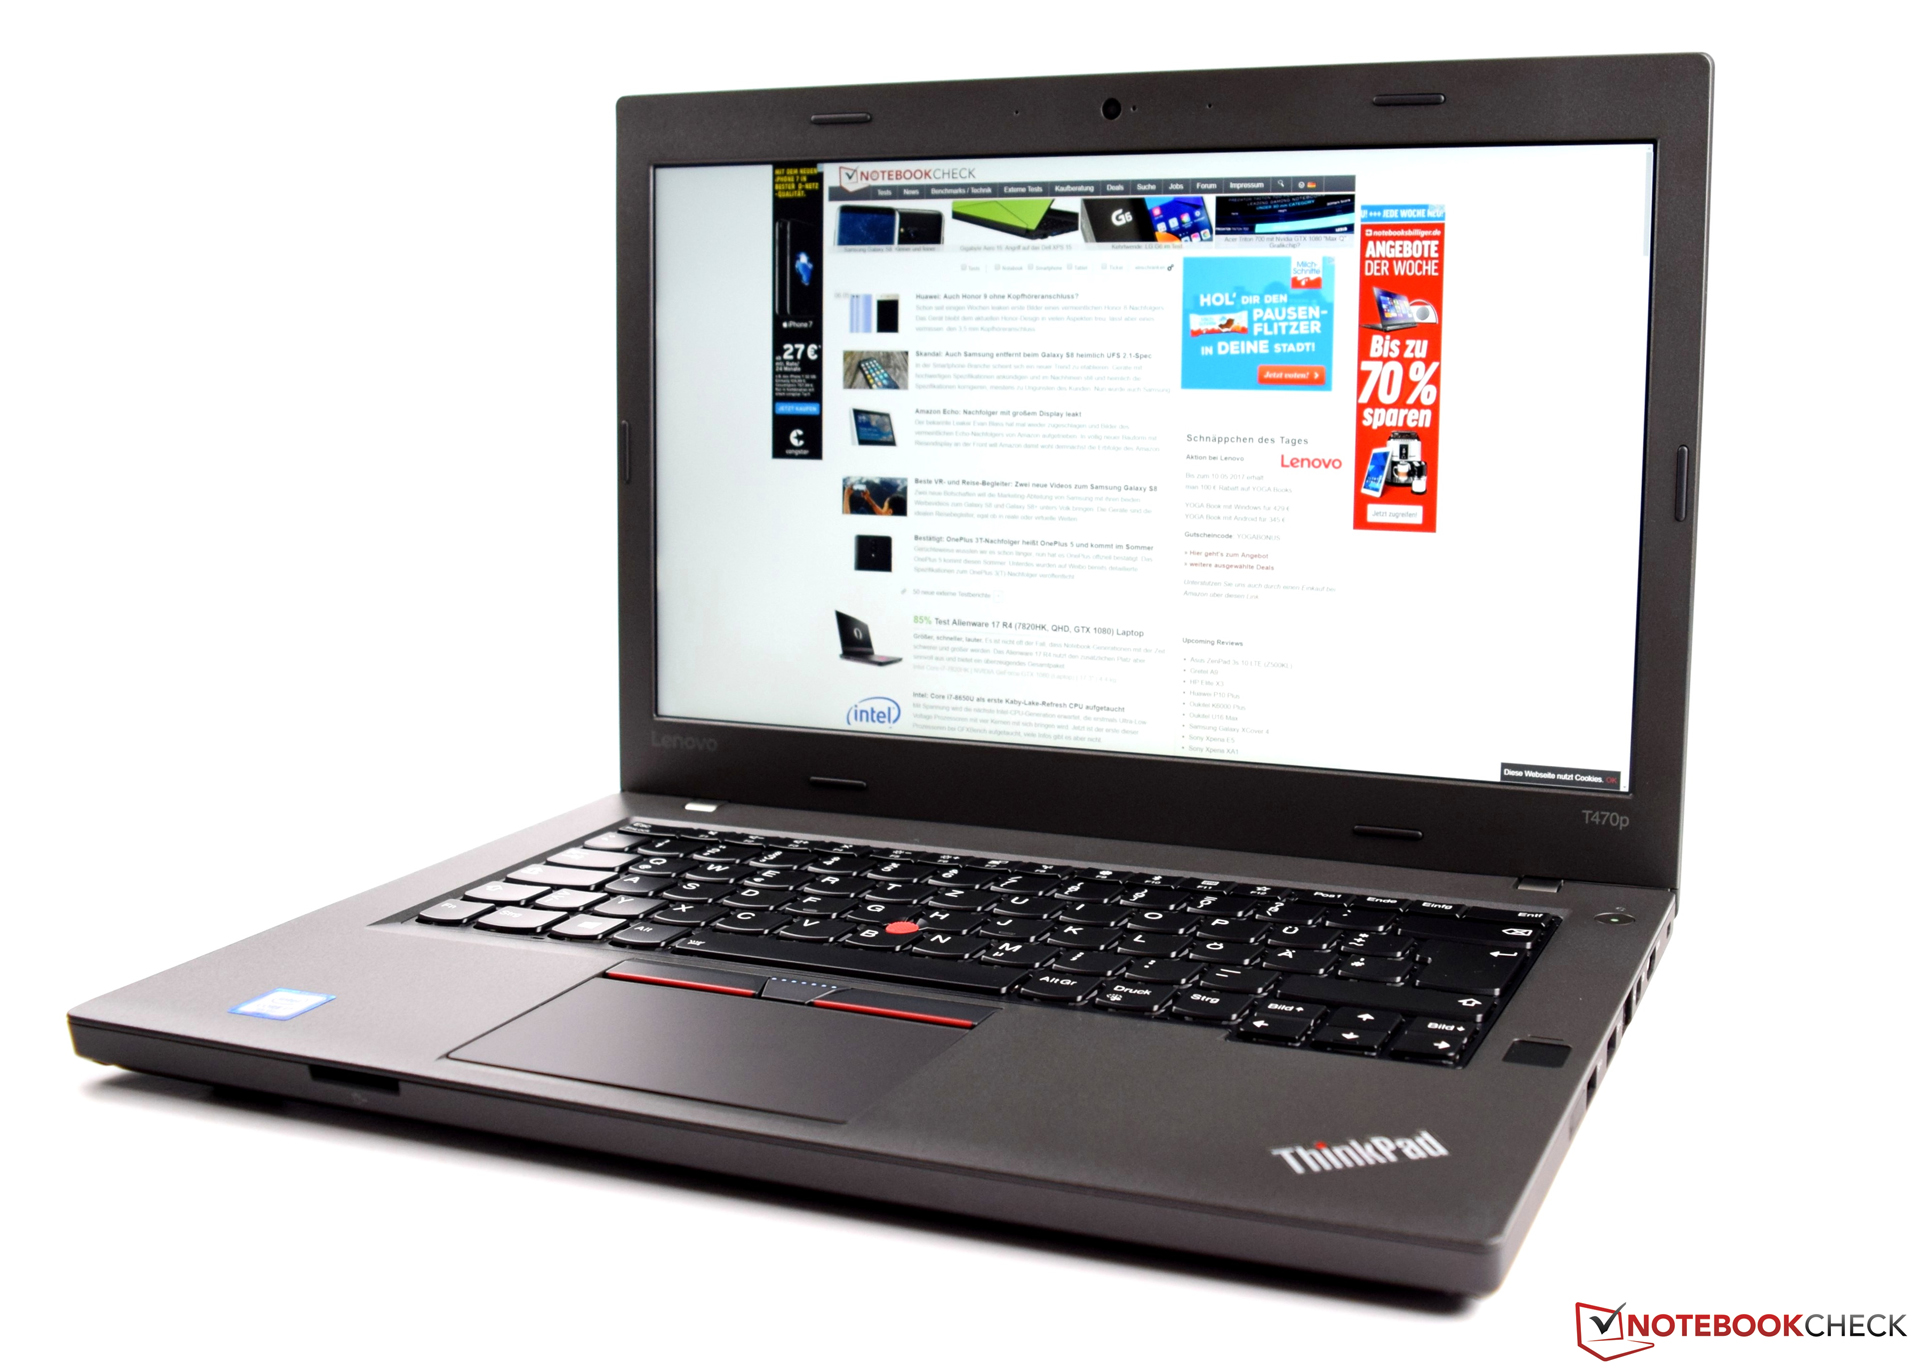
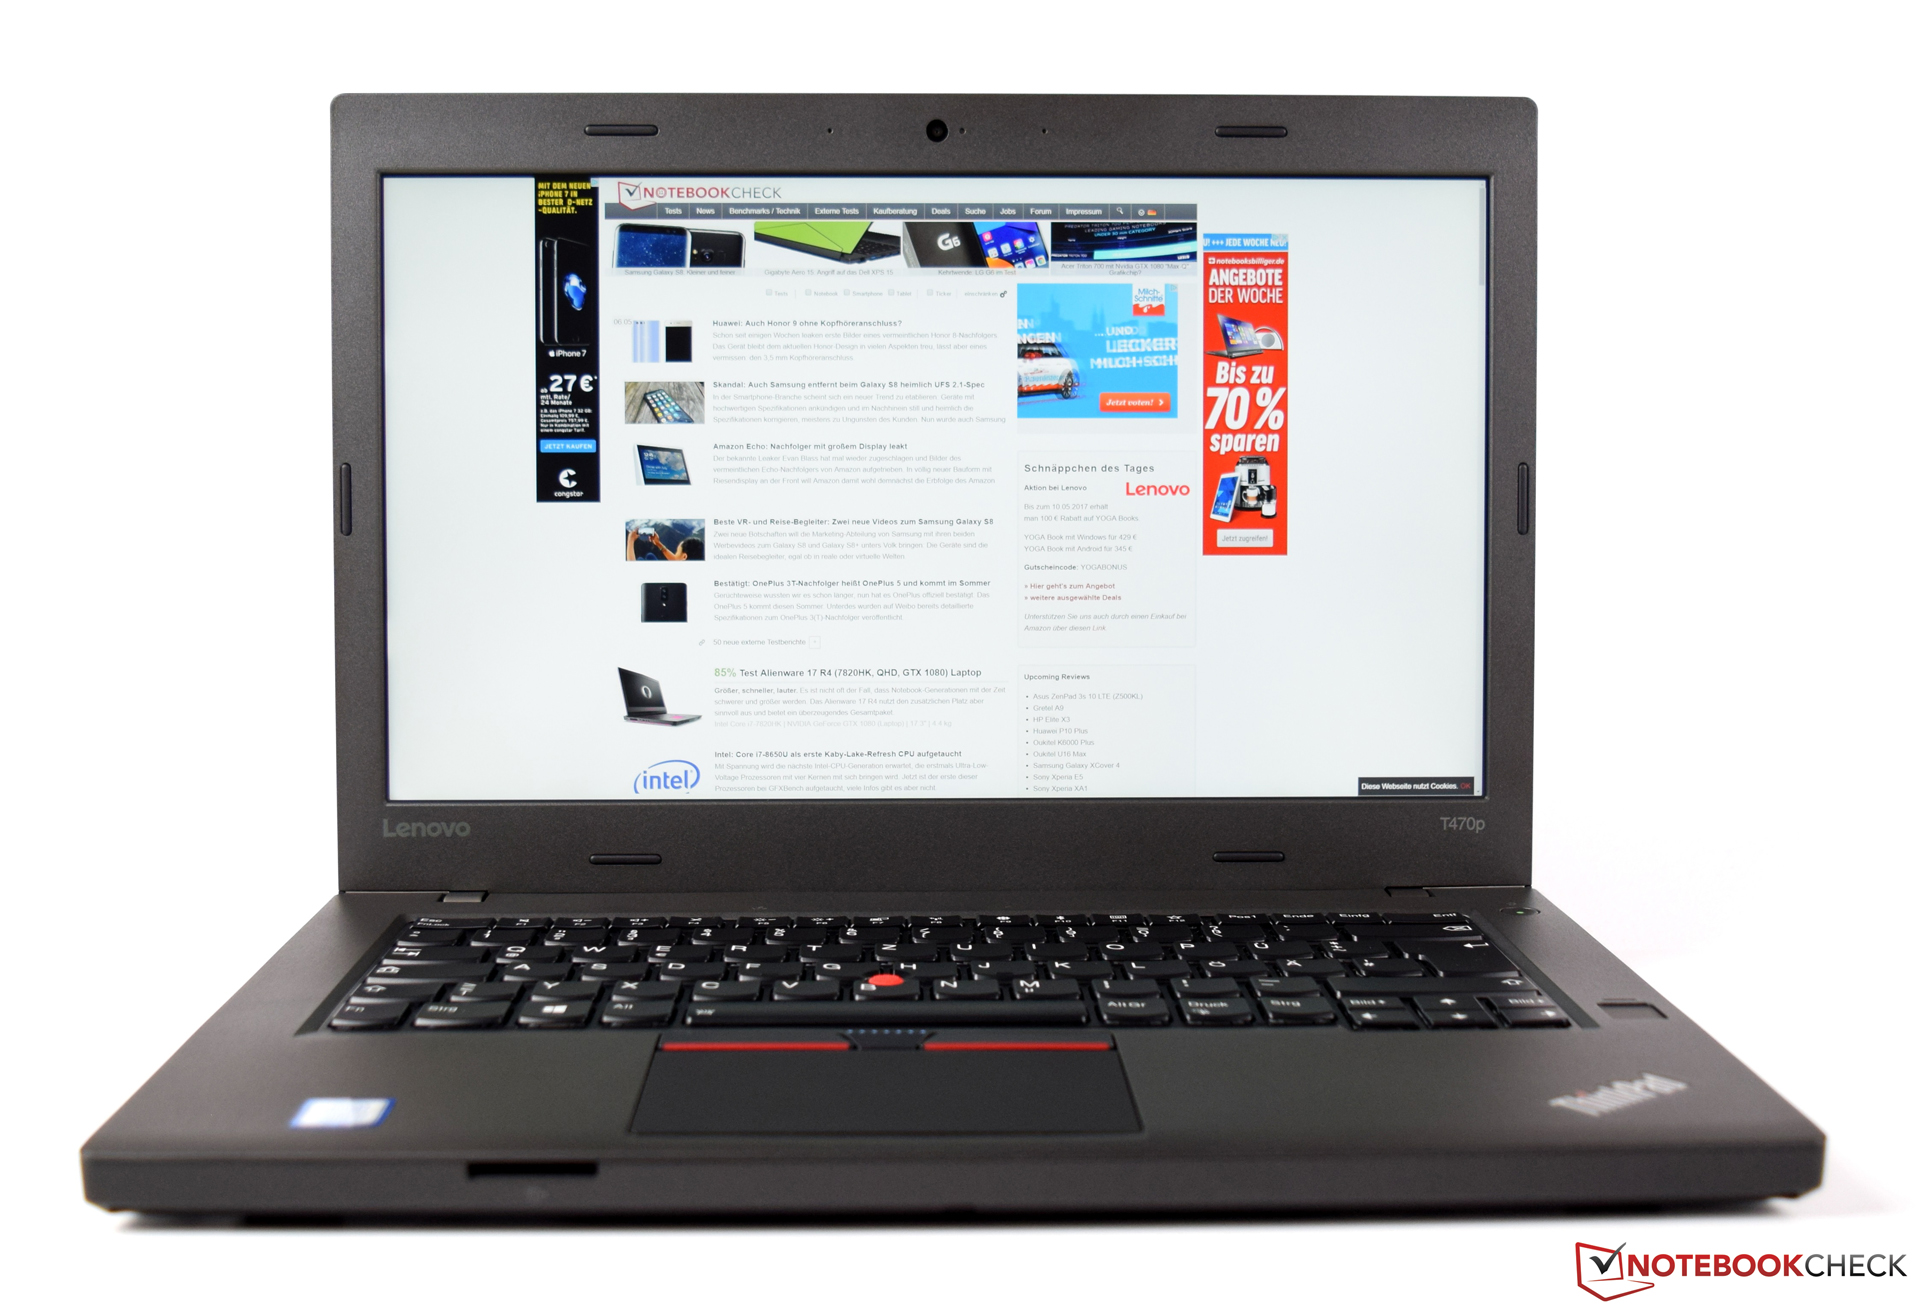
Breve Análise do Portátil Lenovo ThinkPad T470p (Core i7, GeForce 940MX)
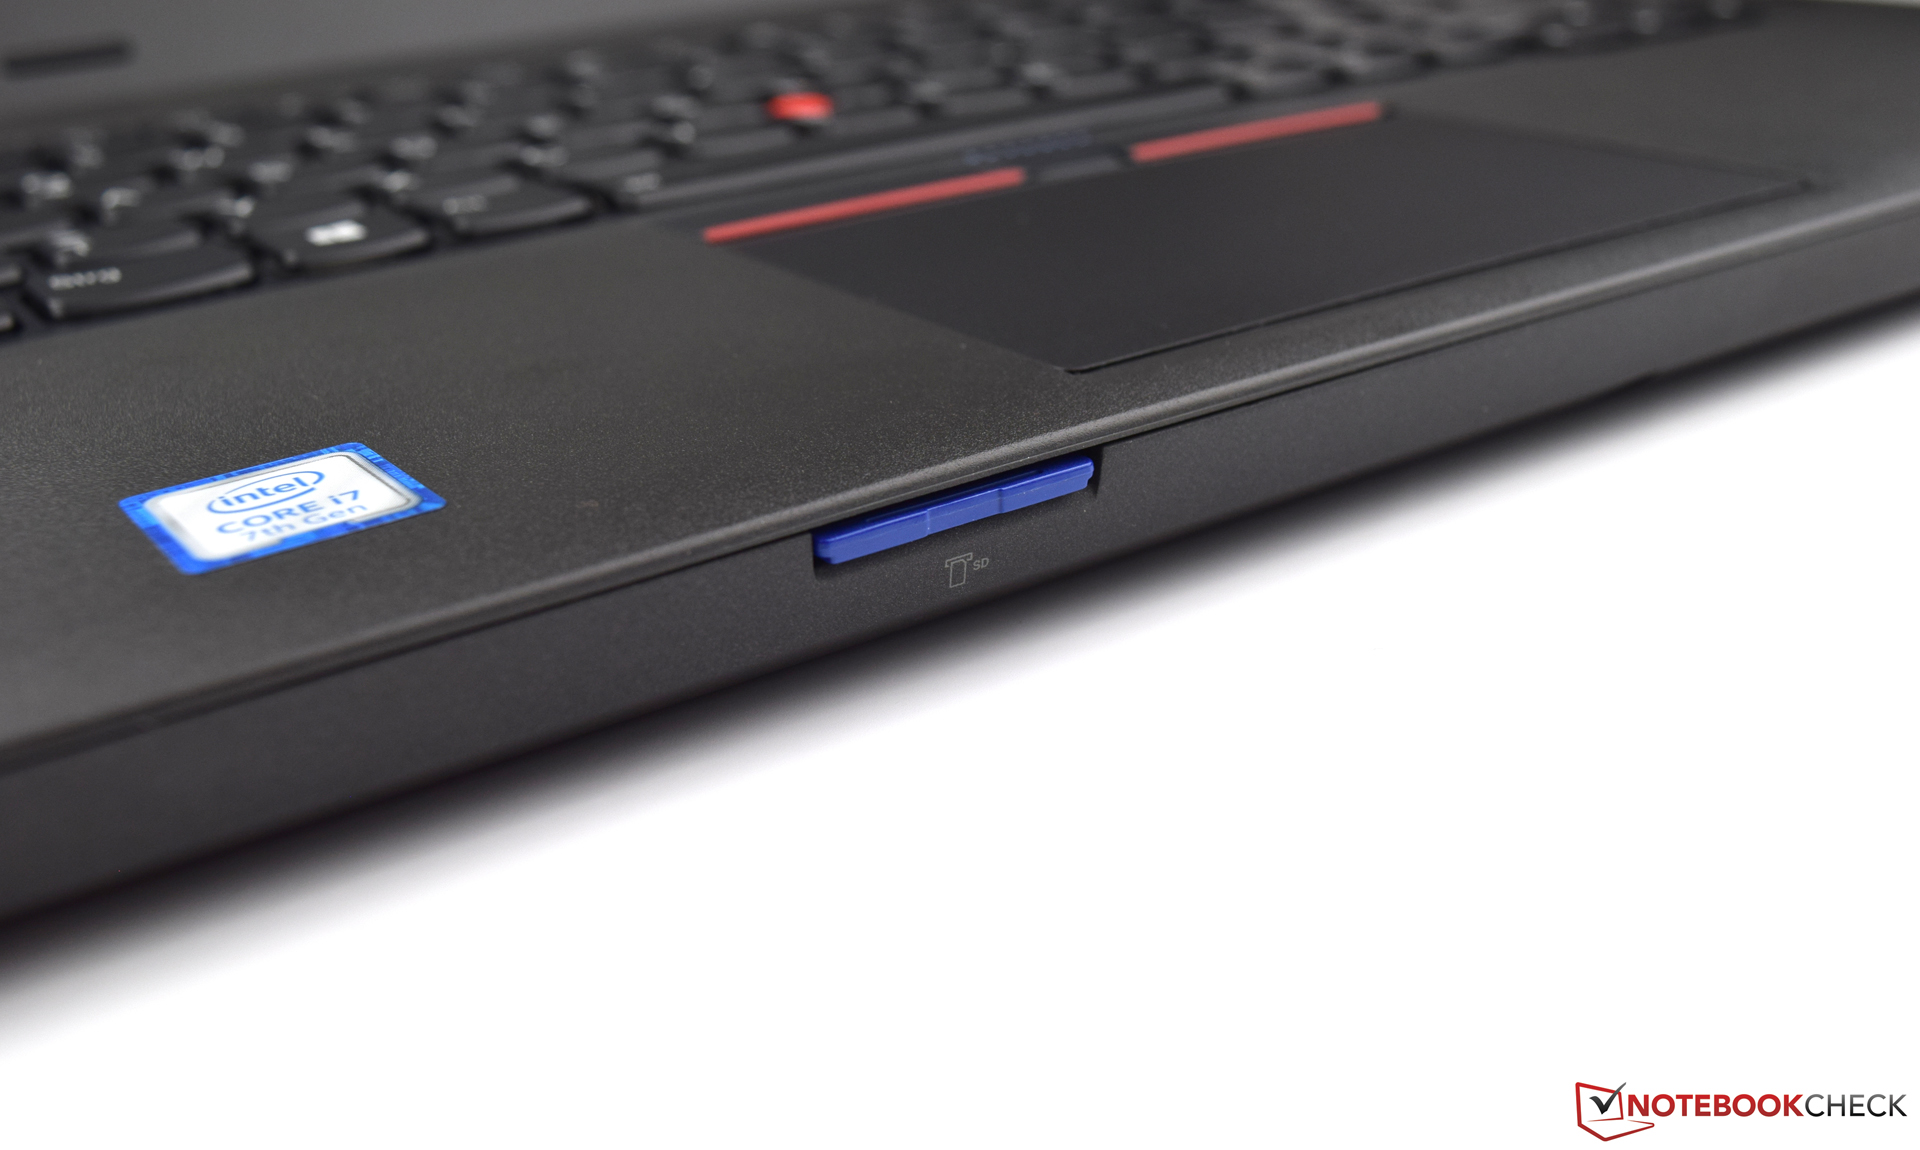
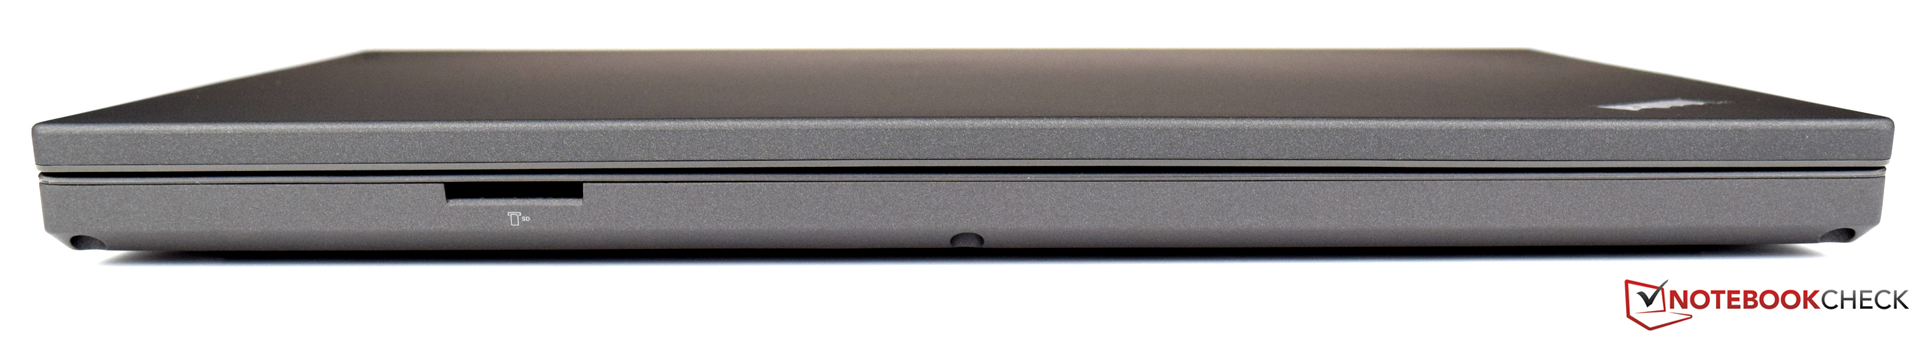
| SD Card Reader | |
| average JPG Copy Test (av. of 3 runs) | |
| Dell Latitude 14 E5470 | |
| Dell Latitude 5480 | |
| Lenovo ThinkPad T470-20HD002HGE | |
| HP EliteBook 840 G4-Z2V49ET ABD | |
| Lenovo ThinkPad T470p-20J7S00000 | |
| Lenovo ThinkPad T460p-20FXS05500 | |
| maximum AS SSD Seq Read Test (1GB) | |
| Dell Latitude 5480 | |
| Dell Latitude 14 E5470 | |
| Lenovo ThinkPad T470-20HD002HGE | |
| Lenovo ThinkPad T470p-20J7S00000 | |
| HP EliteBook 840 G4-Z2V49ET ABD | |
| Lenovo ThinkPad T460p-20FXS05500 | |
| Networking | |
| iperf3 transmit AX12 | |
| Lenovo ThinkPad T470-20HD002HGE | |
| HP EliteBook 840 G4-Z2V49ET ABD (jseb) | |
| Lenovo ThinkPad T470p-20J7S00000 | |
| Dell Latitude 5480 | |
| Dell Latitude 14 E5470 (jseb) | |
| iperf3 receive AX12 | |
| Lenovo ThinkPad T470-20HD002HGE | |
| Dell Latitude 5480 | |
| Dell Latitude 14 E5470 (jseb) | |
| HP EliteBook 840 G4-Z2V49ET ABD (jseb) | |
| Lenovo ThinkPad T470p-20J7S00000 | |
| |||||||||||||||||||||||||
iluminação: 87 %
iluminação com acumulador: 267 cd/m²
Contraste: 1084:1 (Preto: 0.25 cd/m²)
ΔE ColorChecker Calman: 6.68 | ∀{0.5-29.43 Ø4.71}
ΔE Greyscale Calman: 9.21 | ∀{0.09-98 Ø4.96}
94.72% sRGB (Argyll 1.6.3 3D)
61.49% AdobeRGB 1998 (Argyll 1.6.3 3D)
69.5% AdobeRGB 1998 (Argyll 3D)
94.9% sRGB (Argyll 3D)
69.3% Display P3 (Argyll 3D)
Gamma: 2.42
CCT: 6018 K
| Lenovo ThinkPad T470p-20J7S00000 IPS, 2560x1440, 14" | Lenovo ThinkPad T460p-20FXS05500 IPS-Panel, 2560x1440, 14" | Dell Latitude 14 E5470 AH-IPS, WLED, 1920x1080, 14" | Dell Latitude 5480 IPS, 1920x1080, 14" | HP EliteBook 840 G4-Z2V49ET ABD TN, 1920x1080, 14" | Lenovo ThinkPad T470-20HD002HGE IPS, 1920x1080, 14" | |
|---|---|---|---|---|---|---|
| Display | -1% | -9% | -39% | -17% | -38% | |
| Display P3 Coverage (%) | 69.3 | 66.9 -3% | 64.8 -6% | 40.62 -41% | 55.8 -19% | 41.6 -40% |
| sRGB Coverage (%) | 94.9 | 96.5 2% | 84.8 -11% | 61.2 -36% | 80.7 -15% | 61.9 -35% |
| AdobeRGB 1998 Coverage (%) | 69.5 | 68.8 -1% | 62 -11% | 41.96 -40% | 57.7 -17% | 43.06 -38% |
| Response Times | 17% | 15% | 20% | 20% | -3% | |
| Response Time Grey 50% / Grey 80% * (ms) | 52.8 ? | 38.4 ? 27% | 39 ? 26% | 32.8 ? 38% | 39 ? 26% | 41.6 ? 21% |
| Response Time Black / White * (ms) | 26.8 ? | 24.8 ? 7% | 26 ? 3% | 26.4 ? 1% | 23 ? 14% | 34 ? -27% |
| PWM Frequency (Hz) | 220 | |||||
| Screen | 11% | -2% | -4% | -35% | -4% | |
| Brightness middle (cd/m²) | 271 | 290 7% | 323 19% | 215.9 -20% | 346 28% | 306 13% |
| Brightness (cd/m²) | 266 | 280 5% | 316 19% | 205 -23% | 317 19% | 287 8% |
| Brightness Distribution (%) | 87 | 93 7% | 79 -9% | 90 3% | 86 -1% | 88 1% |
| Black Level * (cd/m²) | 0.25 | 0.31 -24% | 0.57 -128% | 0.22 12% | 0.86 -244% | 0.3 -20% |
| Contrast (:1) | 1084 | 935 -14% | 567 -48% | 981 -10% | 402 -63% | 1020 -6% |
| Colorchecker dE 2000 * | 6.68 | 3.88 42% | 3.68 45% | 5.1 24% | 8.64 -29% | 6.2 7% |
| Colorchecker dE 2000 max. * | 12.96 | 8.19 37% | 8.33 36% | 15.6 -20% | 13.58 -5% | 13.6 -5% |
| Greyscale dE 2000 * | 9.21 | 5.47 41% | 2.99 68% | 4 57% | 11.24 -22% | 5.8 37% |
| Gamma | 2.42 91% | 2.33 94% | 2.49 88% | 2.41 91% | 2.62 84% | 2.04 108% |
| CCT | 6018 108% | 6469 100% | 6572 99% | 6856 95% | 12530 52% | 6277 104% |
| Color Space (Percent of AdobeRGB 1998) (%) | 61.49 | 63.3 3% | 55 -11% | 41.96 -32% | 52 -15% | 39.62 -36% |
| Color Space (Percent of sRGB) (%) | 94.72 | 96.64 2% | 85 -10% | 61.15 -35% | 80 -16% | 61.44 -35% |
| Média Total (Programa/Configurações) | 9% /
9% | 1% /
-1% | -8% /
-8% | -11% /
-24% | -15% /
-10% |
* ... menor é melhor
Exibir tempos de resposta
| ↔ Tempo de resposta preto para branco | ||
|---|---|---|
| 26.8 ms ... ascensão ↗ e queda ↘ combinadas | ↗ 6.4 ms ascensão | 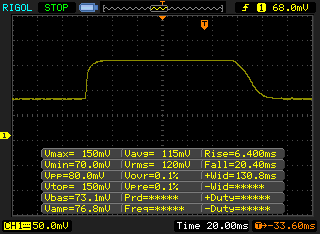 |
| ↘ 20.4 ms queda | ||
| A tela mostra taxas de resposta relativamente lentas em nossos testes e pode ser muito lenta para os jogadores. Em comparação, todos os dispositivos testados variam de 0.1 (mínimo) a 240 (máximo) ms. » 67 % de todos os dispositivos são melhores. Isso significa que o tempo de resposta medido é pior que a média de todos os dispositivos testados (19.8 ms). | ||
| ↔ Tempo de resposta 50% cinza a 80% cinza | ||
| 52.8 ms ... ascensão ↗ e queda ↘ combinadas | ↗ 19.6 ms ascensão | 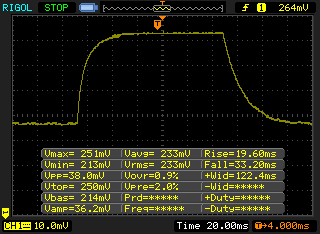 |
| ↘ 33.2 ms queda | ||
| A tela mostra taxas de resposta lentas em nossos testes e será insatisfatória para os jogadores. Em comparação, todos os dispositivos testados variam de 0.165 (mínimo) a 636 (máximo) ms. » 89 % de todos os dispositivos são melhores. Isso significa que o tempo de resposta medido é pior que a média de todos os dispositivos testados (30.9 ms). | ||
Cintilação da tela / PWM (modulação por largura de pulso)
| Tela tremeluzindo / PWM não detectado | ||
[pwm_comparison] Em comparação: 52 % de todos os dispositivos testados não usam PWM para escurecer a tela. Se PWM foi detectado, uma média de 7744 (mínimo: 5 - máximo: 343500) Hz foi medida. | ||
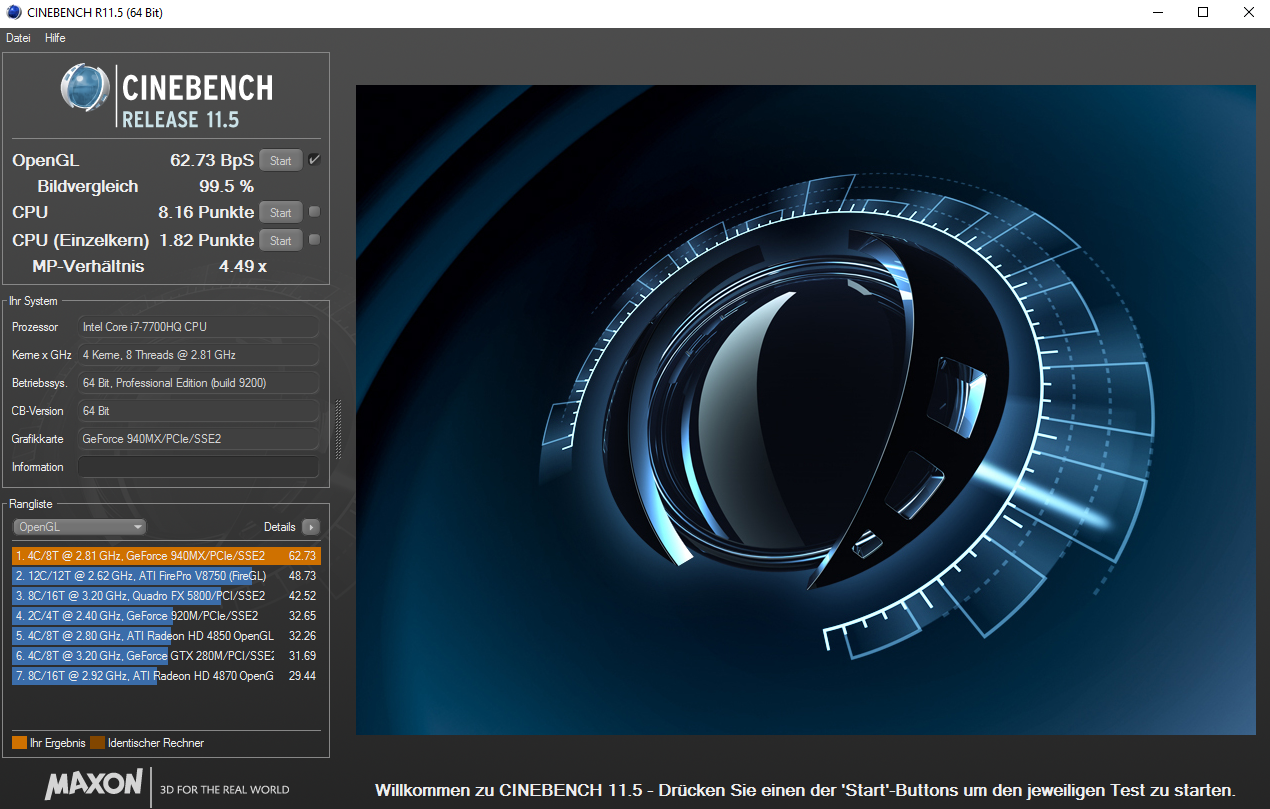
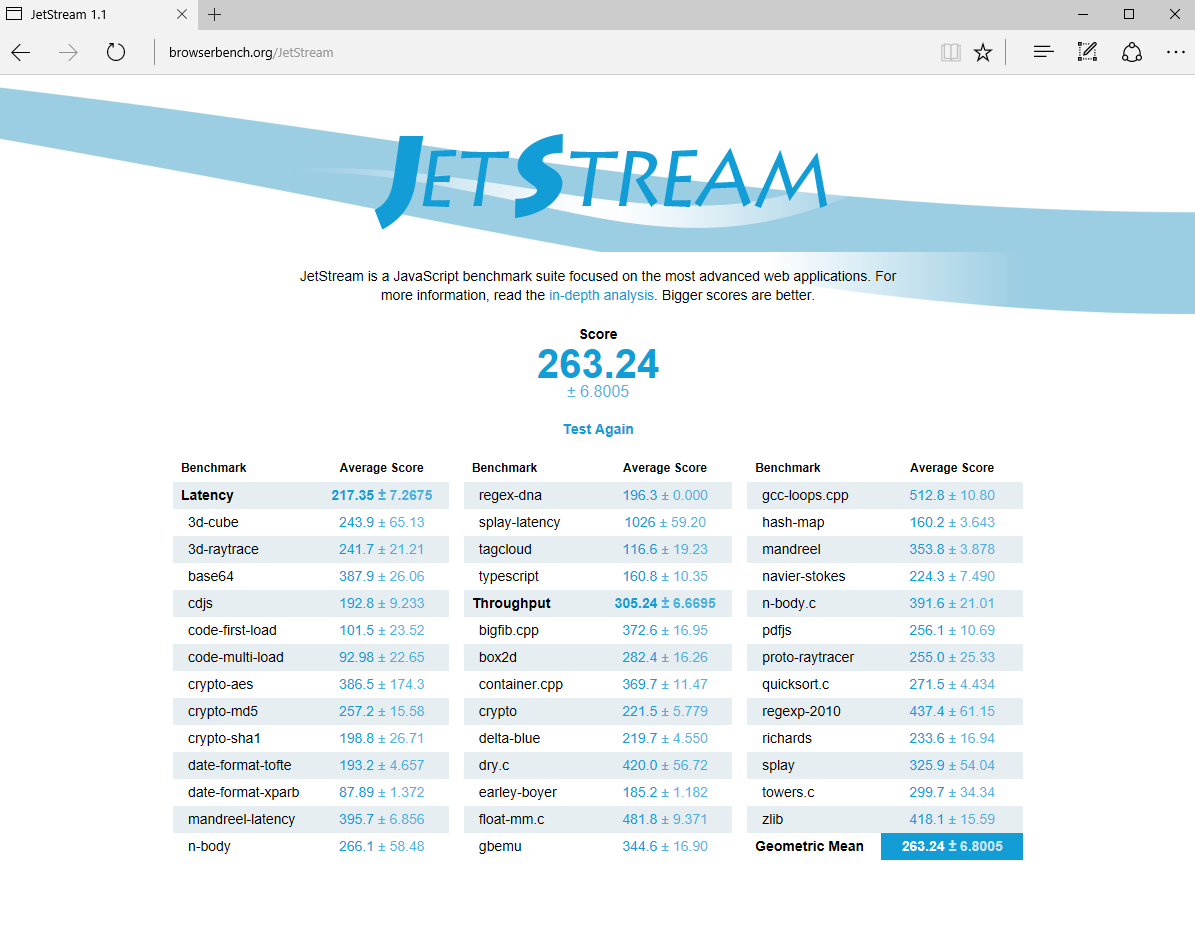
| JetStream 1.1 - 1.1 Total | |
| Lenovo ThinkPad T470p-20J7S00000 | |
| Lenovo ThinkPad T460p-20FXS05500 | |
| Dell Latitude 14 E5470 | |
| Lenovo ThinkPad T470-20HD002HGE | |
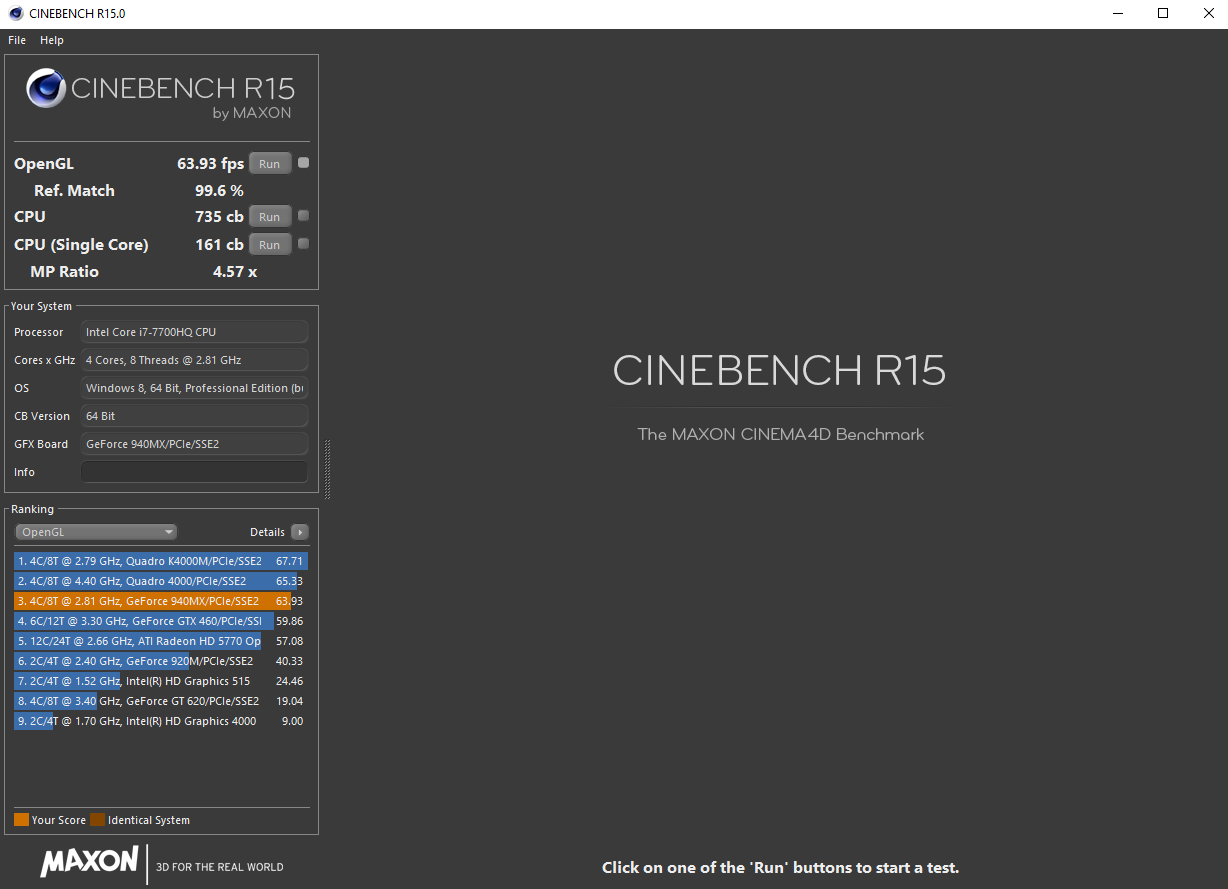
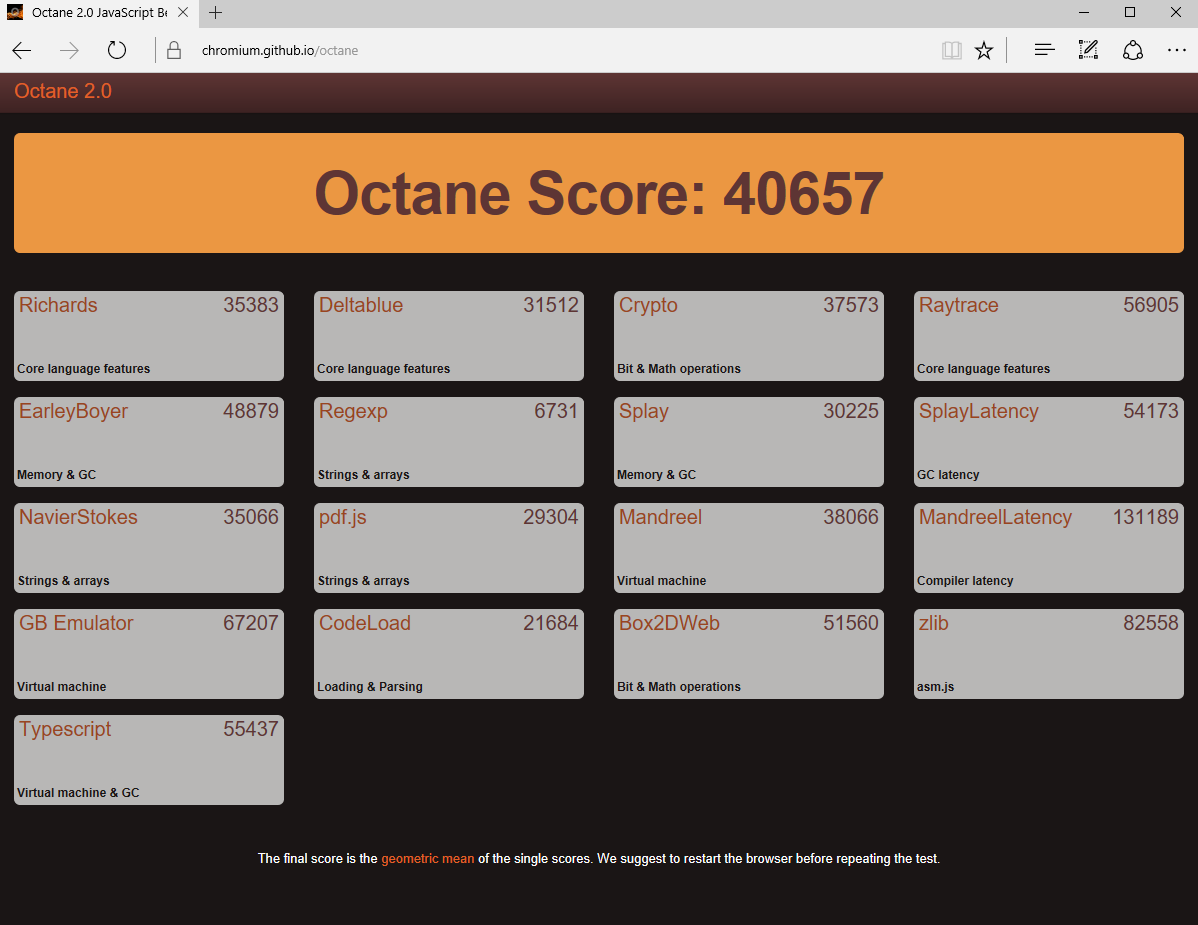
| Octane V2 - Total Score | |
| Lenovo ThinkPad T470p-20J7S00000 | |
| Lenovo ThinkPad T460p-20FXS05500 | |
| Dell Latitude 14 E5470 | |
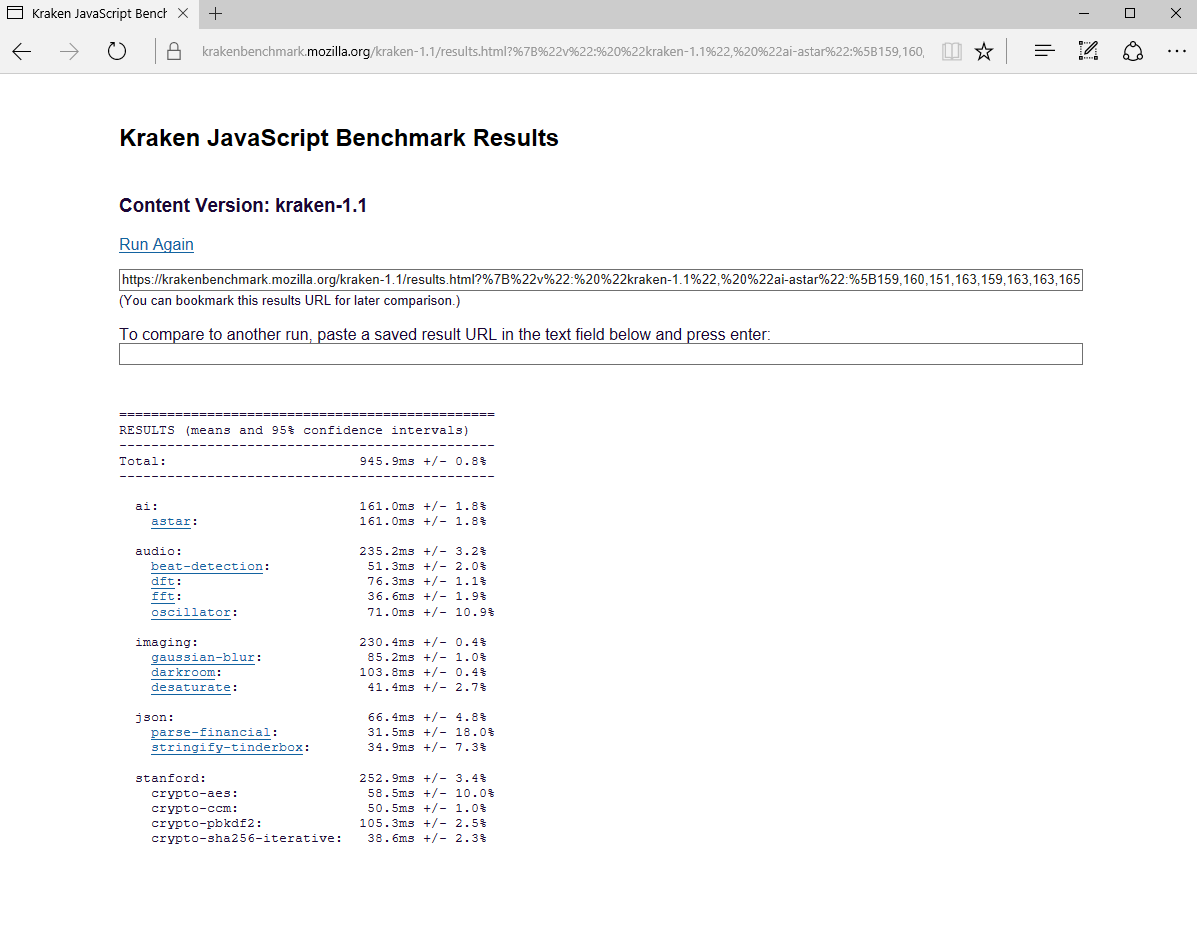
| Mozilla Kraken 1.1 - Total | |
| Lenovo ThinkPad T470-20HD002HGE | |
| Dell Latitude 14 E5470 | |
| Lenovo ThinkPad T460p-20FXS05500 | |
| Lenovo ThinkPad T470p-20J7S00000 | |
* ... menor é melhor
| PCMark 7 Score | 5766 pontos | |
| PCMark 8 Home Score Accelerated v2 | 3650 pontos | |
| PCMark 8 Creative Score Accelerated v2 | 4883 pontos | |
| PCMark 8 Work Score Accelerated v2 | 4654 pontos | |
Ajuda | ||
| Lenovo ThinkPad T470p-20J7S00000 Samsung PM961 NVMe MZVLW512HMJP | Lenovo ThinkPad T460p-20FXS05500 Samsung SSD PM871 MZ7LN512HCHP | Dell Latitude 14 E5470 Micron SSD 1100 (MTFDDAV256TBN) | Dell Latitude 5480 Toshiba SG5 256GB THNSNK256GVN8 | HP EliteBook 840 G4-Z2V49ET ABD Samsung PM961 MZVLW256HEHP | Lenovo ThinkPad T470-20HD002HGE Samsung PM961 NVMe MZVLW512HMJP | |
|---|---|---|---|---|---|---|
| CrystalDiskMark 3.0 | -49% | -60% | -55% | 8% | -6% | |
| Read Seq (MB/s) | 1088 | 502 -54% | 465.4 -57% | 469.4 -57% | 1819 67% | 1155 6% |
| Write Seq (MB/s) | 1023 | 442 -57% | 363.1 -65% | 264.8 -74% | 1263 23% | 1076 5% |
| Read 512 (MB/s) | 731 | 411.4 -44% | 338.4 -54% | 408.1 -44% | 922 26% | 811 11% |
| Write 512 (MB/s) | 798 | 414.3 -48% | 246.1 -69% | 265.5 -67% | 804 1% | 862 8% |
| Read 4k (MB/s) | 60.9 | 29.18 -52% | 25.83 -58% | 24.66 -60% | 61.4 1% | 55.5 -9% |
| Write 4k (MB/s) | 166.8 | 86.5 -48% | 80.3 -52% | 114.8 -31% | 157.1 -6% | 134.6 -19% |
| Read 4k QD32 (MB/s) | 652 | 358.1 -45% | 246.1 -62% | 380.3 -42% | 513 -21% | 496.2 -24% |
| Write 4k QD32 (MB/s) | 563 | 319.8 -43% | 197.7 -65% | 207.2 -63% | 410.2 -27% | 425.4 -24% |

| 3DMark 11 Performance | 3428 pontos | |
| 3DMark Ice Storm Standard Score | 36216 pontos | |
| 3DMark Cloud Gate Standard Score | 11802 pontos | |
| 3DMark Fire Strike Score | 2253 pontos | |
| 3DMark Fire Strike Extreme Score | 1089 pontos | |
| 3DMark Time Spy Score | 737 pontos | |
Ajuda | ||
| baixo | média | alto | ultra | |
|---|---|---|---|---|
| BioShock Infinite (2013) | 129.4 | 79.3 | 68.3 | 25.5 |
| Battlefield 4 (2013) | 98.8 | 69.1 | 48.8 | 19.8 |
| The Witcher 3 (2015) | 49.2 | 28.4 | 14.6 | |
| Rise of the Tomb Raider (2016) | 51.8 | 30.6 | 17 |
Barulho
| Ocioso |
| 29 / 29 / 29 dB |
| Carga |
| 35.6 / 39.7 dB |
 | ||
30 dB silencioso 40 dB(A) audível 50 dB(A) ruidosamente alto |
||
min: | ||
| Lenovo ThinkPad T470p-20J7S00000 i7-7700HQ, GeForce 940MX | Lenovo ThinkPad T460p-20FXS05500 6700HQ, GeForce 940MX | Dell Latitude 14 E5470 6440HQ, HD Graphics 530 | Dell Latitude 5480 i7-7600U, HD Graphics 620 | HP EliteBook 840 G4-Z2V49ET ABD i5-7200U, HD Graphics 620 | Lenovo ThinkPad T470-20HD002HGE i5-7200U, HD Graphics 620 | |
|---|---|---|---|---|---|---|
| Noise | 1% | 1% | -9% | -1% | 6% | |
| desligado / ambiente * (dB) | 29 | 29.2 -1% | 30.3 -4% | 31 -7% | 28 3% | |
| Idle Minimum * (dB) | 29 | 29.2 -1% | 30.3 -4% | 29.6 -2% | 31 -7% | 28 3% |
| Idle Average * (dB) | 29 | 29.2 -1% | 30.3 -4% | 29.6 -2% | 31 -7% | 28 3% |
| Idle Maximum * (dB) | 29 | 29.2 -1% | 30.3 -4% | 29.6 -2% | 31 -7% | 29.4 -1% |
| Load Average * (dB) | 35.6 | 33.5 6% | 31.6 11% | 42 -18% | 33.5 6% | 31.4 12% |
| Load Maximum * (dB) | 39.7 | 38.8 2% | 35 12% | 47.1 -19% | 33.7 15% | 34.6 13% |
* ... menor é melhor
(-) A temperatura máxima no lado superior é 50.2 °C / 122 F, em comparação com a média de 34.3 °C / 94 F , variando de 21.2 a 62.5 °C para a classe Office.
(-) A parte inferior aquece até um máximo de 51.3 °C / 124 F, em comparação com a média de 36.8 °C / 98 F
(+) Em uso inativo, a temperatura média para o lado superior é 25.4 °C / 78 F, em comparação com a média do dispositivo de 29.5 °C / ### class_avg_f### F.
(±) Os apoios para as mãos e o touchpad podem ficar muito quentes ao toque, com um máximo de 38.5 °C / 101.3 F.
(-) A temperatura média da área do apoio para as mãos de dispositivos semelhantes foi 27.6 °C / 81.7 F (-10.9 °C / -19.6 F).
| Lenovo ThinkPad T470p-20J7S00000 i7-7700HQ, GeForce 940MX | Lenovo ThinkPad T460p-20FXS05500 6700HQ, GeForce 940MX | Dell Latitude 14 E5470 6440HQ, HD Graphics 530 | Dell Latitude 5480 i7-7600U, HD Graphics 620 | HP EliteBook 840 G4-Z2V49ET ABD i5-7200U, HD Graphics 620 | Lenovo ThinkPad T470-20HD002HGE i5-7200U, HD Graphics 620 | |
|---|---|---|---|---|---|---|
| Heat | -11% | -1% | 11% | 15% | 14% | |
| Maximum Upper Side * (°C) | 50.2 | 51.6 -3% | 43 14% | 36.4 27% | 37 26% | 37.2 26% |
| Maximum Bottom * (°C) | 51.3 | 55.2 -8% | 43 16% | 45 12% | 39.4 23% | 45.1 12% |
| Idle Upper Side * (°C) | 26.3 | 30.7 -17% | 31.2 -19% | 26.4 -0% | 25.9 2% | 24.4 7% |
| Idle Bottom * (°C) | 27.5 | 31.5 -15% | 31.3 -14% | 26.8 3% | 25.6 7% | 25 9% |
* ... menor é melhor
Lenovo ThinkPad T470p-20J7S00000 análise de áudio
(+) | os alto-falantes podem tocar relativamente alto (###valor### dB)
Graves 100 - 315Hz
(-) | quase nenhum baixo - em média 18.1% menor que a mediana
(±) | a linearidade dos graves é média (14.6% delta para a frequência anterior)
Médios 400 - 2.000 Hz
(+) | médios equilibrados - apenas 4.2% longe da mediana
(+) | médios são lineares (5.9% delta para frequência anterior)
Altos 2 - 16 kHz
(+) | agudos equilibrados - apenas 3.3% longe da mediana
(+) | os máximos são lineares (6.5% delta da frequência anterior)
Geral 100 - 16.000 Hz
(±) | a linearidade do som geral é média (19.6% diferença em relação à mediana)
Comparado com a mesma classe
» 41% de todos os dispositivos testados nesta classe foram melhores, 8% semelhantes, 51% piores
» O melhor teve um delta de 7%, a média foi 21%, o pior foi 53%
Comparado com todos os dispositivos testados
» 49% de todos os dispositivos testados foram melhores, 7% semelhantes, 44% piores
» O melhor teve um delta de 4%, a média foi 23%, o pior foi 134%
Apple MacBook 12 (Early 2016) 1.1 GHz análise de áudio
(+) | os alto-falantes podem tocar relativamente alto (###valor### dB)
Graves 100 - 315Hz
(±) | graves reduzidos - em média 11.3% menor que a mediana
(±) | a linearidade dos graves é média (14.2% delta para a frequência anterior)
Médios 400 - 2.000 Hz
(+) | médios equilibrados - apenas 2.4% longe da mediana
(+) | médios são lineares (5.5% delta para frequência anterior)
Altos 2 - 16 kHz
(+) | agudos equilibrados - apenas 2% longe da mediana
(+) | os máximos são lineares (4.5% delta da frequência anterior)
Geral 100 - 16.000 Hz
(+) | o som geral é linear (10.2% diferença em relação à mediana)
Comparado com a mesma classe
» 7% de todos os dispositivos testados nesta classe foram melhores, 2% semelhantes, 90% piores
» O melhor teve um delta de 5%, a média foi 18%, o pior foi 53%
Comparado com todos os dispositivos testados
» 5% de todos os dispositivos testados foram melhores, 1% semelhantes, 94% piores
» O melhor teve um delta de 4%, a média foi 23%, o pior foi 134%
| desligado | |
| Ocioso | |
| Carga |
|
Key:
min: | |
| Lenovo ThinkPad T470p-20J7S00000 i7-7700HQ, GeForce 940MX, Samsung PM961 NVMe MZVLW512HMJP, IPS, 2560x1440, 14" | Lenovo ThinkPad T460p-20FXS05500 6700HQ, GeForce 940MX, Samsung SSD PM871 MZ7LN512HCHP, IPS-Panel, 2560x1440, 14" | Dell Latitude 14 E5470 6440HQ, HD Graphics 530, Micron SSD 1100 (MTFDDAV256TBN), AH-IPS, WLED, 1920x1080, 14" | Dell Latitude 5480 i7-7600U, HD Graphics 620, Toshiba SG5 256GB THNSNK256GVN8, IPS, 1920x1080, 14" | HP EliteBook 840 G4-Z2V49ET ABD i5-7200U, HD Graphics 620, Samsung PM961 MZVLW256HEHP, TN, 1920x1080, 14" | Lenovo ThinkPad T470-20HD002HGE i5-7200U, HD Graphics 620, Samsung PM961 NVMe MZVLW512HMJP, IPS, 1920x1080, 14" | |
|---|---|---|---|---|---|---|
| Power Consumption | -22% | 1% | 7% | 29% | 29% | |
| Idle Minimum * (Watt) | 3.8 | 5 -32% | 4.1 -8% | 6.64 -75% | 2.9 24% | 3.21 16% |
| Idle Average * (Watt) | 6.5 | 9.9 -52% | 8.1 -25% | 6.67 -3% | 5.6 14% | 6.15 5% |
| Idle Maximum * (Watt) | 7.2 | 10.8 -50% | 11.4 -58% | 7.78 -8% | 8.15 -13% | 6.82 5% |
| Load Average * (Watt) | 62.5 | 52.4 16% | 33.5 46% | 30.83 51% | 30.6 51% | 28.5 54% |
| Load Maximum * (Watt) | 99.6 | 89.8 10% | 49 51% | 31.7 68% | 31 69% | 34.5 65% |
* ... menor é melhor
| Lenovo ThinkPad T470p-20J7S00000 i7-7700HQ, GeForce 940MX, 72 Wh | Lenovo ThinkPad T460p-20FXS05500 6700HQ, GeForce 940MX, 48 Wh | Dell Latitude 14 E5470 6440HQ, HD Graphics 530, 62 Wh | Dell Latitude 5480 i7-7600U, HD Graphics 620, 68 Wh | HP EliteBook 840 G4-Z2V49ET ABD i5-7200U, HD Graphics 620, 51 Wh | Lenovo ThinkPad T470-20HD002HGE i5-7200U, HD Graphics 620, 48 Wh | |
|---|---|---|---|---|---|---|
| Duração da bateria | -35% | -13% | 63% | 39% | 13% | |
| Reader / Idle (h) | 17.7 | 11 -38% | 15.2 -14% | 24.1 36% | 19.3 9% | |
| H.264 (h) | 7.6 | 6 -21% | 6.9 -9% | 9.9 30% | 10.4 37% | |
| WiFi v1.3 (h) | 10 | 5 -50% | 7.2 -28% | 16.1 61% | 9.5 -5% | 7.3 -27% |
| Load (h) | 1.4 | 1 -29% | 1.4 0% | 2.7 93% | 3.1 121% | 1.8 29% |
Pro
Contra
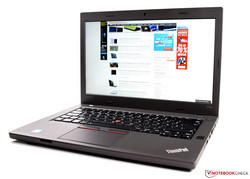
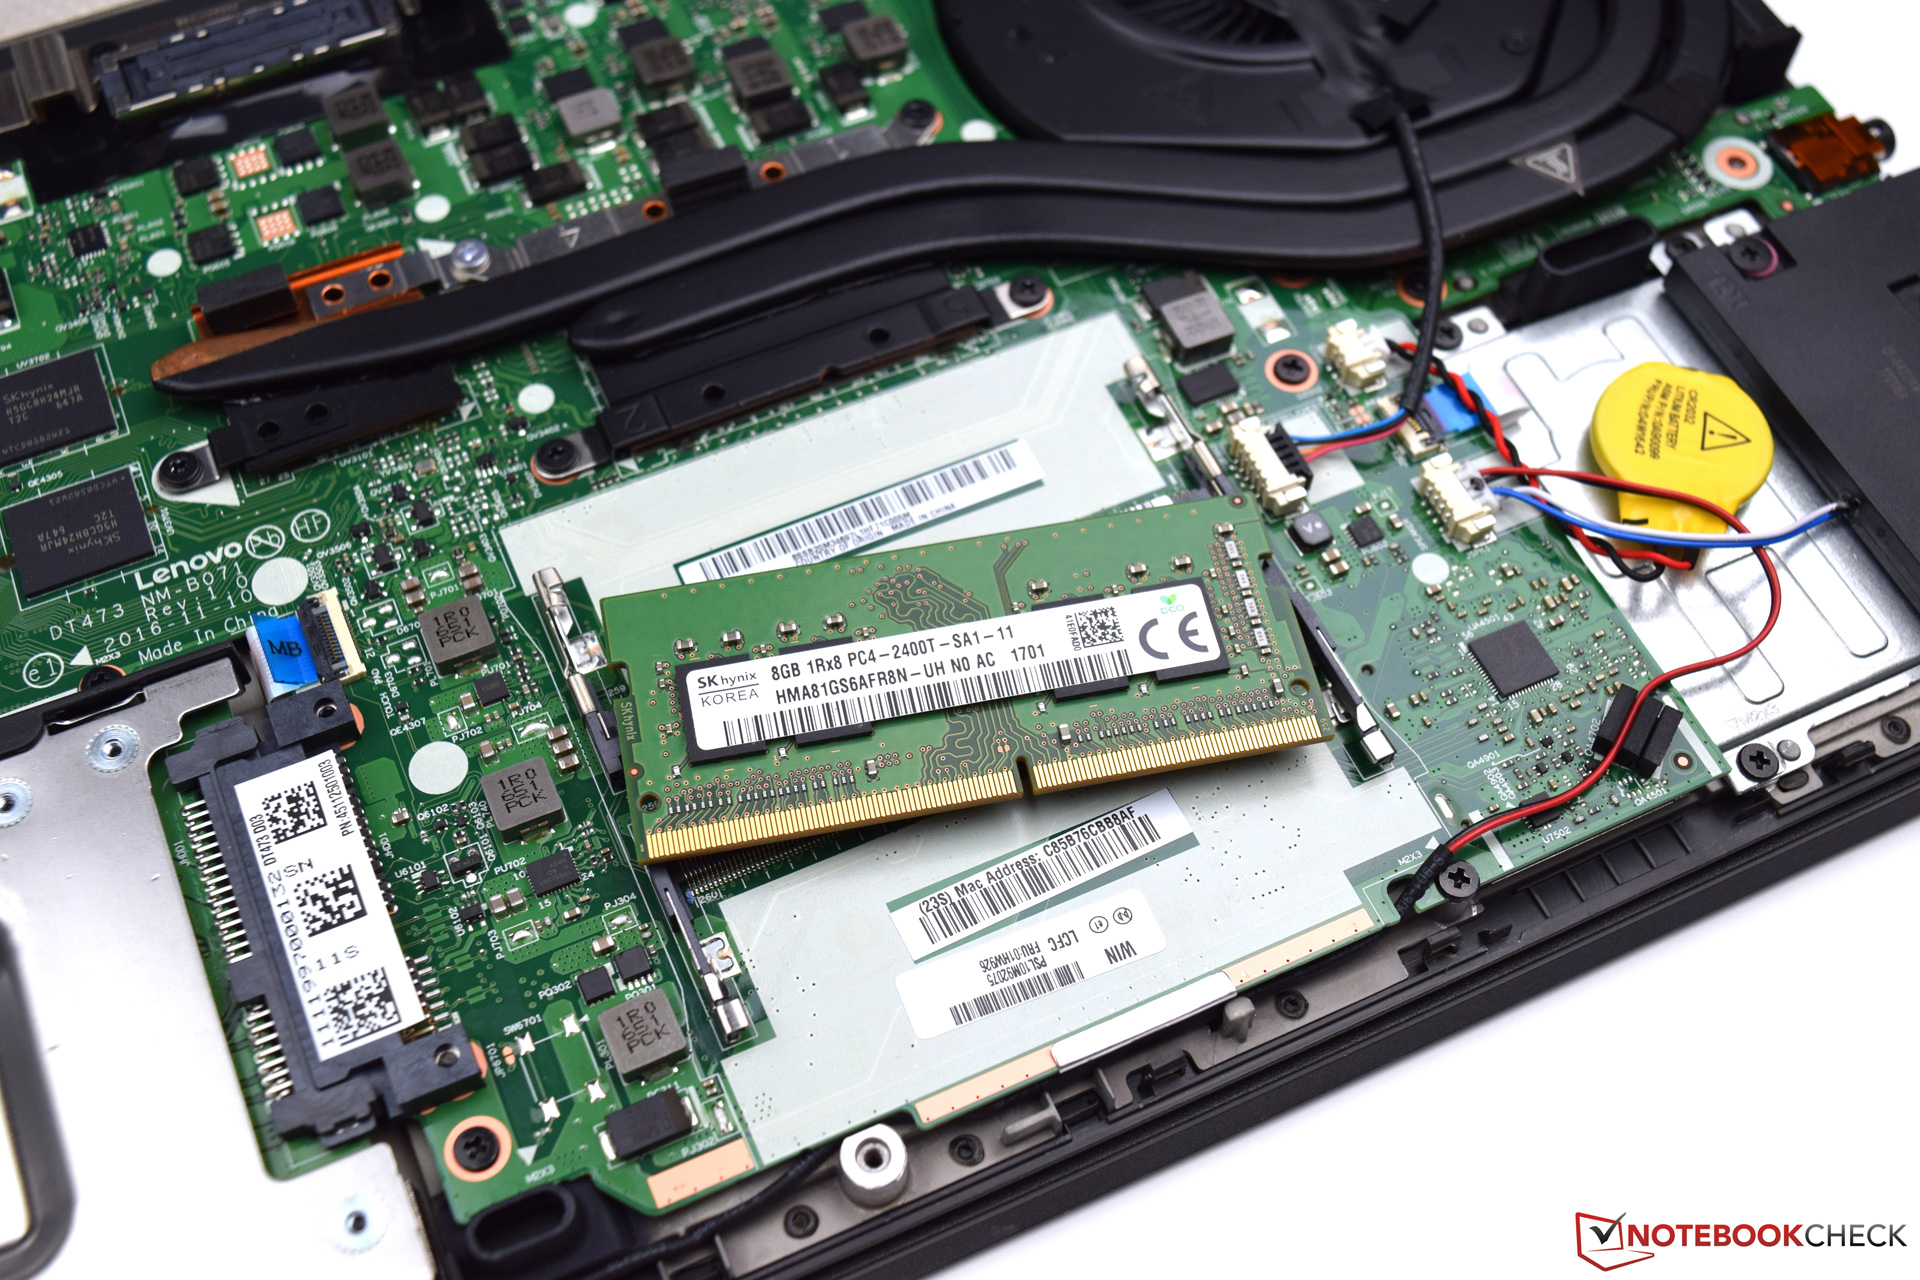
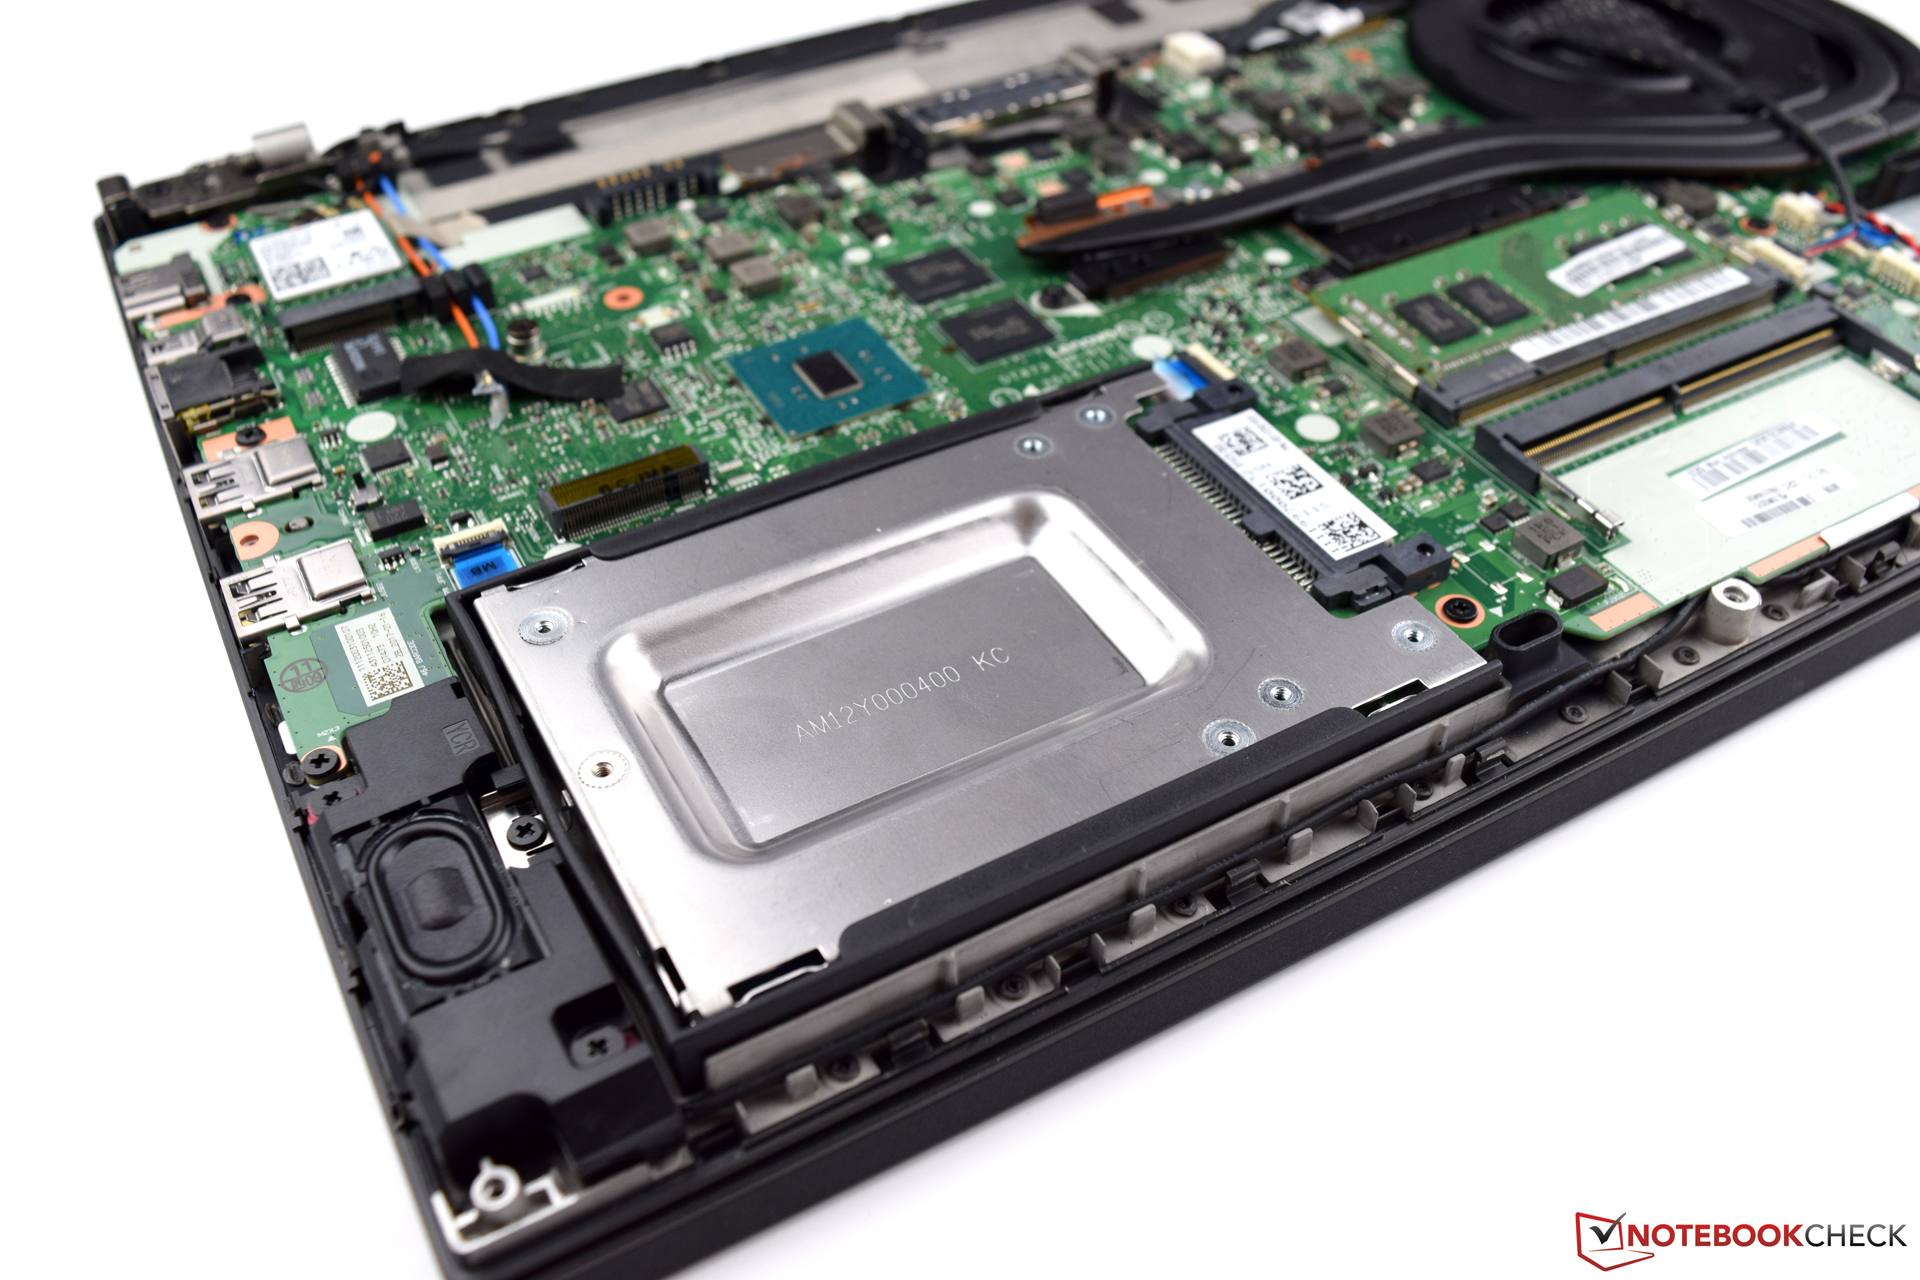
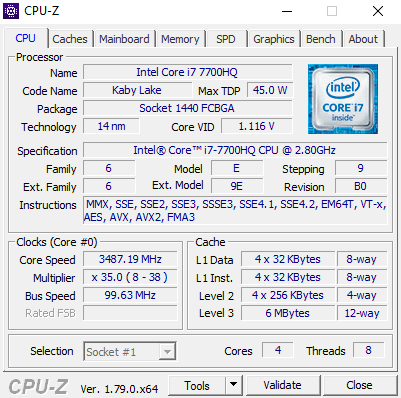
A Lenovo atualiza seus modelos e fornece o ThinkPad T470p com uma CPU Kaby Lake muito poderosa, cujo desempenho é mais do que suficiente para os usos previstos em qualquer aspecto. A memória (8 GB DDR4), que não é ampla, mas suficiente, pode ser estendida a qualquer momento, se necessário. Gostamos de todos os recursos de segurança que transformam o Lenovo ThinkPad T470p em um aparelho empresarial. No entanto, o fabricante também fornece o cavalo de trabalho com uma GPU dedicada, que é capaz de trazer alguns jogos para a tela com taxas de fotogramas passáveis. A solução de armazenamento oferece um desempenho muito bom e contribui significativamente para um sistema sem fluente. No entanto, a palavra final é sempre a do preço, que a 2099 euros (~ $2367) é considerável para este aparelho. Por este montante, você obtém um portátil empresarial de alto desempenho no formato de 14 polegadas, que está mais uma vez equipado com dispositivos de entrada muito bons.
No entanto, o Lenovo ThinkPad T470p ainda merece algumas críticas: Embora a tela ofereça um desempenho sólido, em termos de brilho, continua atrás das expectativas. Não temos simpatia ao fato de que a Lenovo não forneça um aparelho novo, que supostamente deveria ser usado durante alguns anos, com conectores modernos. Por esse preço, você deve obter pelo menos uma porta USB 3.1 Type-C que suporte Thunderbolt. Finalmente, o desempenho do resfriamento também deve ser melhorado no sucessor.
Como um quad-core de alto desempenho no formato de 14 polegadas, o T470p tem recursos realmente únicos neste momento.
No geral, o Lenovo ThinkPad T470p deixa uma boa impressão. O excelente desempenho do sistema e a GPU dedicada, fortalecem o aparelho e permitem cenários de uso versáteis. Além de trabalhar no escritório, o Lenovo ThinkPad T470p também gerencia tarefas multimídia muito bem, e até mesmo alguns jogos podem ser jogados nele sem problema algum.
Lenovo ThinkPad T470p-20J7S00000
- 05/14/2017 v6 (old)
Sebastian Bade