O mini PC Acemagic AM20 com um AMD Ryzen 7 7735H e 32 GB de RAM pode carregar smartphones sem fio
Com o AM20, a Acemagic está expandindo seu portfólio e lançando um representante muito interessante na categoria. No entanto, não estamos lidando com uma simples atualização de um modelo existente, mas com um modelo completamente novo. Com oAMD Ryzen 7 7735Ho fabricante optou por um SoC atual que possui uma poderosa iGPU, aAMD Radeon 680M. É de conhecimento geral que a Intel está atrás da curva aqui e, com o iGPU mencionado acima, é possível até mesmo realizar algumas pequenas sessões de jogos. A Acemagic equipou o dispositivo com 32 GB de RAM e um SSD de 512 GB, o que significa que o PC está bem equipado por enquanto. Os compradores terão que reservar um pouco menos de 570 dólares americanos para o Acemagic AM20 com 16 GB de RAM. Nossa amostra para análise não está listada na loja da Acermagic no momento.
Nesta análise, comparamos o Acemagic AM20 com concorrentes conhecidos que já passaram por nosso curso de testes. Uma lista dos dispositivos de comparação para esta análise pode ser encontrada na visão geral a seguir.
Possíveis concorrentes em comparação
Avaliação | Data | Modelo | Peso | Altura | Preço |
|---|---|---|---|---|---|
| 84 % v7 (old) | 10/2023 | Acemagic AM20 R7 7735H, Radeon 680M | 339 g | 38 mm | |
| 82.8 % v7 (old) | 07/2023 | Minisforum Venus Series UM790 Pro R9 7940HS, Radeon 780M | 666 g | 52.3 mm | |
| 85.1 % v7 (old) | 01/2023 | Minisforum Neptune Series NAD9 i9-12900H, Iris Xe G7 96EUs | 1.2 kg | 66 mm | |
| 83.7 % v7 (old) | 05/2023 | Morefine M600, 6600U R5 6600U, Radeon 660M | 768 g | 40.6 mm | |
| 82.8 % v7 (old) | 07/2023 | Geekom AS 6, R9 6900HX R9 6900HX, Radeon 680M | 753 g | 58 mm | |
| 82.3 % v7 (old) | 05/2023 | Geekom Mini IT12 i7-1260P, Iris Xe G7 96EUs | 572 g | 45.6 mm | |
| 81.7 % v7 (old) | 05/2023 | Minisforum Venus Series UM560 XT R5 5600H, Vega 7 | 652 g | 48 mm | |
| 73.8 % v7 (old) | 08/2023 | Blackview MP200 i5-11400H, UHD Graphics Xe 16EUs | 678 g | 75.5 mm |
Acemagic AM20 em detalhes
Estojo - com função de carregamento sem fio
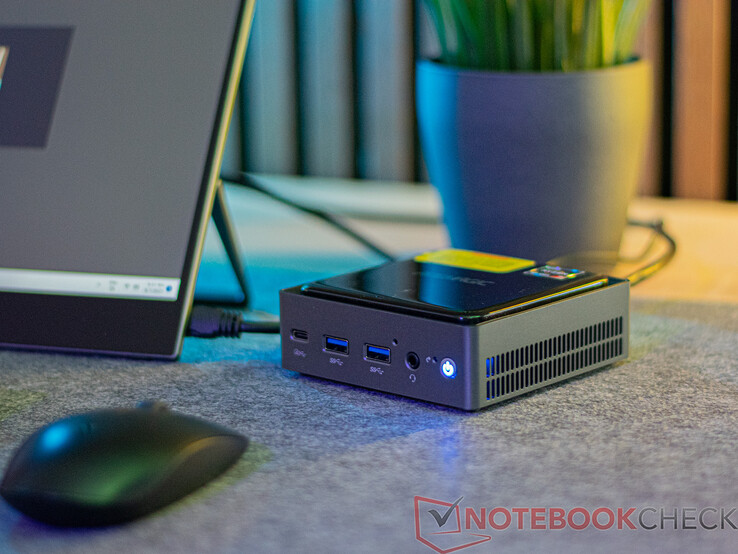
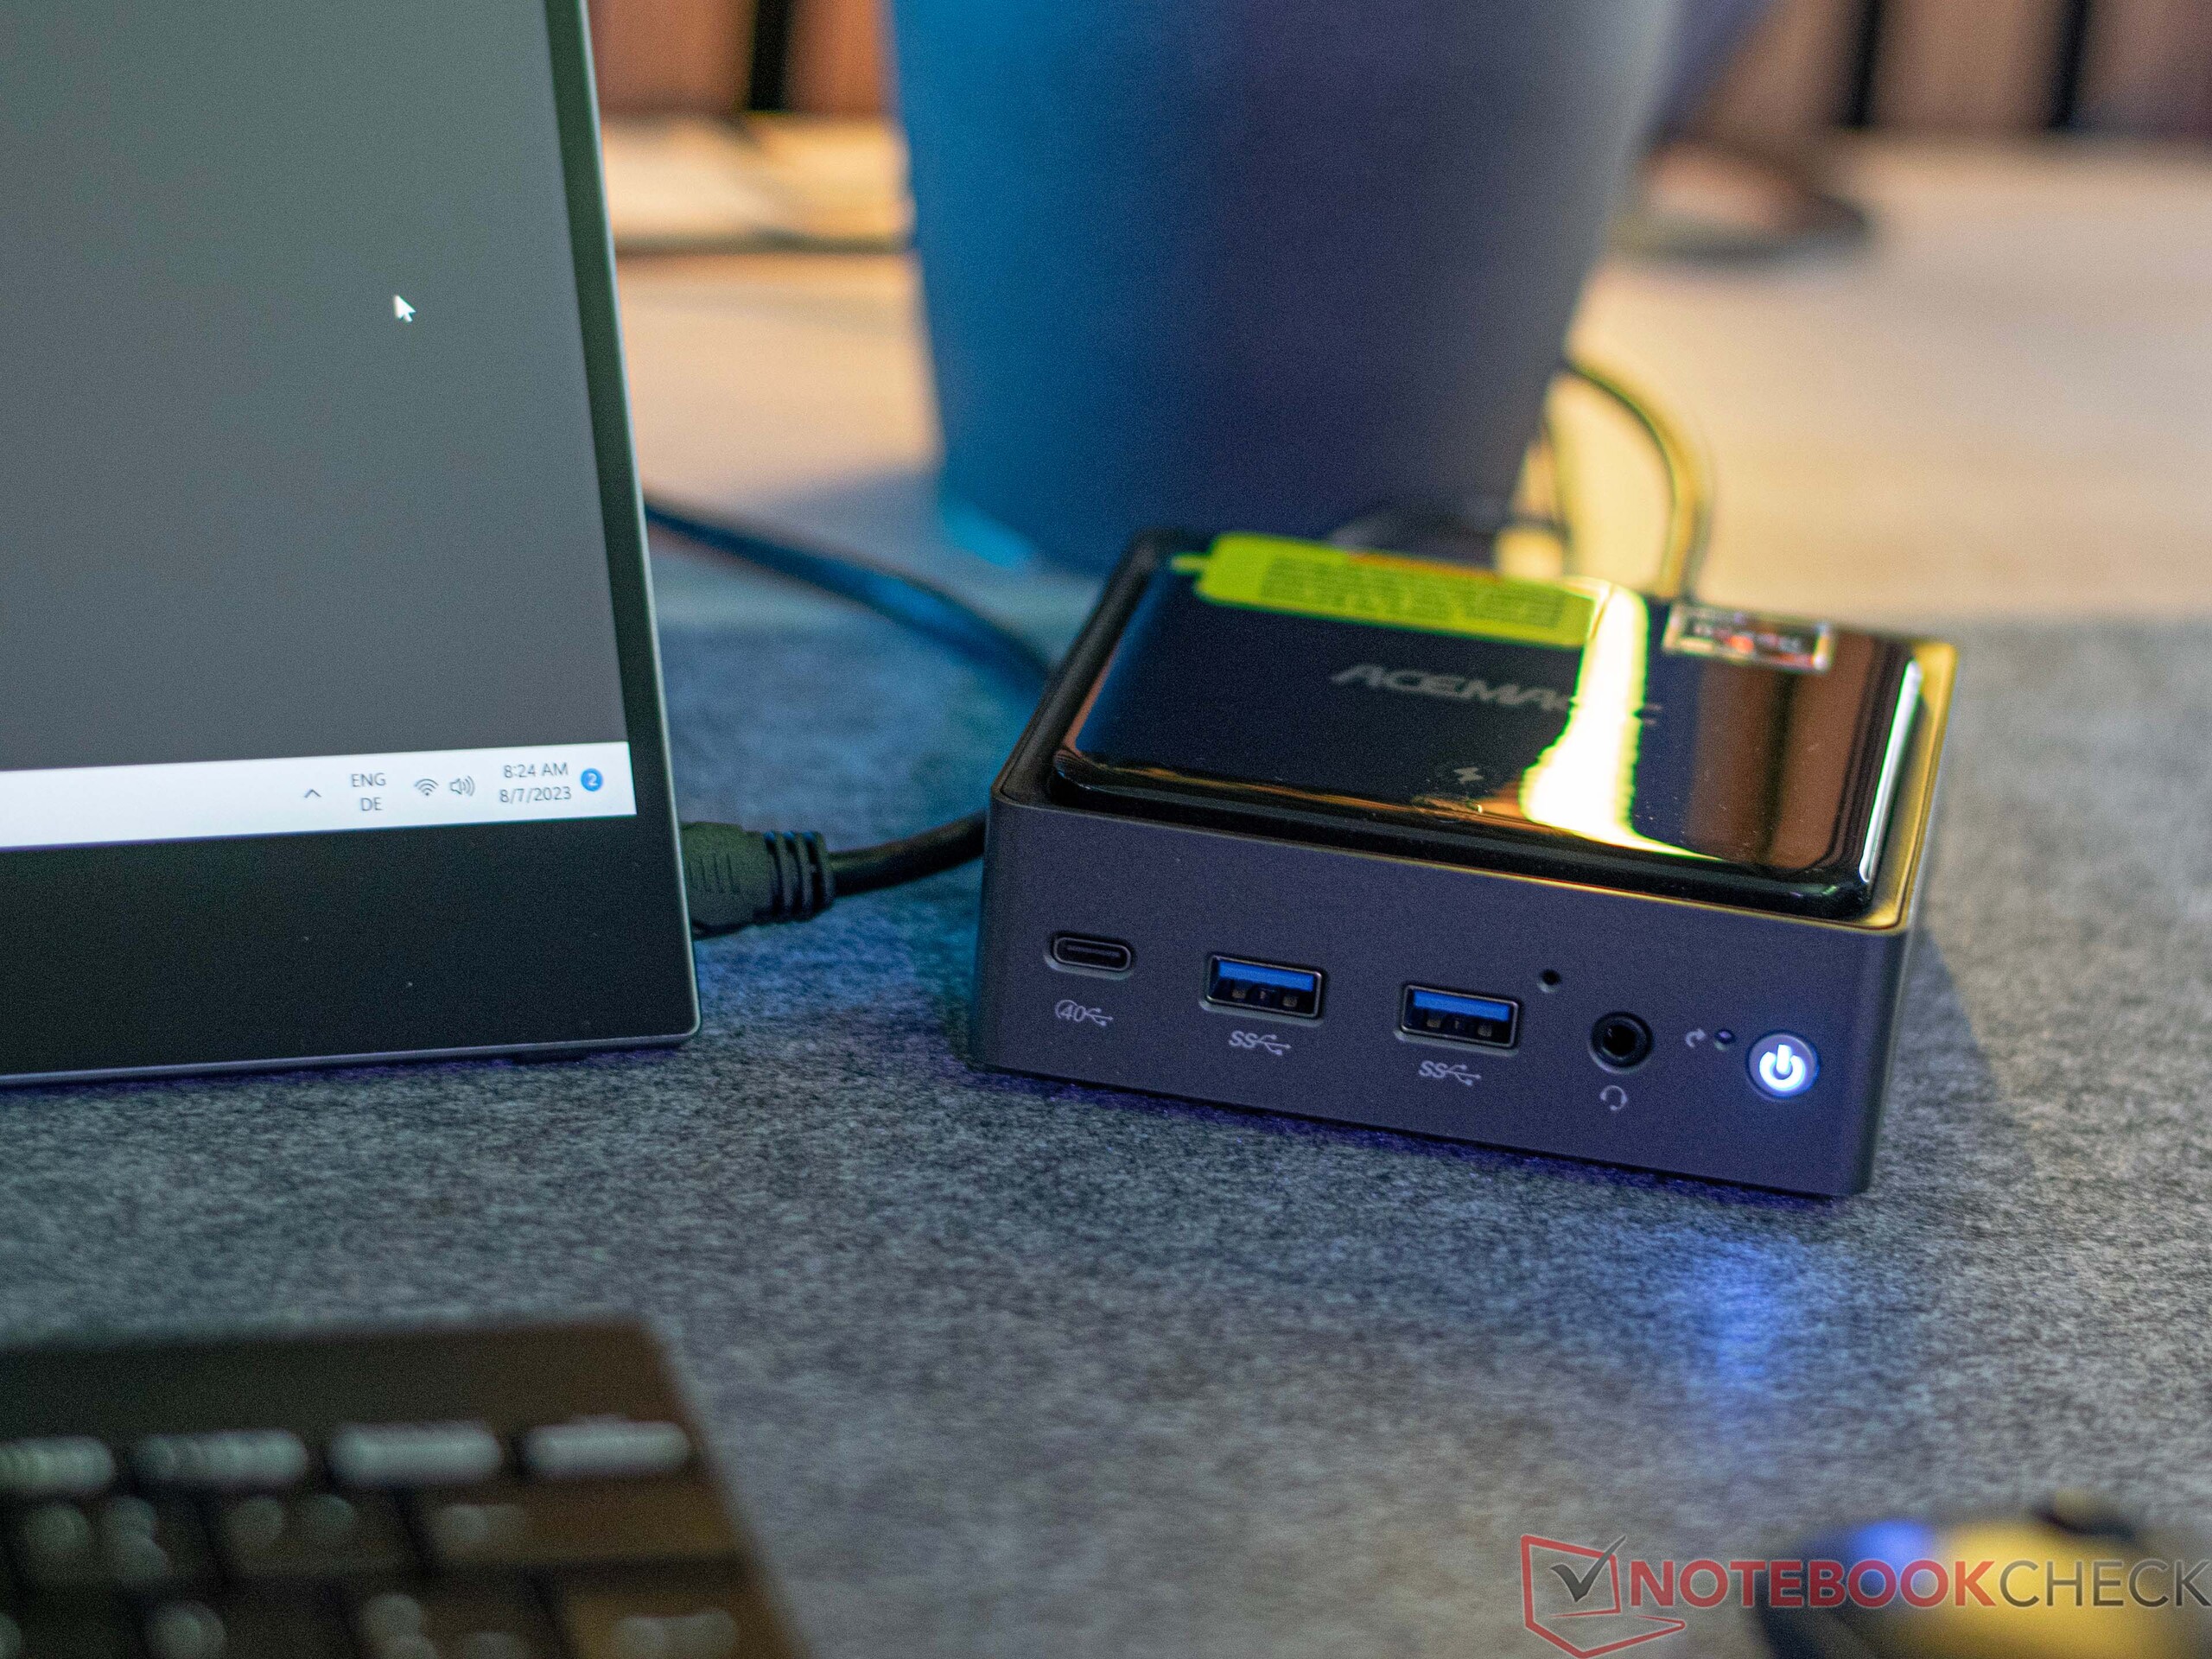
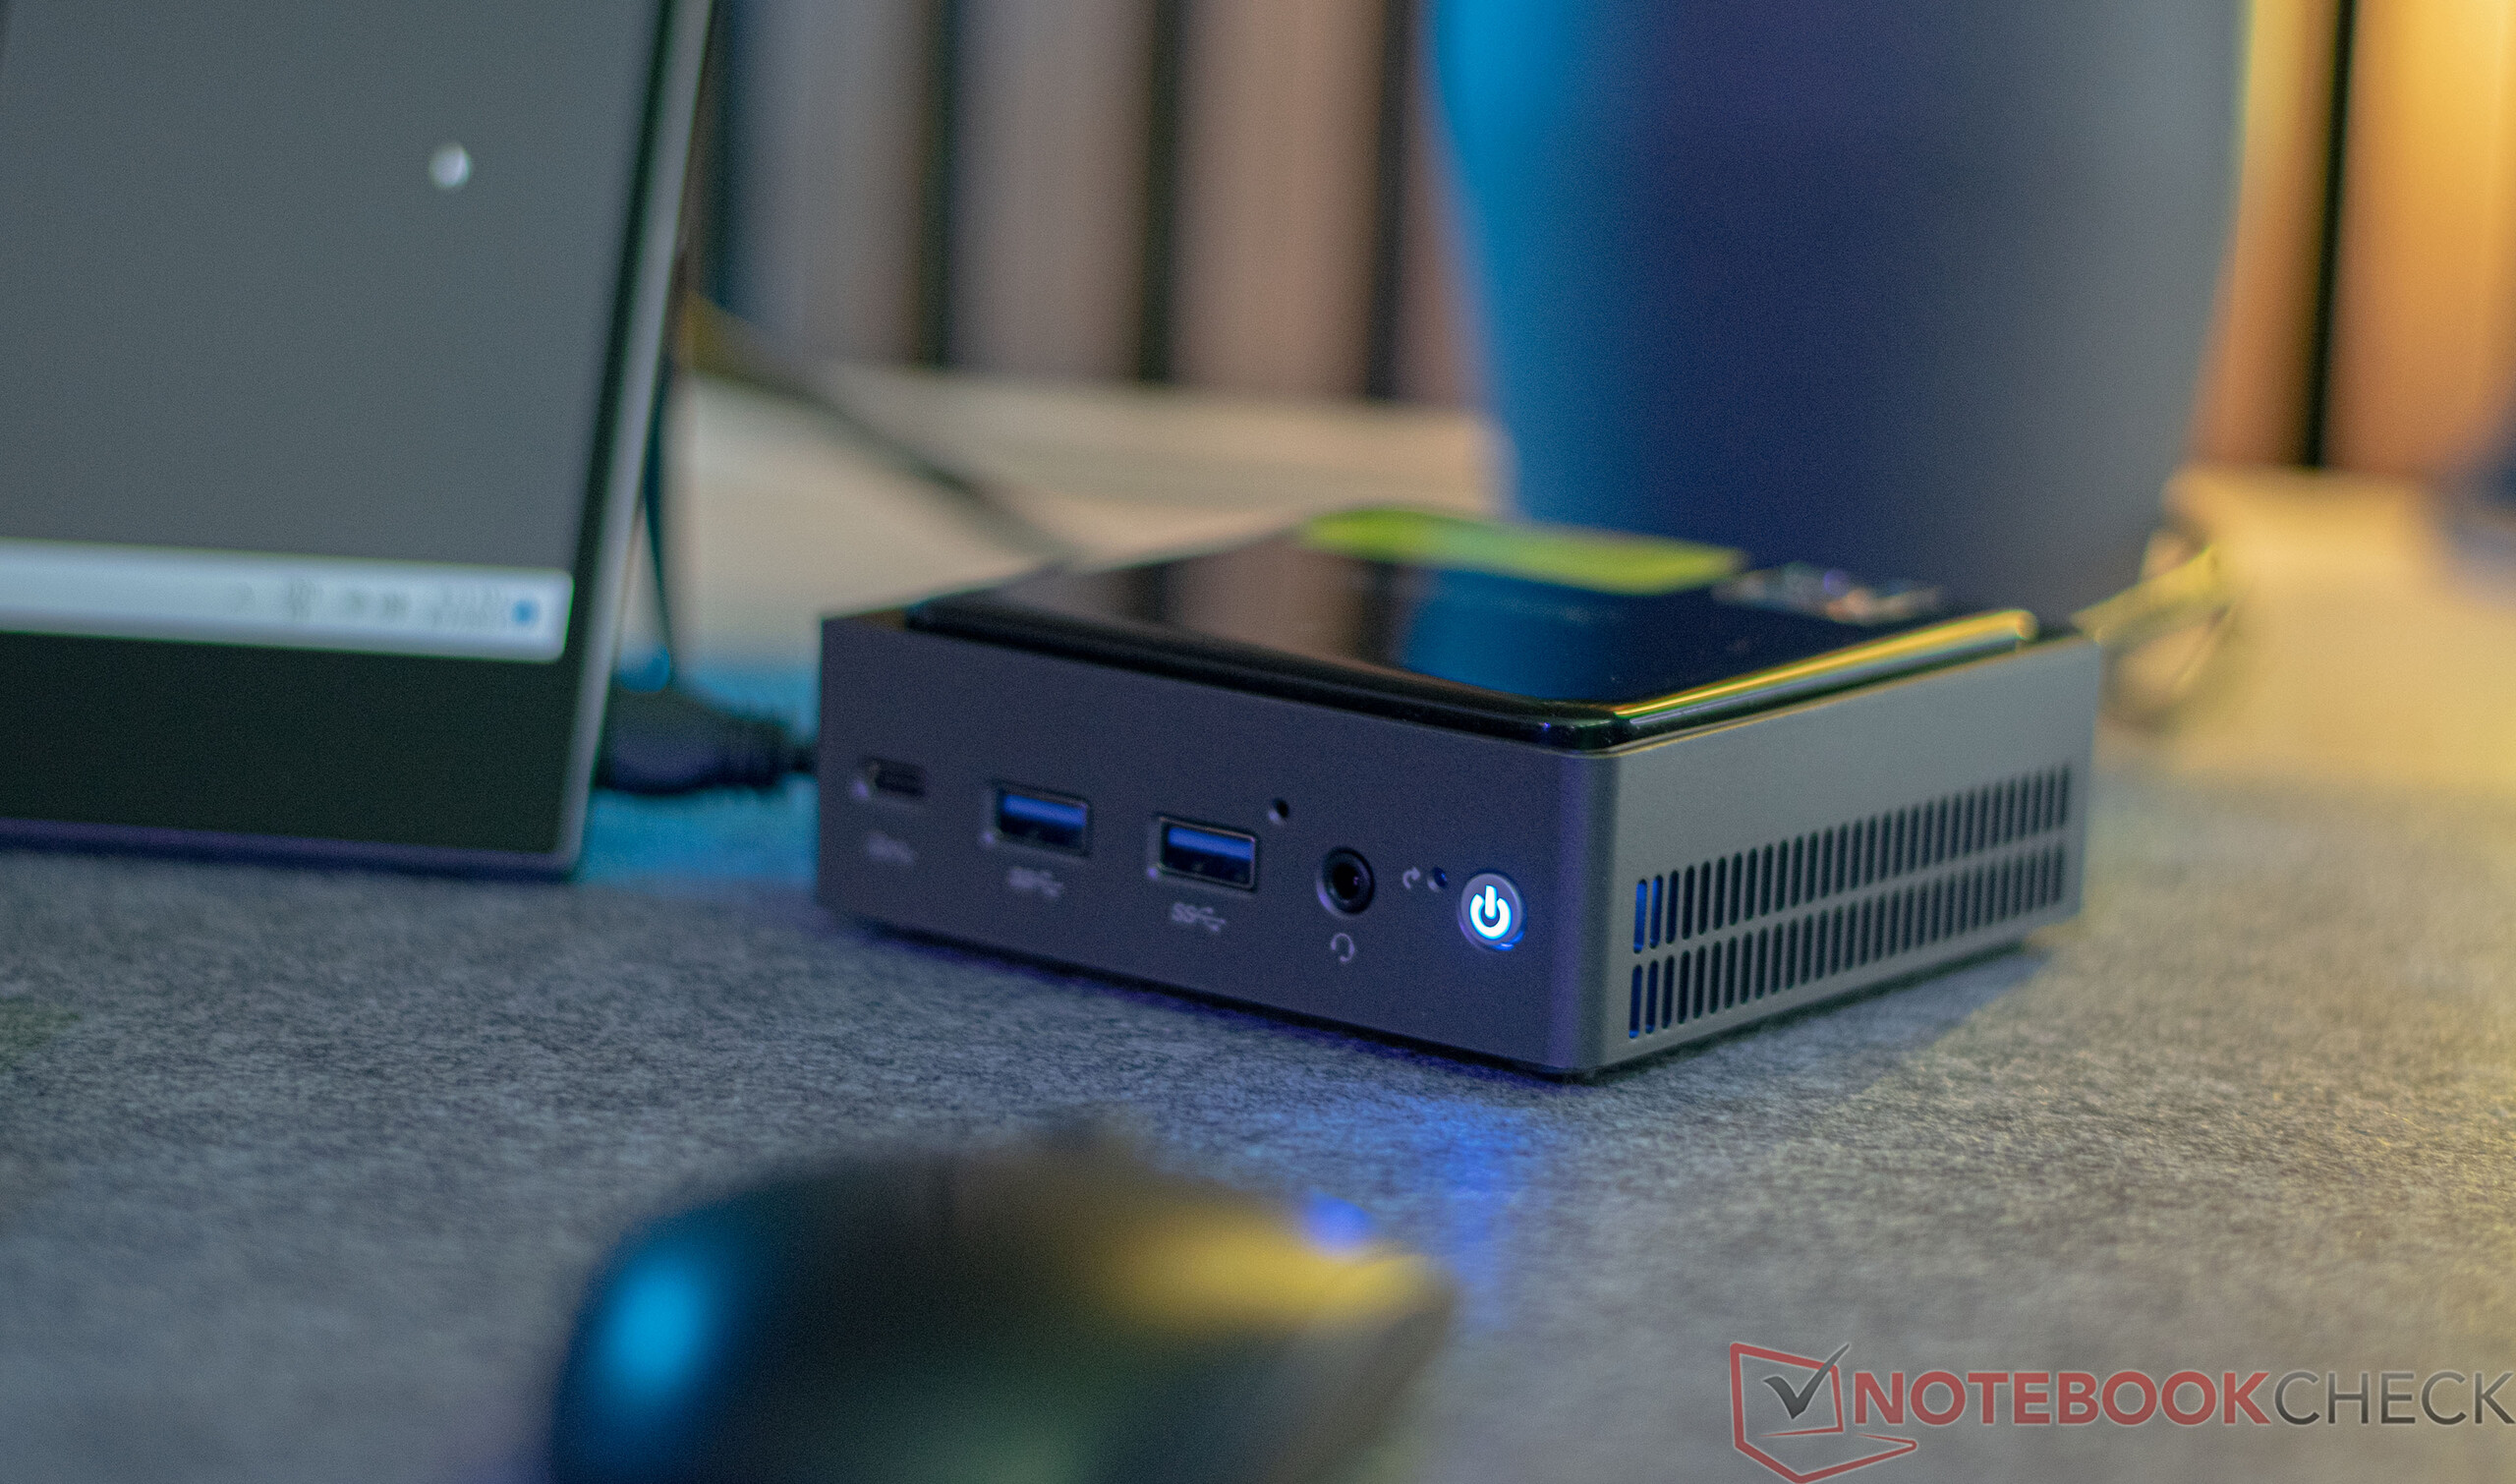
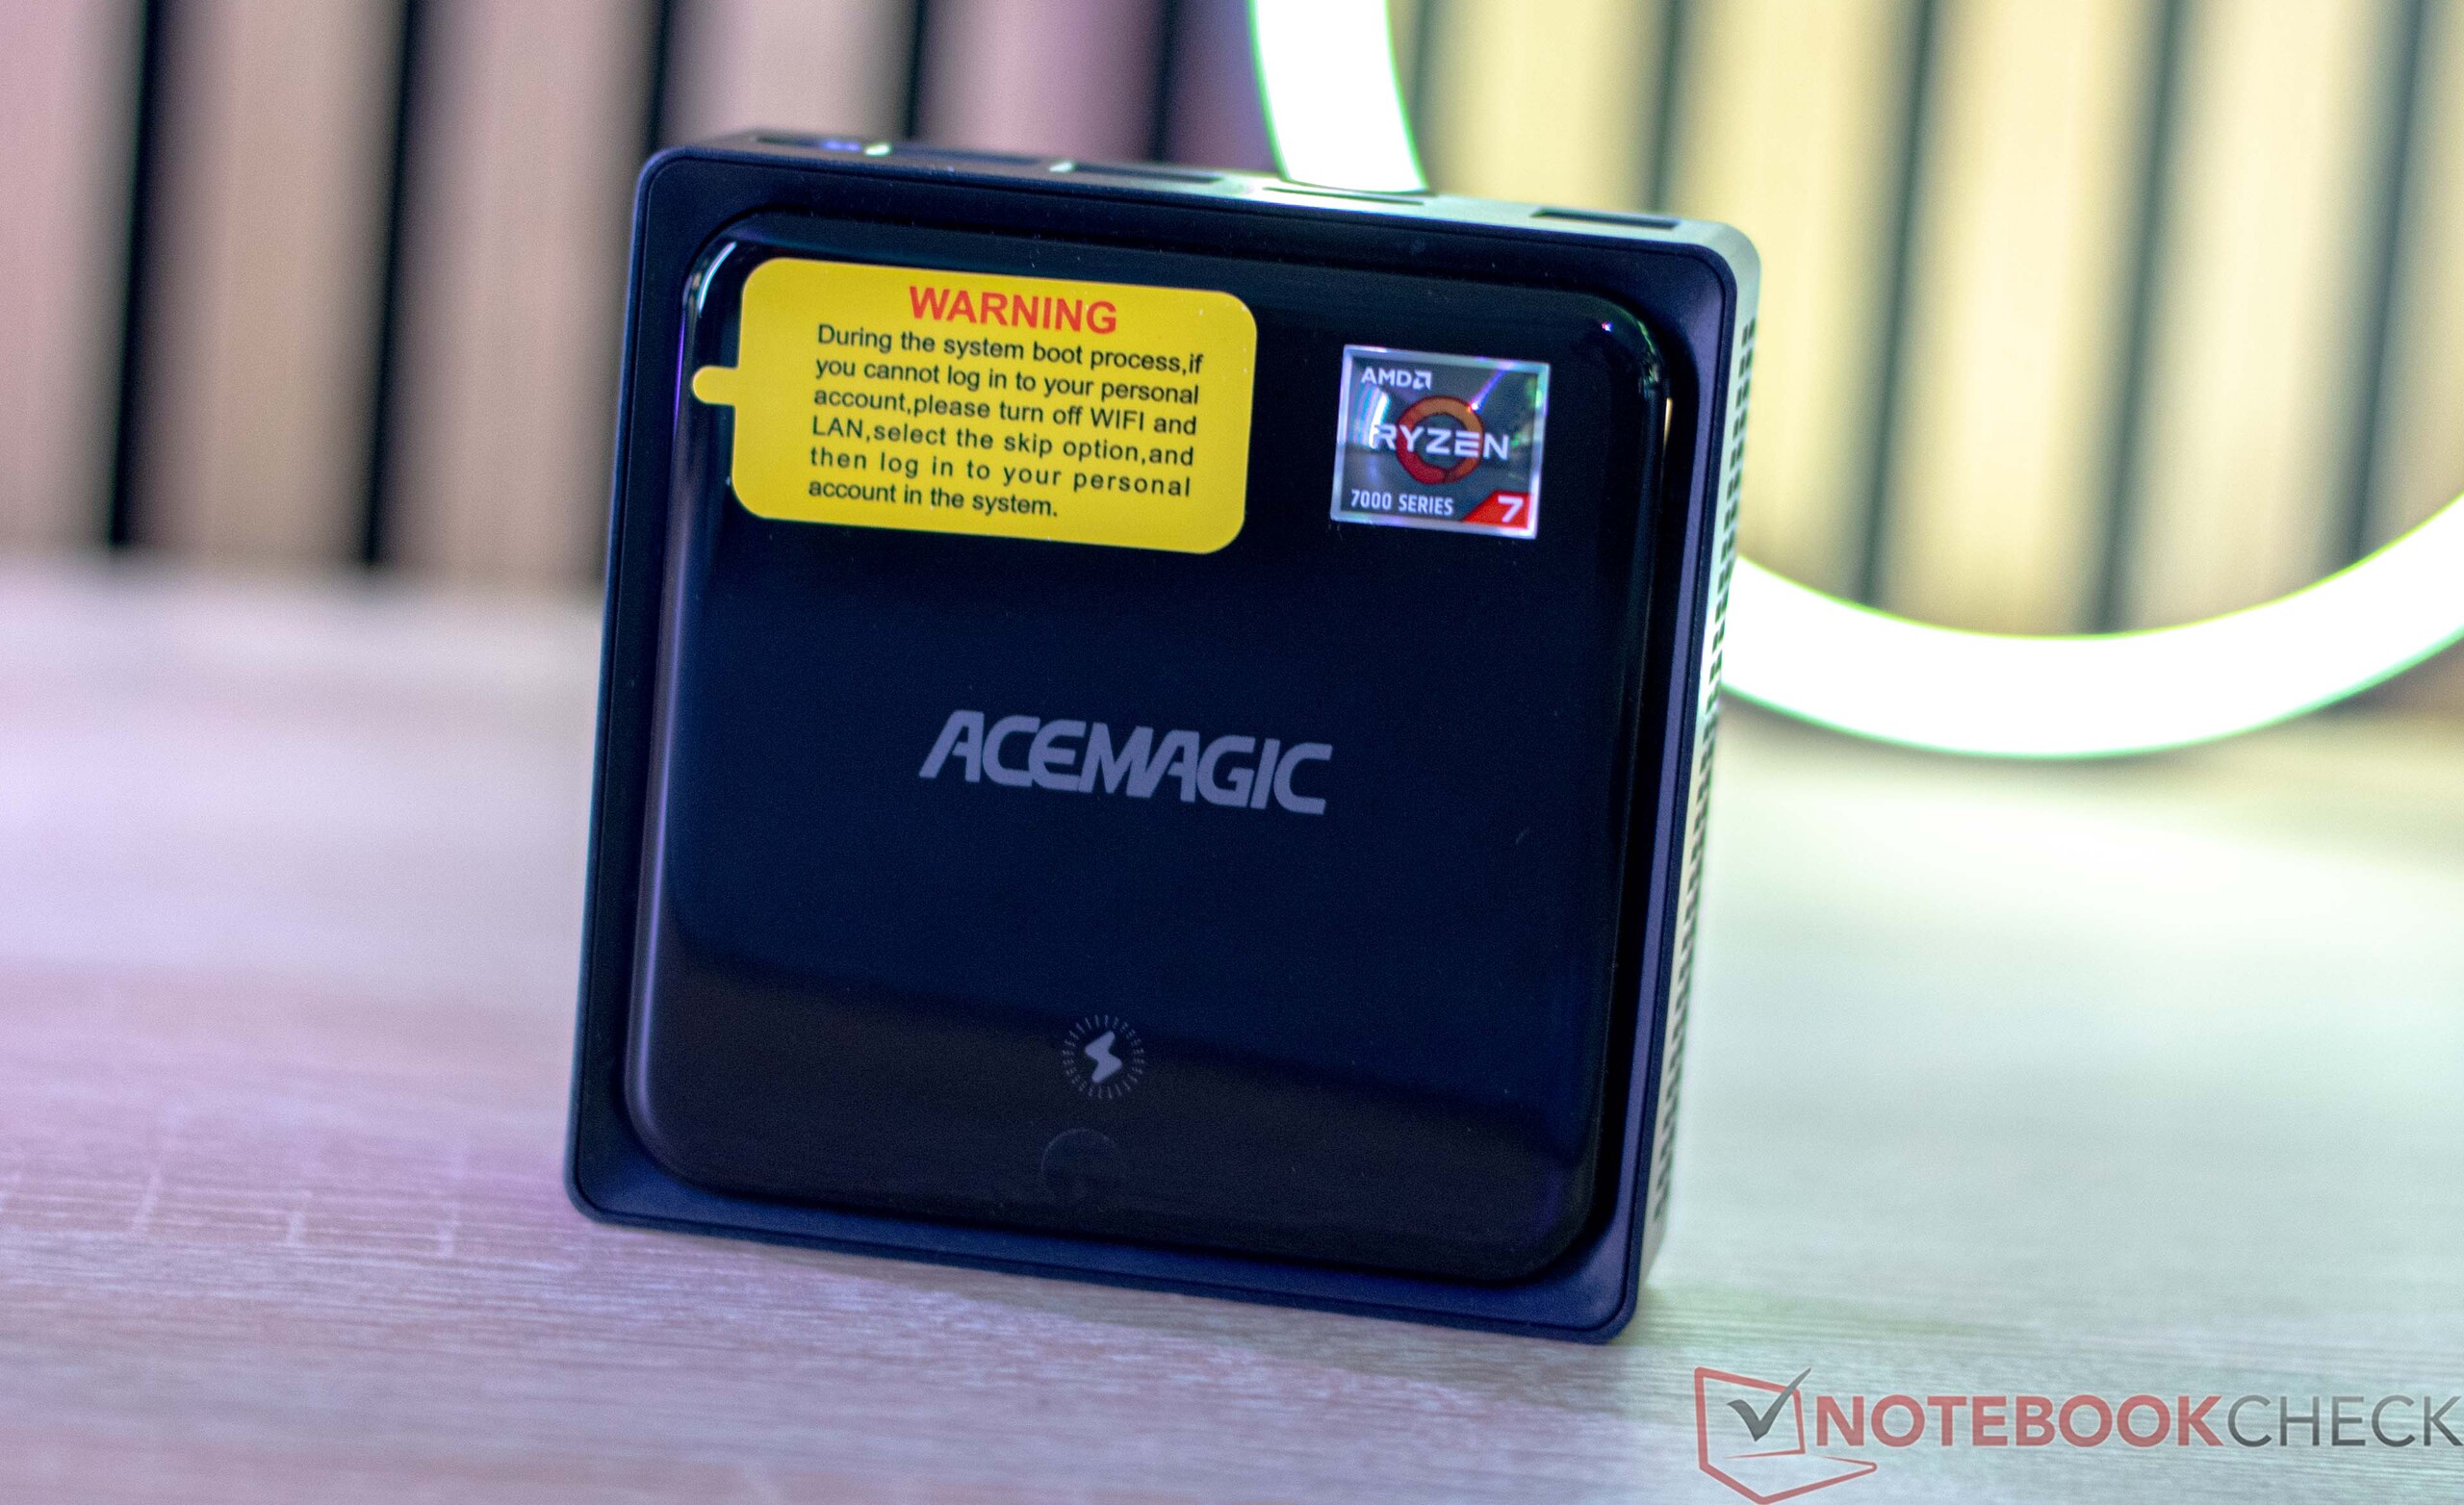
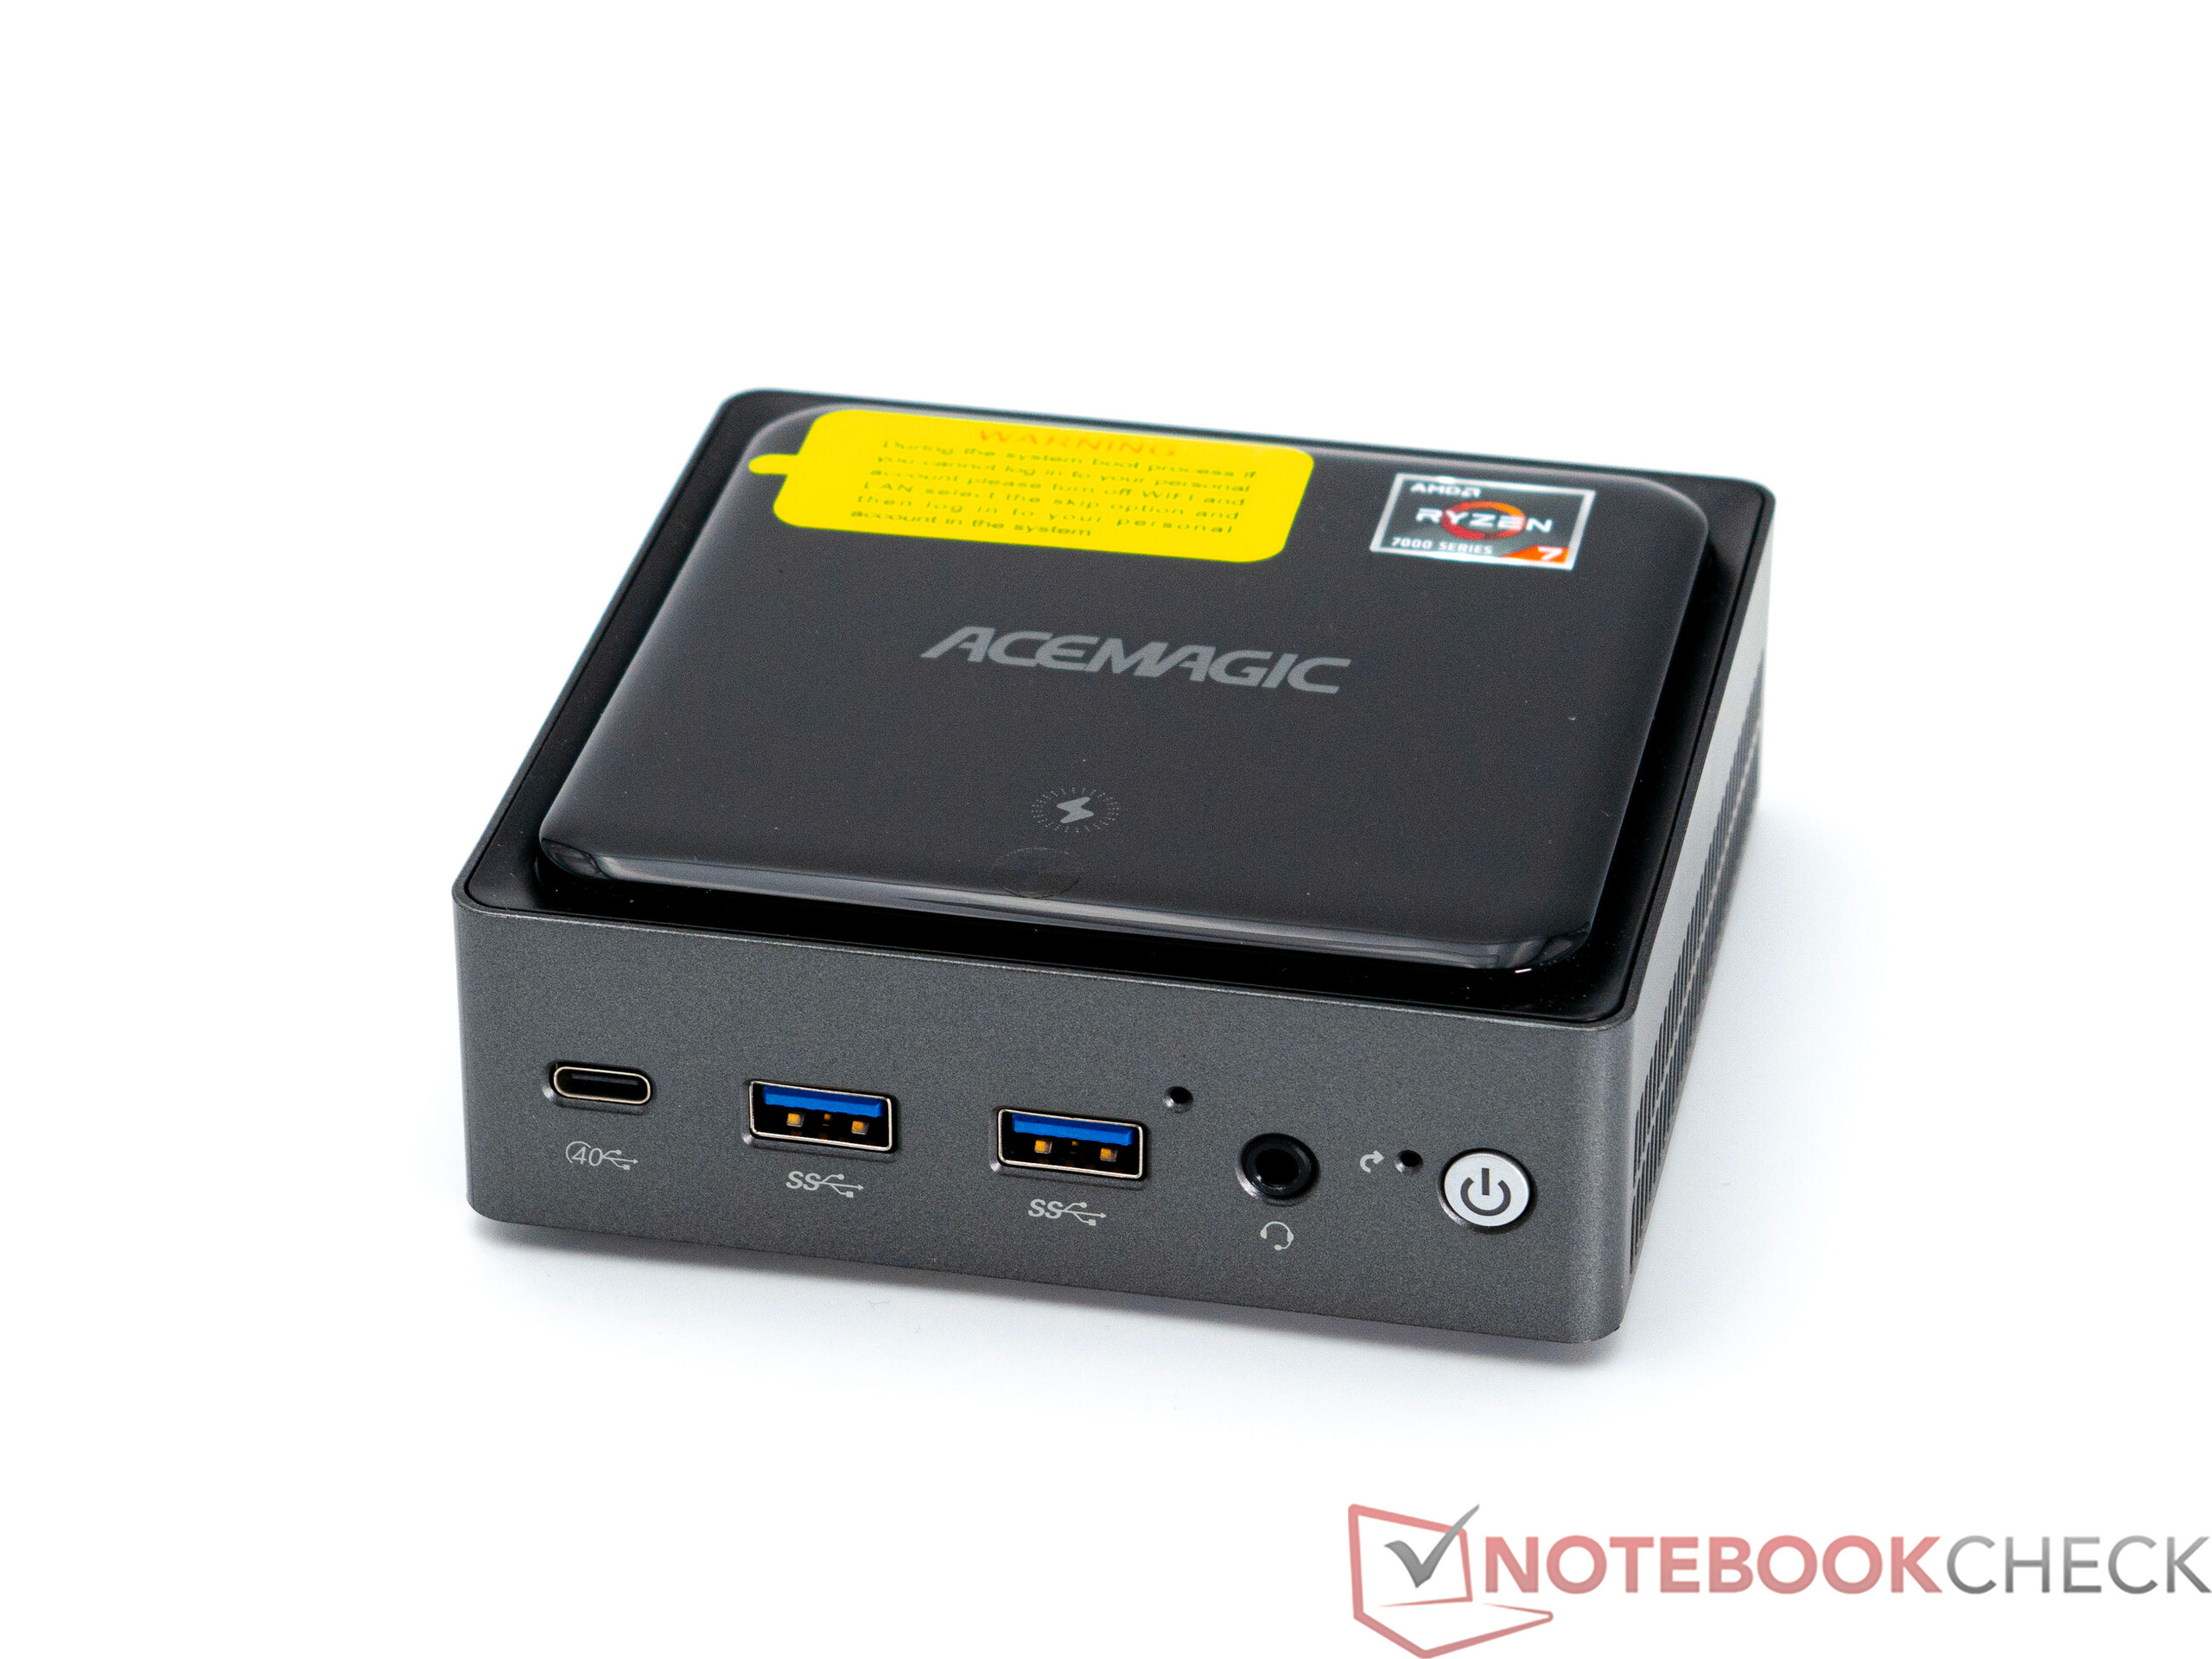
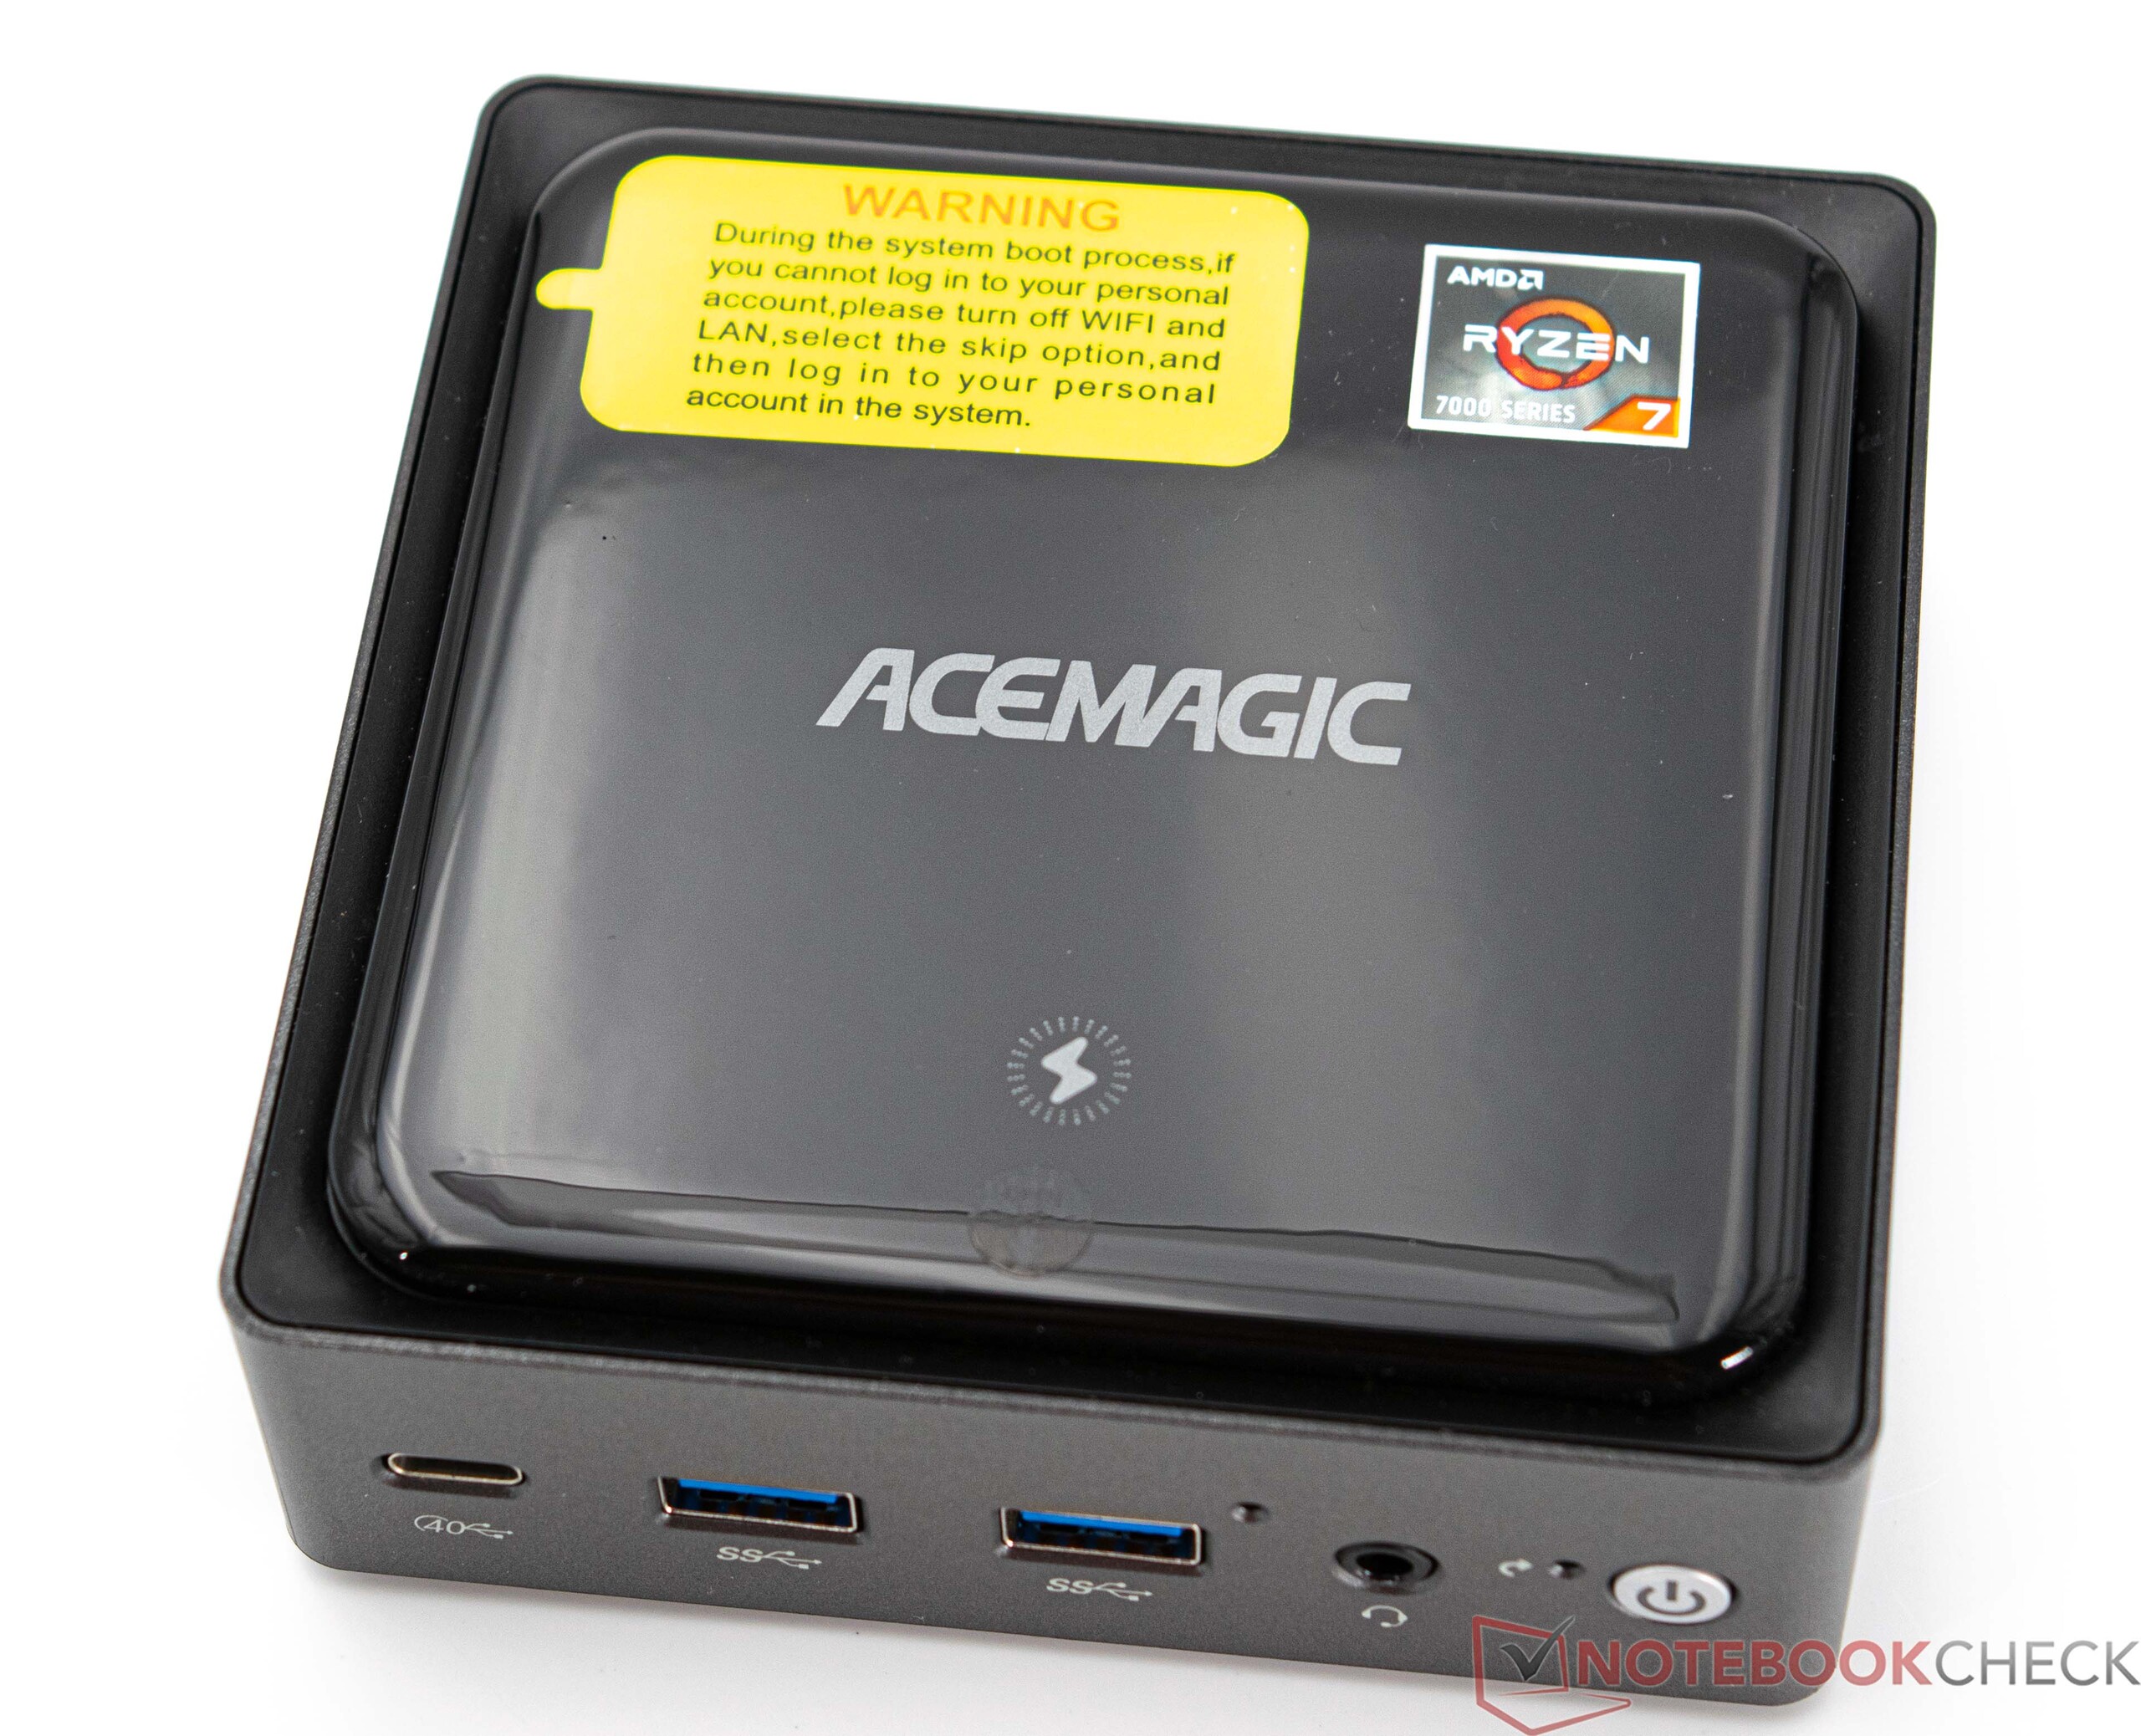
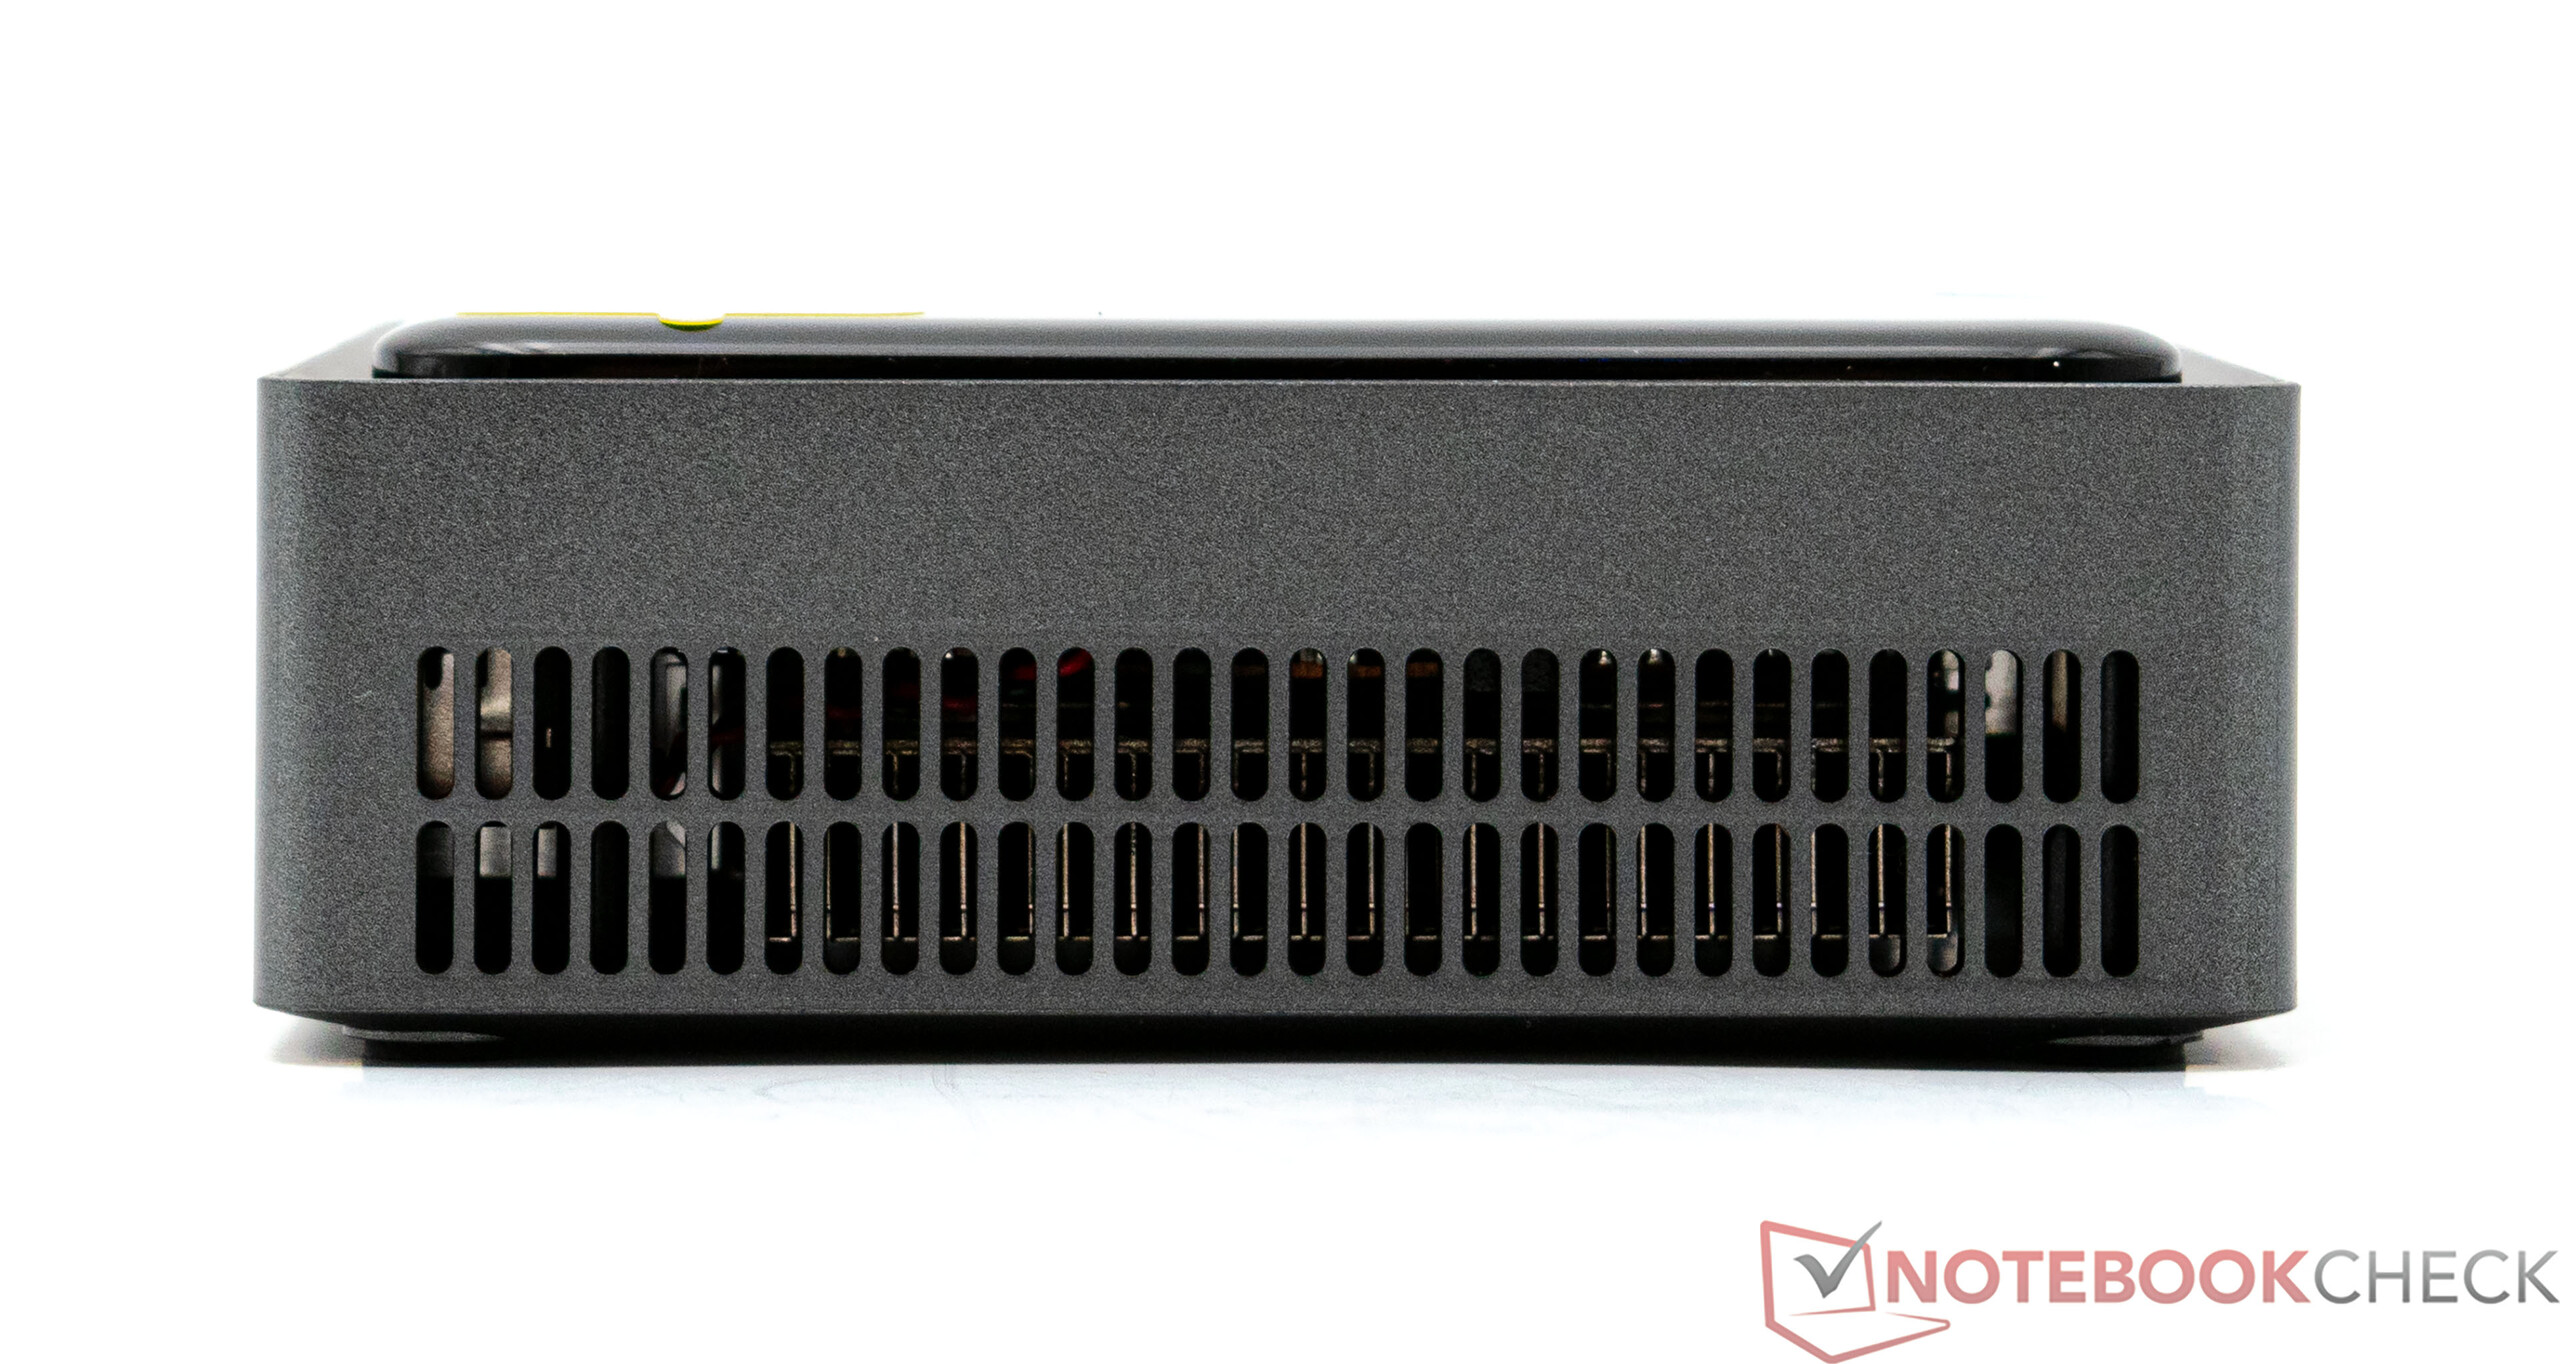
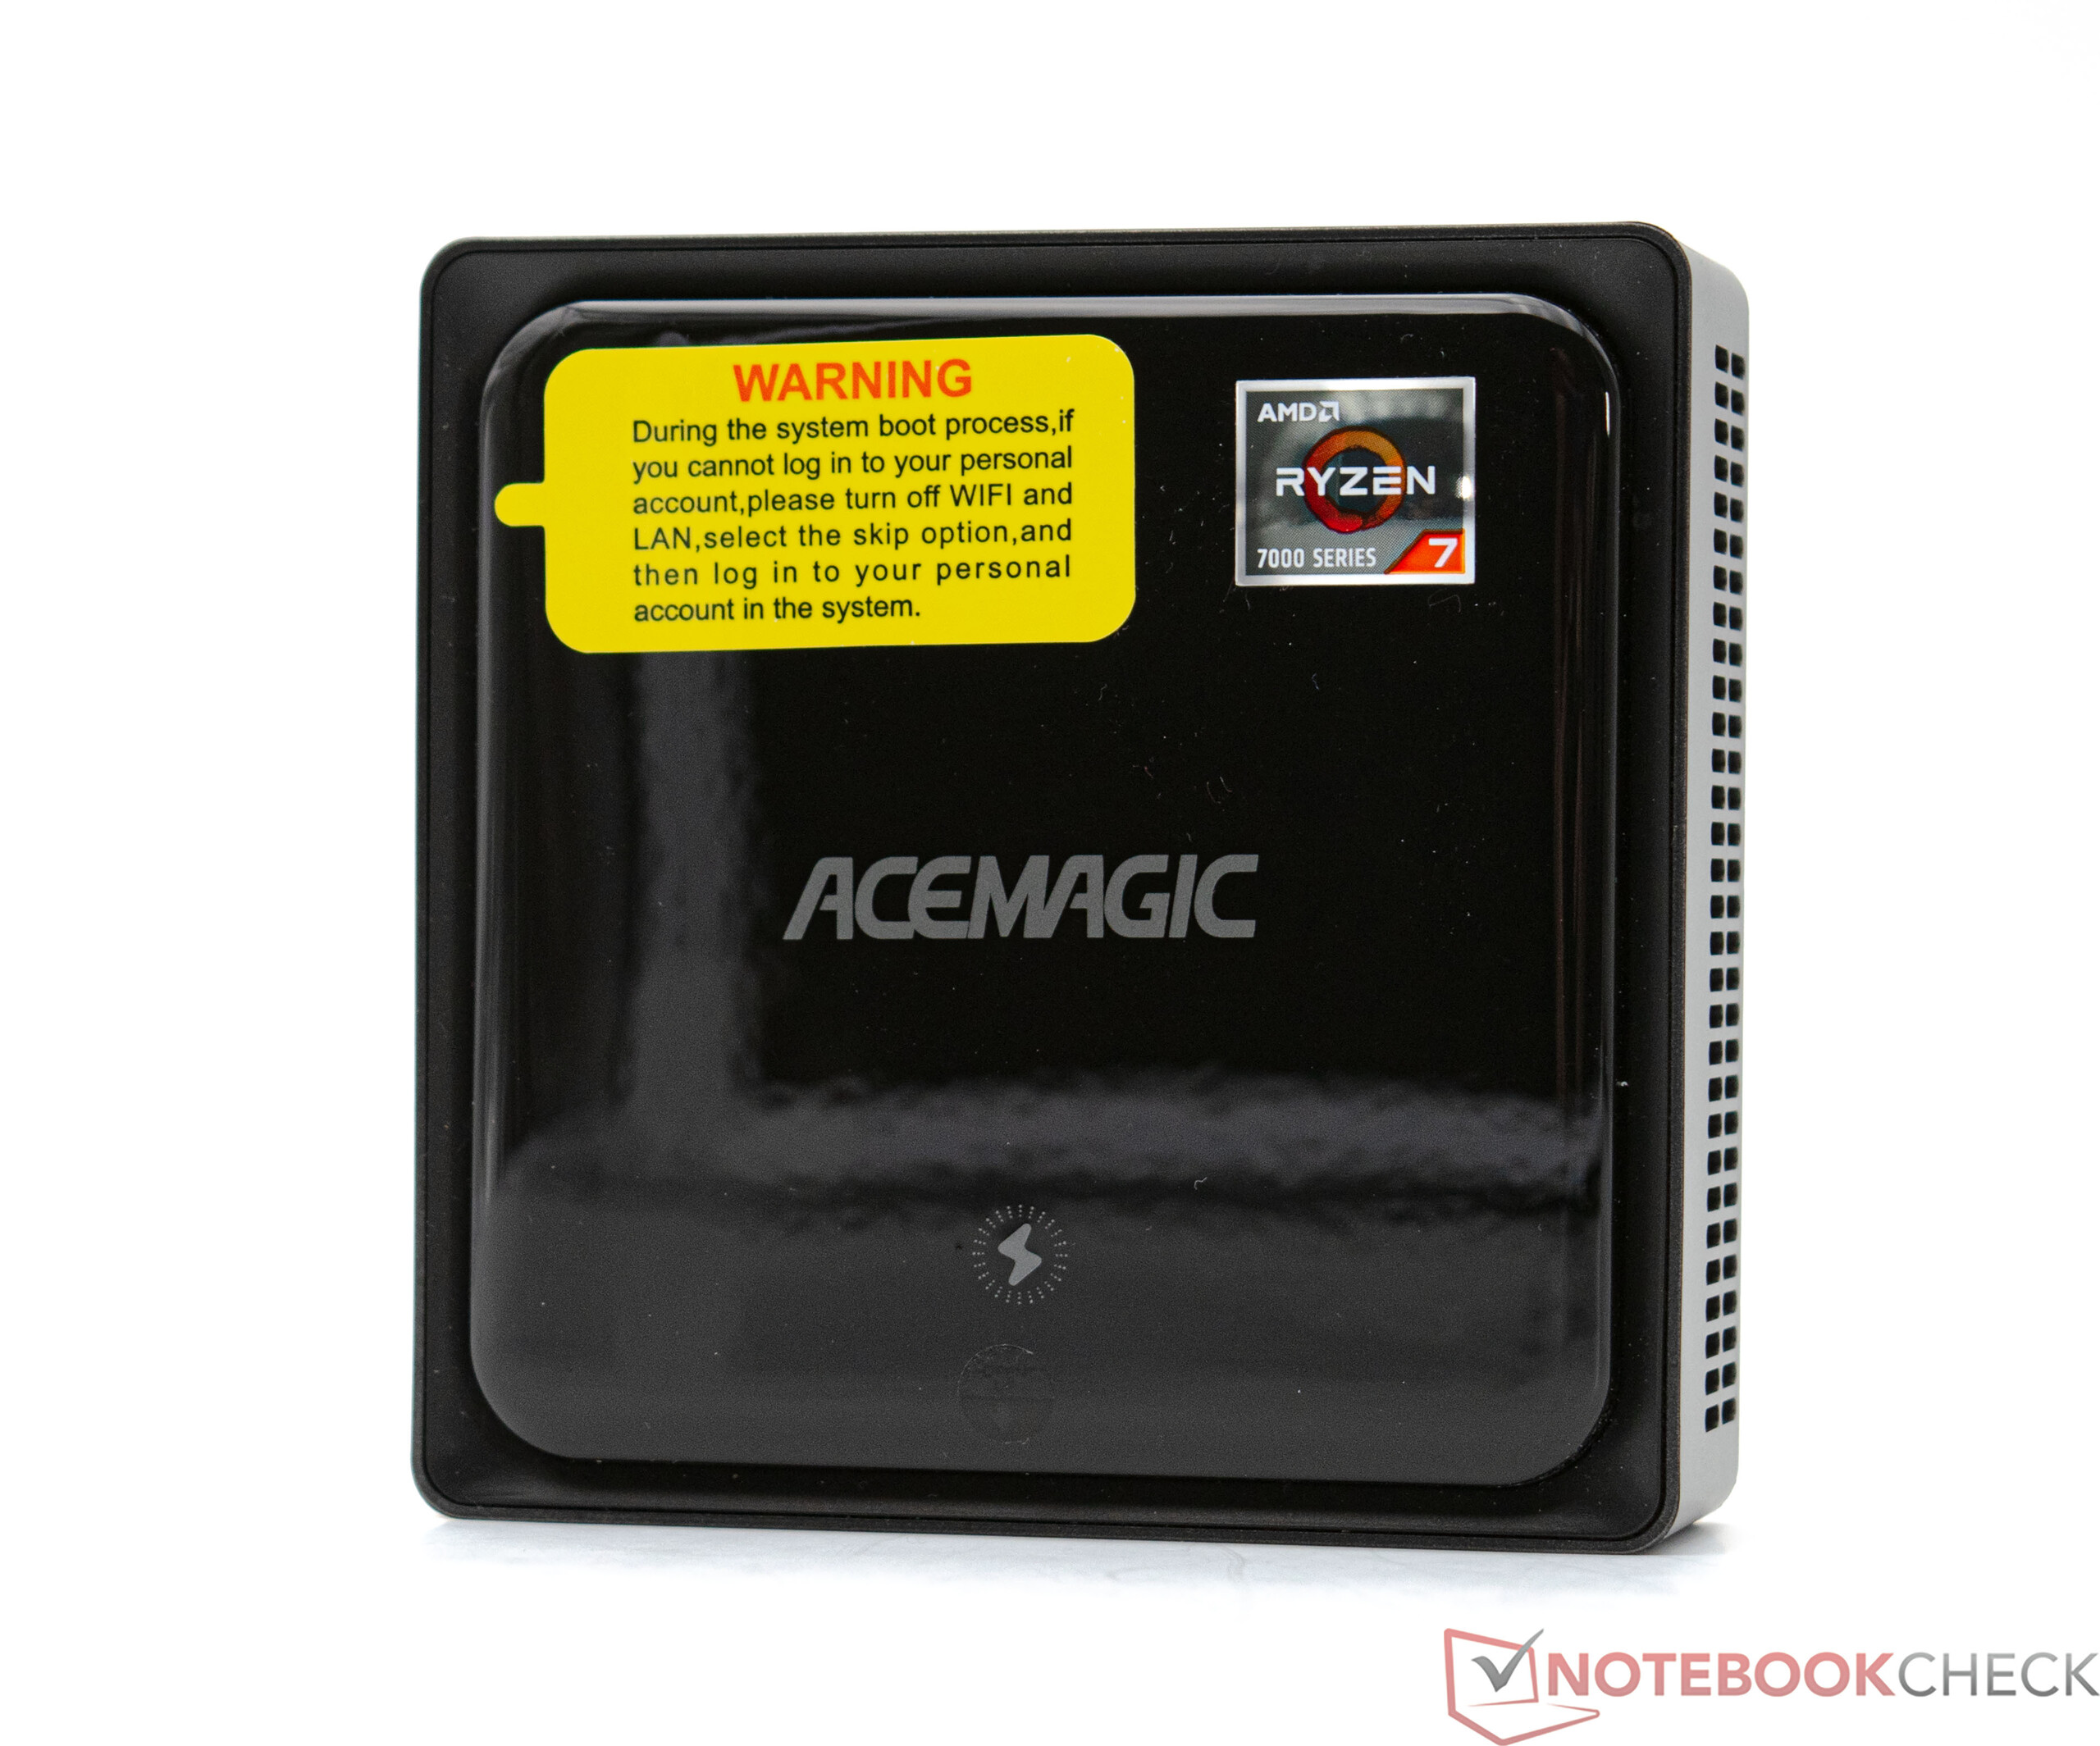
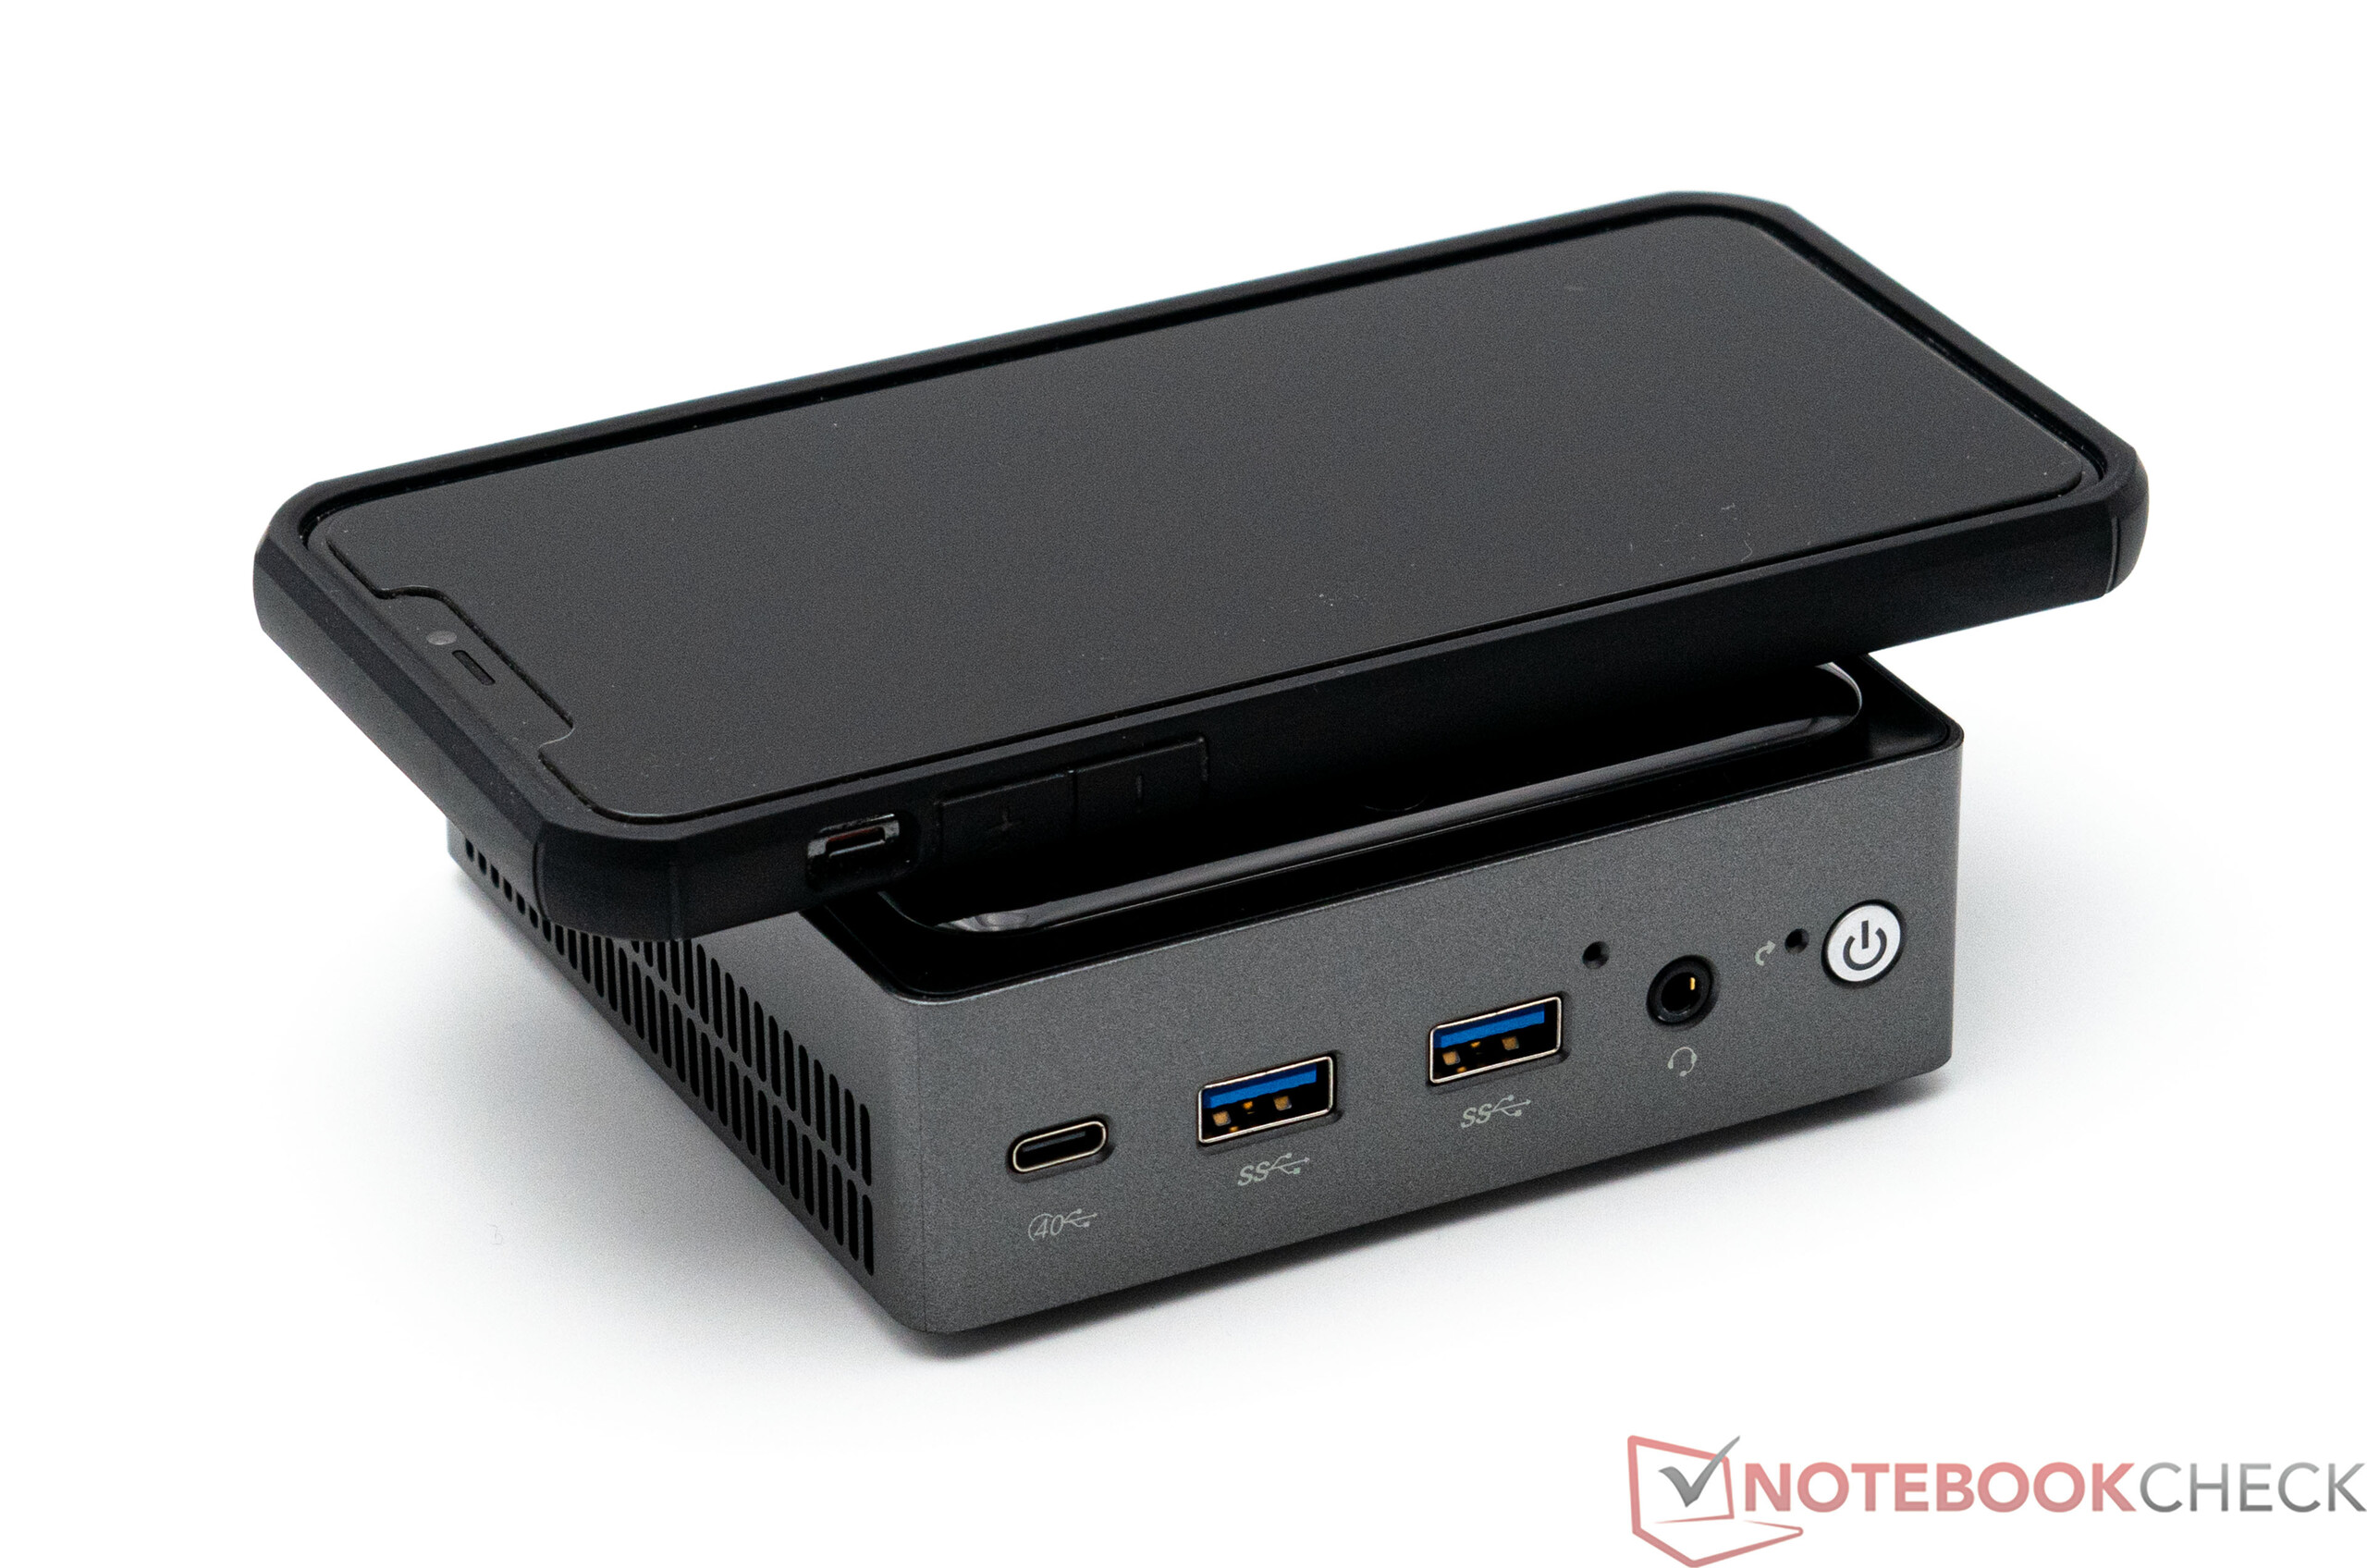
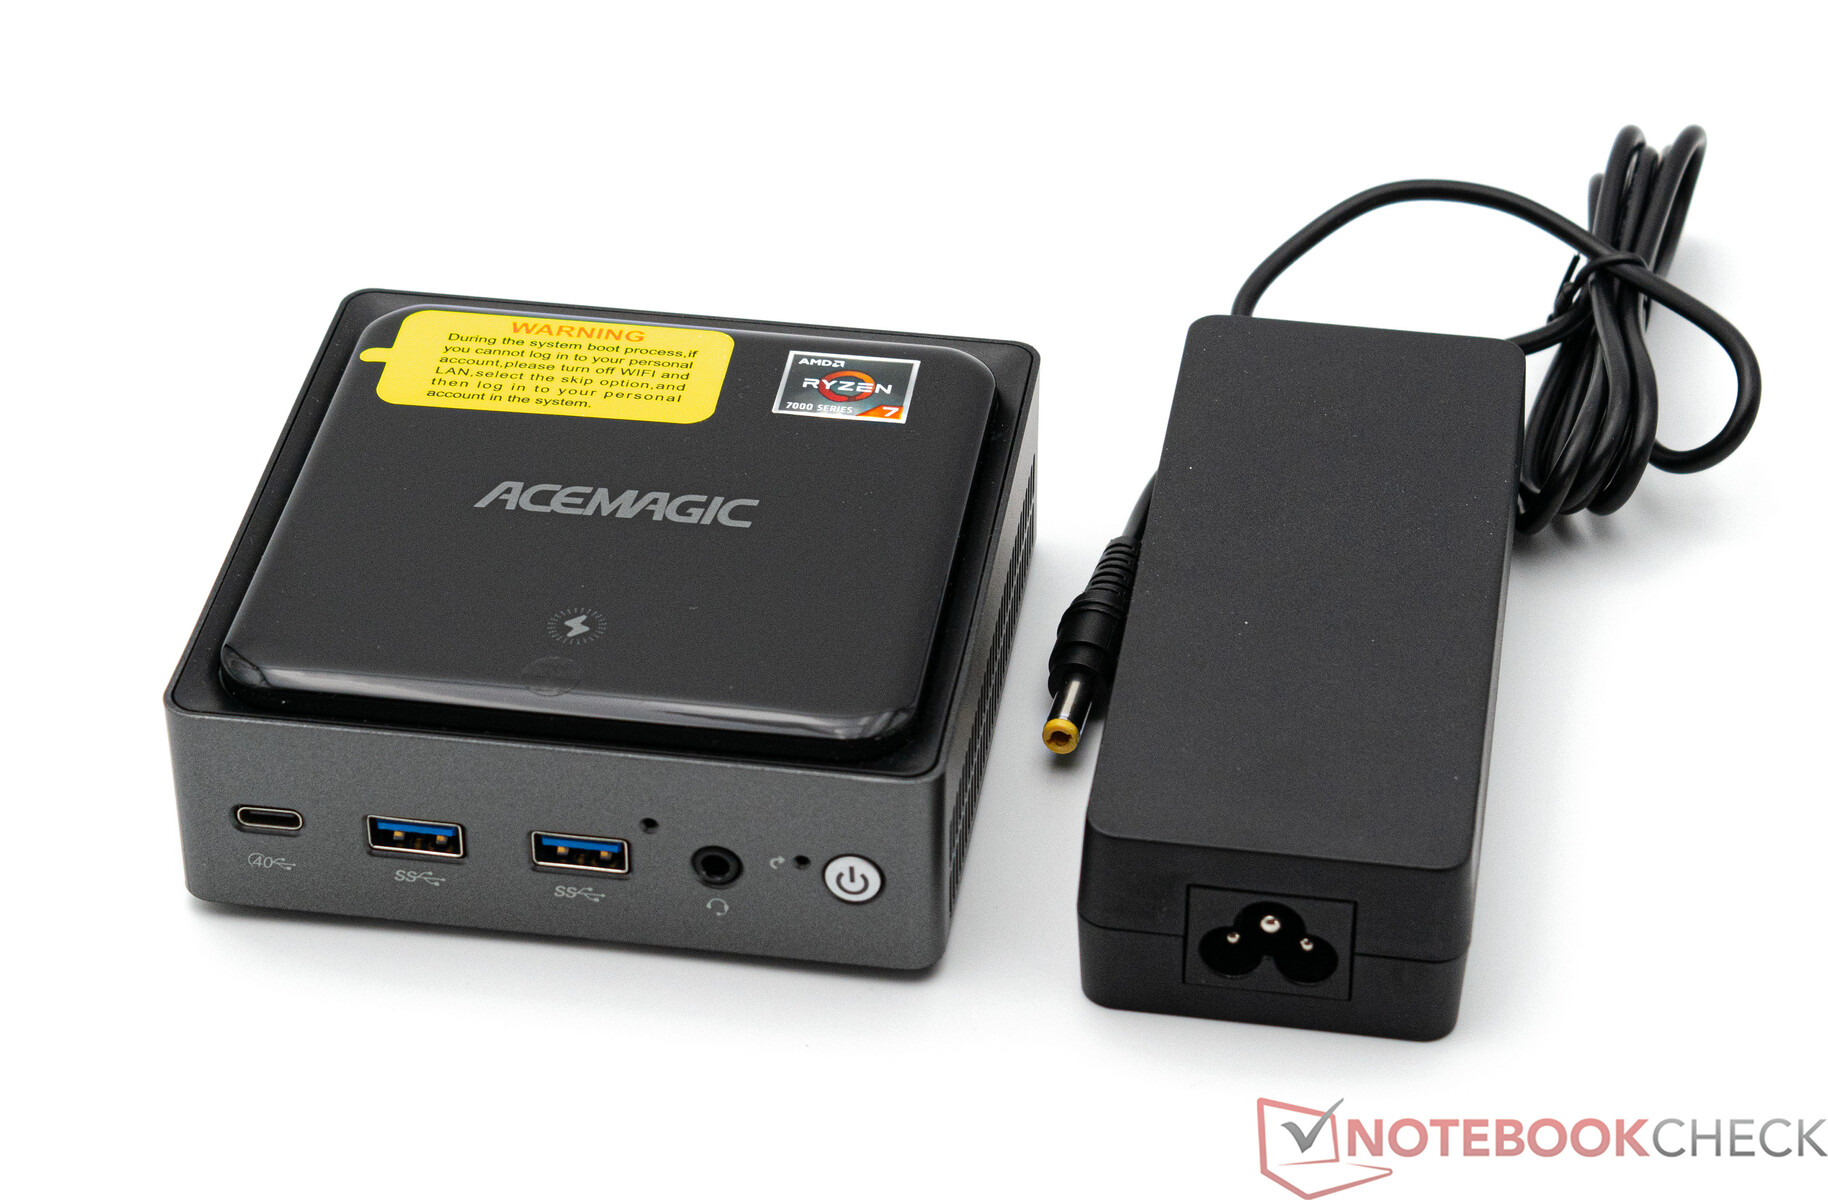
O Acemagic AM20 não chama a atenção visualmente. A parte externa do dispositivo é cinza escuro, embora a tampa pareça preta. Ela brilha com uma aparência de alto brilho que, infelizmente, a torna propensa a atrair impressões digitais. Escondida dentro da caixa está uma unidade de carregamento para carregamento sem fio. Os smartphones, por exemplo, podem ser carregados durante a operação com até 10 watts. Isso torna o Acemagic AM20 o menor minicomputador com função de carregamento sem fio. Ao dar uma olhada nos requisitos de espaço, o Acermagic AM20 pertence, mais uma vez, aos dispositivos mais compactos. Com 10,7 × 10,7 centímetros, sua área de cobertura é muito pequena. Em termos de altura, também medimos apenas 3,8 centímetros.
O Acemagic AM20 pode ser fixado em um monitor por meio de um suporte VESA. Entretanto, esse tipo de implementação deve dificultar o uso da unidade de carregamento integrada na caixa.
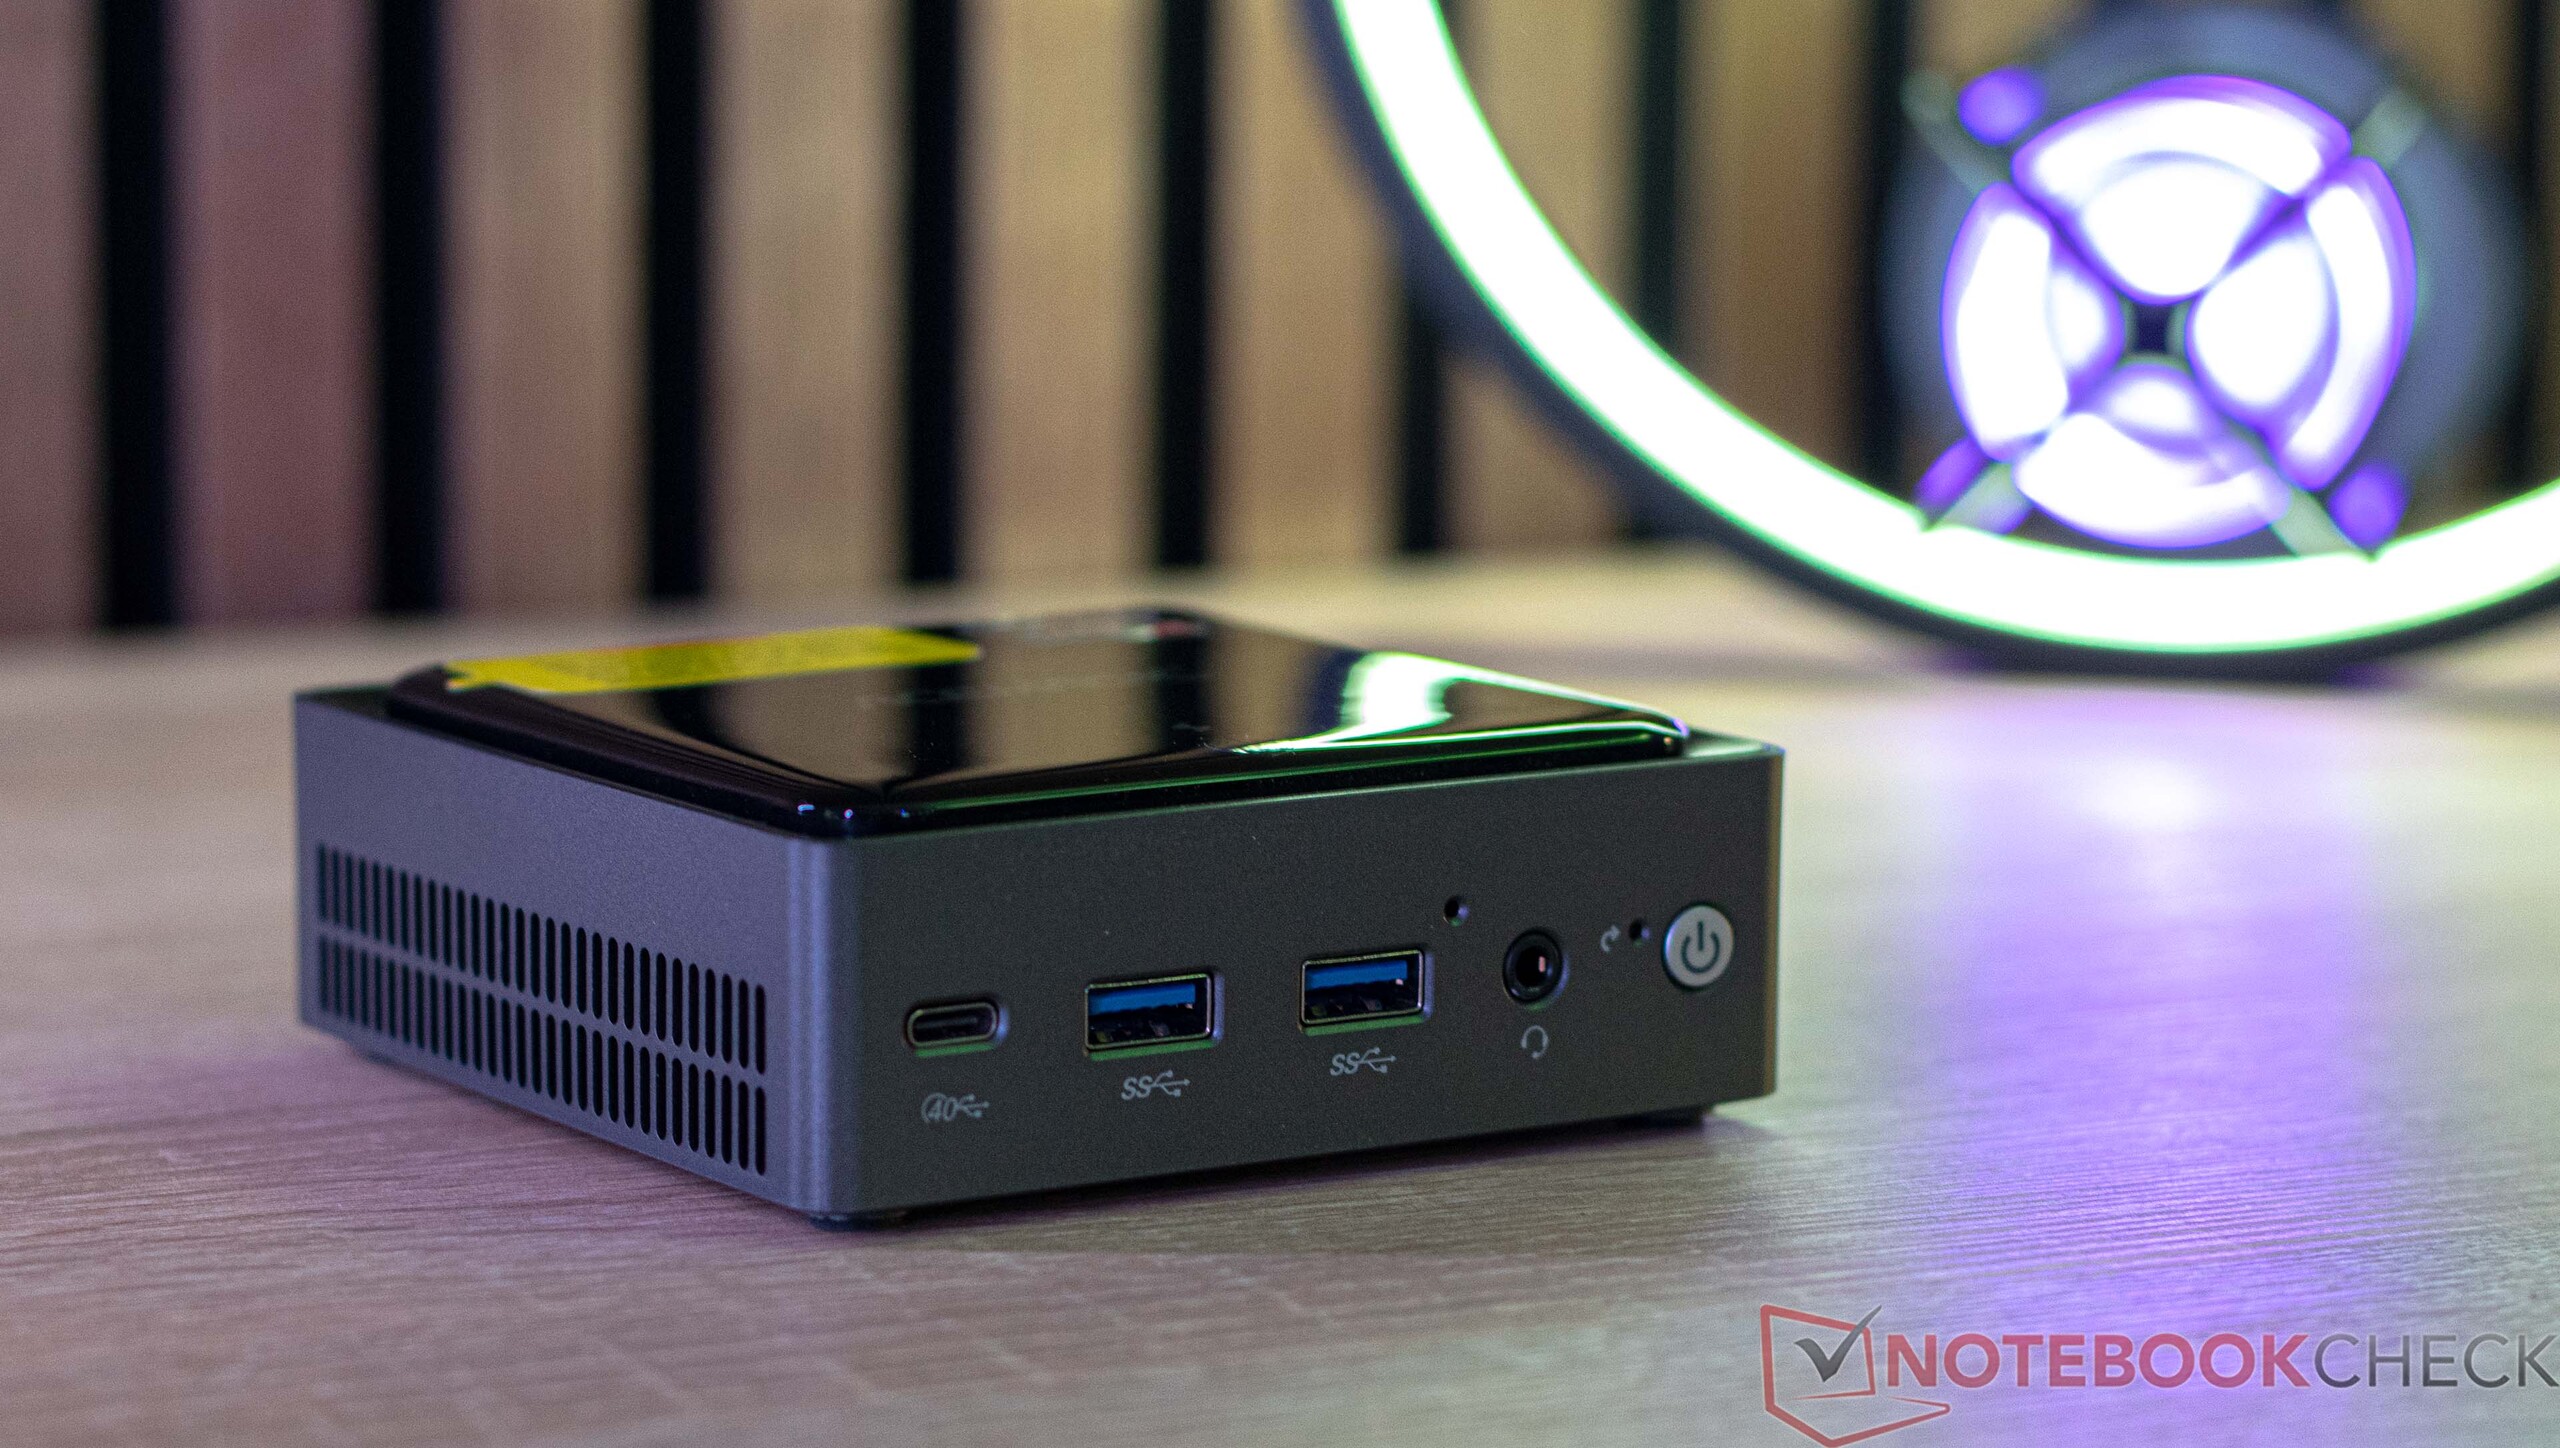
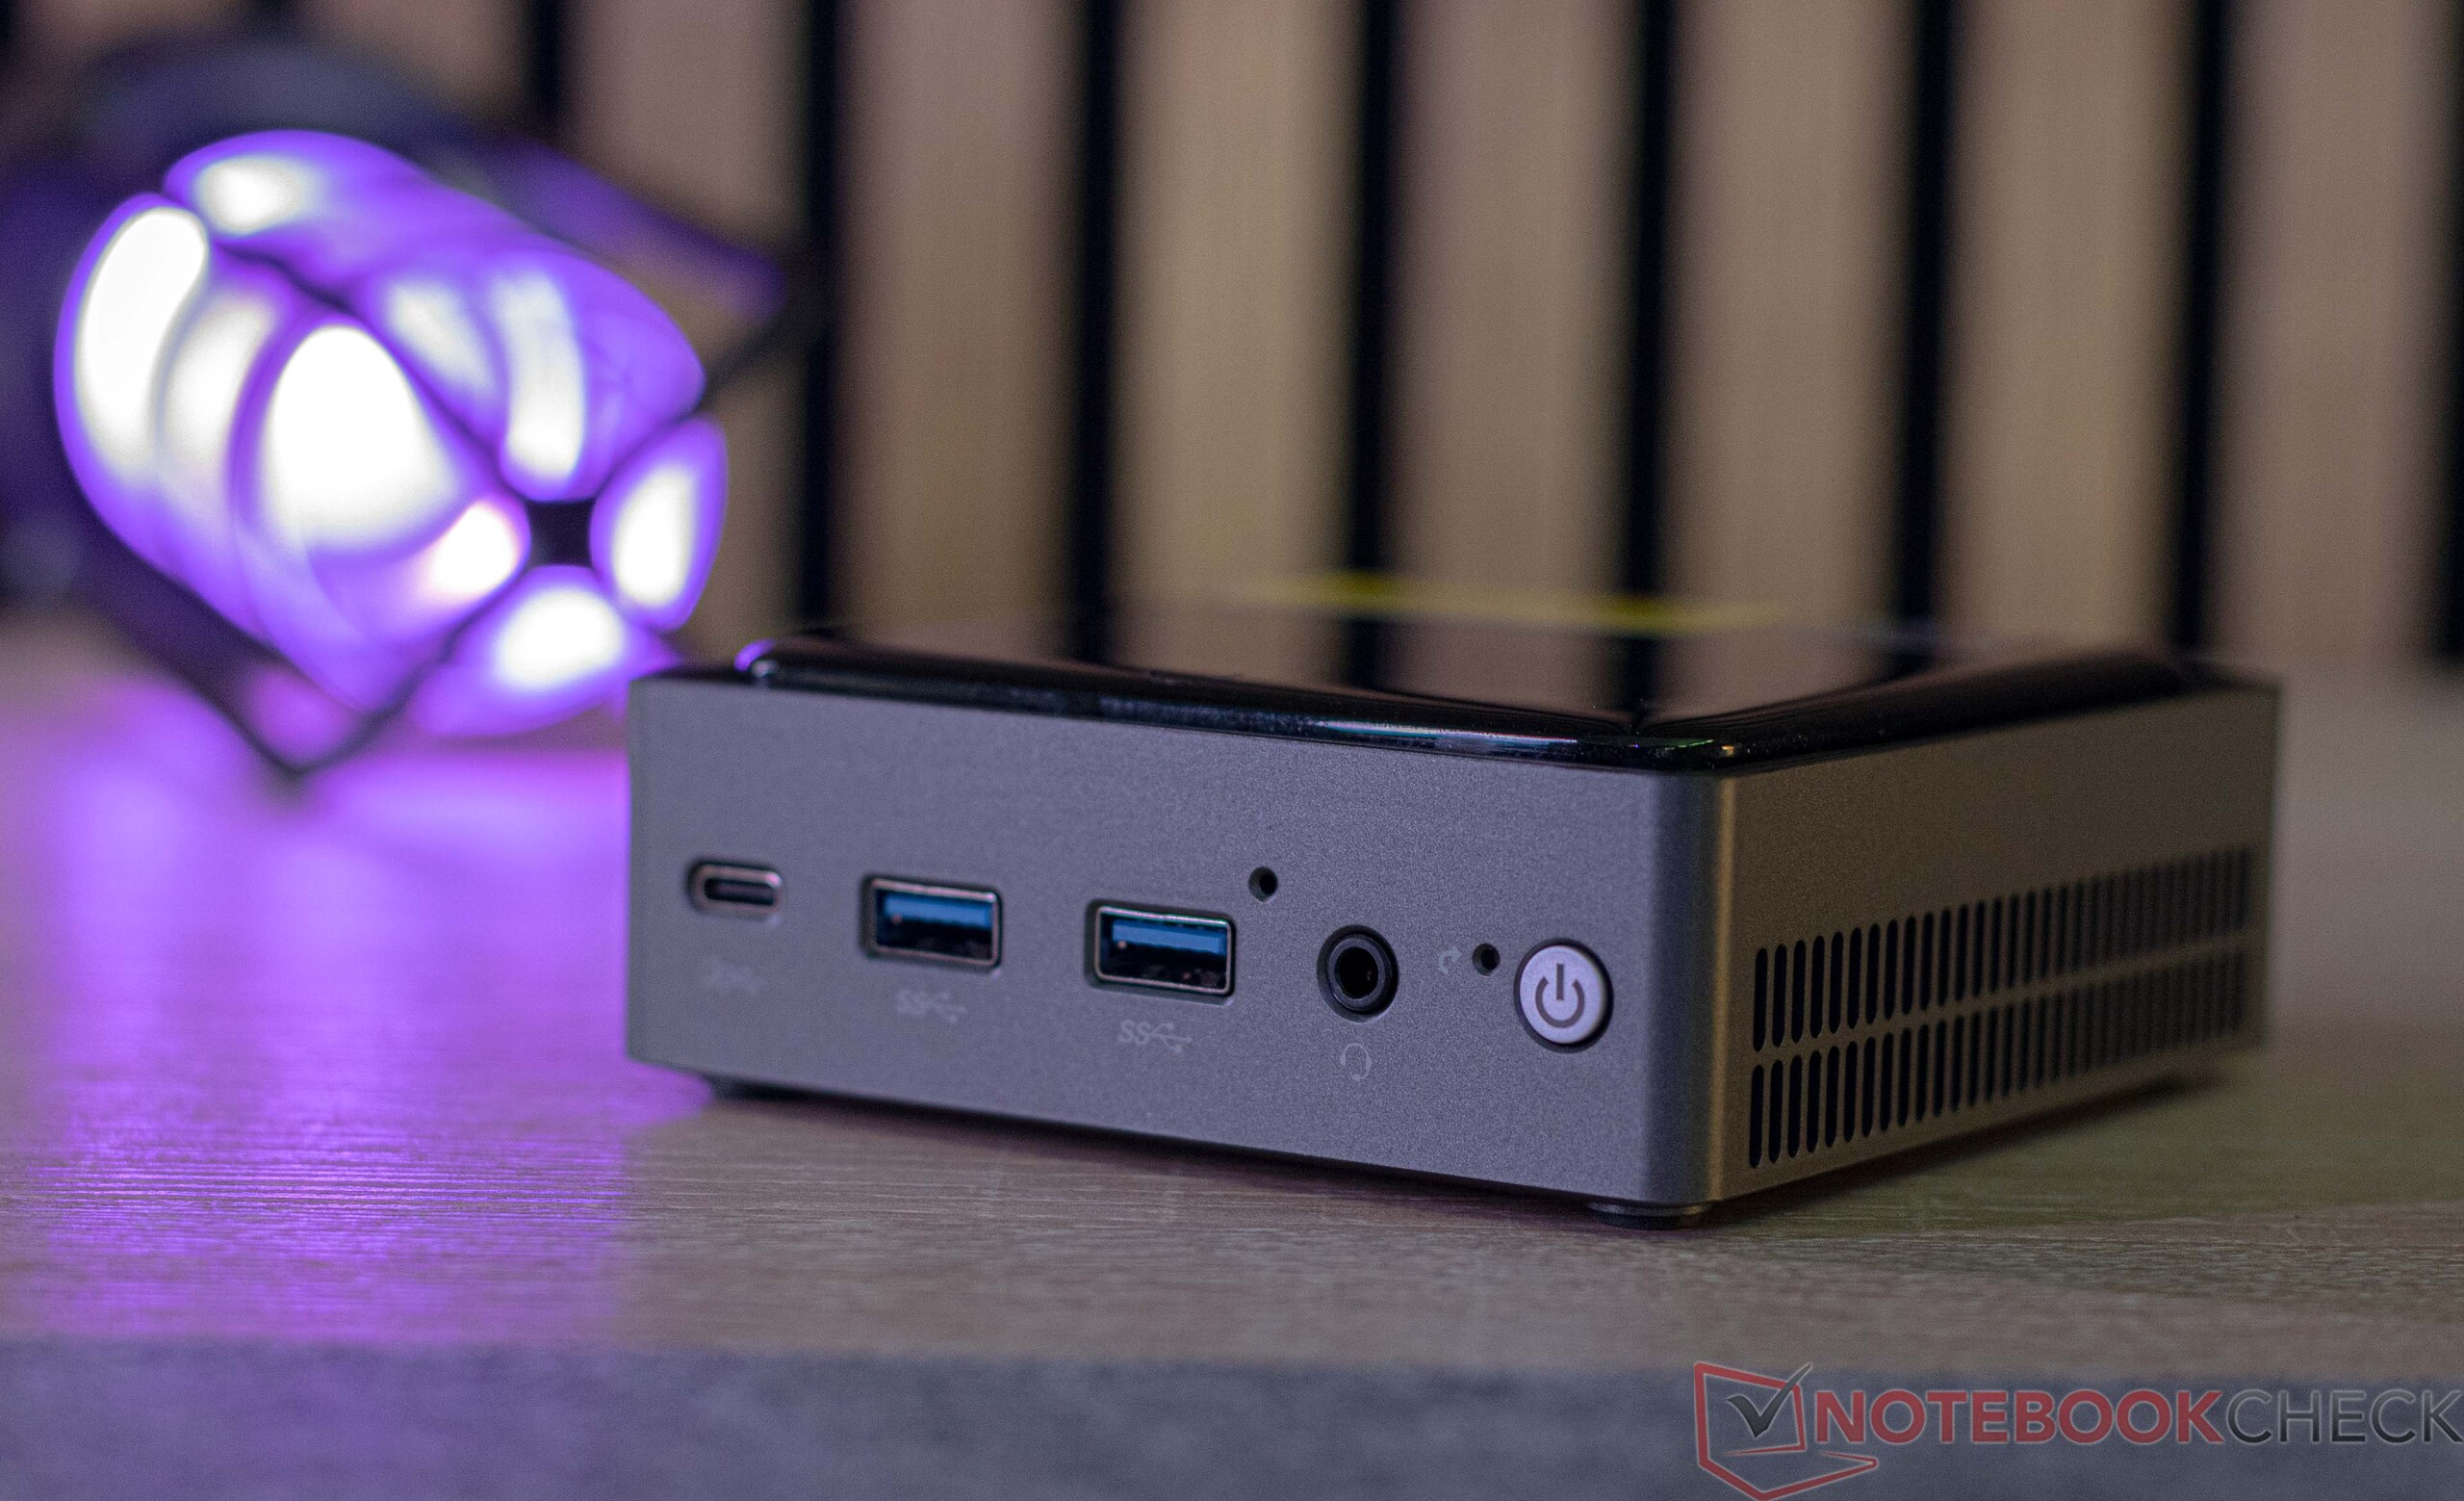
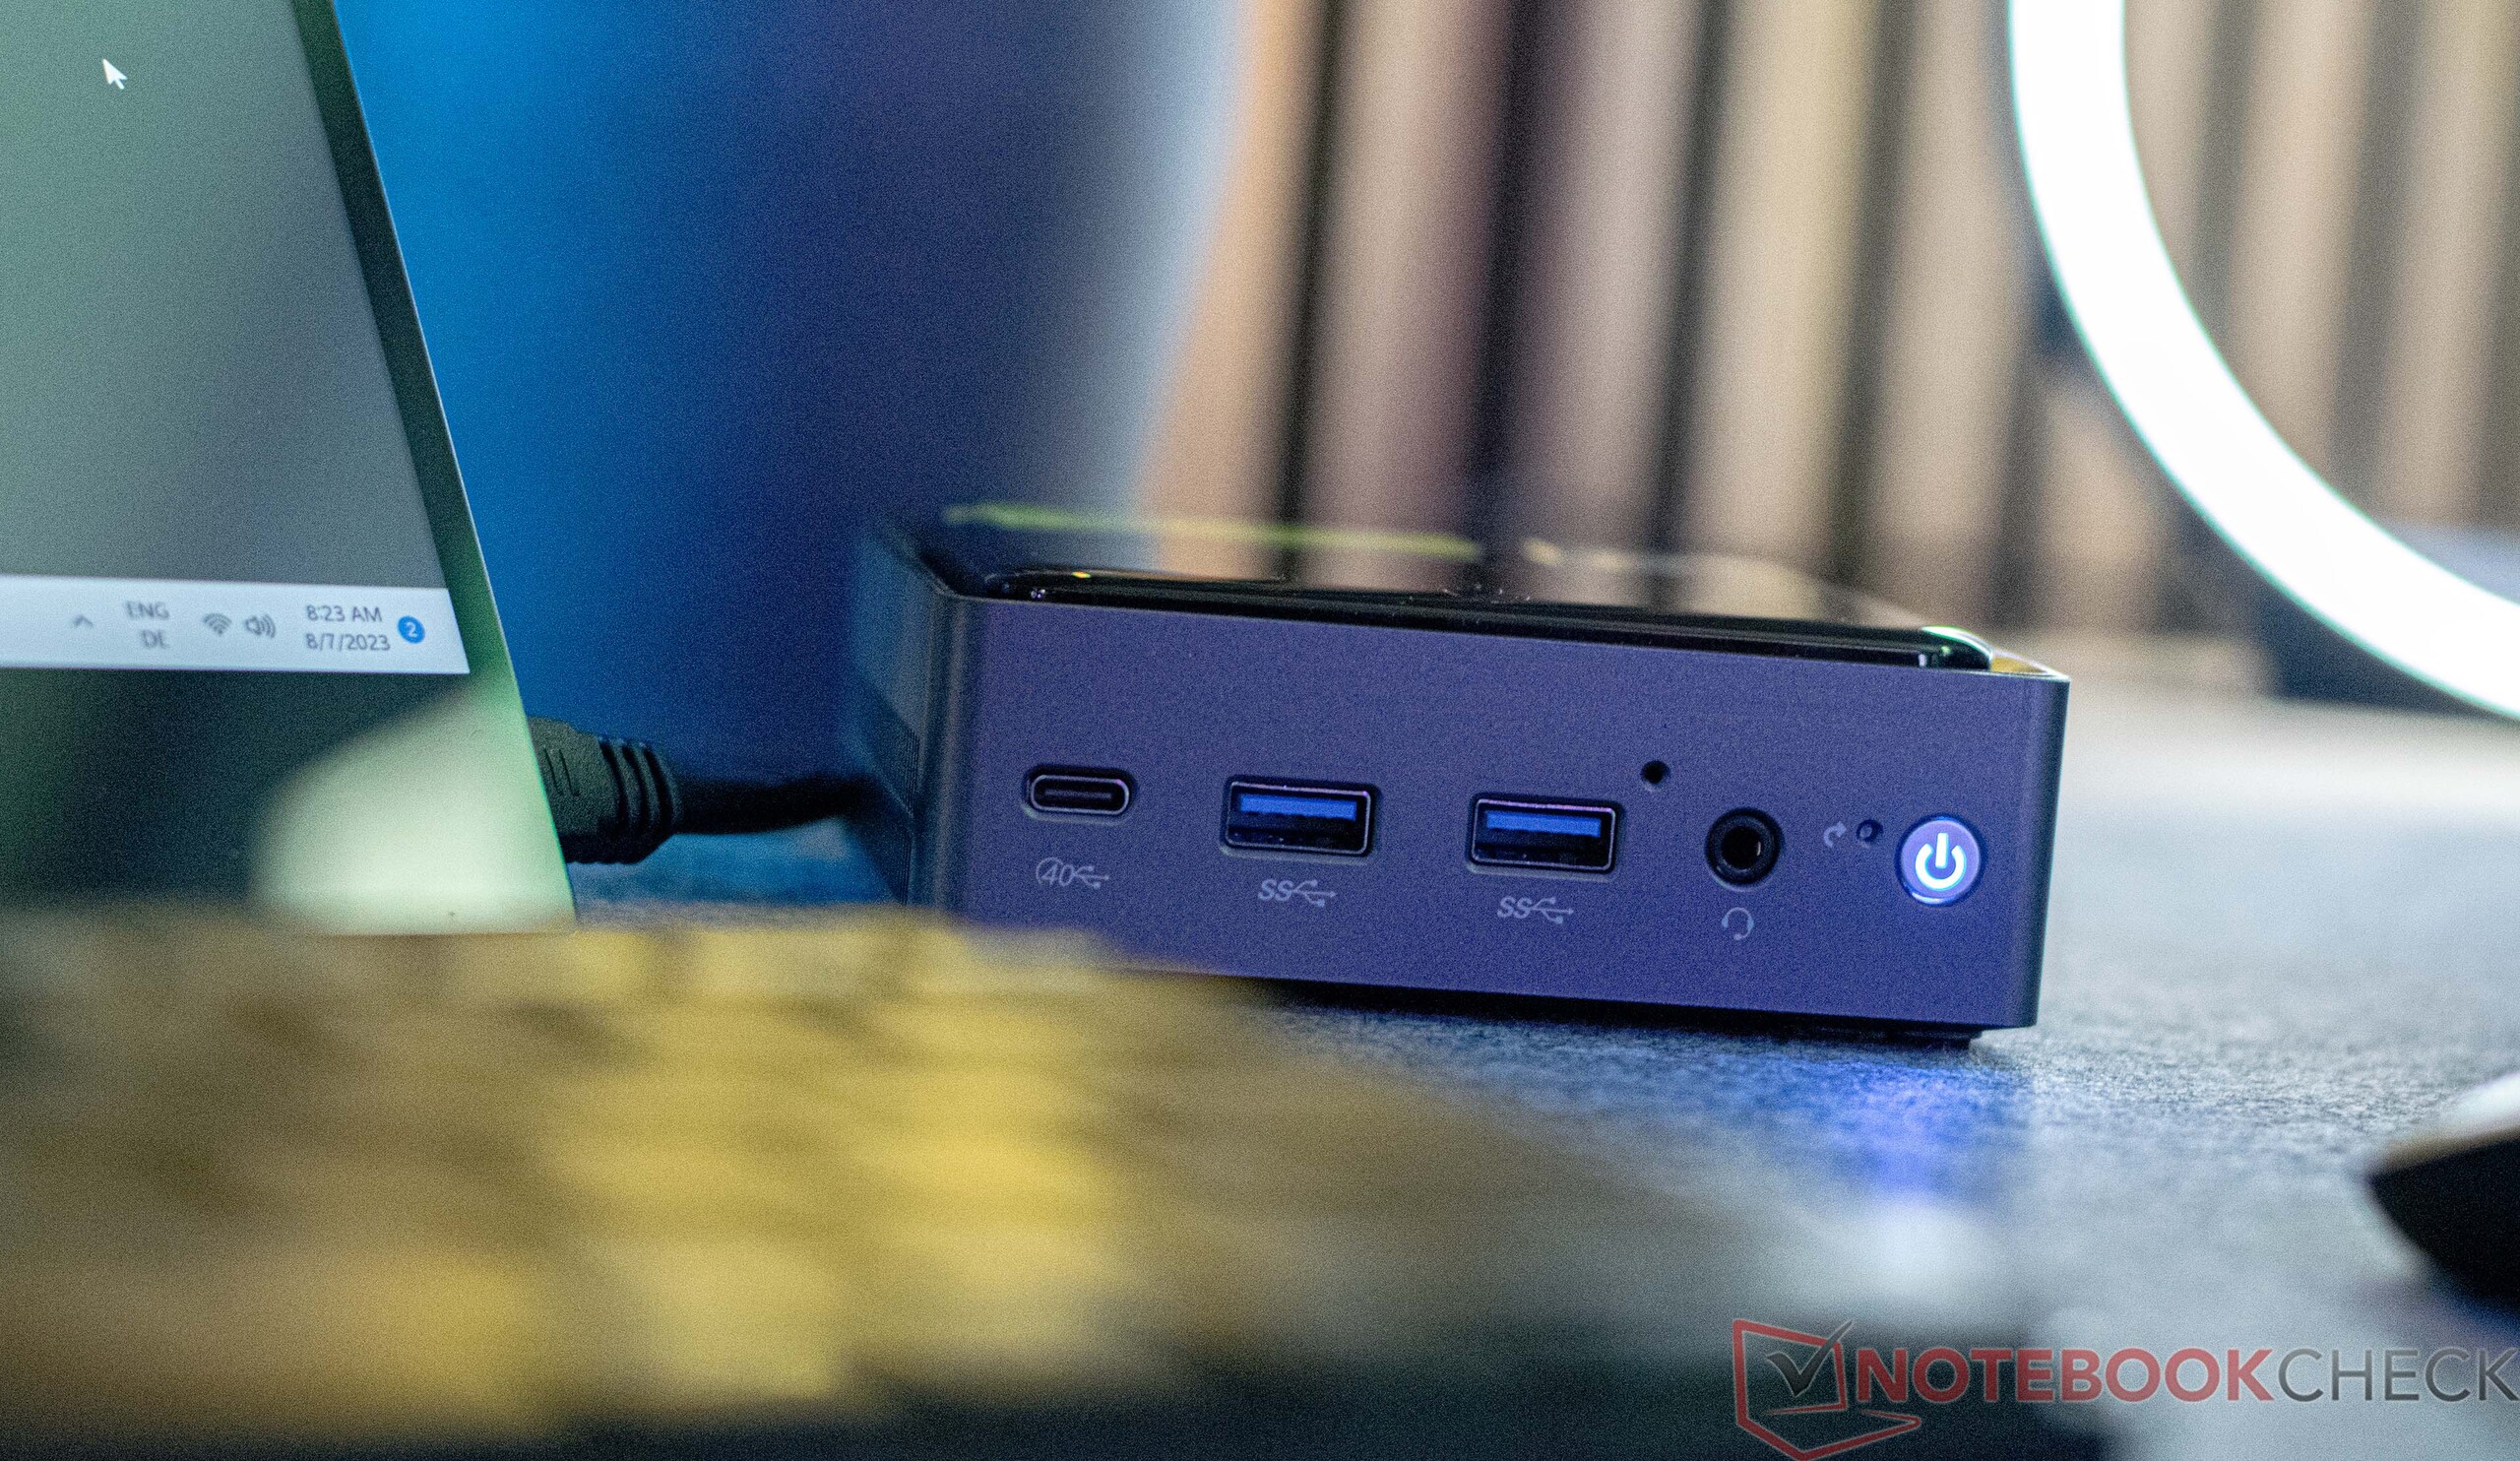
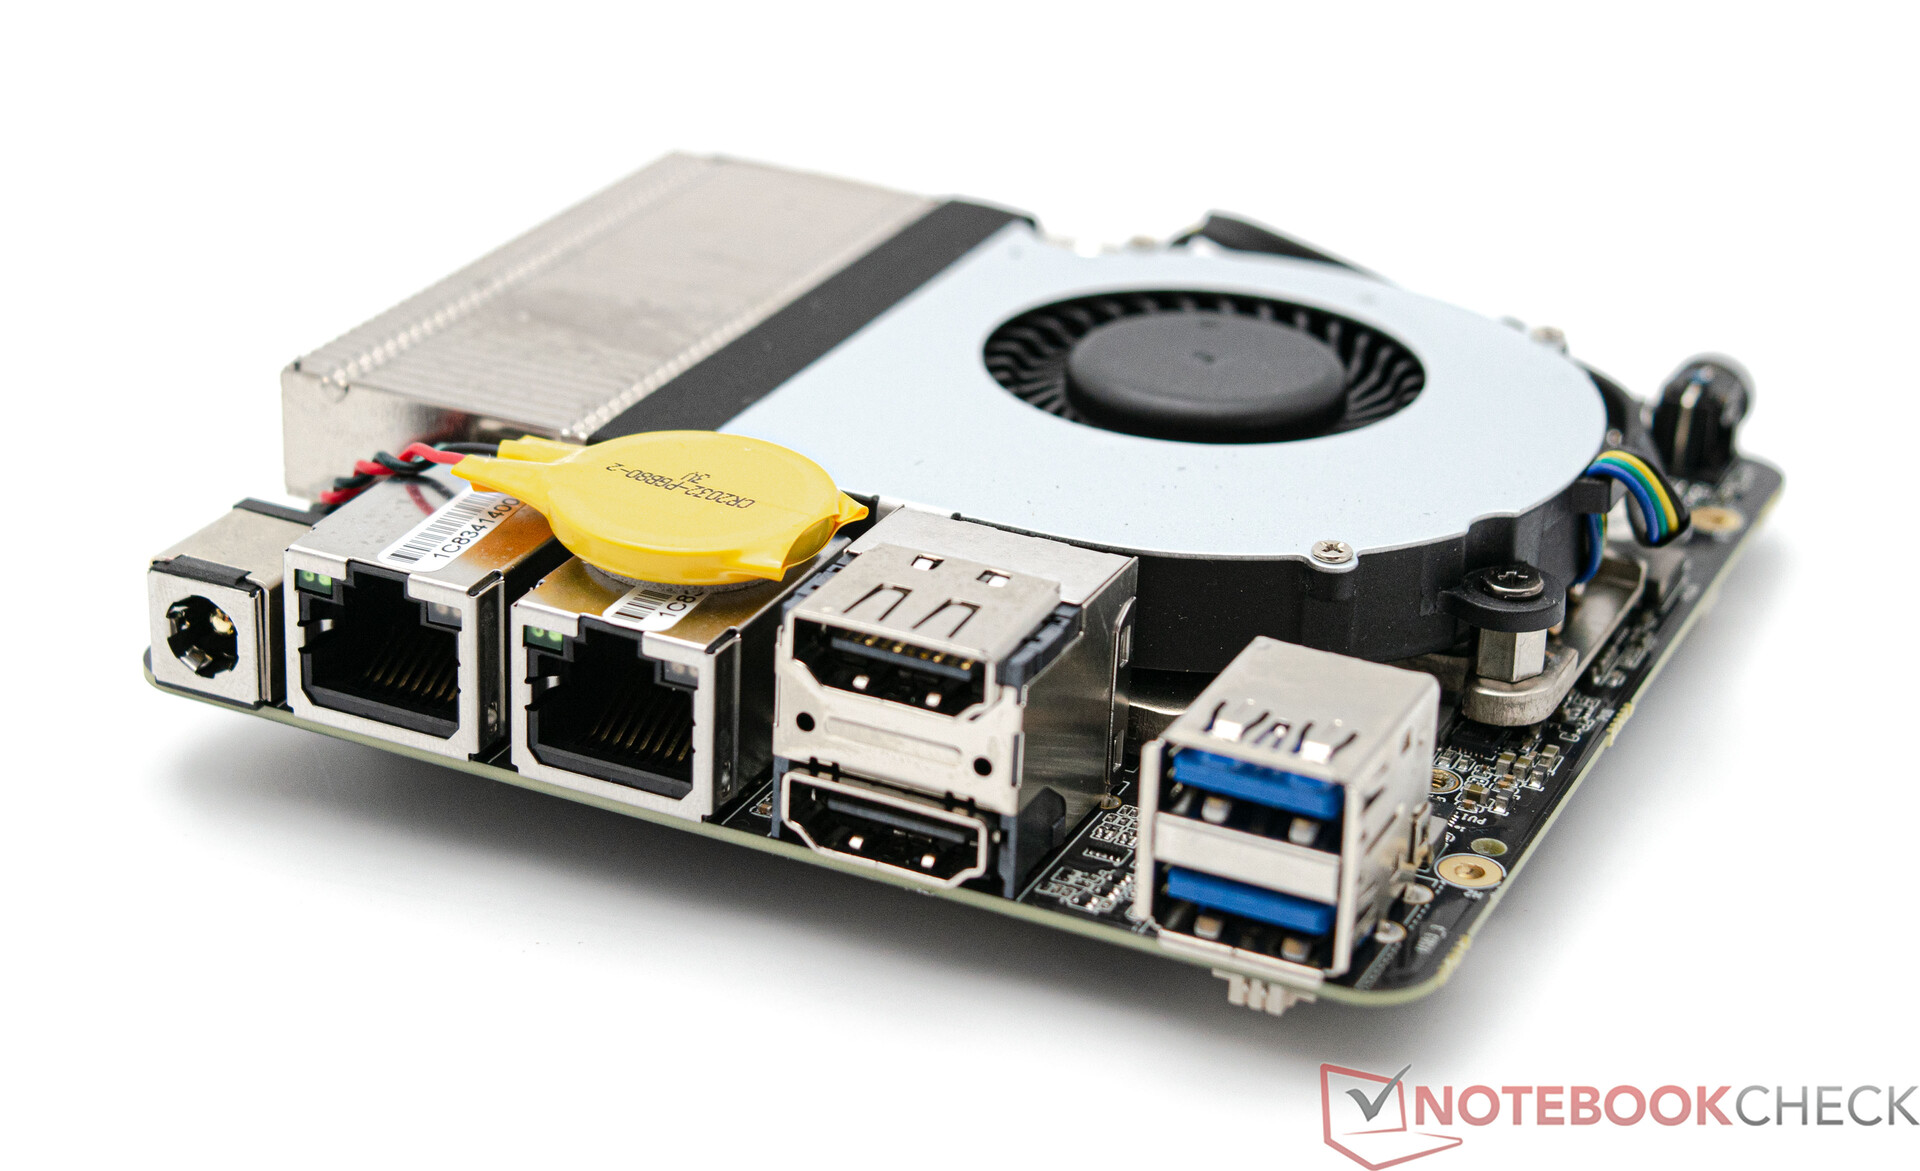
Recursos - uma boa seleção, incluindo Thunderbolt
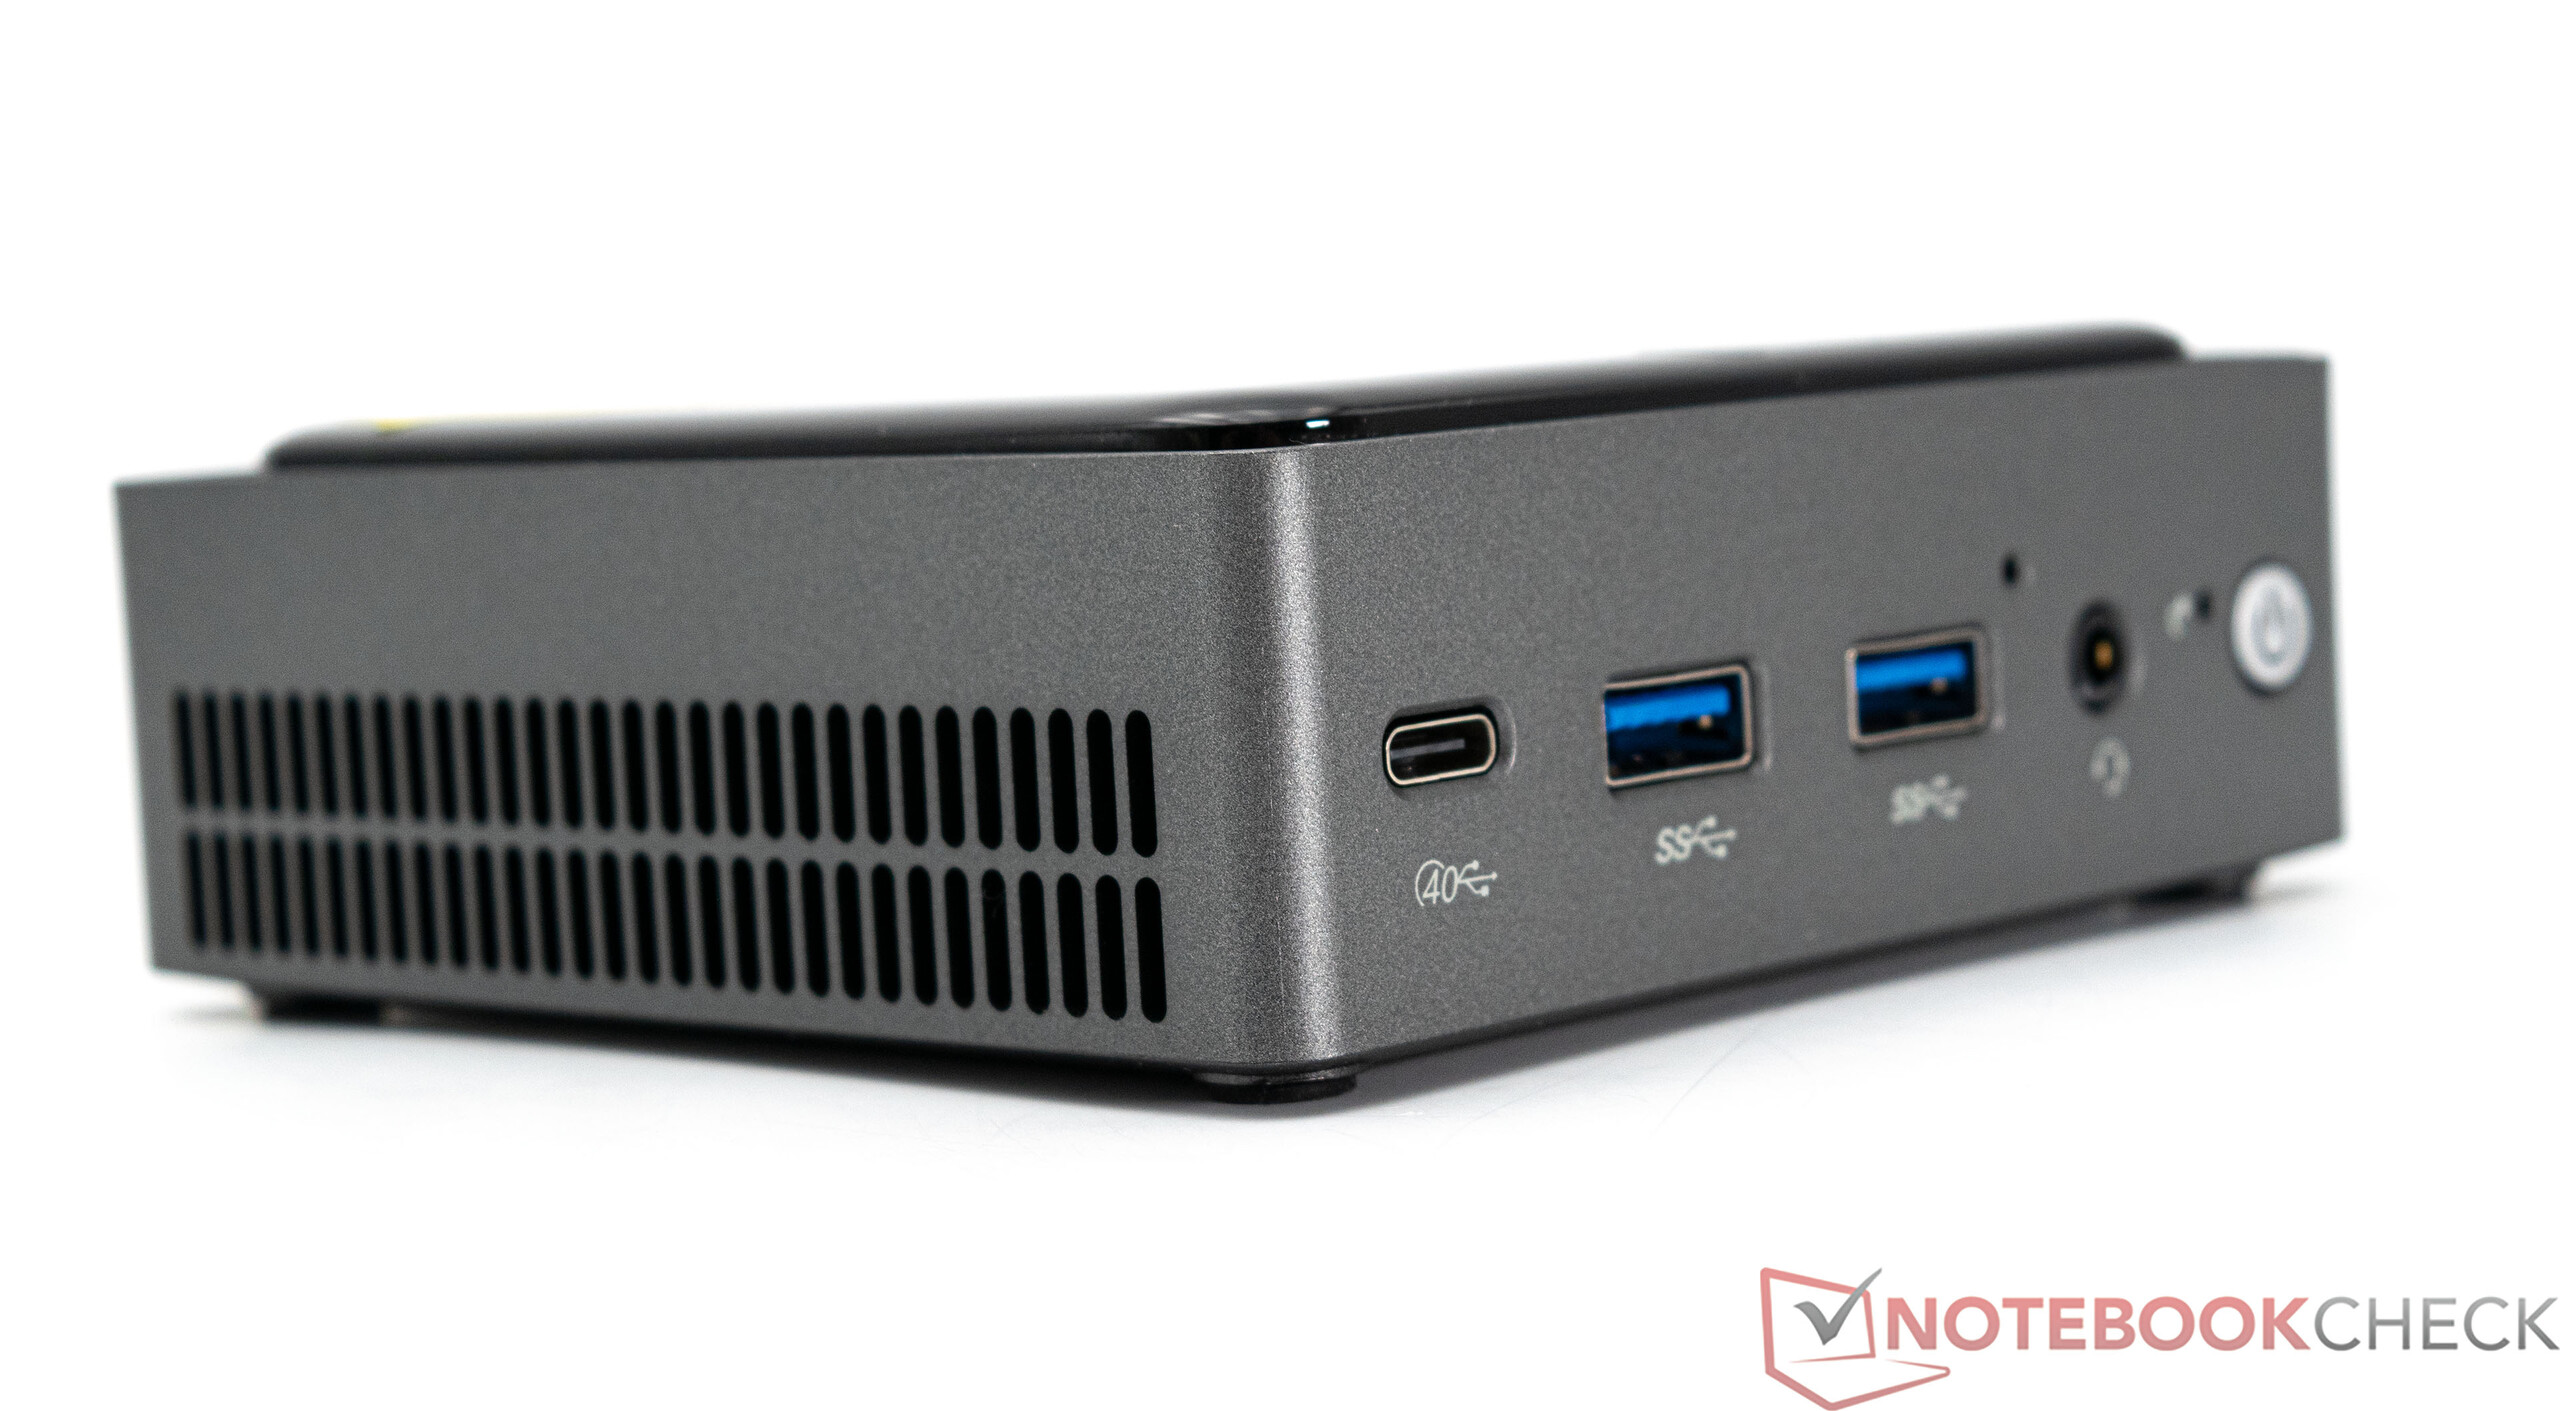
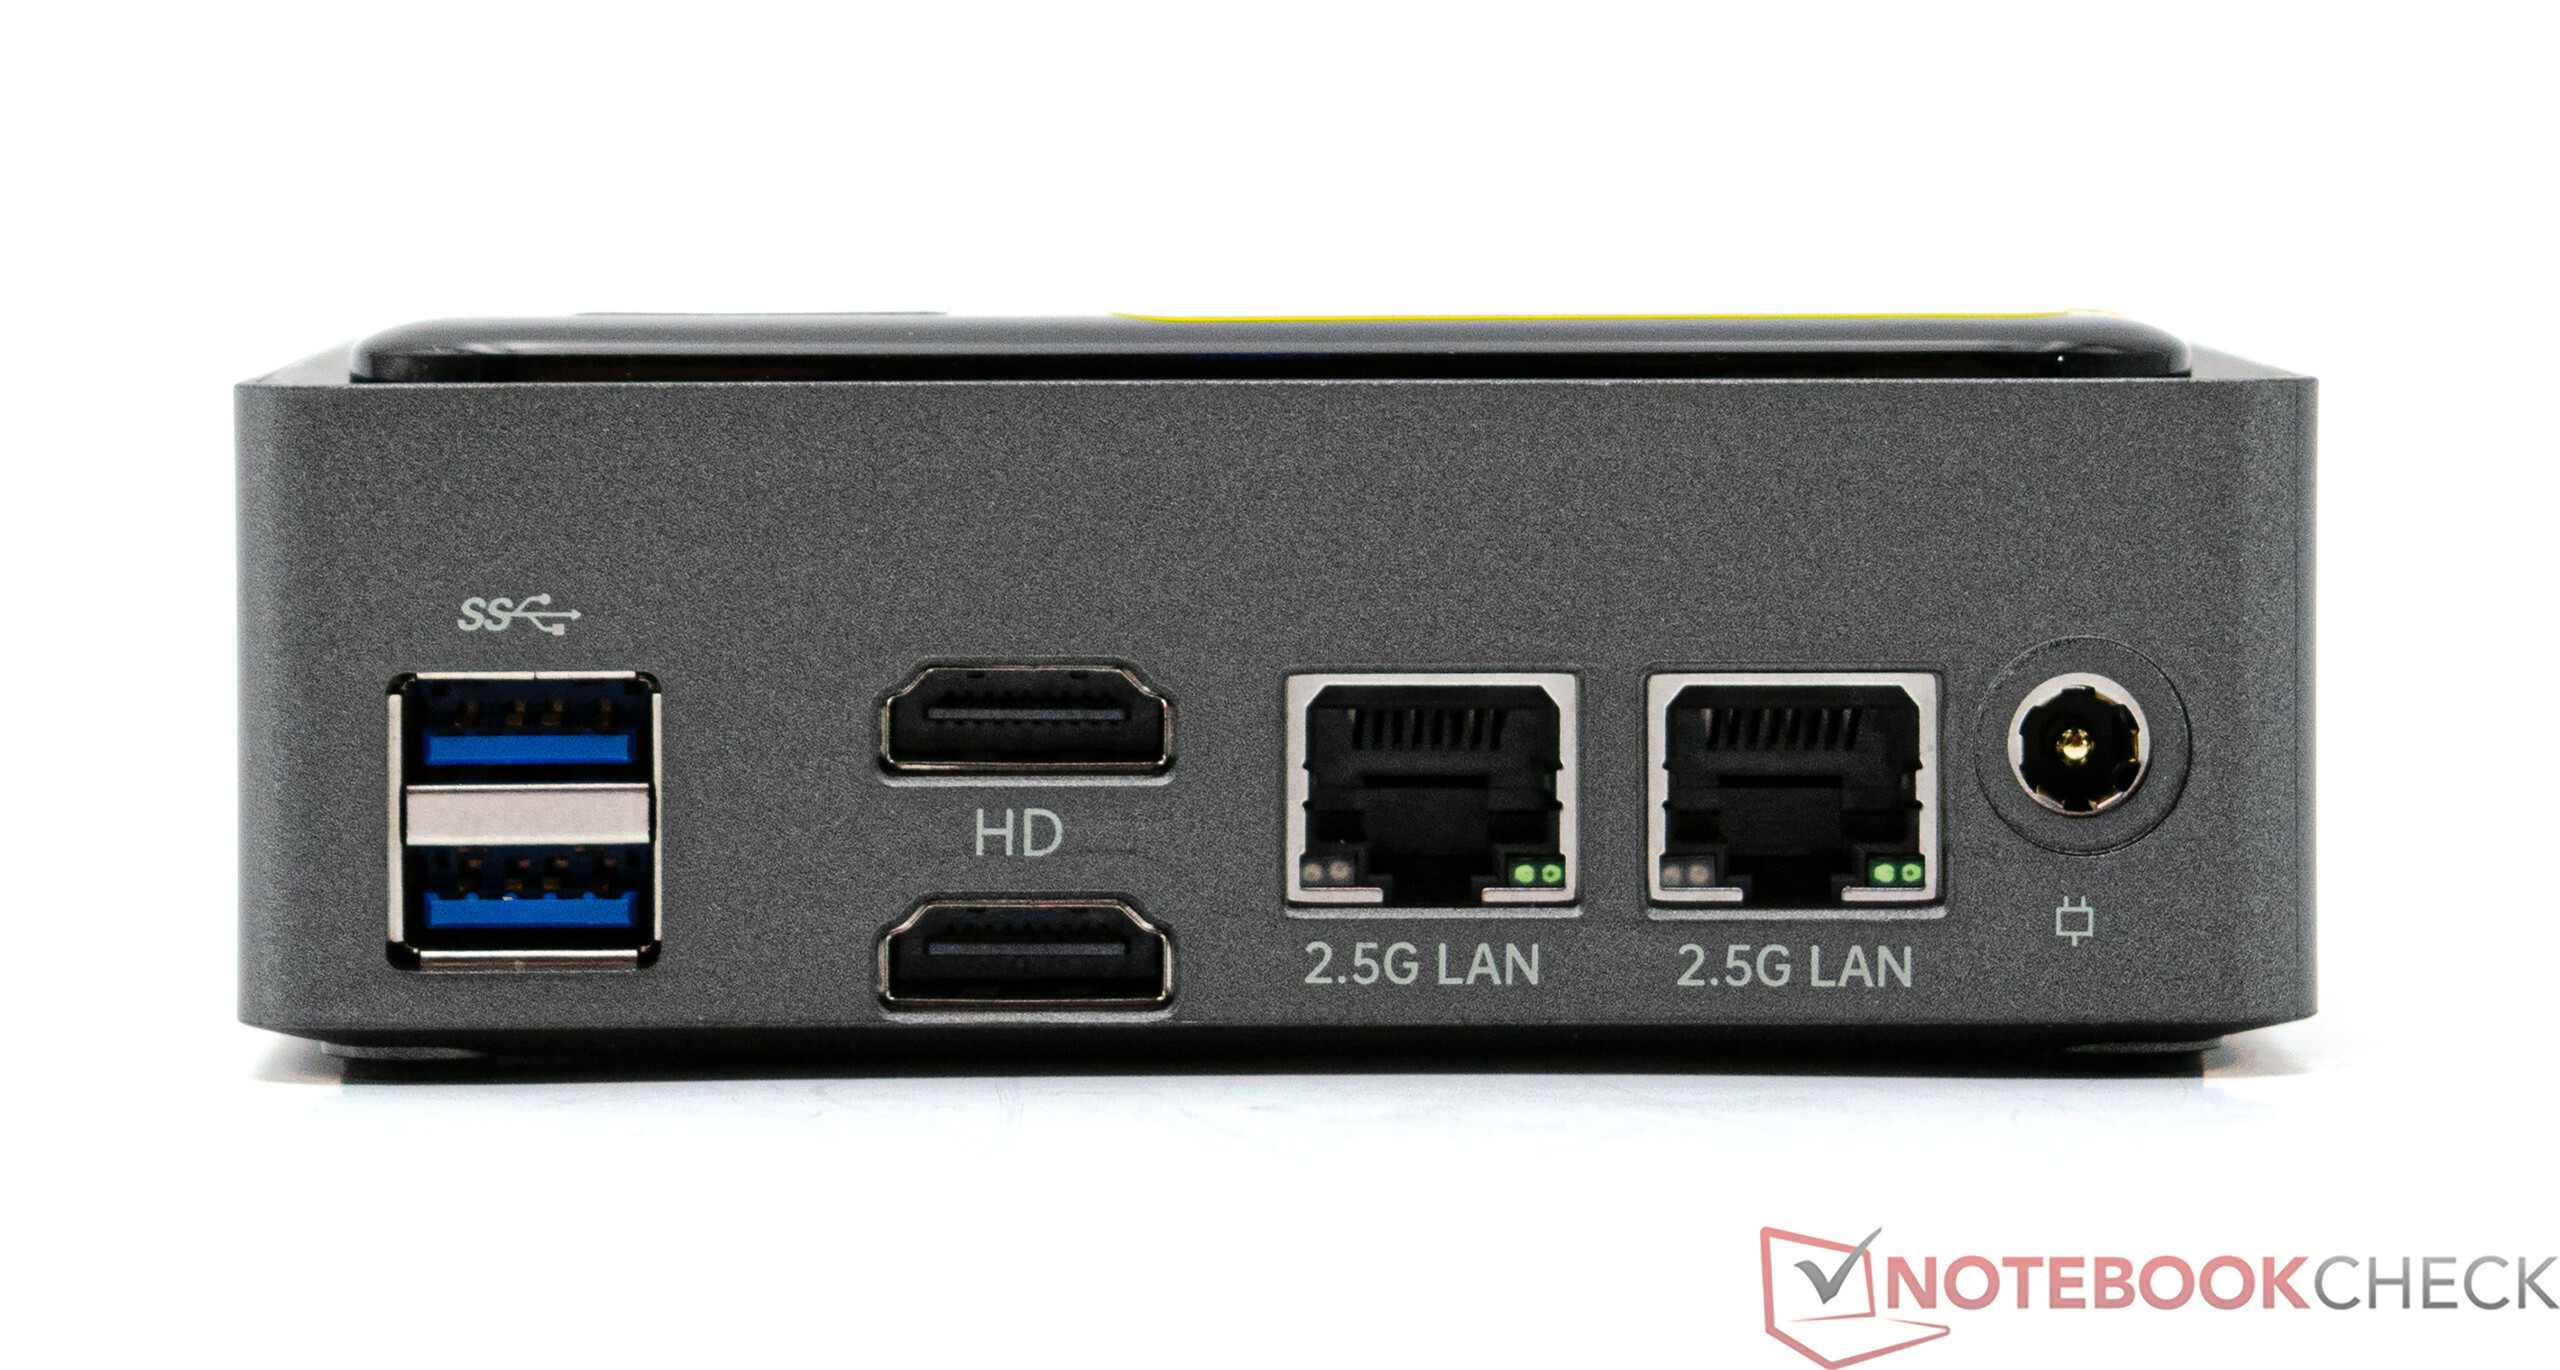
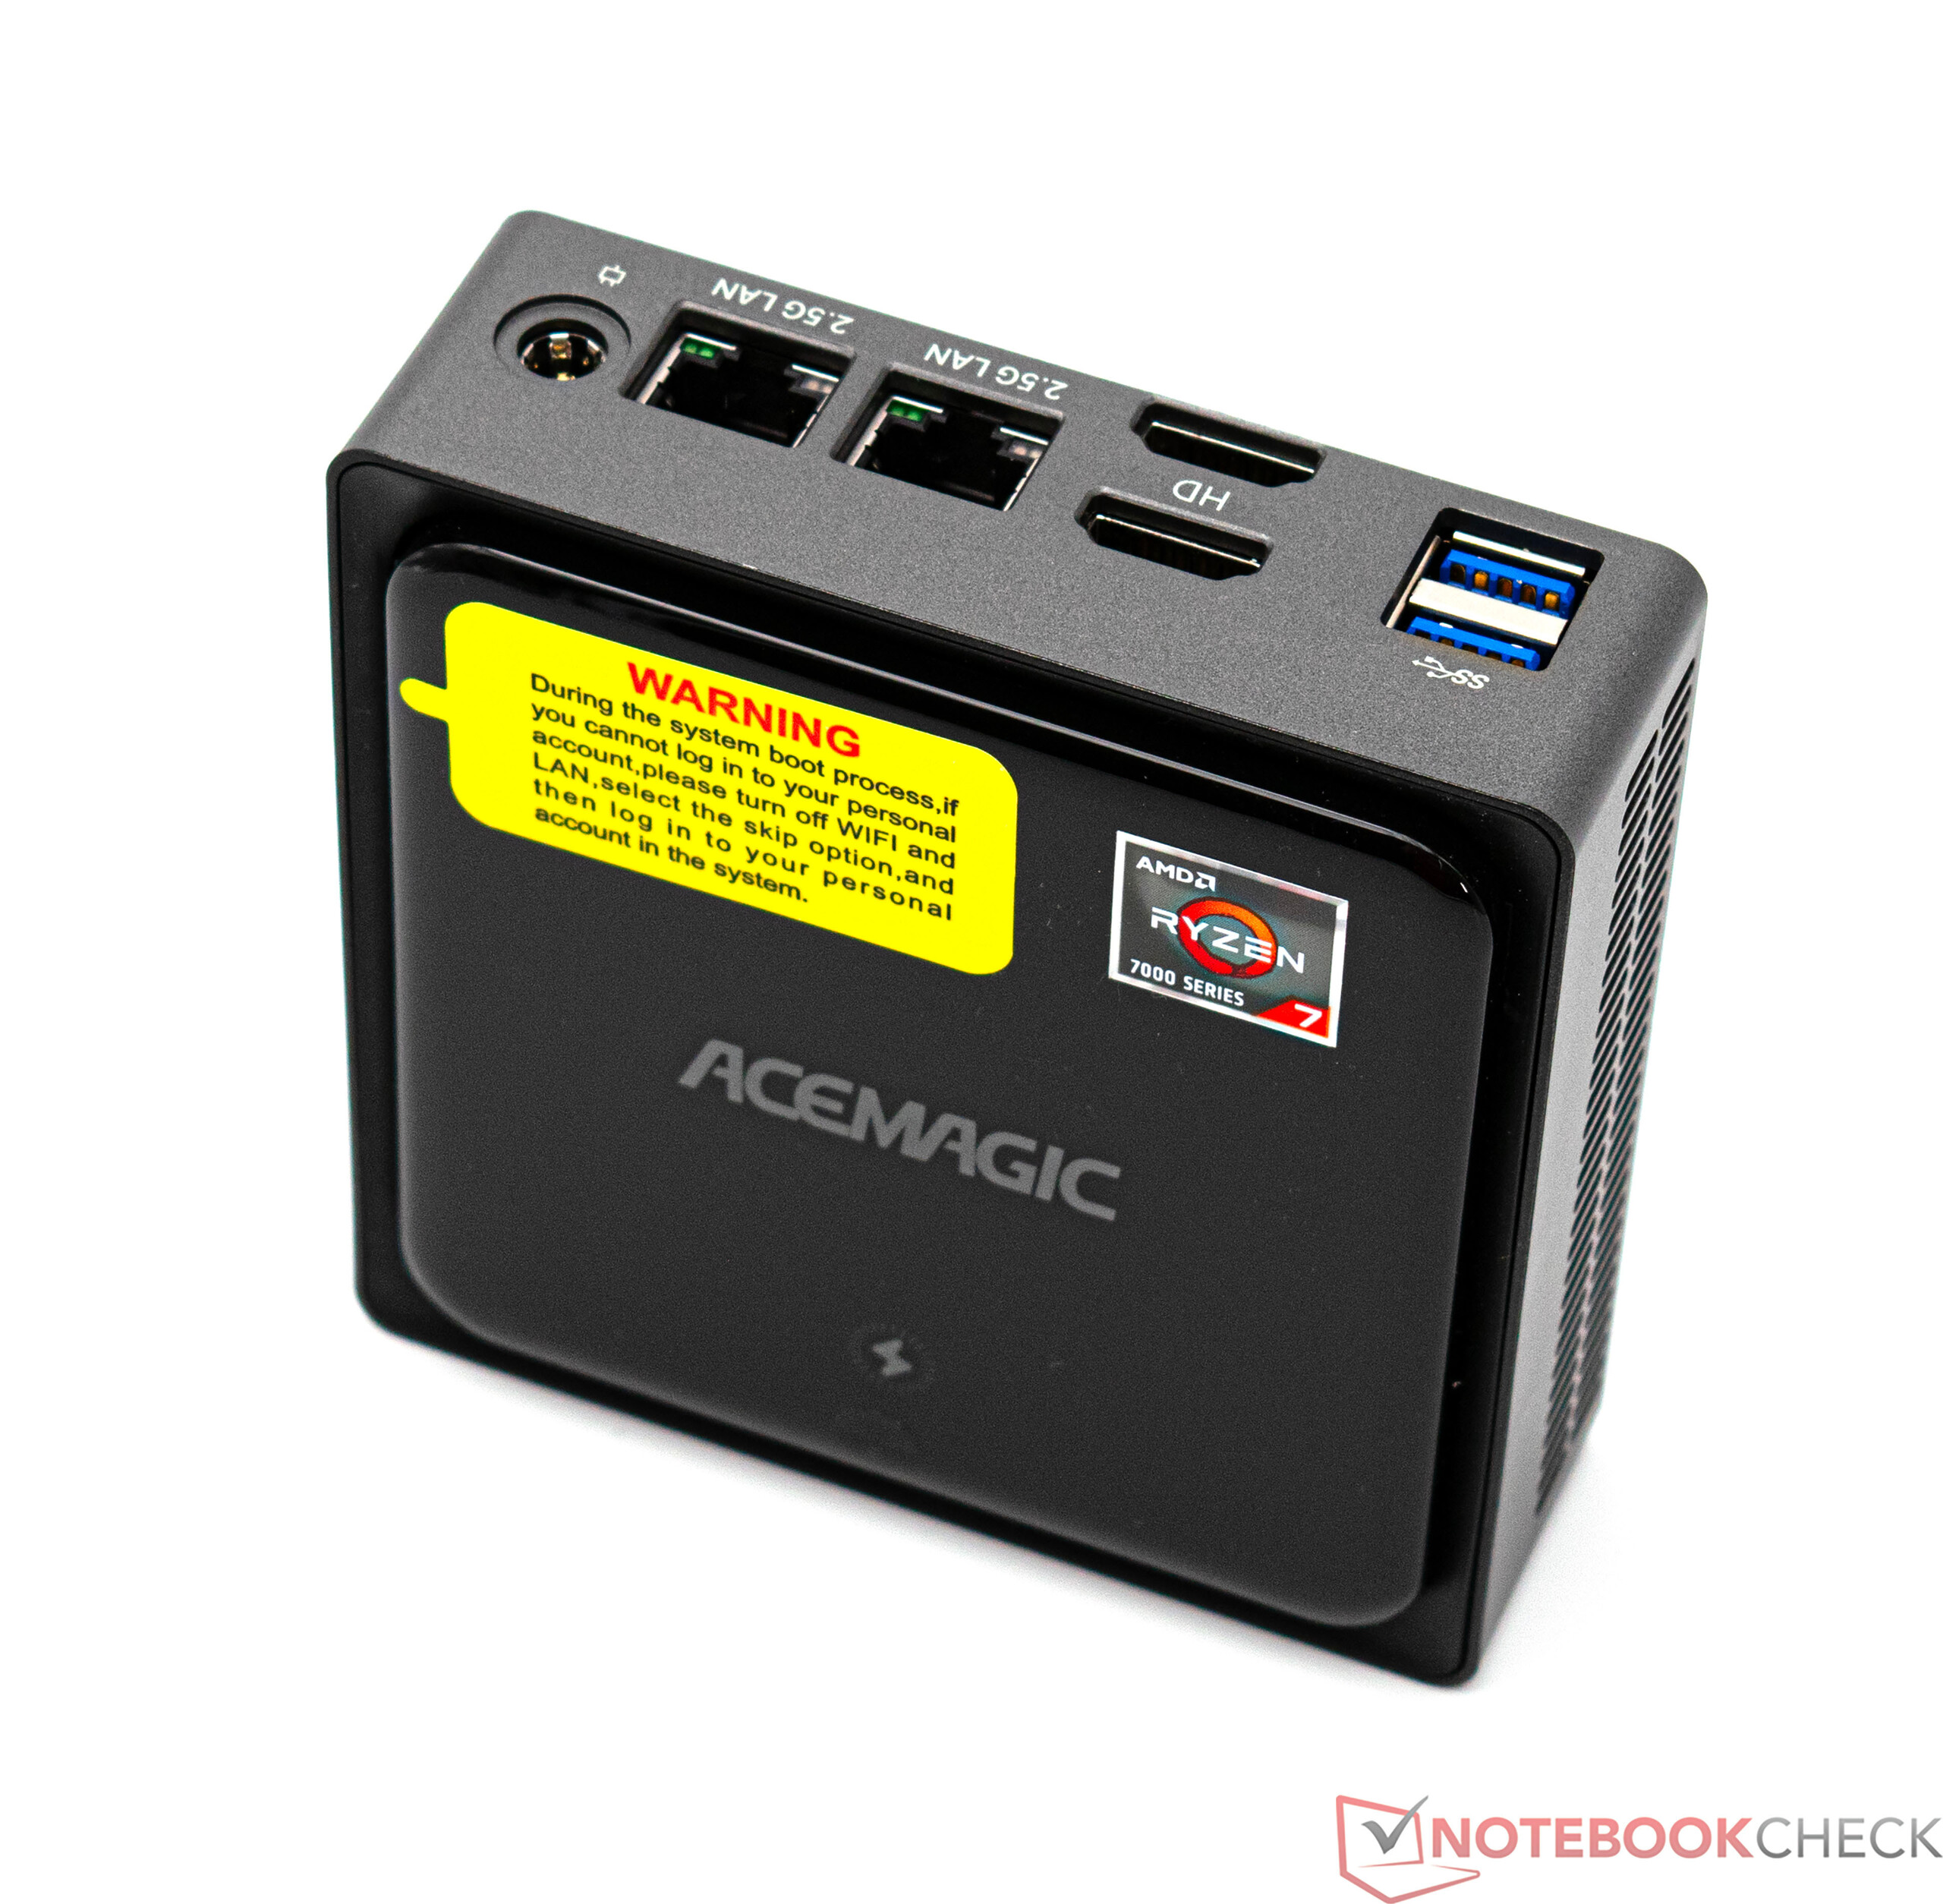
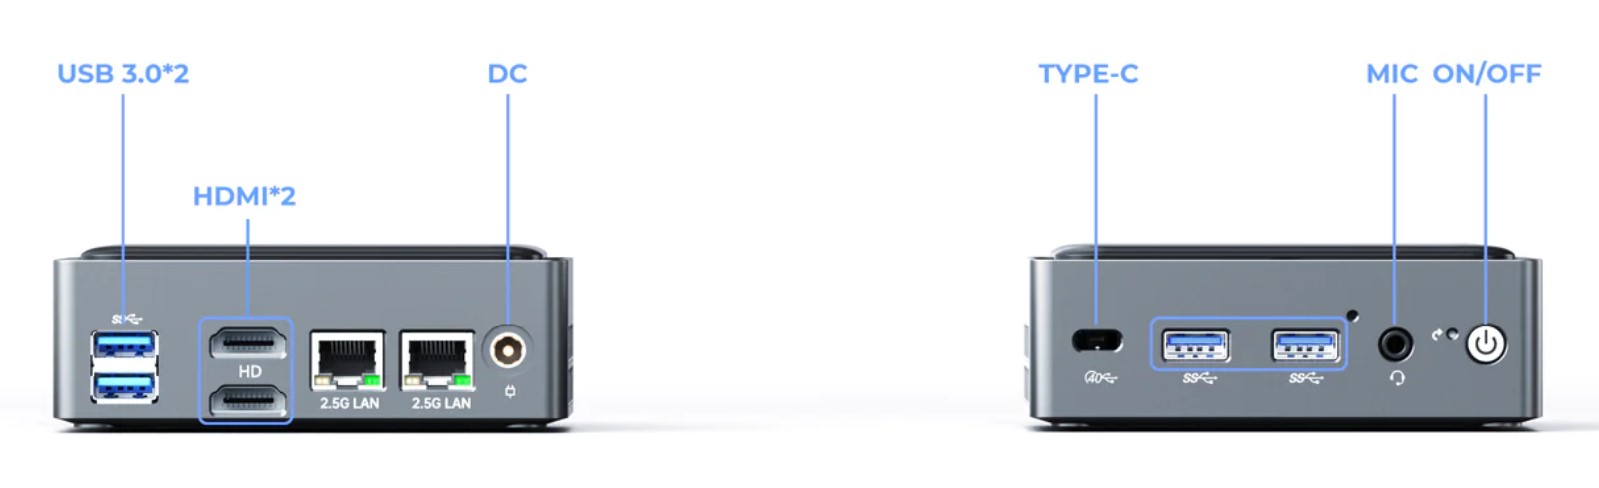
O Acemagic AM20 oferece uma boa seleção de portas que se encontram na parte frontal e traseira. No total, há cinco portas USB, uma das quais também suporta a funcionalidade Thunderbolt. Os monitores podem ser controlados via HDMI ou USB-C, o que significa que três telas não são problema para o Acemagic AM20
Comunicação
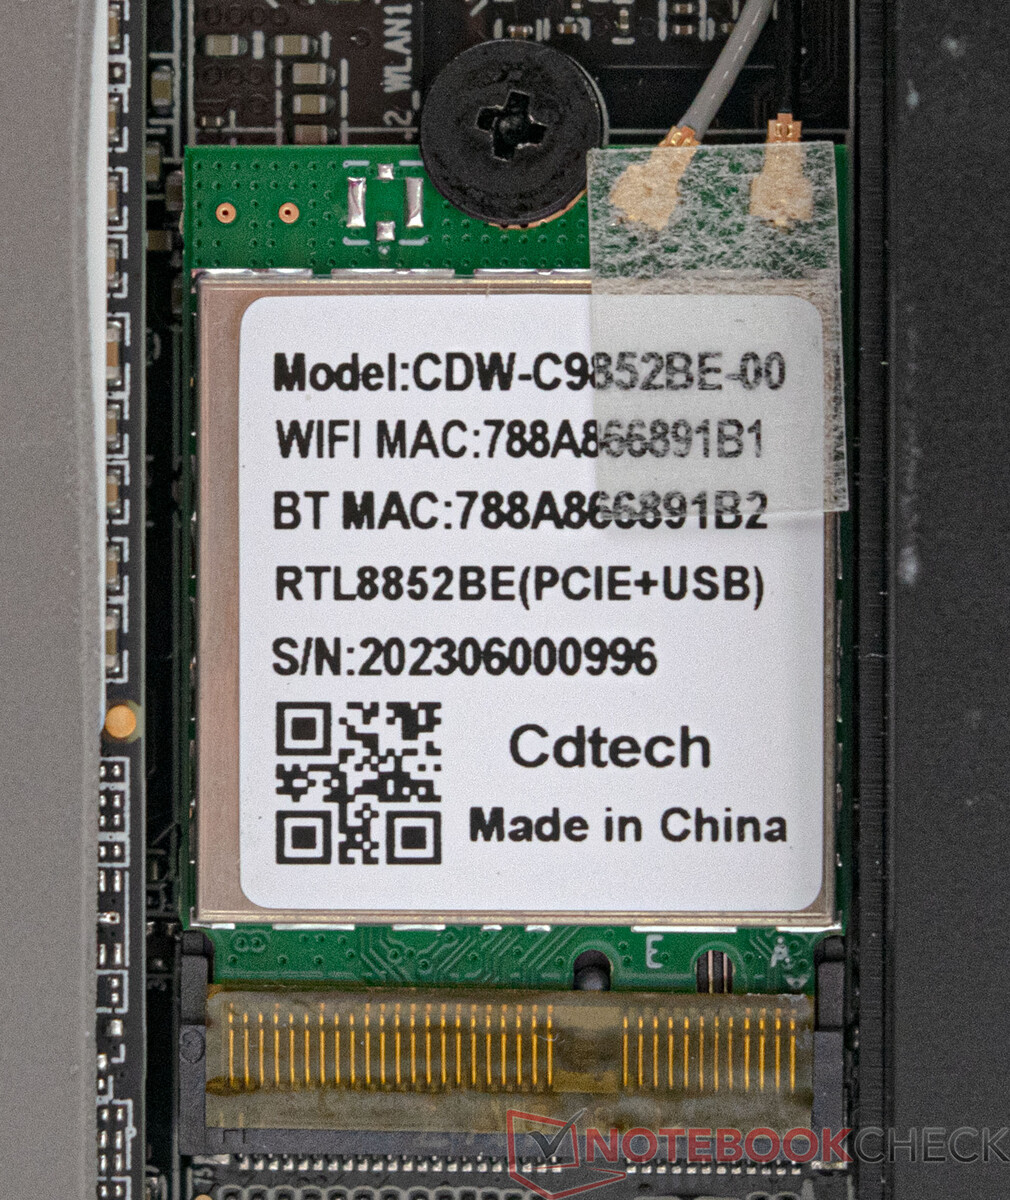
O módulo Wi-Fi instalado é da Realtek e funciona idealmente na banda de frequência de 5 GHz. No entanto, há compatibilidade retroativa com a faixa de 2,4 GHz. Quando se trata do módulo Wi-Fi instalado, nossa análise revelou resultados correspondentes: Em termos de recepção de dados, o Acemagic AM20 ainda pode ser encontrado no meio do pacote, mas, quando se trata de envio, nosso dispositivo de análise caiu para o último lugar. No entanto, esses resultados não são motivo de preocupação, pois o desempenho apresentado aqui é suficiente para o uso diário. Para esta análise, usamos nosso roteador de teste, o Asus ROG Rapture GT-AXE11000. Vale a pena destacar os dois soquetes de LAN, pois eles podem ser usados como uma alternativa à conexão sem fio. Ambos oferecem até 2,5 GBit/s, o que não é o padrão para mini PCs.
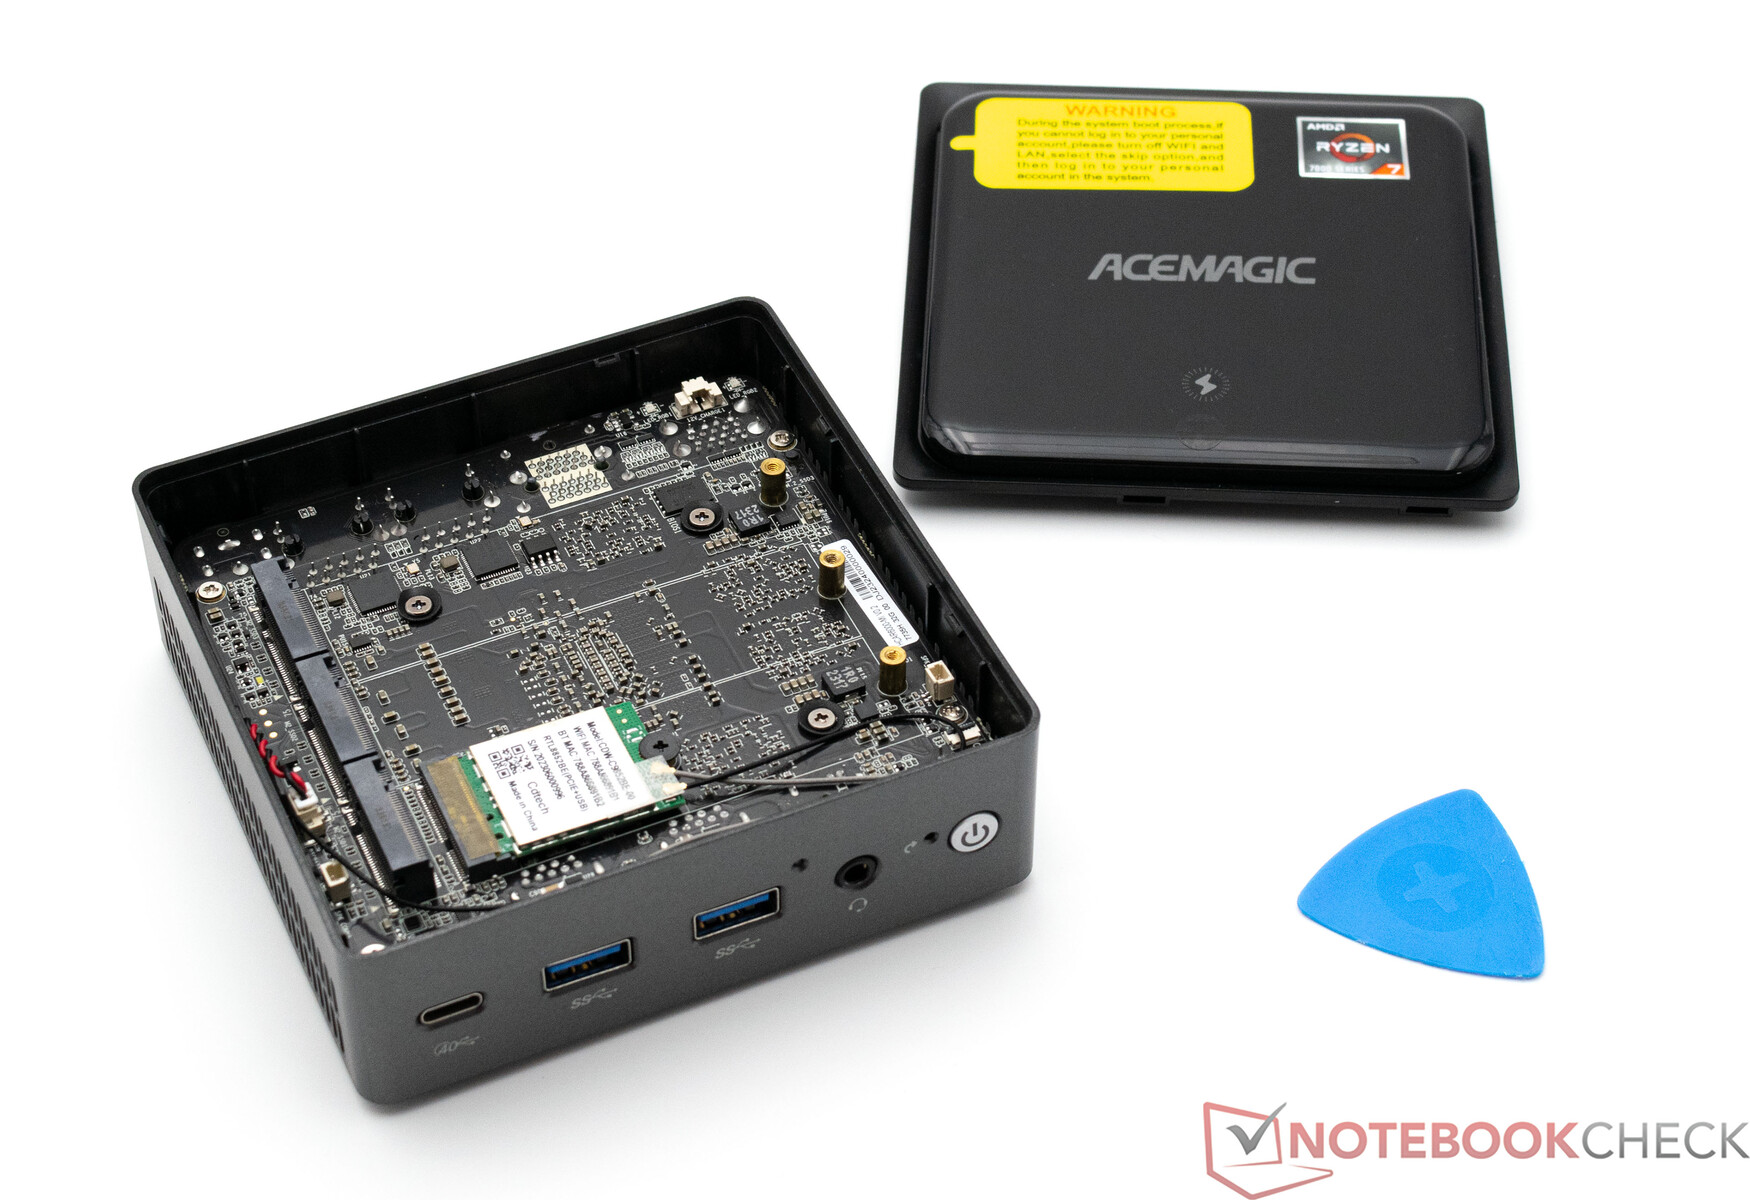
Manutenção
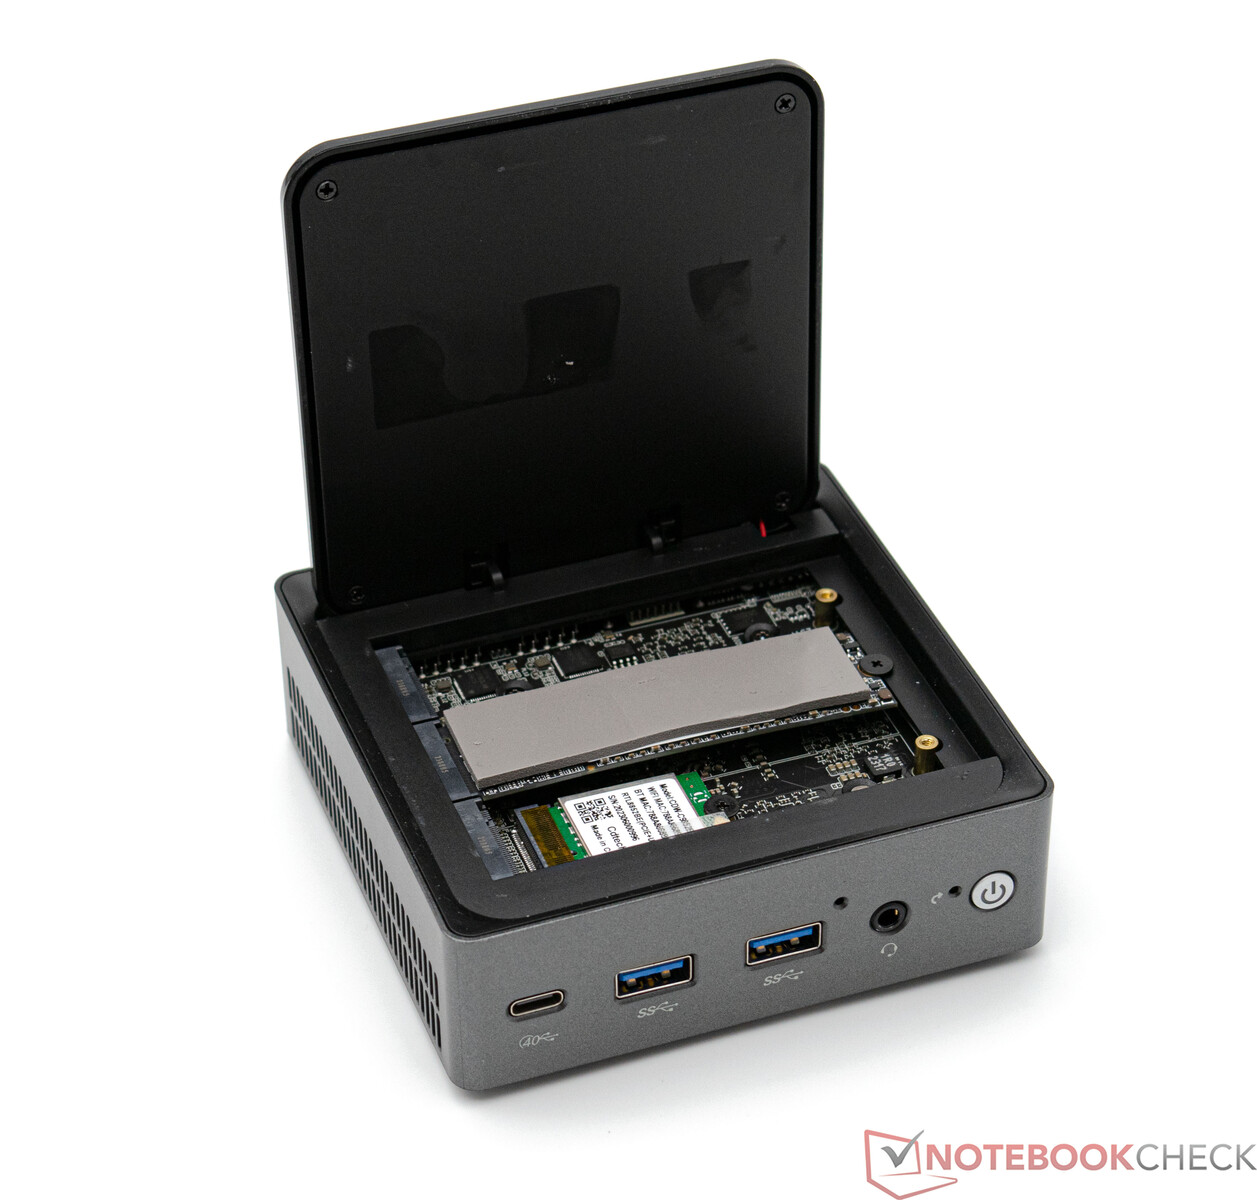
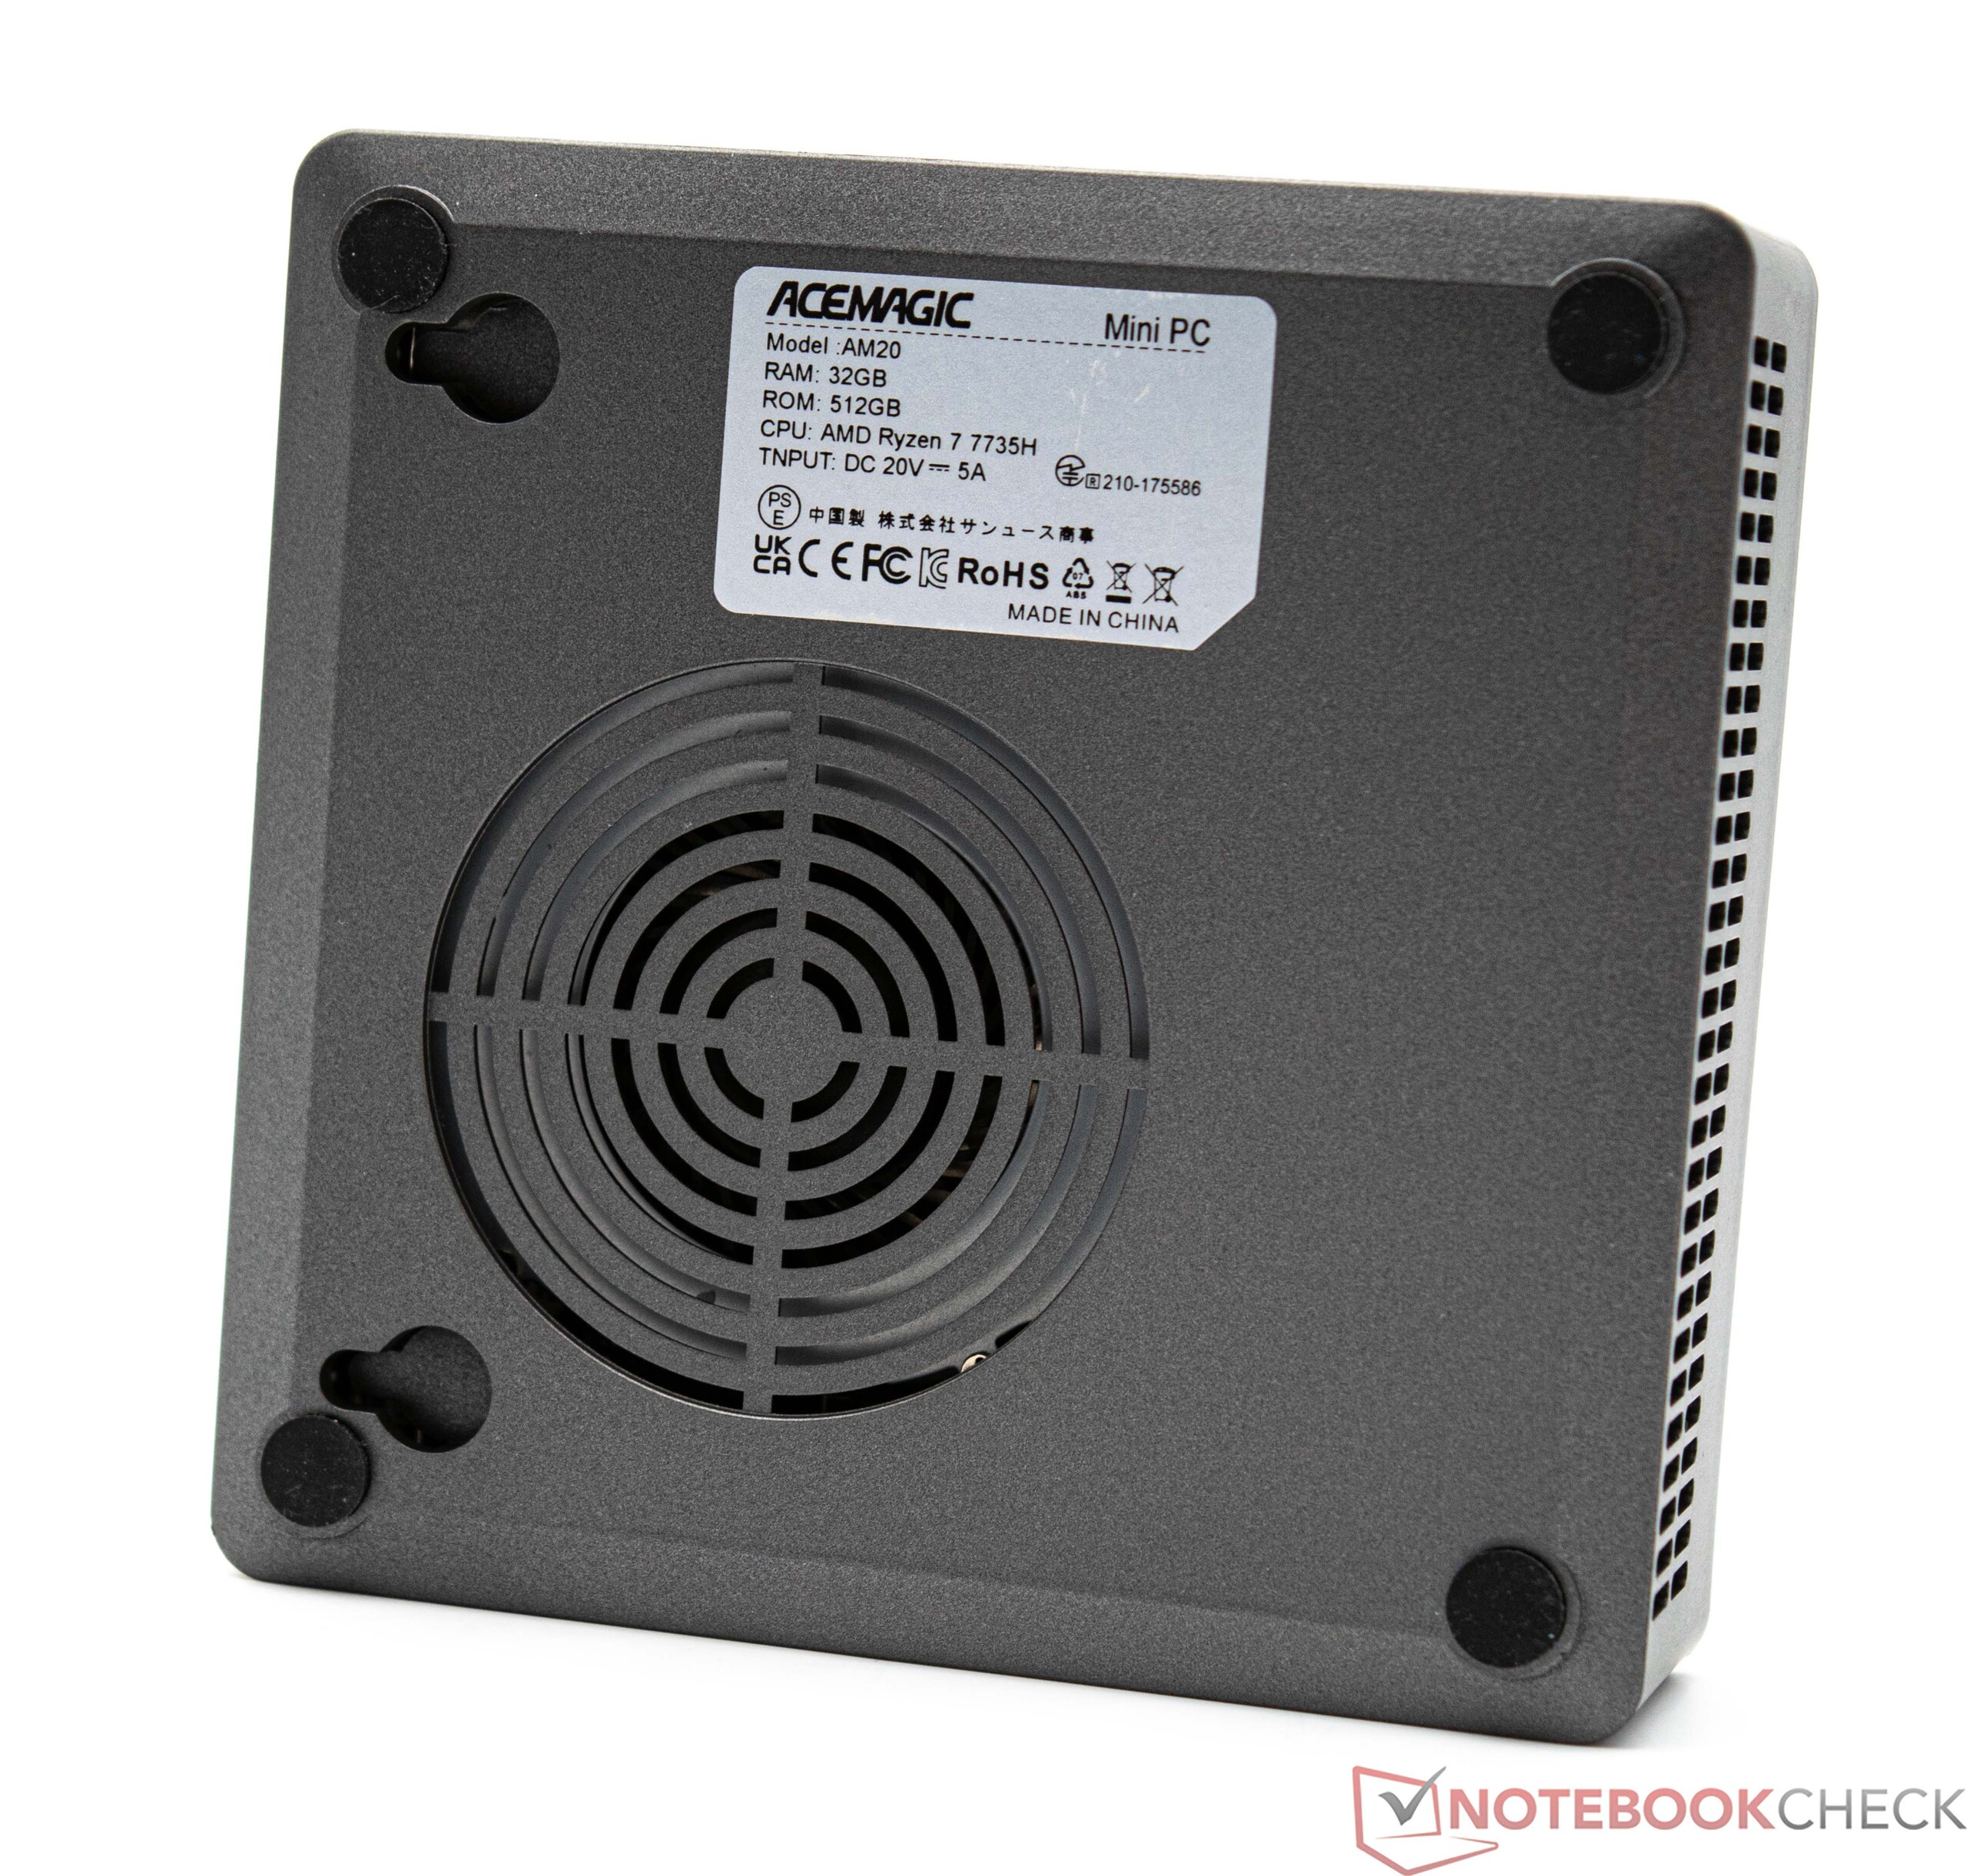
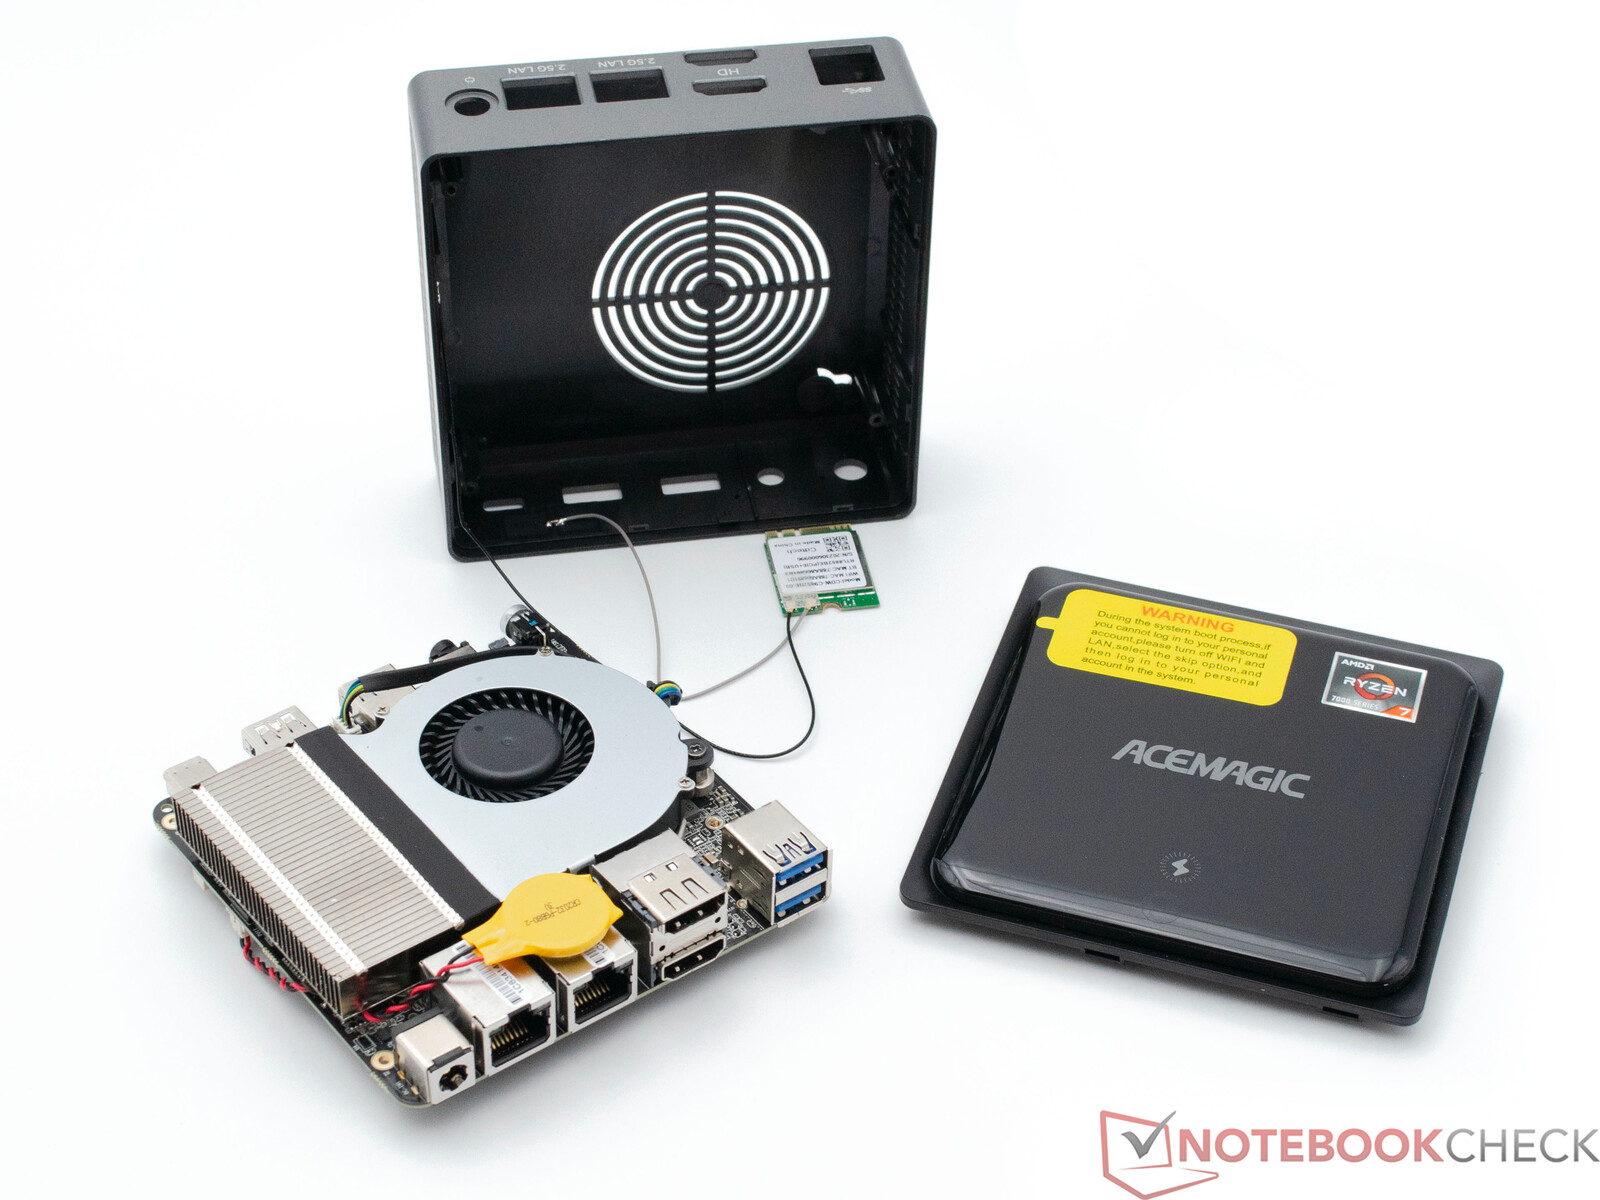
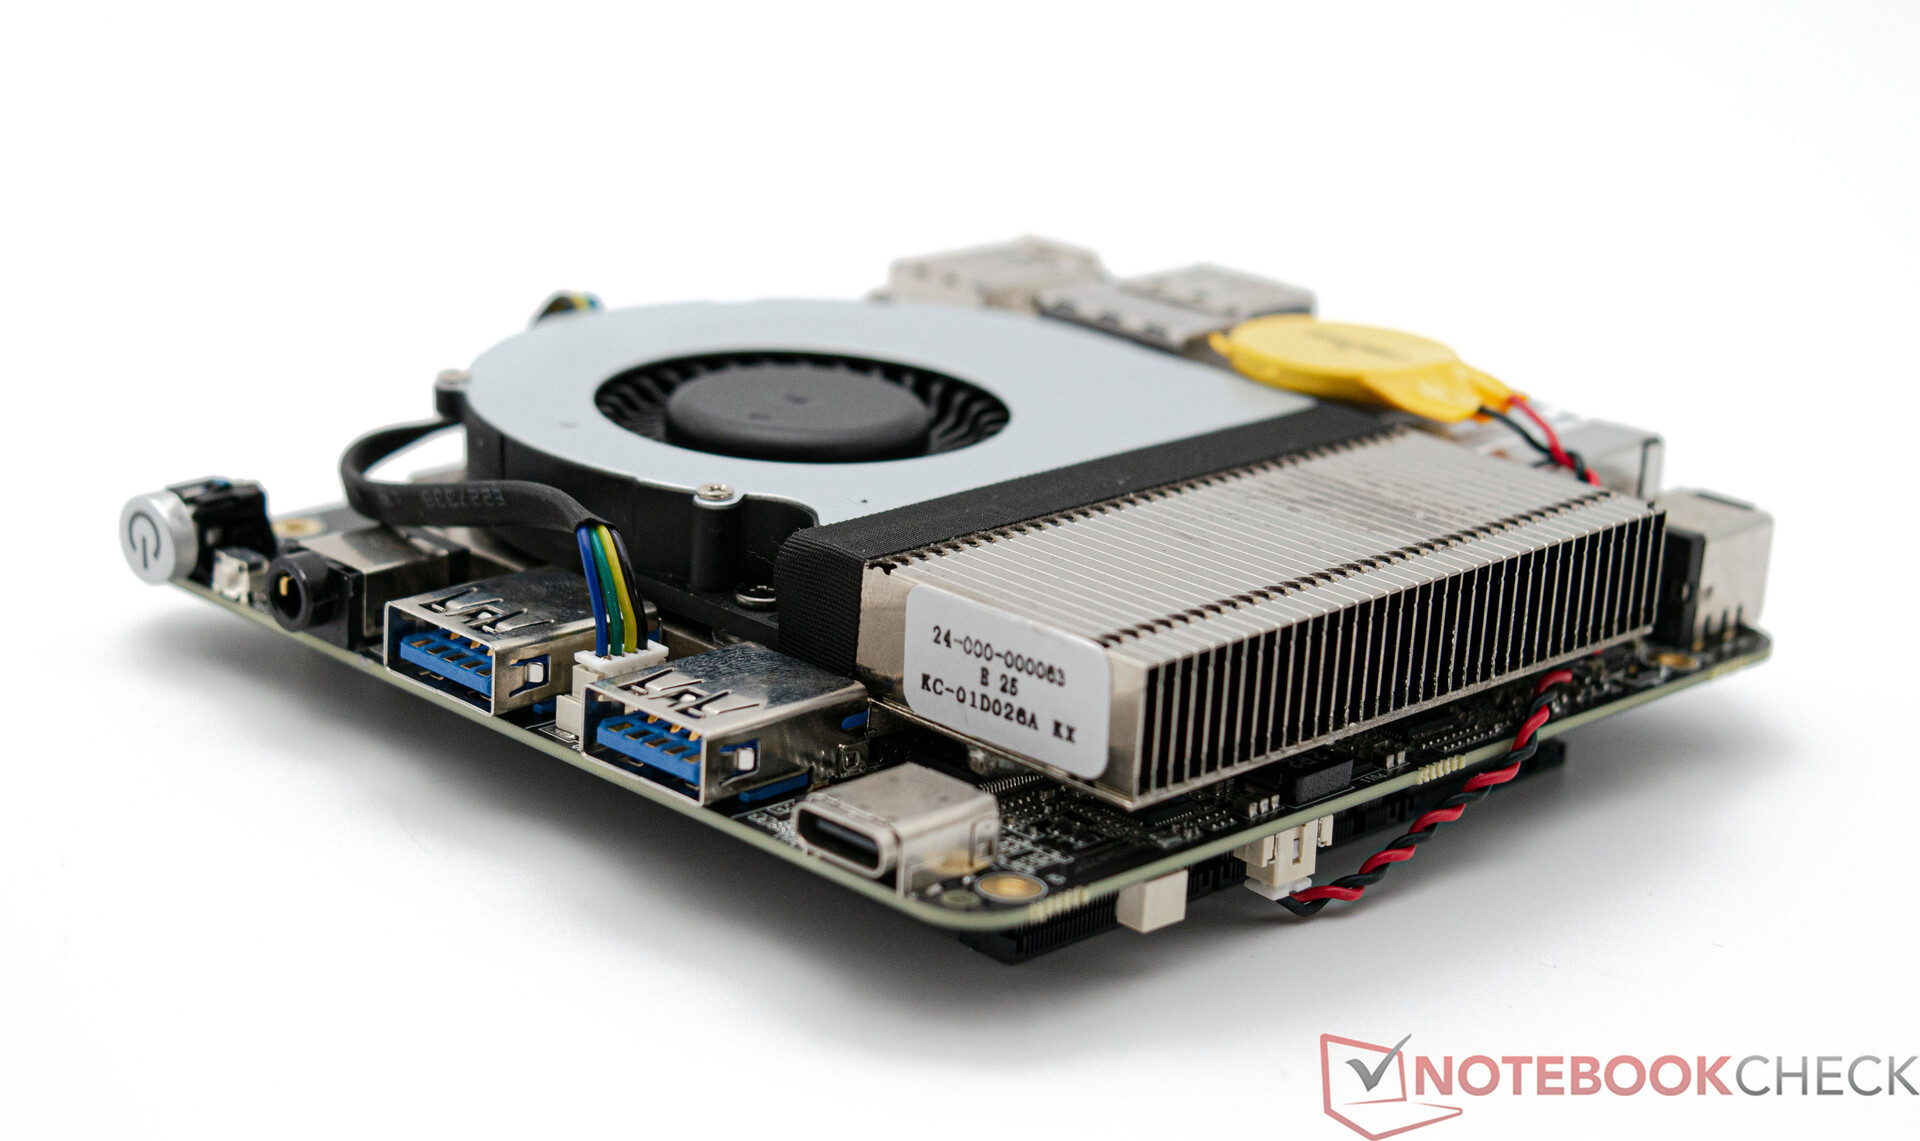
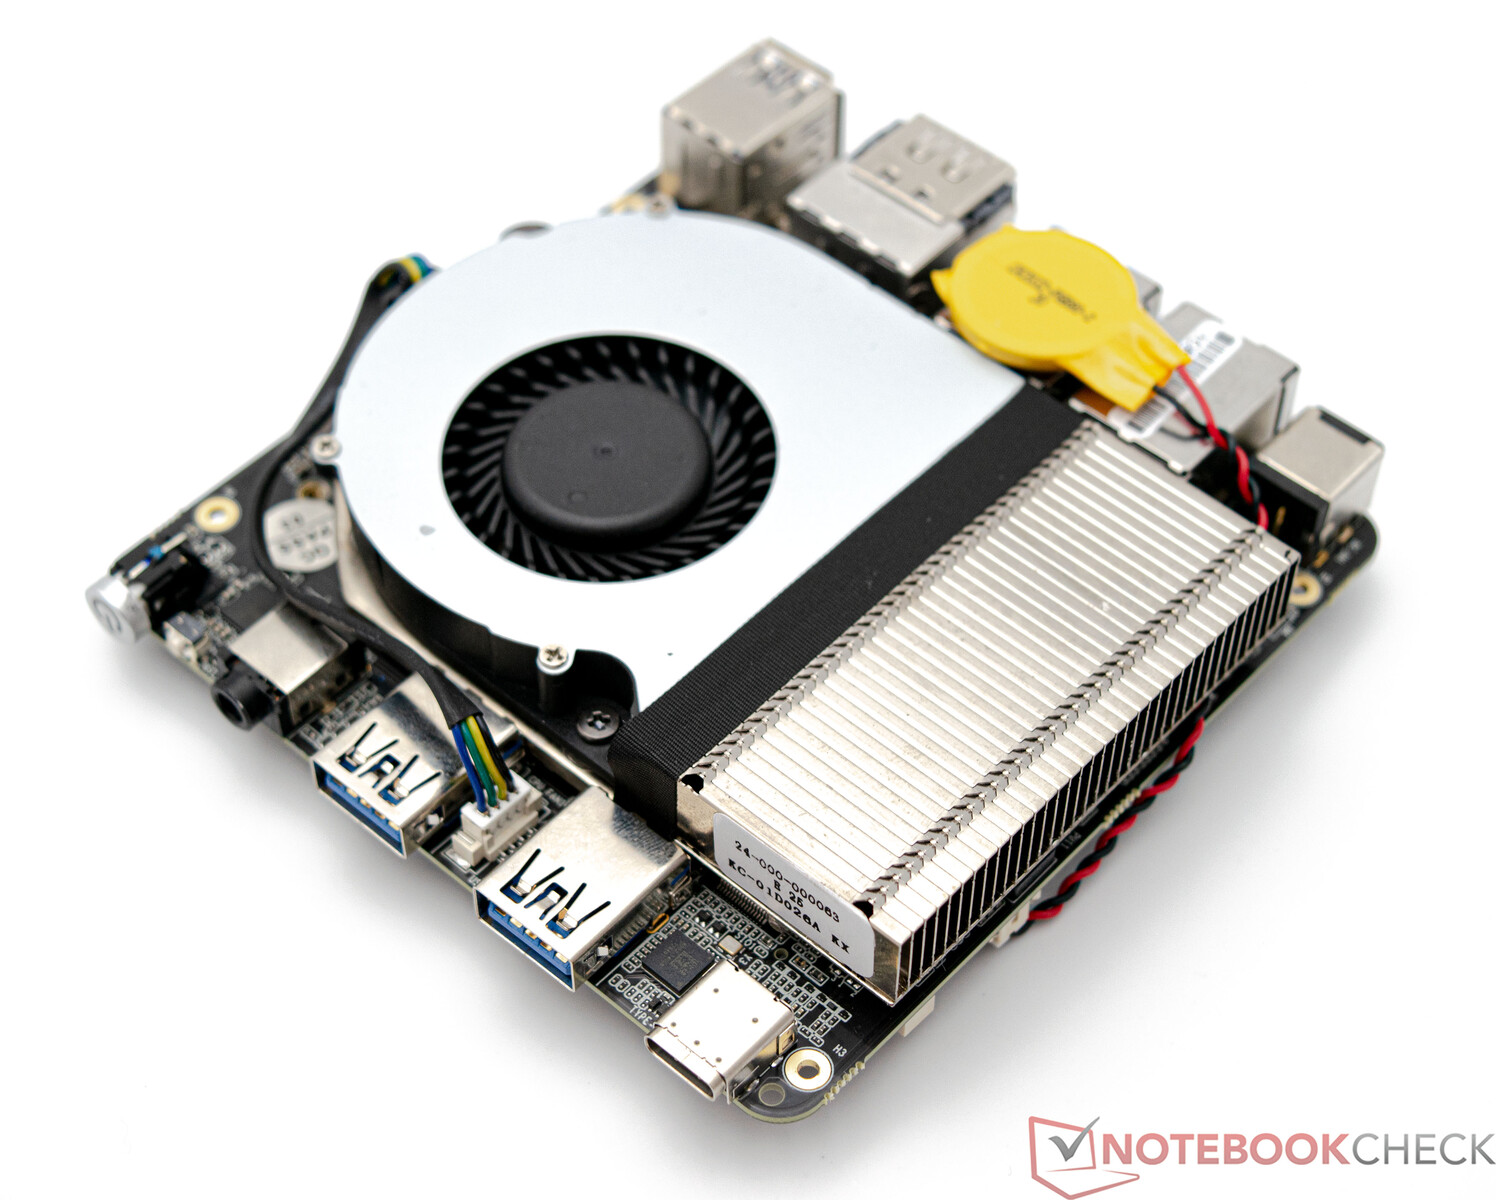
A parte superior do Acemagic AM20 pode ser facilmente aberta porque o fabricante equipou o dispositivo com uma aba fixada magneticamente. Na parte inferior, estão ocultos o armazenamento em massa e o módulo Wi-Fi, que podem ser facilmente substituídos. Você percebe imediatamente três interfaces M.2 para SSDs. Da mesma forma, isso também não é padrão e, considerando o formato compacto, esse é um aspecto importante ao tomar uma decisão de compra. Qualquer pessoa que deseje limpar a ventoinha terá que desmontar ainda mais o dispositivo, o que pode ser feito essencialmente com um toque delicado e as ferramentas certas.
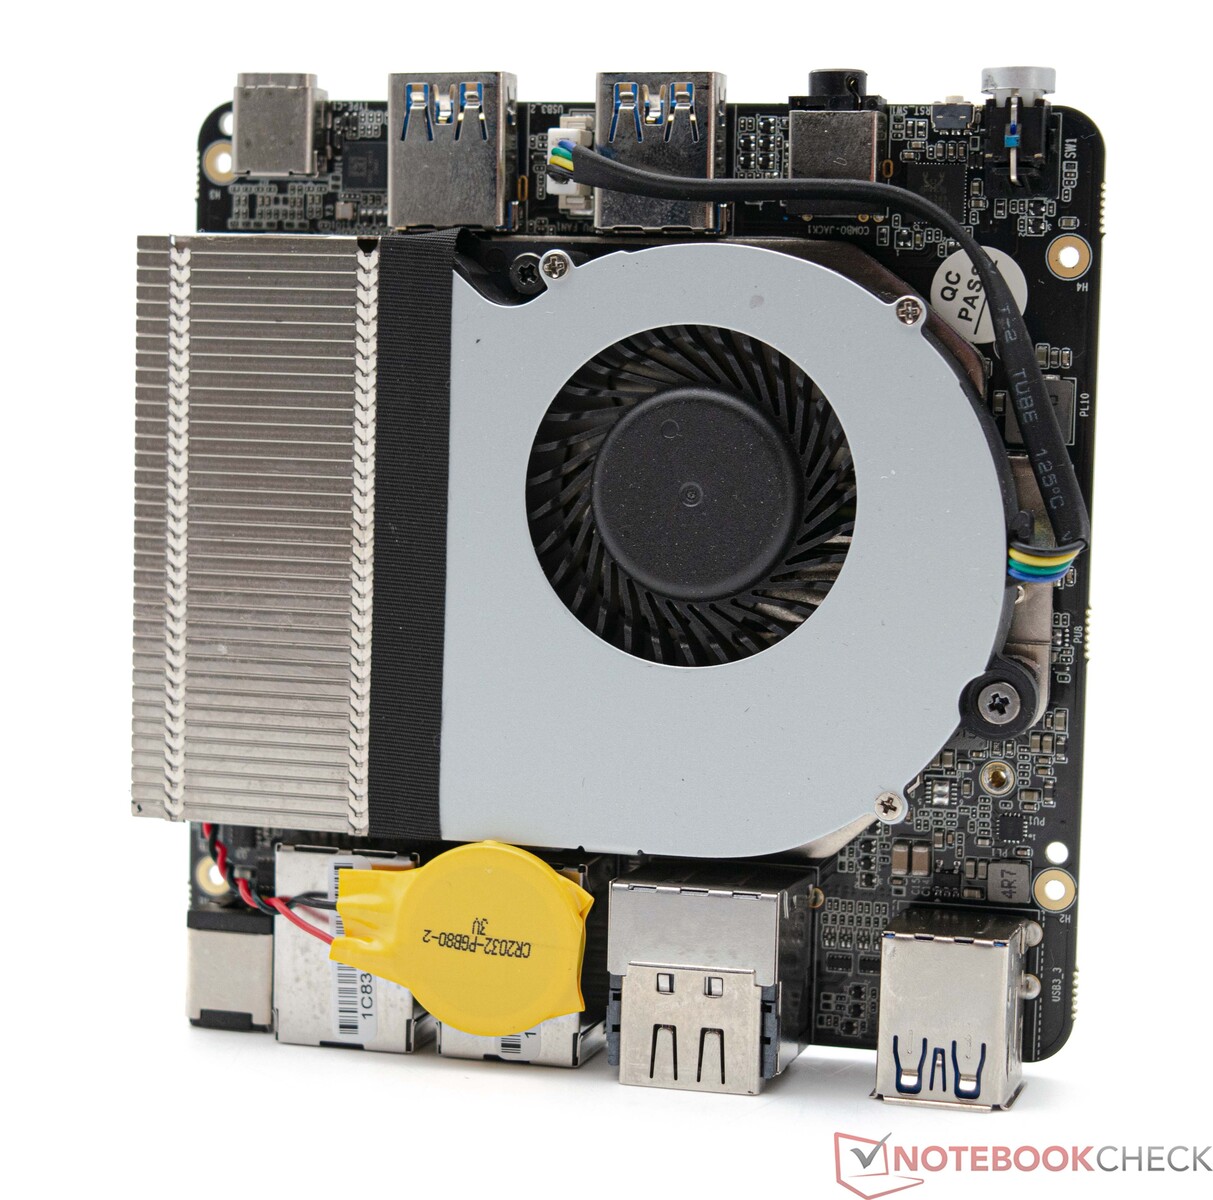
Acemagic AM20 desmontado
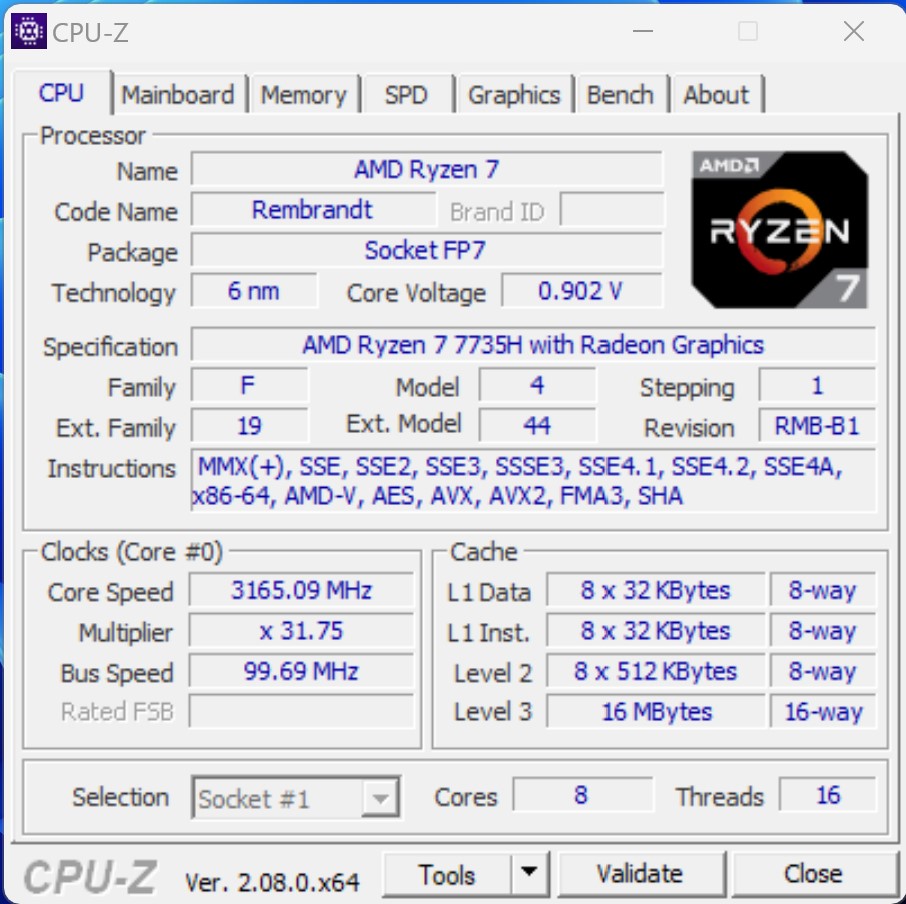
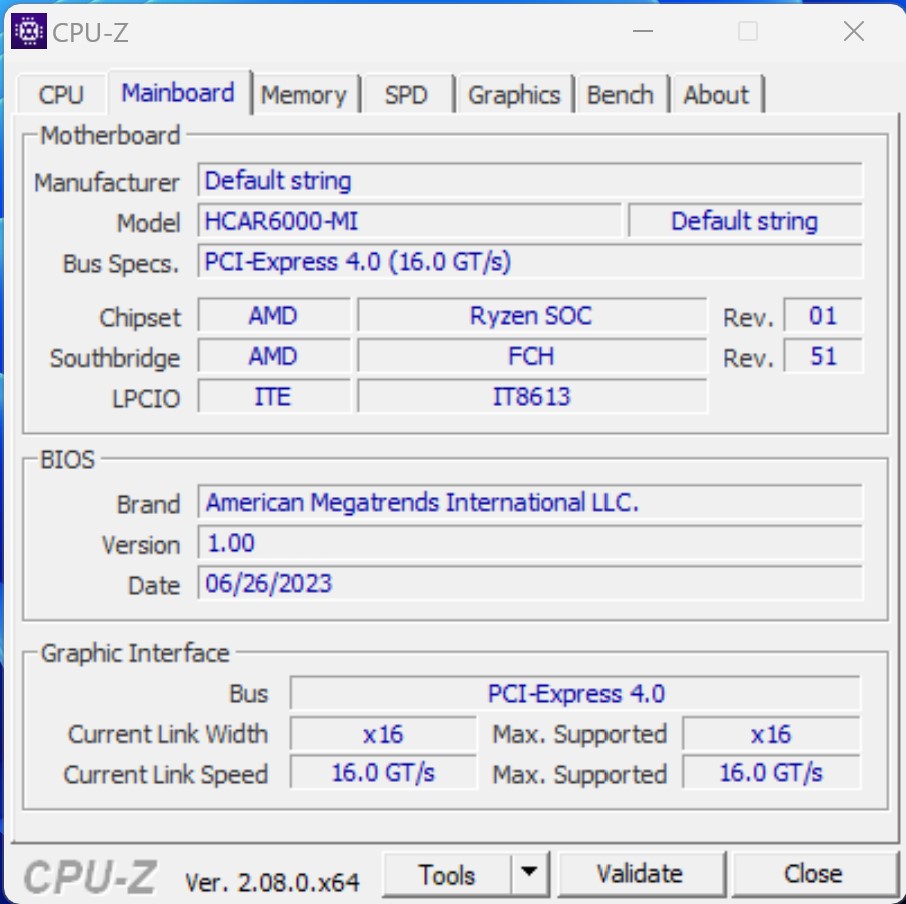
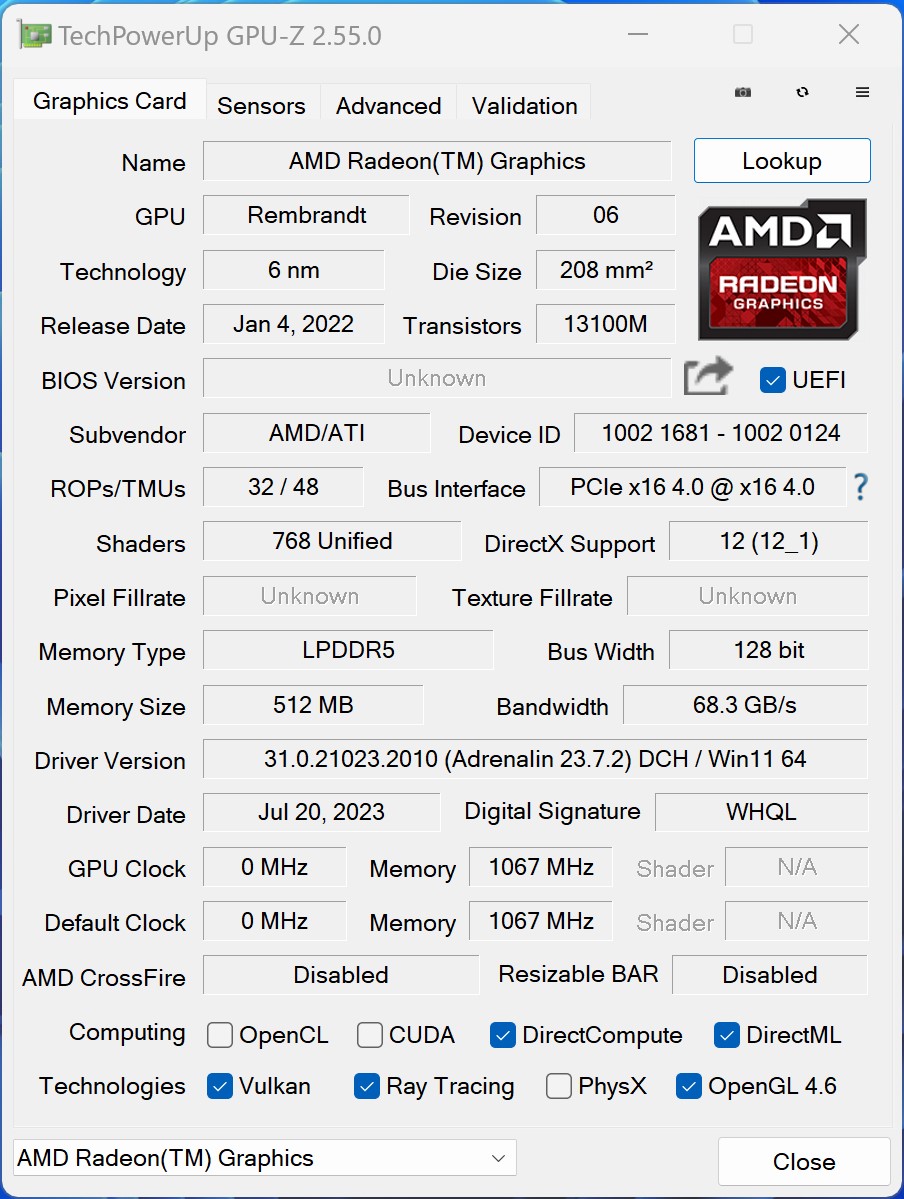
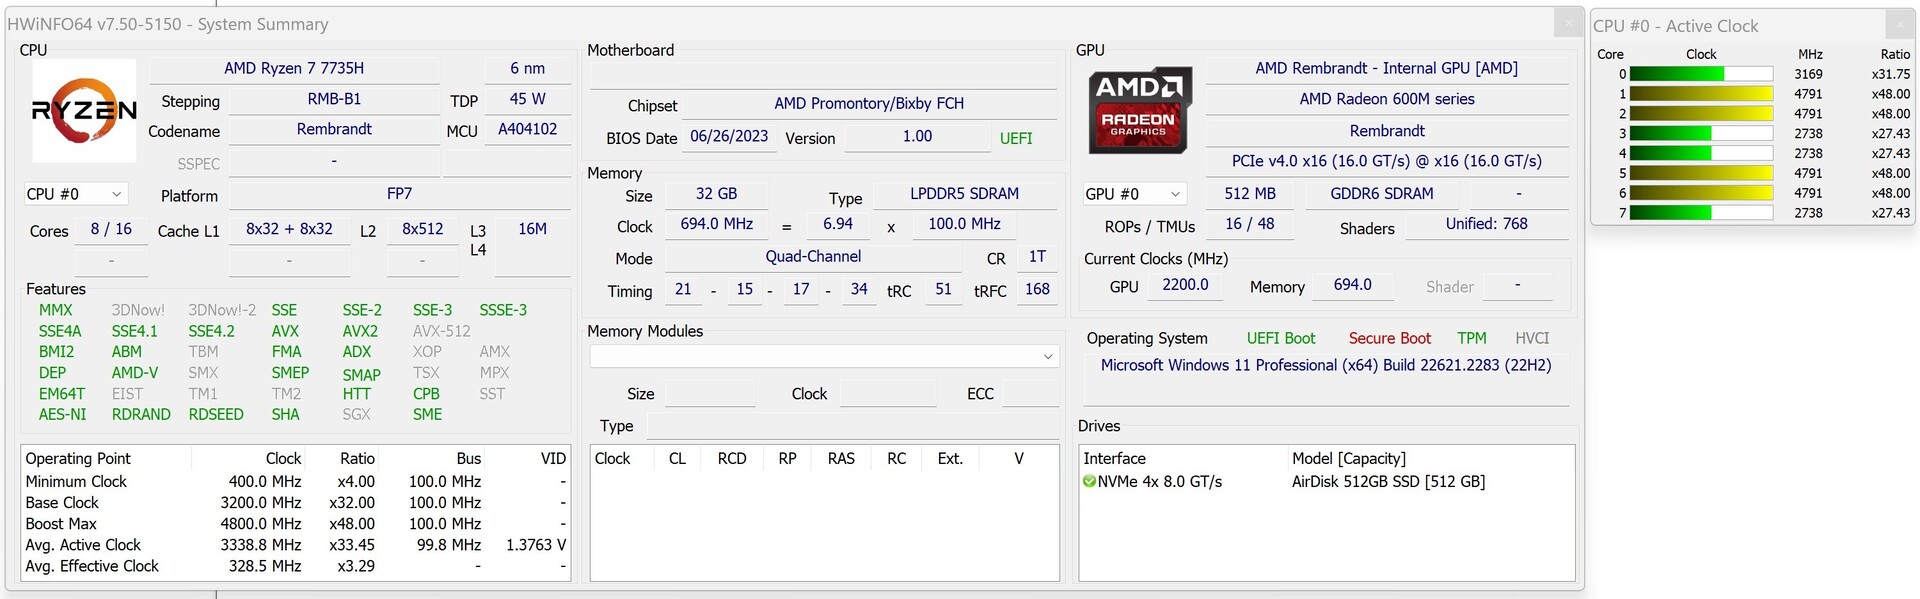
Desempenho - O AMD Ryzen 7 7735H tem apenas núcleos Zen 3+
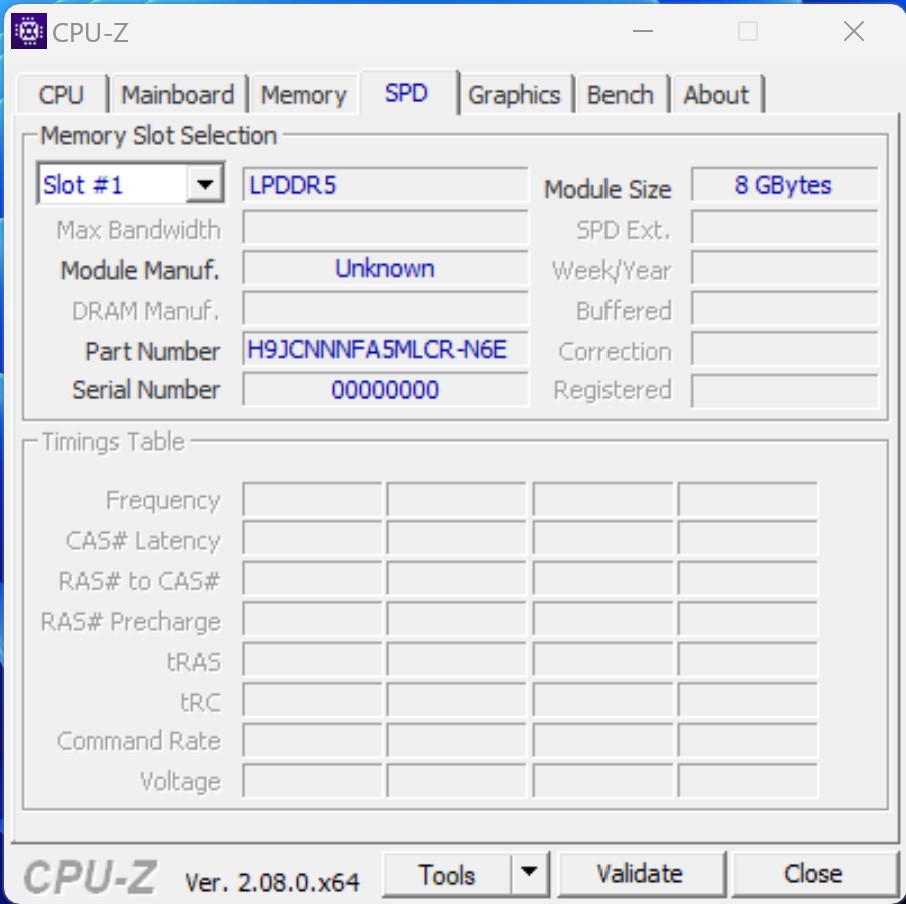
Com oAMD Ryzen 7 7735Ho Acemagic AM20 tem um SoC relativamente atualizado com 8 núcleos e 16 threads. Isso garante que você esteja bem equipado para lidar com a maioria das tarefas. Até o momento, outras configurações não foram divulgadas. Com relação à RAM, o Acemagic AM20 está disponível com 16 ou 32 GB. O último é preferível, pois não é possível fazer upgrade.
Condições de teste
Realizamos todos os testes de desempenho usando o perfil de energia de "alto desempenho". Não alteramos o desempenho do SoC e deixamos o dispositivo no modo de fábrica, de acordo com as configurações do BIOS. Os diferentes planos de economia de energia foram usados apenas para as medições de consumo de energia e para a análise do nível de ruído.
Processador
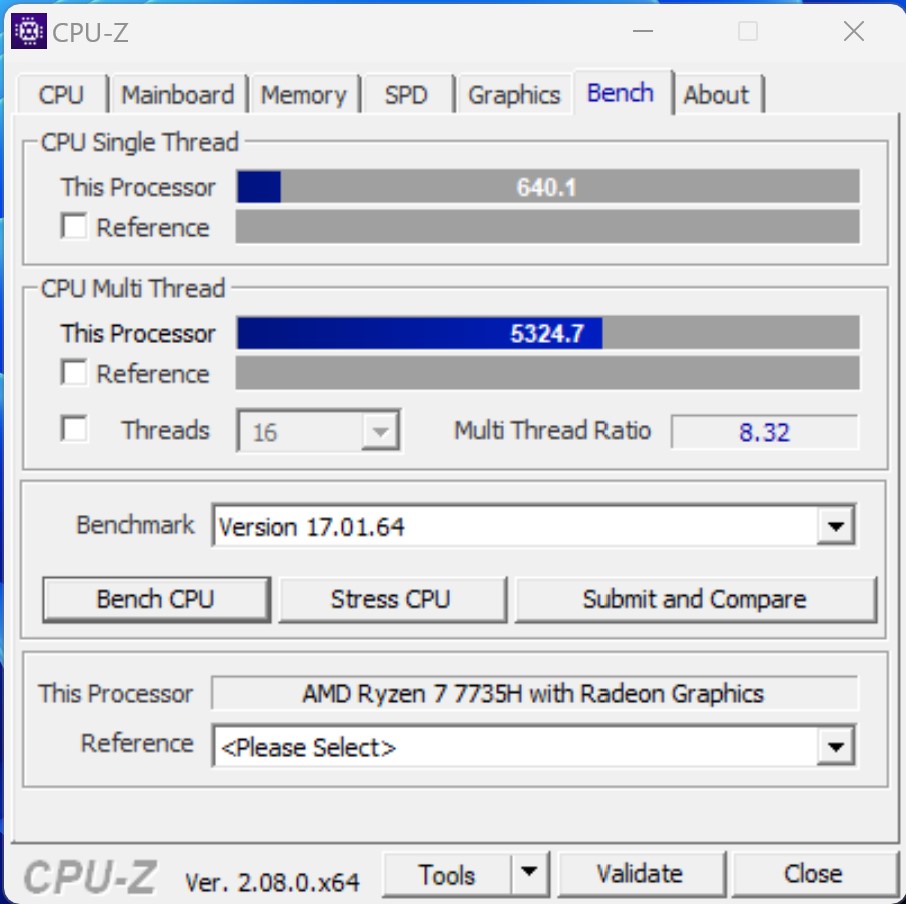
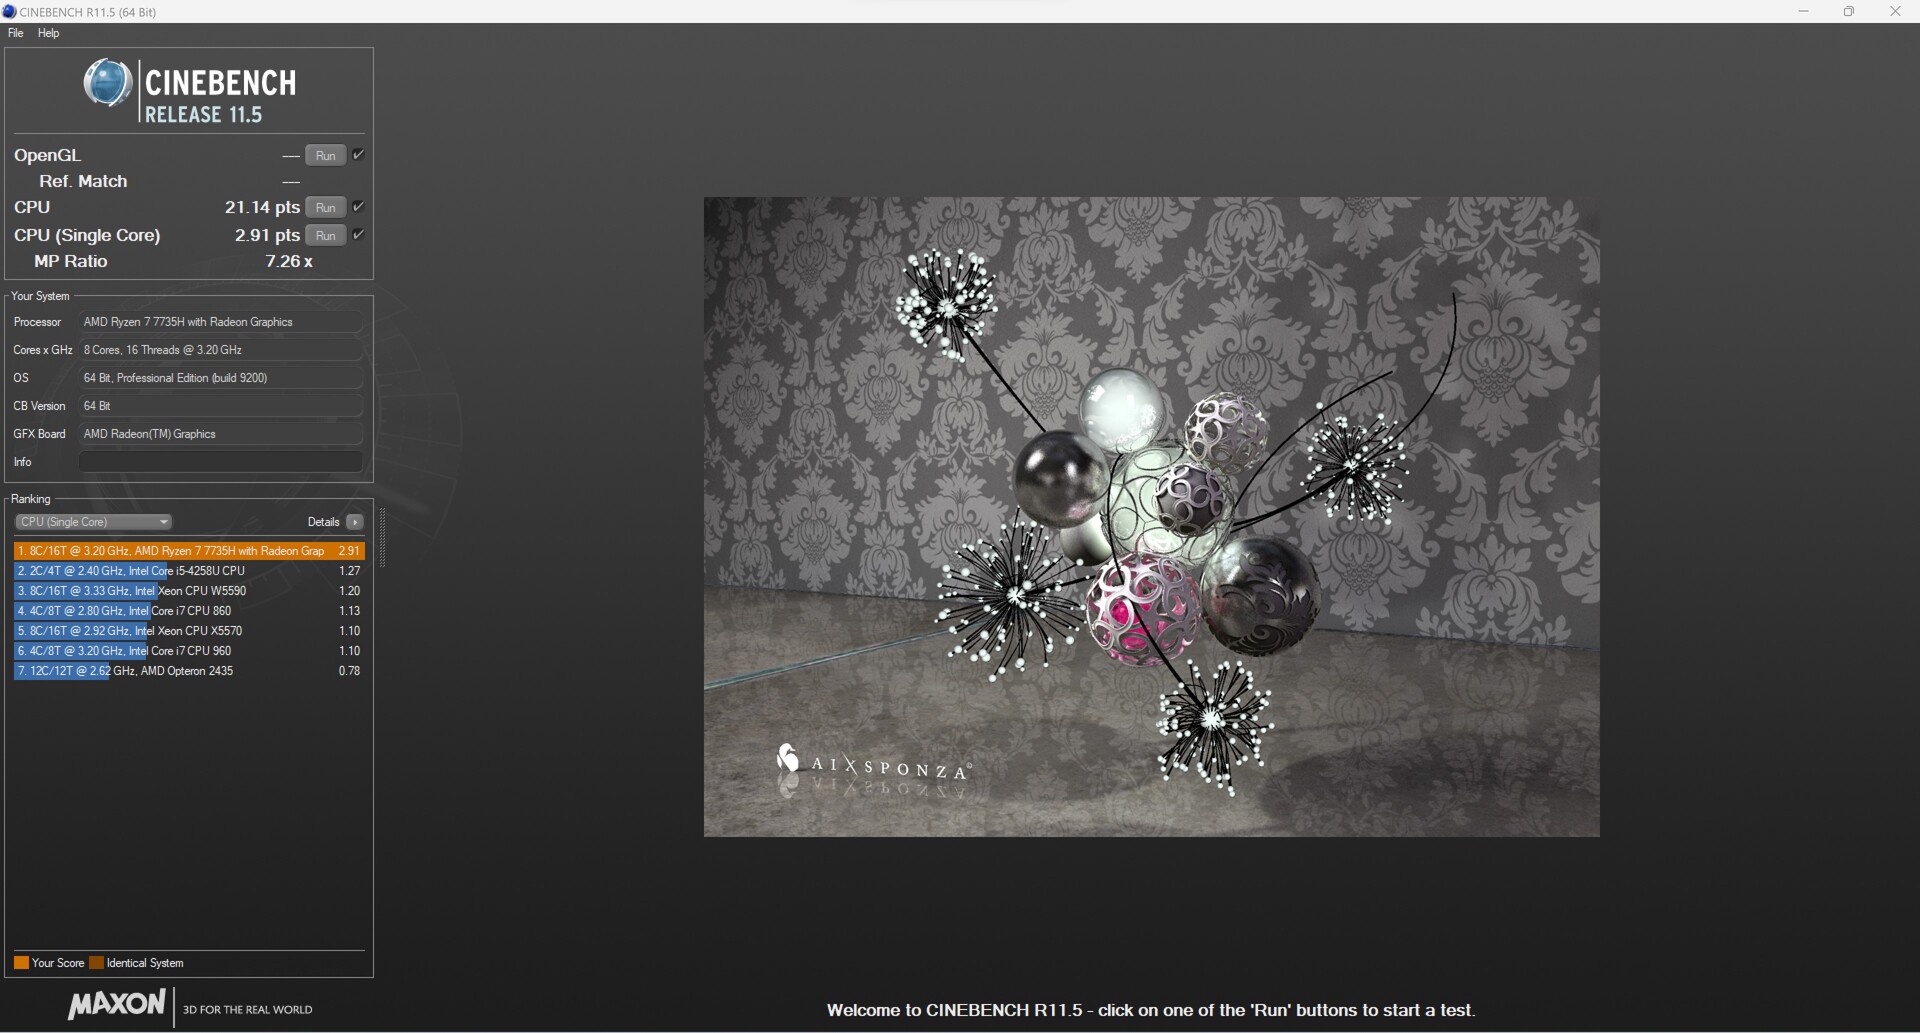
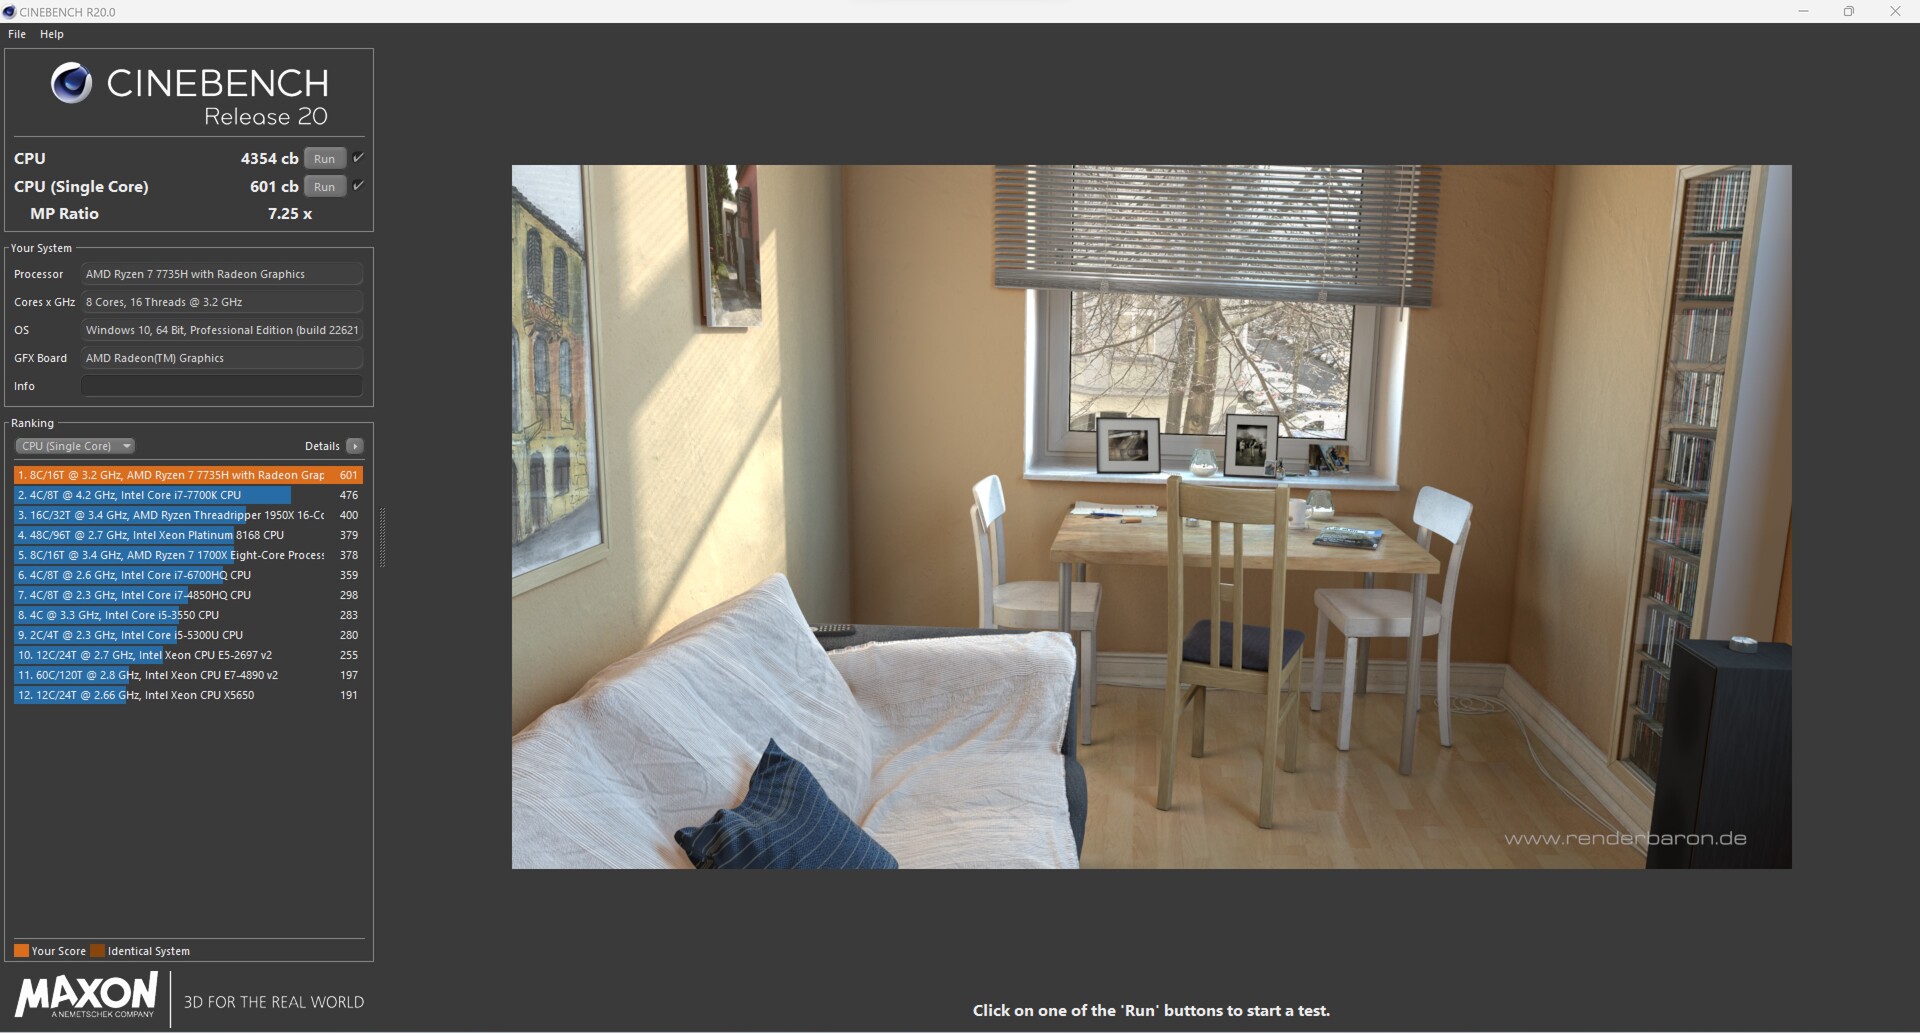
OAMD Ryzen 7 7735Hcombina oito núcleos Zen 3+, o que significa que o fabricante decidiu não usar a atual série Phoenix da AMD. Apesar disso, com 8 núcleos e 16 threads, o SoC alcança um desempenho decente de vários núcleos. No entanto, isso nos mostra que o Acemagic AM20 está apenas um pouco à frente doMinisforum UM560 XTem comparação com oAMD Ryzen 9 6900HX, o AMD Ryzen 7 7735H perde cerca de sete por cento. Em comparação com oGeekom Mini IT12observamos pontuações de classificação de desempenho quase idênticas.
Nos benchmarks AIDA64, o Acemagic AM20 demonstra maravilhosamente que um SoC potente foi instalado. No entanto, o Geekom AS 6 e o Minisforum UM790 Pro são claramente melhores.
Outras comparações e benchmarks podem ser encontrados em nossa tabela de comparação de CPUs Mobile Processors - Benchmark List .
| WinRAR - Result | |
| Minisforum Neptune Series NAD9 | |
| Minisforum Venus Series UM560 XT | |
| Minisforum Venus Series UM790 Pro | |
| Geekom AS 6, R9 6900HX | |
| Morefine M600, 6600U | |
| Geekom Mini IT12 | |
| Acemagic AM20 | |
| Blackview MP200 | |
* ... menor é melhor
AIDA64: FP32 Ray-Trace | FPU Julia | CPU SHA3 | CPU Queen | FPU SinJulia | FPU Mandel | CPU AES | CPU ZLib | FP64 Ray-Trace | CPU PhotoWorxx
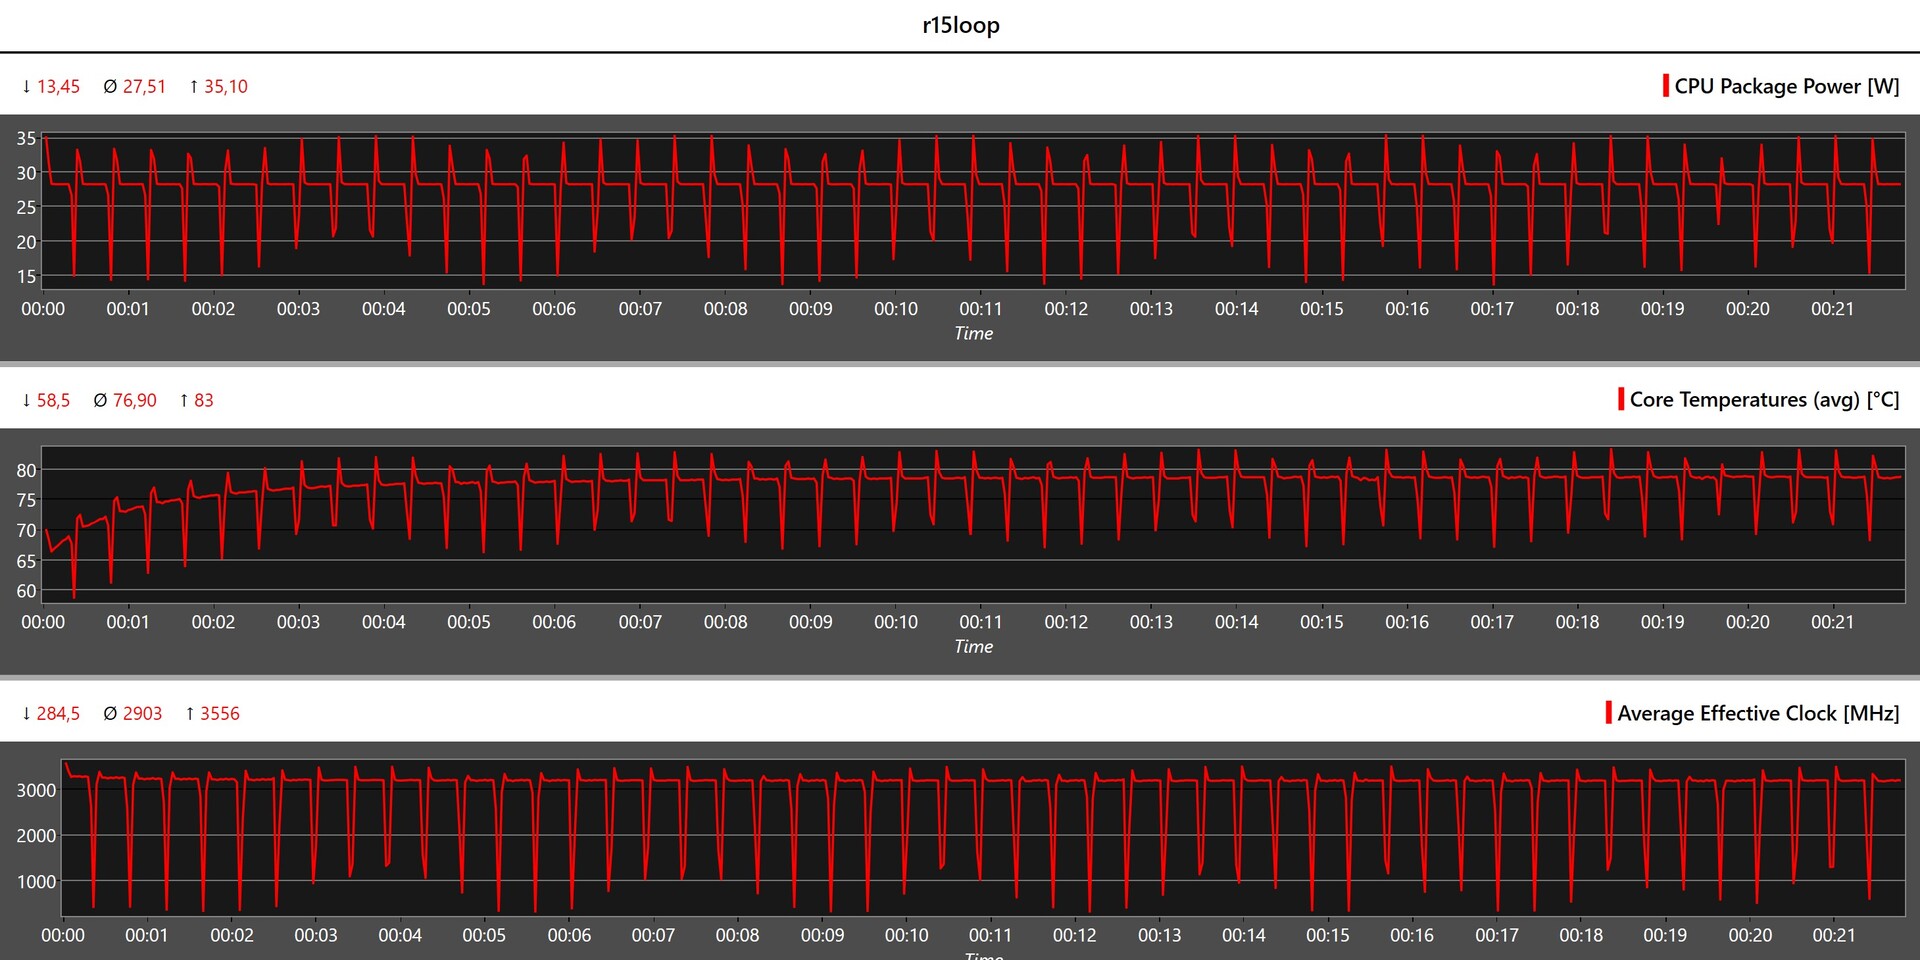
Acemagic AM20 vs. Cinebench R15 multi-loop
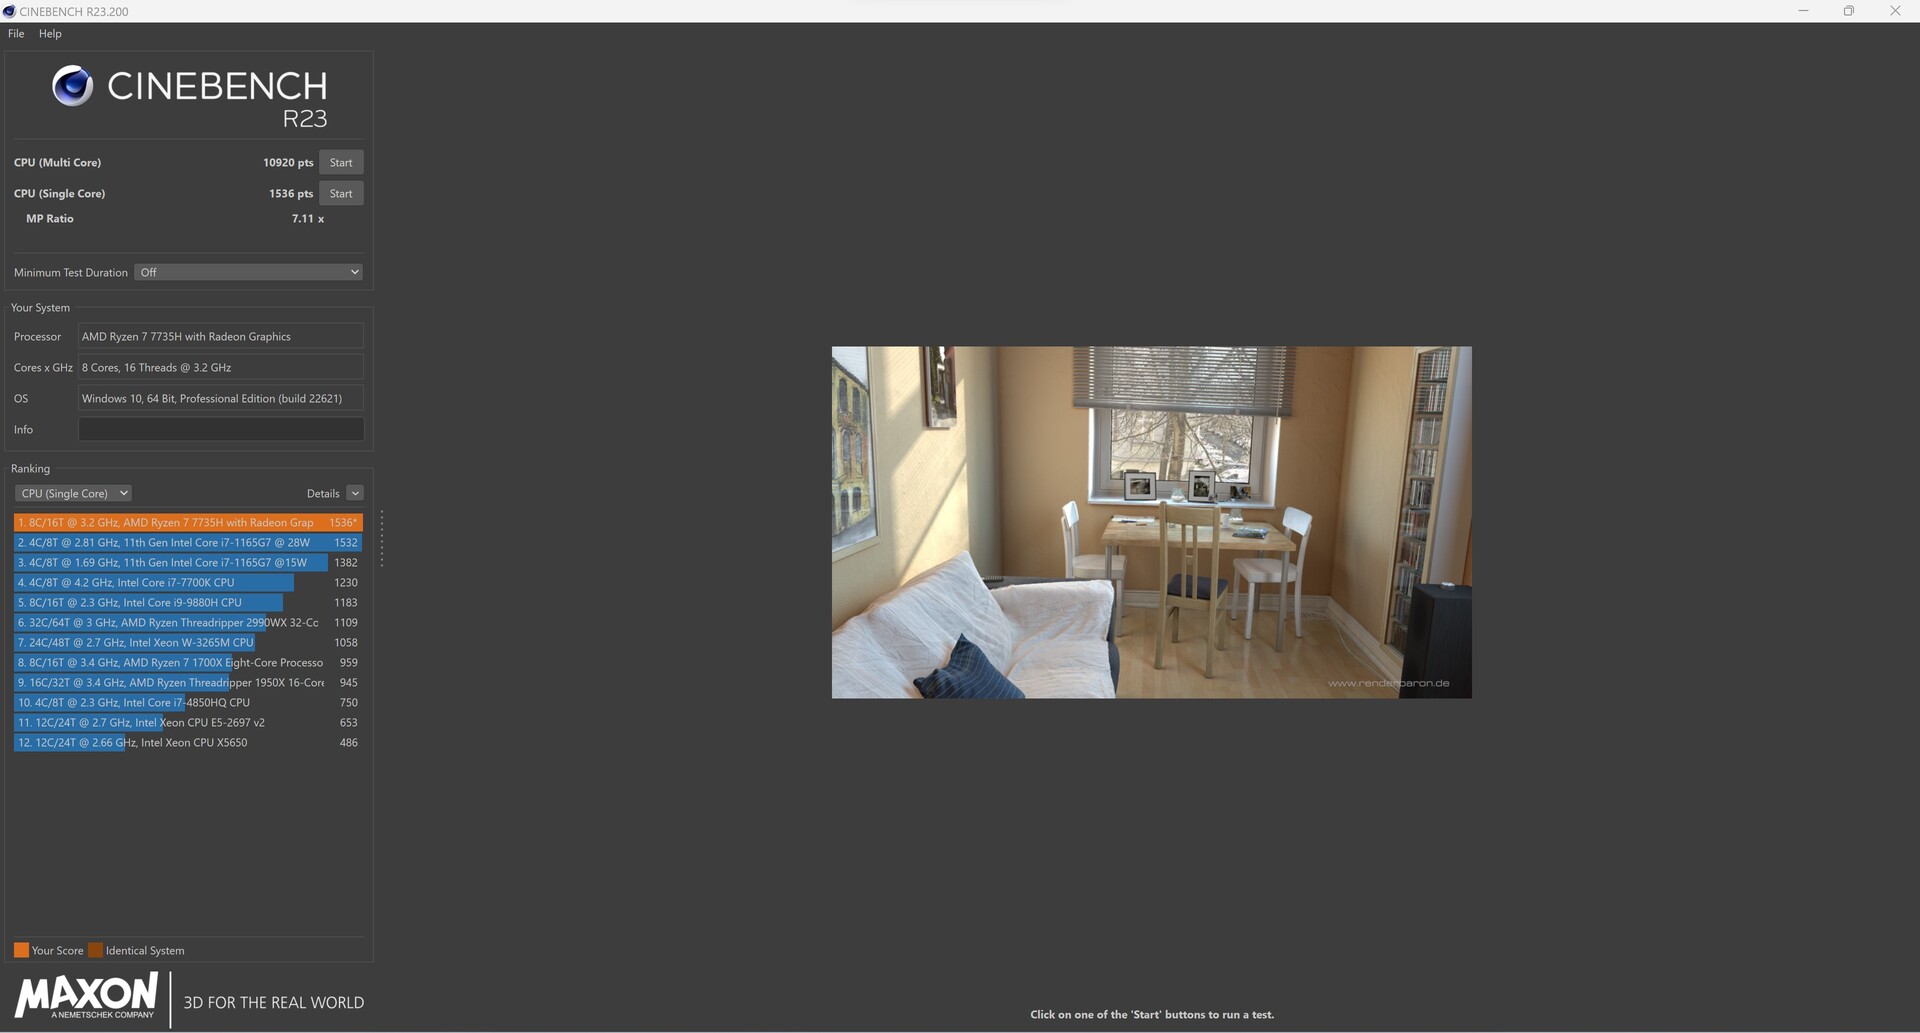
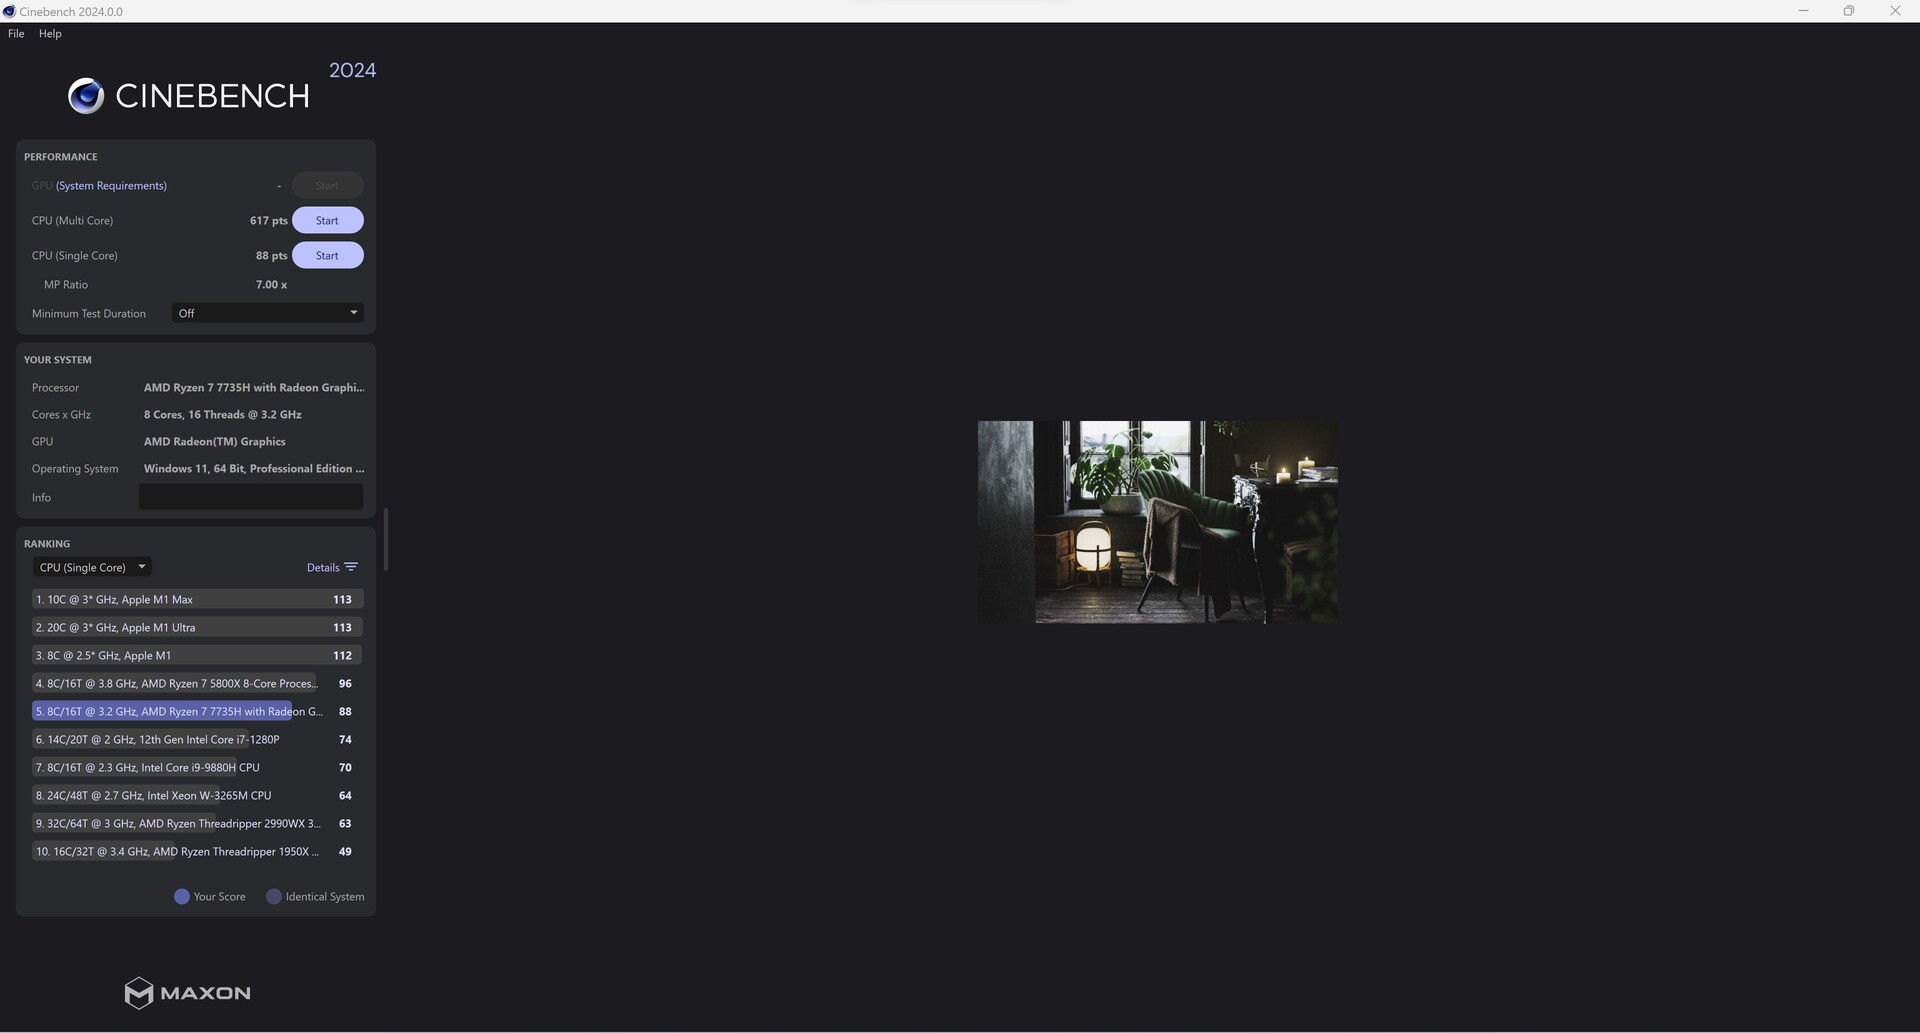
Com o loop contínuo do Cinebench R15, analisamos o AMD Ryzen 7 77350Hem um período de tempo mais longo. O Acemagic AM20 concluiu bem as 50 execuções e sem nenhuma perda perceptível de desempenho. Comparado com o Minisforum NAD9nosso modelo de análise consegue até mesmo prevalecer, alcançando um resultado ligeiramente melhor.
Desempenho do sistema
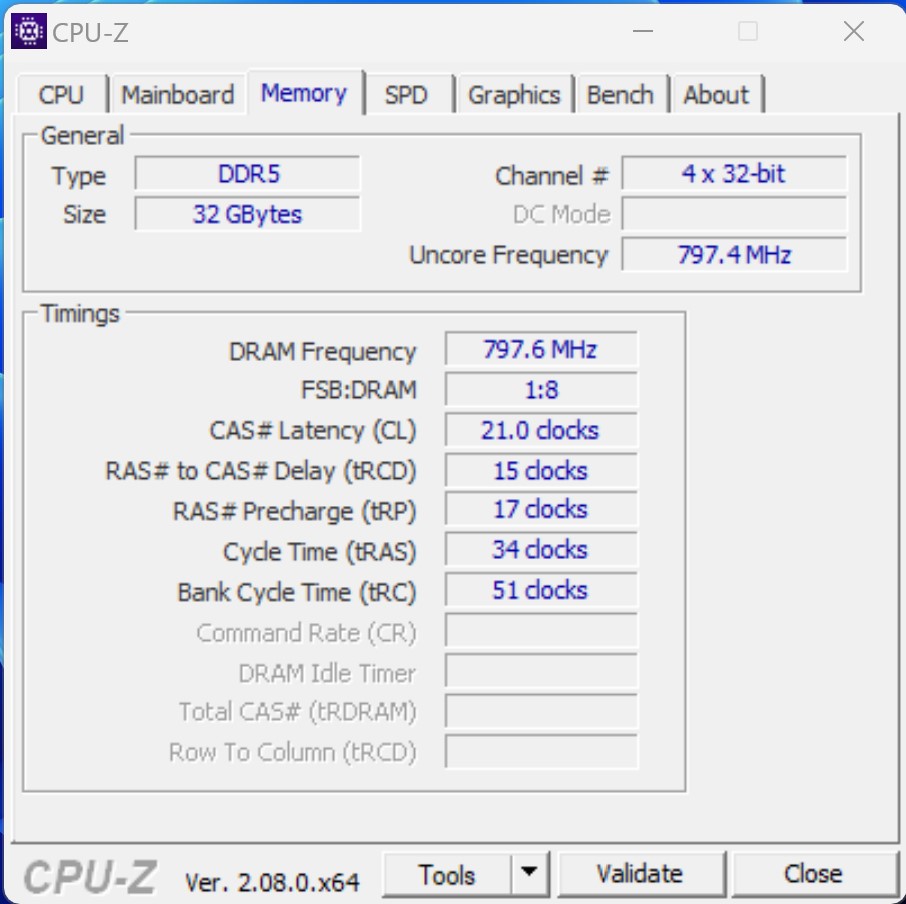
De um ponto de vista subjetivo, o desempenho do sistema do Acemagic AM20 é bom e isso é demonstrado pelos benchmarks sintéticos. No PCMark 10, apenas oMinisforum UM790 Proé mais rápido. No Crossmark, observamos uma história semelhante, embora ele se comporte melhor com os processadores Intel. Esse é o motivo pelo qual tanto oMinisforum NAD9 e oGeekom Mini IT12também estão na frente do nosso dispositivo de análise. Nos testes de RAM, o Acemagic se beneficia da rápida RAM DDR5 a 6.400 MT/s. Nossa amostra de análise não consegue acompanhar seus pares devido à alta latência.
* ... menor é melhor
Latências de DPC
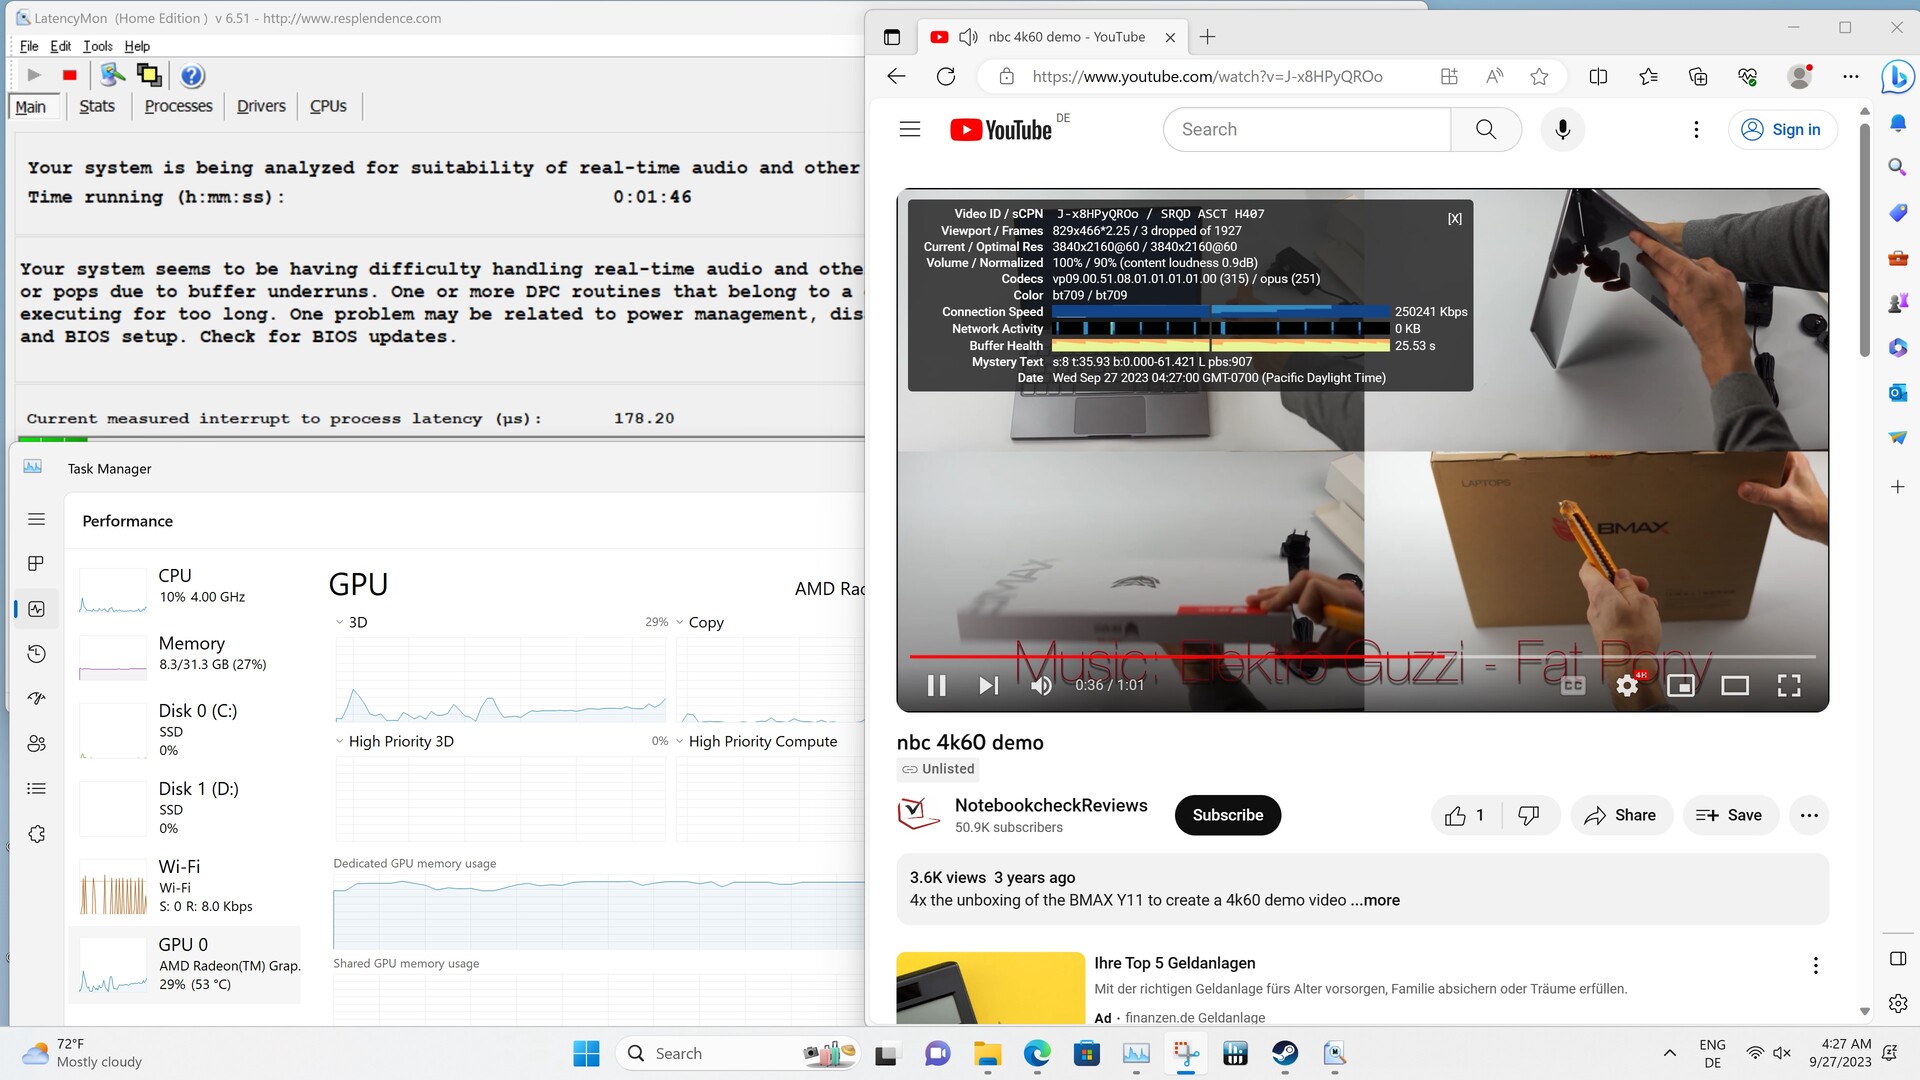
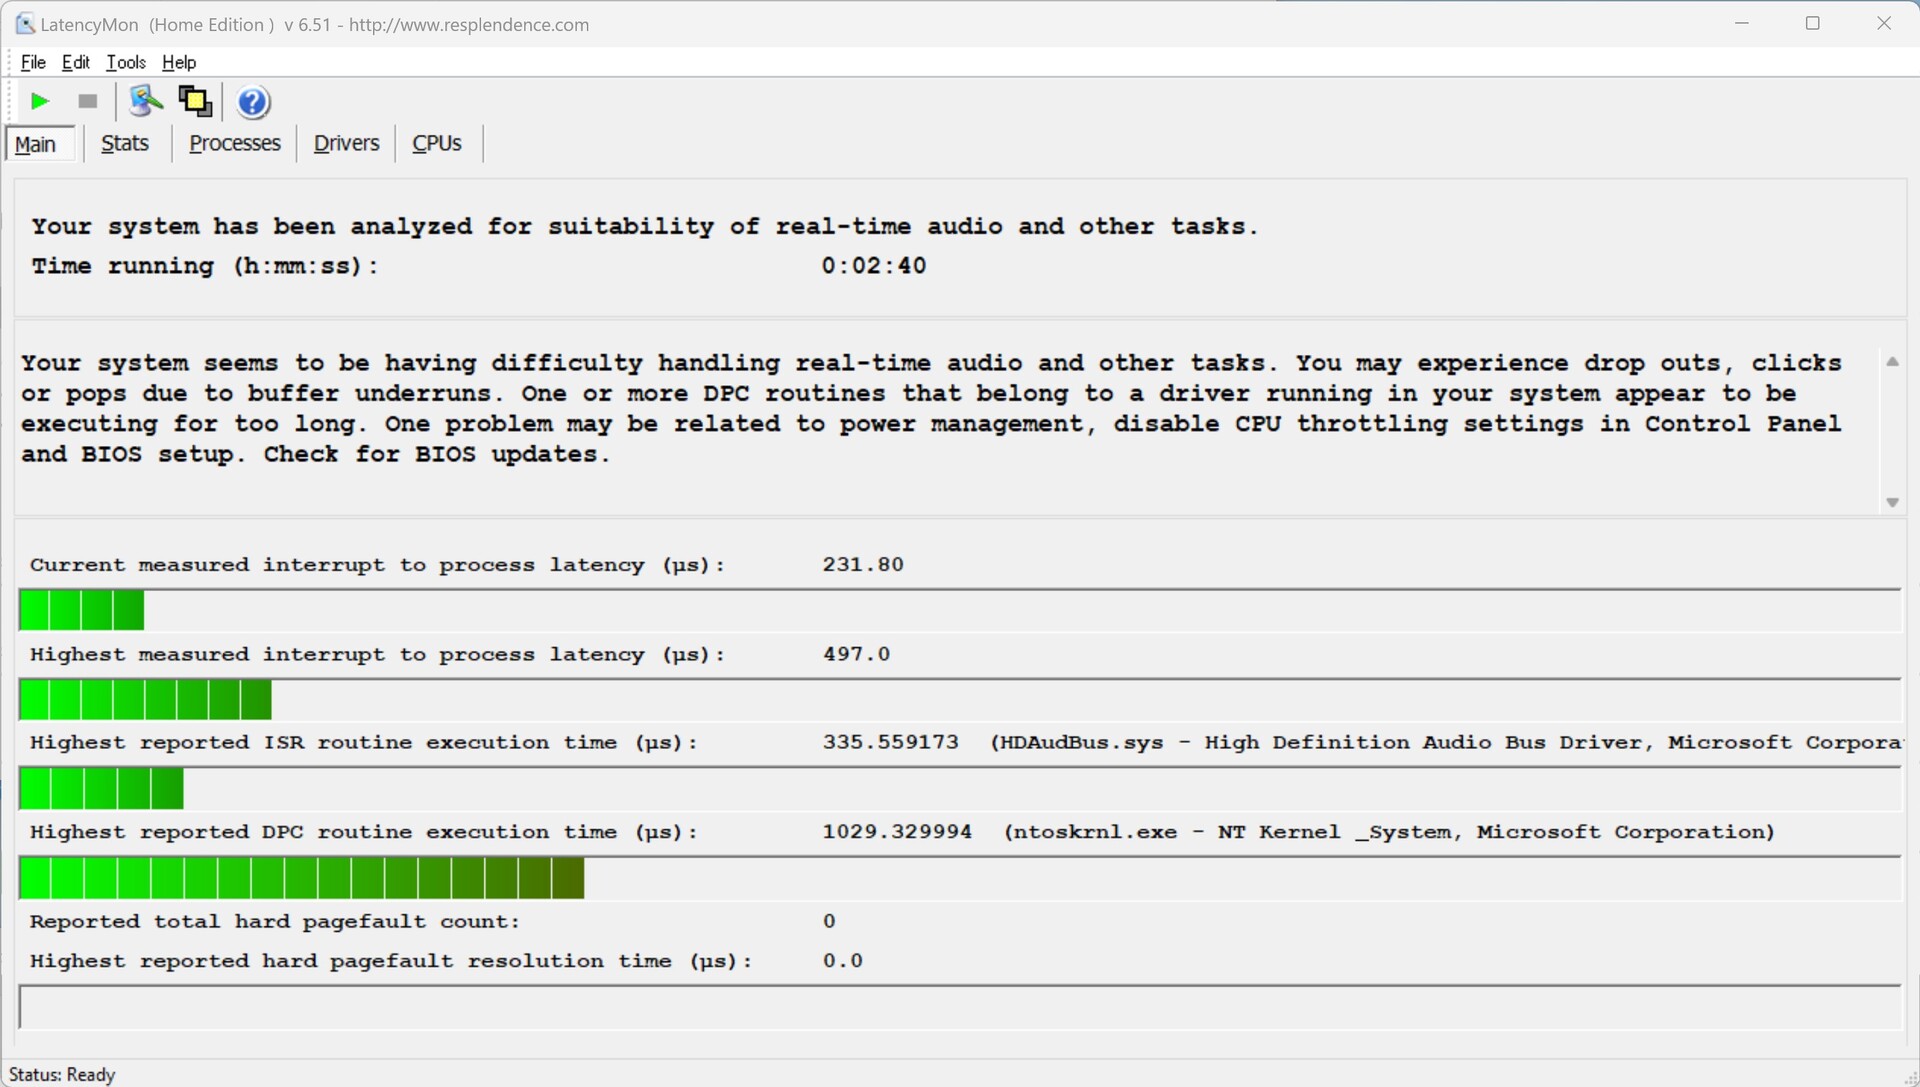
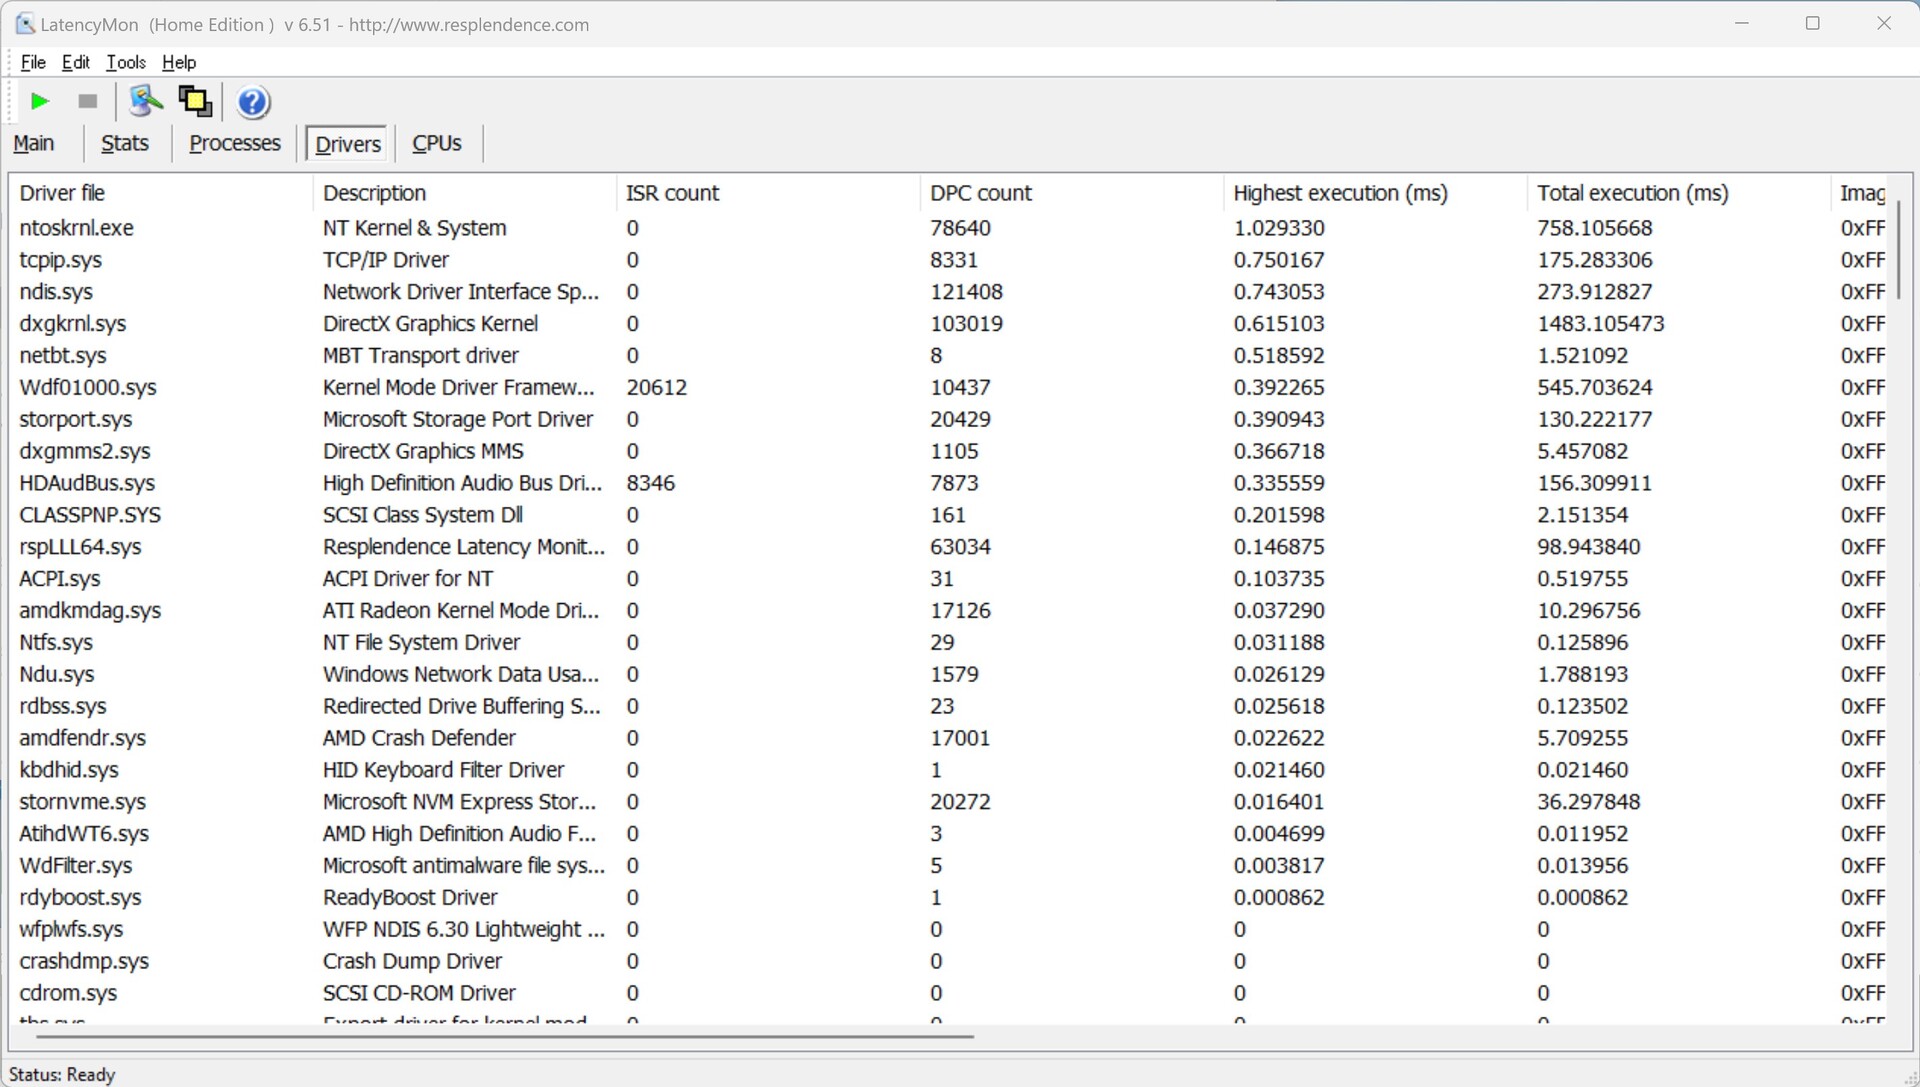
Até este ponto, não tínhamos visto nenhum problema de latência ao abrir várias guias no navegador Edge. O LatencyMon só nos mostrou uma latência maior, mas não particularmente perceptível, ao reproduzir nosso vídeo de teste em 4K. Os melhores dispositivos até o momento não apresentam um desempenho melhor nessa área, o que significa que o Acemagic AM20 garantiu uma posição intermediária em nossa comparação.
| DPC Latencies / LatencyMon - interrupt to process latency (max), Web, Youtube, Prime95 | |
| Geekom AS 6, R9 6900HX | |
| Blackview MP200 | |
| Minisforum Neptune Series NAD9 | |
| Minisforum Venus Series UM790 Pro | |
| Acemagic AM20 | |
| Morefine M600, 6600U | |
| Geekom Mini IT12 | |
| Minisforum Venus Series UM560 XT | |
* ... menor é melhor
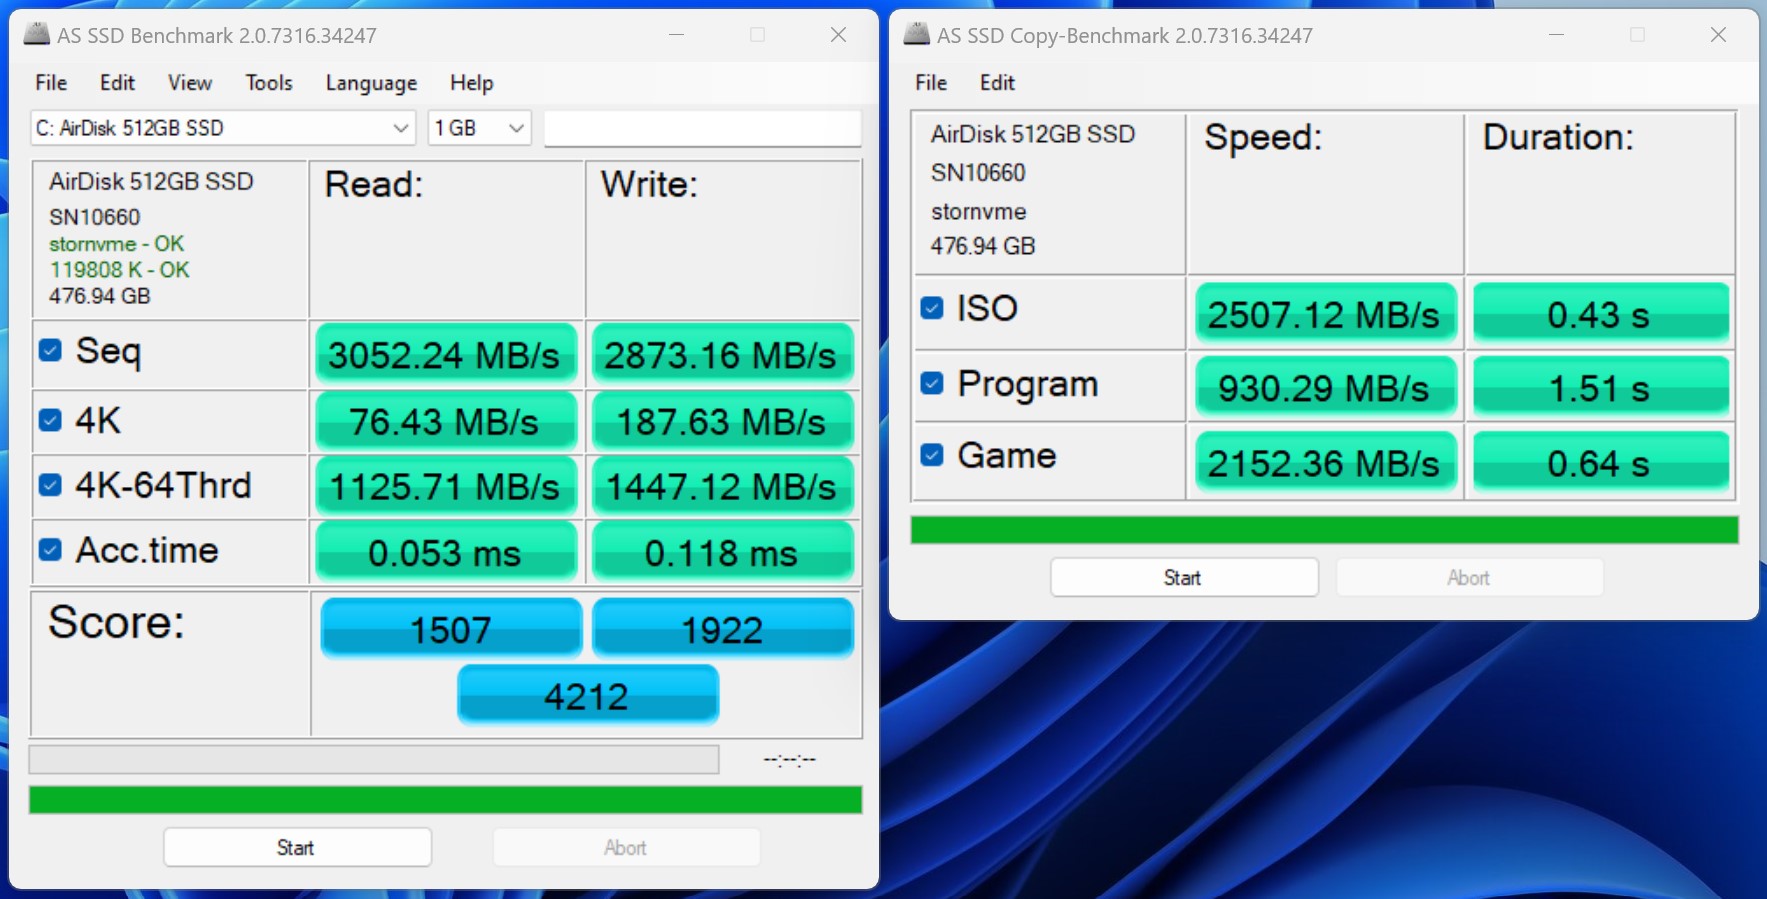
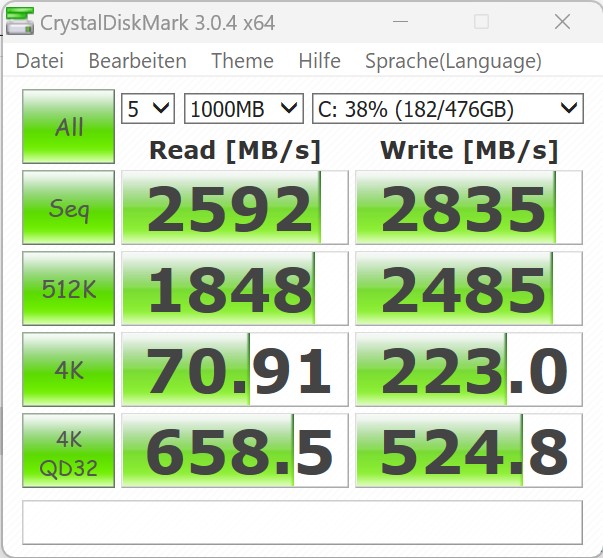
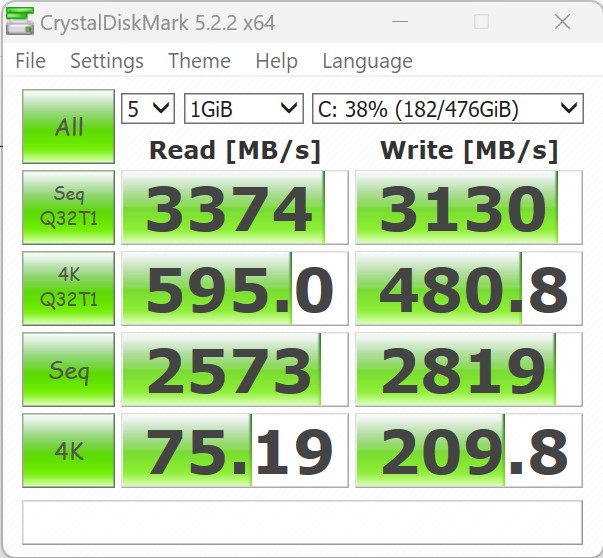
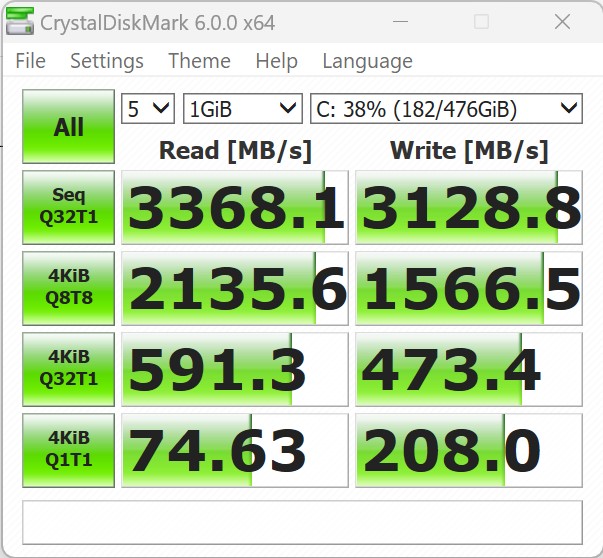
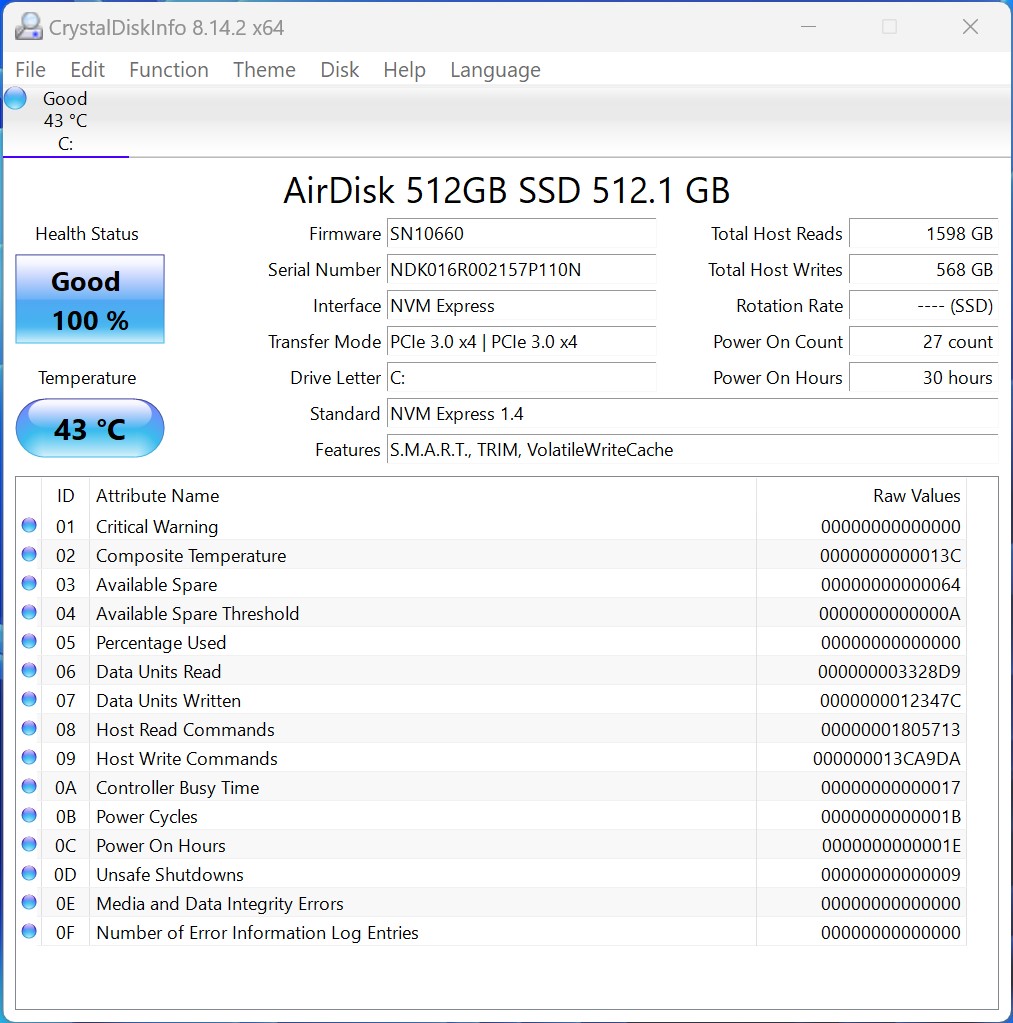
Armazenamento em massa
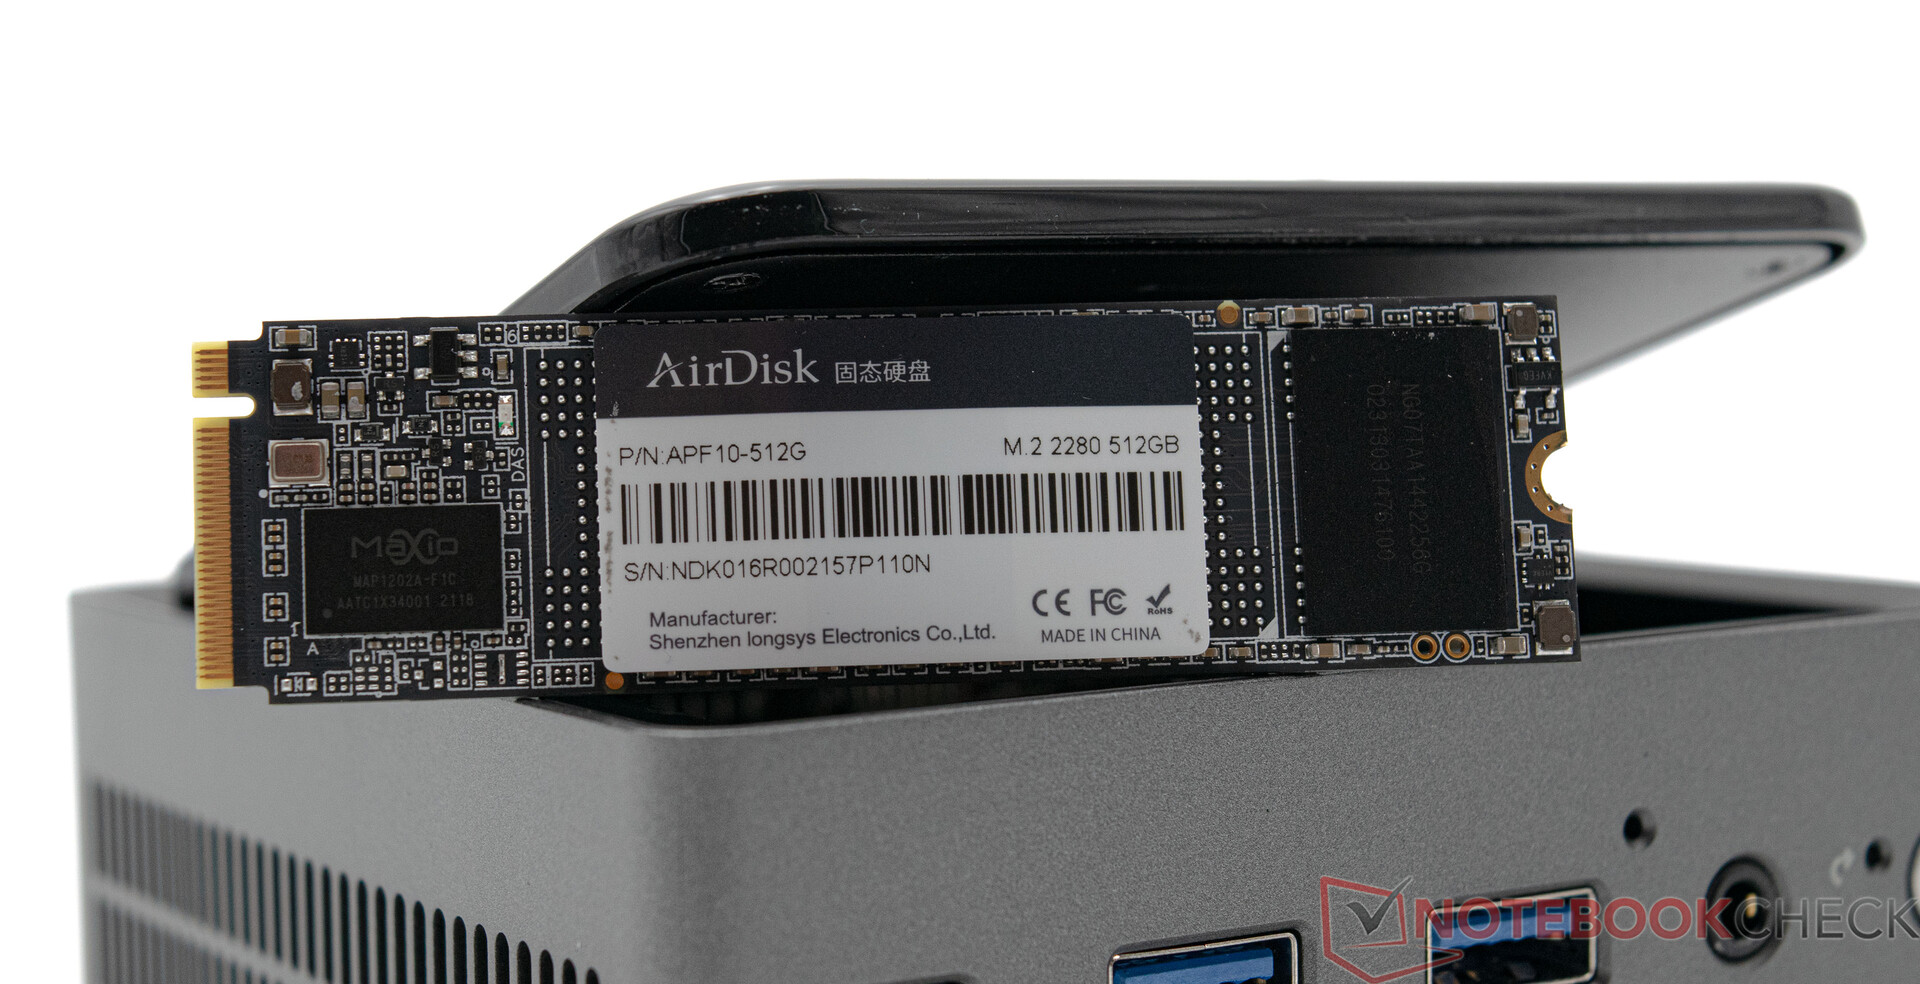
Nosso dispositivo de análise contém um SSD de 512 GB do fabricante AirDisk. Uma empresa até então desconhecida que ainda não analisamos. Entretanto, a SSD instalada usa a interface PCIe, o que significa que o armazenamento em massa oferece desempenho adequado. No entanto, as pontuações do Acemagic AM20 não coincidem com as doMinisforum NAD9. No entanto, mais uma vez, nossa amostra de análise conseguiu garantir o segundo lugar. No que diz respeito ao resfriamento, a Acemagic tem o AM20 sob controle, embora o armazenamento em massa só consiga dissipar o calor passivamente através da caixa com a ajuda de uma almofada térmica. Os testes mostram que isso funciona e que o desempenho do disco não diminui. É possível instalar um total de três dispositivos de armazenamento em massa M.2. Entretanto, o armazenamento de 2,5 polegadas não pode ser instalado no Acemagic AM20.
Outras comparações e benchmarks podem ser encontrados em nossa tabela de comparação.

* ... menor é melhor
Continuous Performance Read: DiskSpd Read Loop, Queue Depth 8
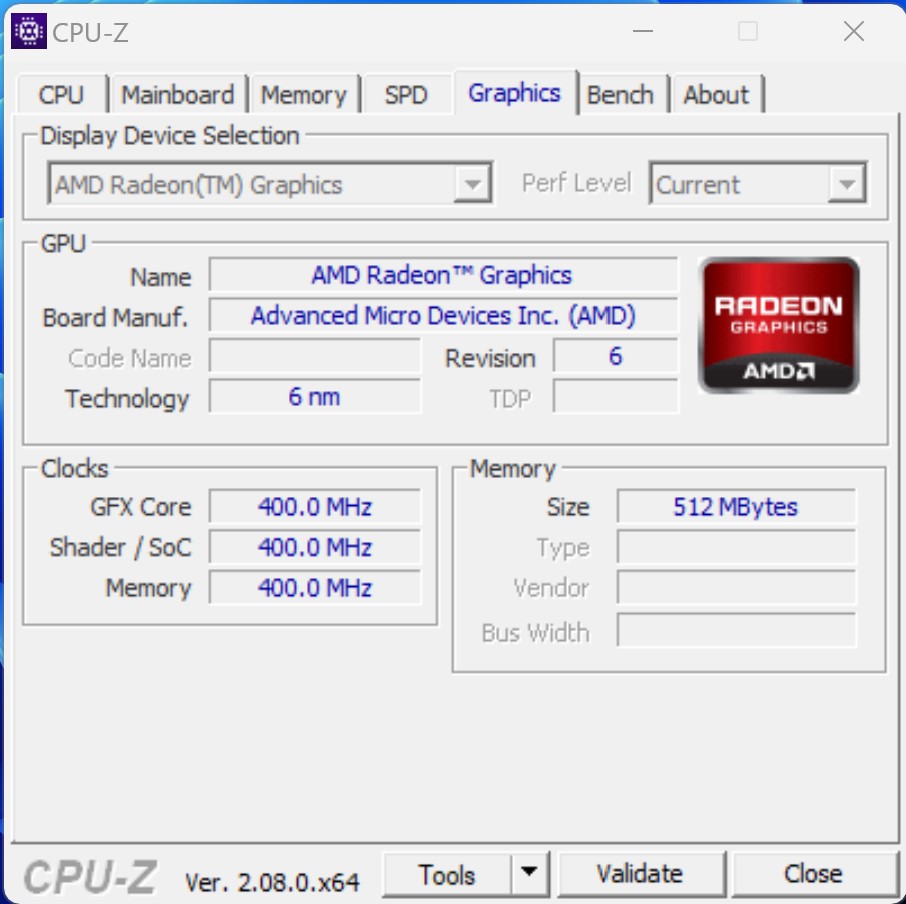
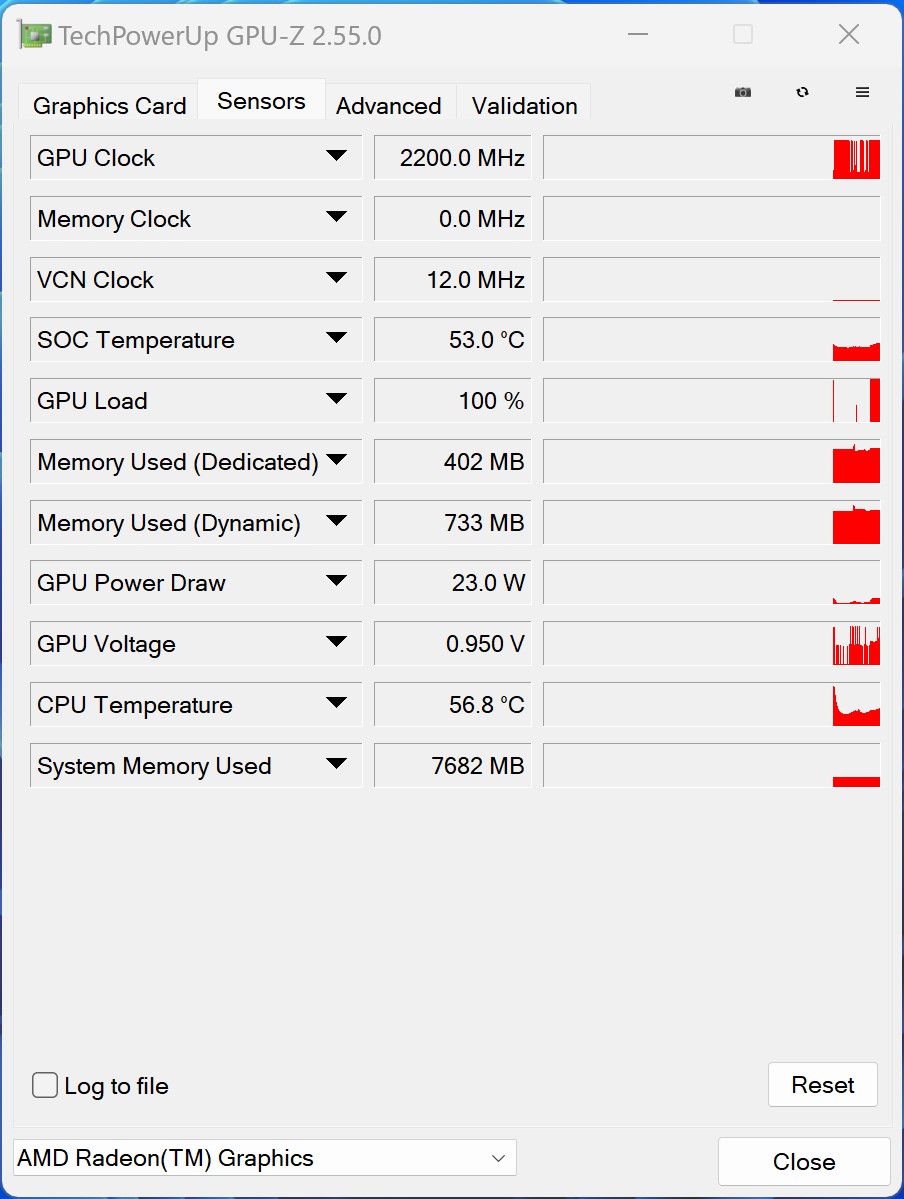
Placa de vídeo - AMD Radeon 680M
Em benchmarks sintéticos, o Acemagic AM20 se beneficia do AMD Ryzen 7 7735Ha AMD Radeon 680Me de seu excelente desempenho básico. Ele fica a uma distância quase insignificante doMinisforum UM790 Pro e doGeekom AS 6- com a mesma iGPU - é empurrado para o terceiro lugar. A Intel não tem nenhuma chance aqui e não tem muito o que contrapor neste momento. Com as atuais iGPUs Intel Iris Xe Graphics G7, o Geekom Mini IT12fica muito atrás e só consegue uma colocação no meio da tabela.
Para mais comparações e benchmarks, dê uma olhada em nossoGPU.
| Unigine Valley 1.0 | |
| 1920x1080 Extreme HD DirectX AA:x8 | |
| Acemagic AM20 | |
| Geekom AS 6, R9 6900HX | |
| Minisforum Venus Series UM790 Pro | |
| Minisforum Neptune Series NAD9 | |
| Geekom Mini IT12 | |
| Minisforum Venus Series UM560 XT | |
| Morefine M600, 6600U | |
| Blackview MP200 | |
| 1920x1080 Extreme HD Preset OpenGL AA:x8 | |
| Acemagic AM20 | |
| Geekom AS 6, R9 6900HX | |
| Minisforum Venus Series UM790 Pro | |
| Geekom Mini IT12 | |
| Minisforum Neptune Series NAD9 | |
| Minisforum Venus Series UM560 XT | |
| Morefine M600, 6600U | |
| Blackview MP200 | |
| Affinity Photo 2 - Combined (Single / Multi GPU) | |
| Minisforum Neptune Series NAD9 | |
| Geekom Mini IT12 | |
| Minisforum Venus Series UM560 XT | |
| Acemagic AM20 | |
| Minisforum Venus Series UM790 Pro | |
| Blackview MP200 | |
| Geekom AS 6, R9 6900HX | |
| 3DMark 05 Standard | 51389 pontos | |
| 3DMark 06 Standard Score | 35629 pontos | |
| 3DMark Vantage P Result | 34781 pontos | |
| 3DMark 11 Performance | 10939 pontos | |
| 3DMark Ice Storm Standard Score | 160248 pontos | |
| 3DMark Cloud Gate Standard Score | 32366 pontos | |
| 3DMark Fire Strike Score | 6858 pontos | |
| 3DMark Fire Strike Extreme Score | 3434 pontos | |
| 3DMark Time Spy Score | 2712 pontos | |
Ajuda | ||
Desempenho em jogos - AMD Radeon 680M
Para uma iGPU, já ficamos impressionados com a AMD Radeon 680Mem nossos outros testes. Nessa área, o Acemagic AM20 está, sem exceção, no mesmo nível que oGeekom AS 6. Com algumas pequenas restrições nos detalhes gráficos, é possível jogar muitos jogos sem problemas. Entretanto, ele não substitui uma placa de vídeo.
| The Witcher 3 | |
| 1024x768 Low Graphics & Postprocessing | |
| Minisforum Venus Series UM790 Pro | |
| Acemagic AM20 | |
| Geekom AS 6, R9 6900HX | |
| Minisforum Neptune Series NAD9 | |
| Geekom Mini IT12 | |
| Morefine M600, 6600U | |
| Minisforum Venus Series UM560 XT | |
| Blackview MP200 | |
| 1920x1080 High Graphics & Postprocessing (Nvidia HairWorks Off) | |
| Minisforum Venus Series UM790 Pro | |
| Acemagic AM20 | |
| Geekom AS 6, R9 6900HX | |
| Minisforum Neptune Series NAD9 | |
| Geekom Mini IT12 | |
| Minisforum Venus Series UM560 XT | |
| Morefine M600, 6600U | |
| Blackview MP200 | |
| Borderlands 3 | |
| 1280x720 Very Low Overall Quality (DX11) | |
| Minisforum Venus Series UM790 Pro | |
| Acemagic AM20 | |
| Minisforum Venus Series UM560 XT | |
| Geekom AS 6, R9 6900HX | |
| Minisforum Neptune Series NAD9 | |
| Geekom Mini IT12 | |
| Morefine M600, 6600U | |
| Blackview MP200 | |
| 1920x1080 High Overall Quality (DX11) | |
| Minisforum Venus Series UM790 Pro | |
| Geekom AS 6, R9 6900HX | |
| Acemagic AM20 | |
| Minisforum Neptune Series NAD9 | |
| Minisforum Venus Series UM560 XT | |
| Geekom Mini IT12 | |
| Morefine M600, 6600U | |
| Blackview MP200 | |
| GTA V | |
| 1024x768 Lowest Settings possible | |
| Minisforum Venus Series UM790 Pro | |
| Acemagic AM20 | |
| Morefine M600, 6600U | |
| Minisforum Venus Series UM560 XT | |
| Minisforum Neptune Series NAD9 | |
| Geekom AS 6, R9 6900HX | |
| Geekom Mini IT12 | |
| Blackview MP200 | |
| 1920x1080 High/On (Advanced Graphics Off) AA:2xMSAA + FX AF:8x | |
| Minisforum Venus Series UM790 Pro | |
| Acemagic AM20 | |
| Geekom AS 6, R9 6900HX | |
| Morefine M600, 6600U | |
| Minisforum Venus Series UM560 XT | |
| Minisforum Neptune Series NAD9 | |
| Geekom Mini IT12 | |
| Blackview MP200 | |
| baixo | média | alto | ultra | |
|---|---|---|---|---|
| GTA V (2015) | 144.2 | 130.5 | 52.9 | 23.2 |
| The Witcher 3 (2015) | 116.4 | 51.4 | 40.2 | 26.3 |
| Dota 2 Reborn (2015) | 125.7 | 102.8 | 79.5 | 69.2 |
| Final Fantasy XV Benchmark (2018) | 64.7 | 35.5 | 25.7 | |
| X-Plane 11.11 (2018) | 56.7 | 44 | 35.4 | |
| Far Cry 5 (2018) | 67 | 41 | 38 | 36 |
| Strange Brigade (2018) | 148.9 | 60.5 | 49.5 | 42.5 |
| Shadow of the Tomb Raider (2018) | 90 | 39.2 | 35.6 | 30.5 |
| Far Cry New Dawn (2019) | 61 | 39 | 37 | 34 |
| Metro Exodus (2019) | 72.2 | 30.6 | 23.4 | 18.8 |
| Borderlands 3 (2019) | 78.8 | 38.7 | 25.6 | 20.1 |
| F1 2020 (2020) | 158 | 80.5 | 62.4 | 42.8 |
| F1 2021 (2021) | 168.1 | 85 | 26.8 | |
| Far Cry 6 (2021) | 71.8 | 40.6 | 34.5 | 29.7 |
| God of War (2022) | 37.6 | 30.5 | 24.2 | 18.1 |
| GRID Legends (2022) | 76.9 | 60.6 | 47 | 38.4 |
| Tiny Tina's Wonderlands (2022) | 56.2 | 42.2 | 28.6 | 22.5 |
| F1 22 (2022) | 80.2 | 69.9 | 50.5 | 12.3 |
| F1 23 (2023) | 71.8 | 64.5 | 44.7 | 9.36 |
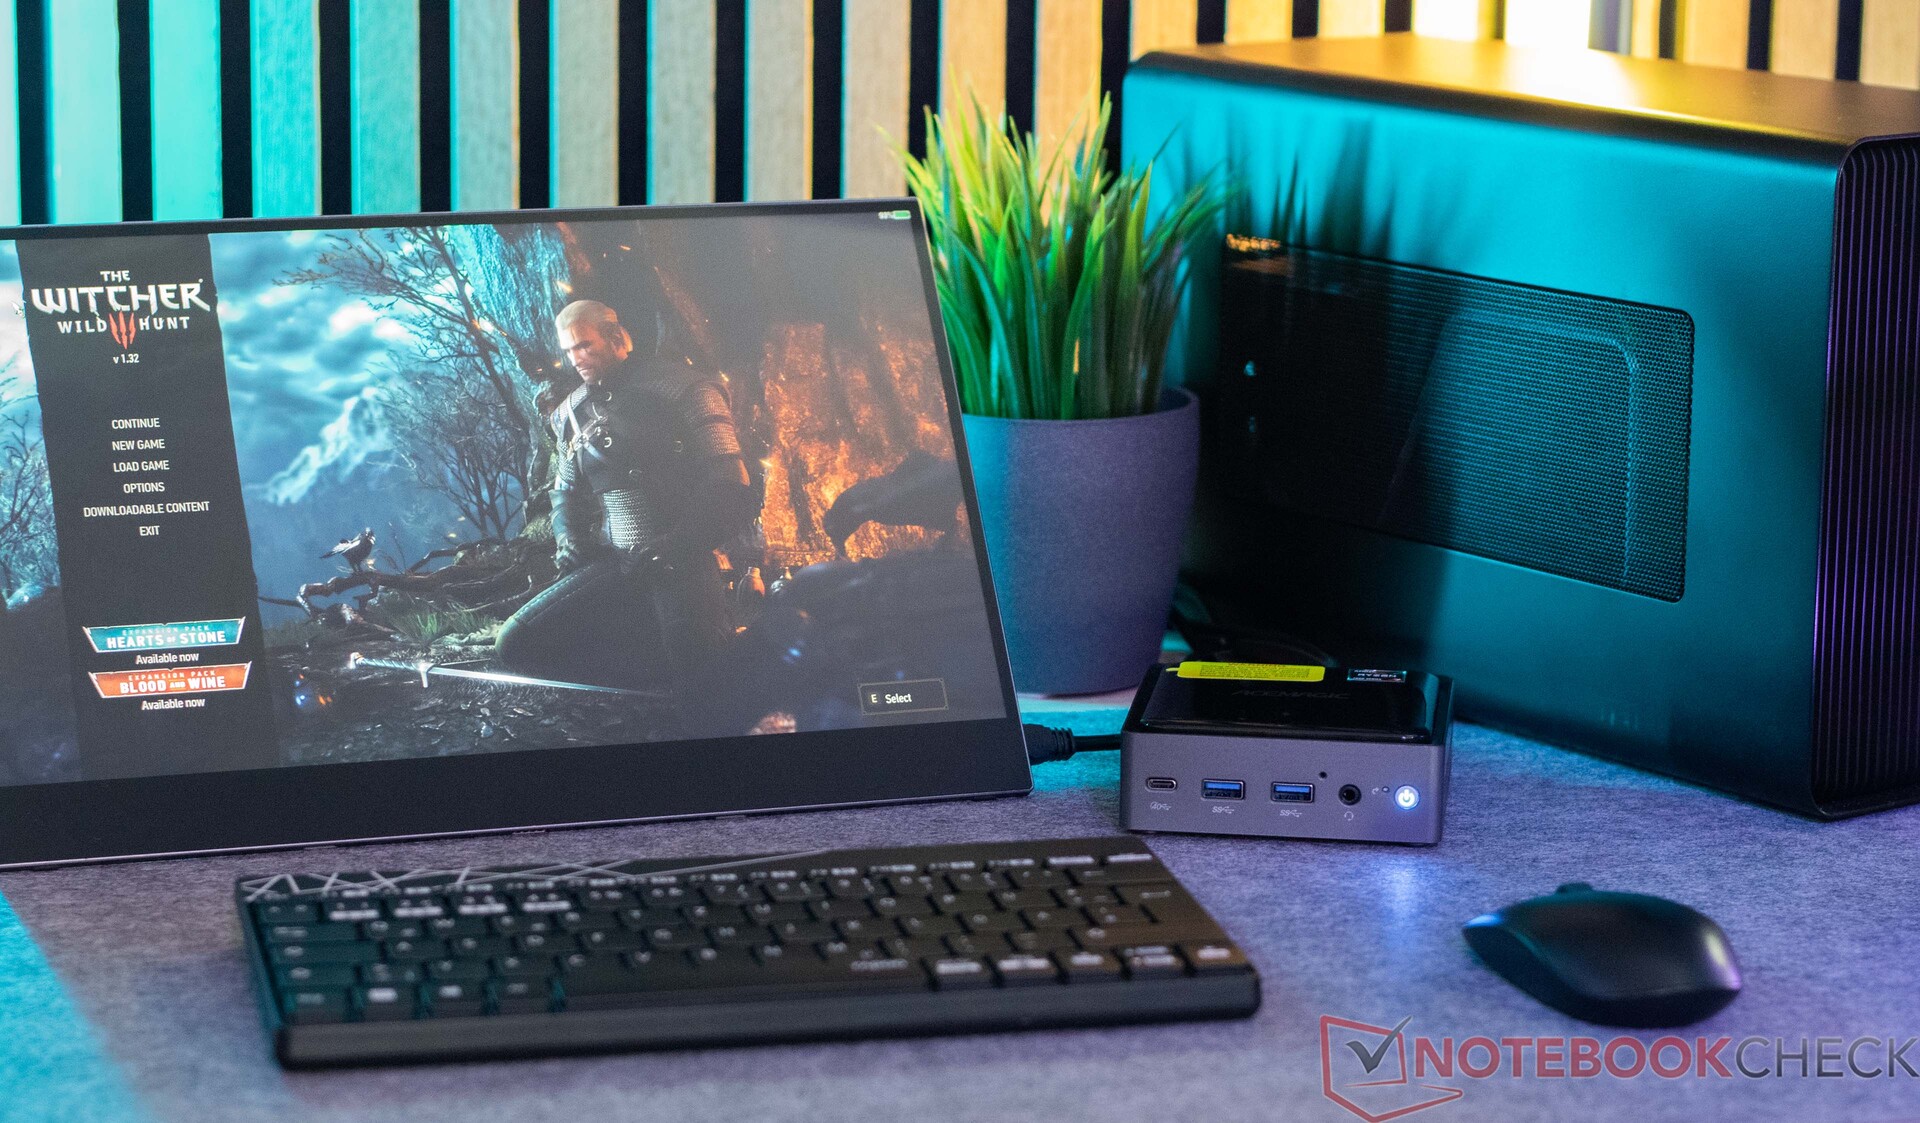
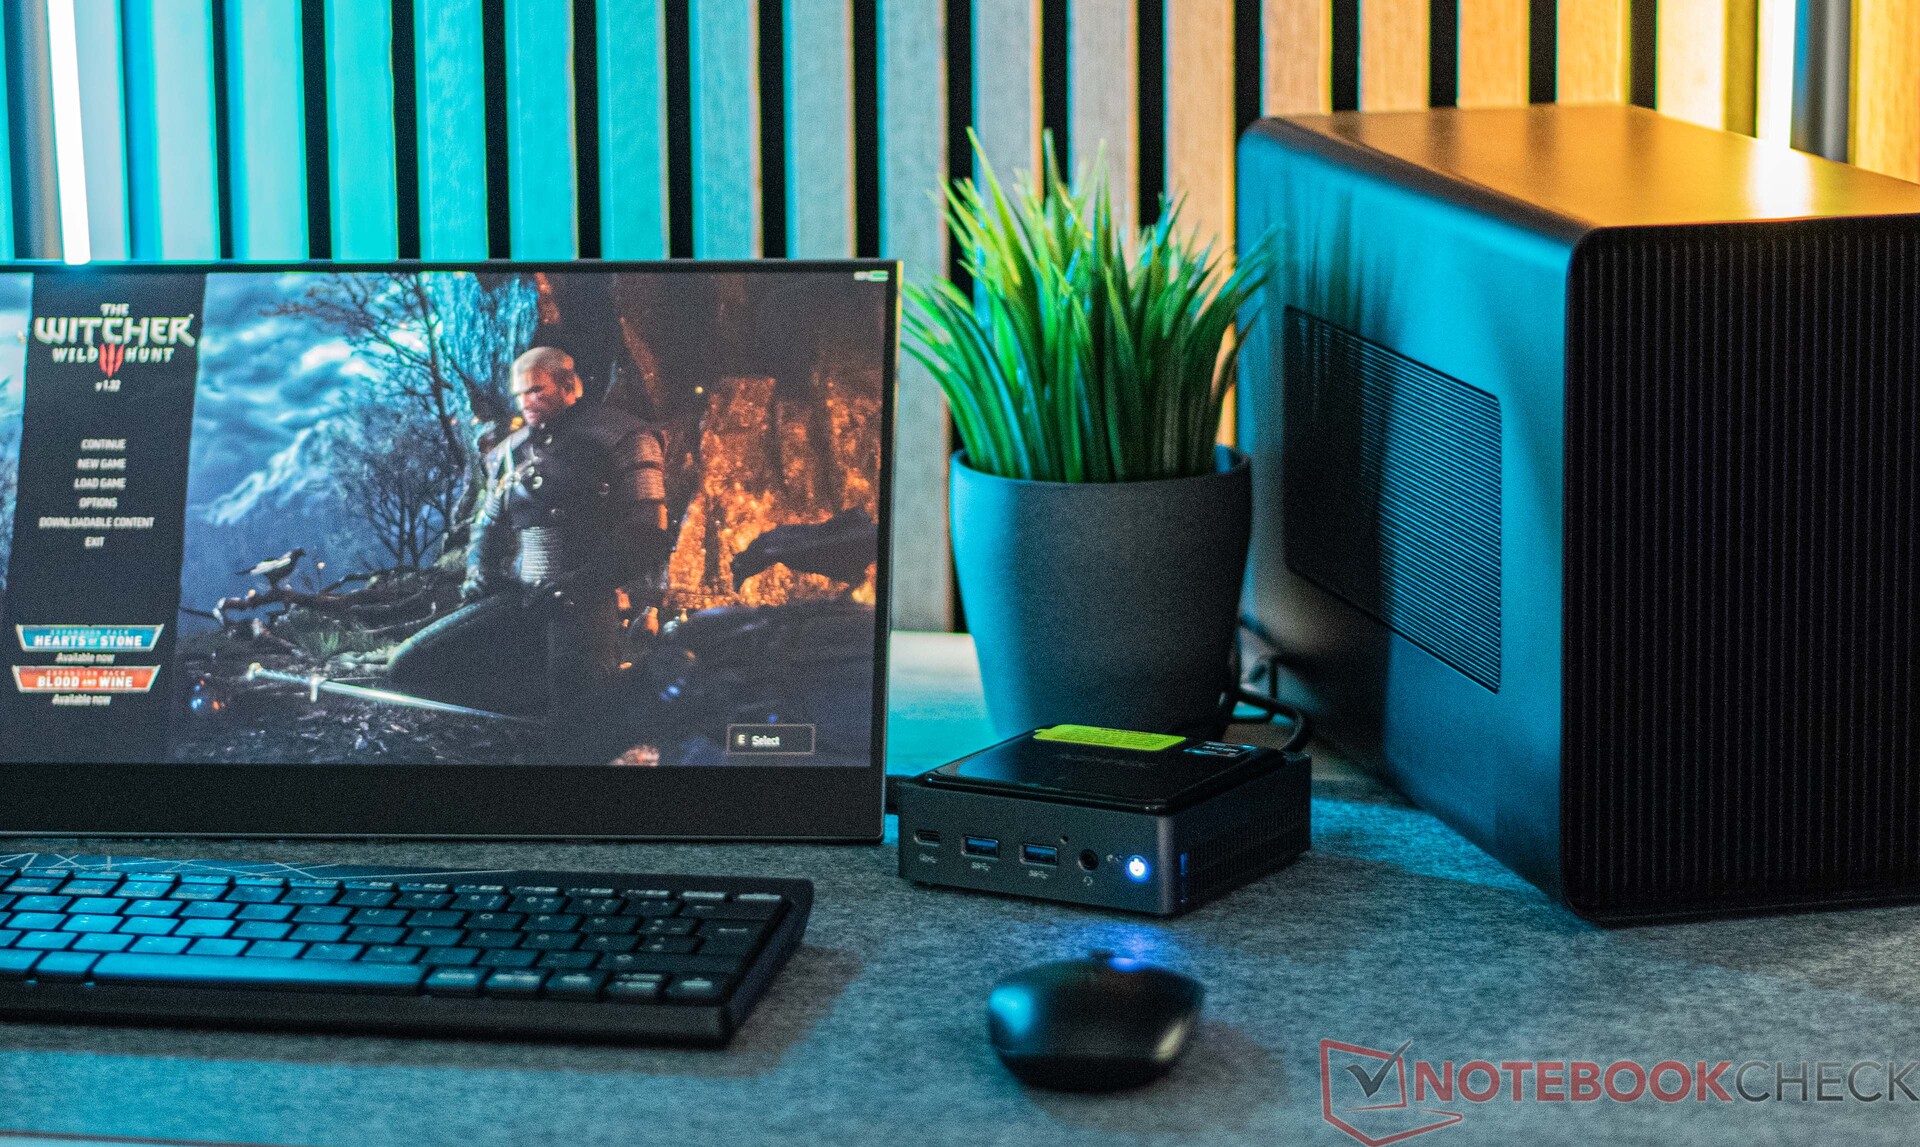
desempenho 3D por meio de um dock de eGPU com uma Nvidia GeForce RTX 3060 Ti
Como o Acemagic AM20 é equipado com uma porta Thunderbolt, demos uma olhada nele em conjunto com nosso Razer Core X e umNvidia GeForce RTX 3060 Ticom o objetivo de obter um aumento externo no desempenho de gráficos 3D. Em princípio, há um aumento notável no desempenho 3D. Entretanto, em comparação, vimos oKit Intel NUC 13 Pro teve um desempenho significativamente melhor. O Acemagic AM20 está mais próximo doMorefine M600 6600U.
De um ponto de vista subjetivo, podemos confirmar que essa combinação permitirá que você jogue muito mais jogos sem problemas. No entanto, você também deve estar ciente de algumas limitações. A placa de vídeo instalada só pode se comunicar com o sistema por meio de quatro pistas PCIe 3.0. Isso resulta em uma redução drástica da largura de banda. Isso é algo que ficou especialmente evidente nos jogos F1 22 e F1 23. Até documentamos resultados piores aqui do que em comparação com a iGPU.
| Performance rating - Percent | |
| Intel NUC 13 Pro Kit NUC13ANK (Nvidia GeForce RTX 3060 Ti FE TB3) | |
| Geekom Mini IT12 (Nvidia GeForce RTX 3060 Ti FE TB3) | |
| Minisforum Venus Series UM690 (Nvidia GeForce RTX 3060 Ti FE TB3) | |
| Minisforum Venus Series UM790 Pro (Nvidia GeForce RTX 3060 Ti FE TB3) | |
| Ace Magician AM08Pro (Nvidia GeForce RTX 3060 Ti FE TB3) | |
| Morefine M600 (Nvidia GeForce RTX 3060 Ti FE TB3) | |
| Acemagic AM20 (Nvidia GeForce RTX 3060 Ti FE) | |
| 3DMark 11 - 1280x720 Performance GPU | |
| Intel NUC 13 Pro Kit NUC13ANK (Nvidia GeForce RTX 3060 Ti FE TB3) | |
| Geekom Mini IT12 (Nvidia GeForce RTX 3060 Ti FE TB3) | |
| Minisforum Venus Series UM790 Pro (Nvidia GeForce RTX 3060 Ti FE TB3) | |
| Ace Magician AM08Pro (Nvidia GeForce RTX 3060 Ti FE TB3) | |
| Minisforum Venus Series UM690 (Nvidia GeForce RTX 3060 Ti FE TB3) | |
| Acemagic AM20 (Nvidia GeForce RTX 3060 Ti FE) | |
| Morefine M600 (Nvidia GeForce RTX 3060 Ti FE TB3) | |
| 3DMark | |
| 2560x1440 Time Spy Graphics | |
| Intel NUC 13 Pro Kit NUC13ANK (Nvidia GeForce RTX 3060 Ti FE TB3) | |
| Geekom Mini IT12 (Nvidia GeForce RTX 3060 Ti FE TB3) | |
| Morefine M600 (Nvidia GeForce RTX 3060 Ti FE TB3) | |
| Minisforum Venus Series UM790 Pro (Nvidia GeForce RTX 3060 Ti FE TB3) | |
| Ace Magician AM08Pro (Nvidia GeForce RTX 3060 Ti FE TB3) | |
| Minisforum Venus Series UM690 (Nvidia GeForce RTX 3060 Ti FE TB3) | |
| Acemagic AM20 (Nvidia GeForce RTX 3060 Ti FE) | |
| 1920x1080 Fire Strike Graphics | |
| Intel NUC 13 Pro Kit NUC13ANK (Nvidia GeForce RTX 3060 Ti FE TB3) | |
| Geekom Mini IT12 (Nvidia GeForce RTX 3060 Ti FE TB3) | |
| Morefine M600 (Nvidia GeForce RTX 3060 Ti FE TB3) | |
| Ace Magician AM08Pro (Nvidia GeForce RTX 3060 Ti FE TB3) | |
| Minisforum Venus Series UM790 Pro (Nvidia GeForce RTX 3060 Ti FE TB3) | |
| Minisforum Venus Series UM690 (Nvidia GeForce RTX 3060 Ti FE TB3) | |
| Acemagic AM20 (Nvidia GeForce RTX 3060 Ti FE) | |
| 3840x2160 Fire Strike Ultra Graphics | |
| Geekom Mini IT12 (Nvidia GeForce RTX 3060 Ti FE TB3) | |
| Intel NUC 13 Pro Kit NUC13ANK (Nvidia GeForce RTX 3060 Ti FE TB3) | |
| Morefine M600 (Nvidia GeForce RTX 3060 Ti FE TB3) | |
| Minisforum Venus Series UM790 Pro (Nvidia GeForce RTX 3060 Ti FE TB3) | |
| Ace Magician AM08Pro (Nvidia GeForce RTX 3060 Ti FE TB3) | |
| Minisforum Venus Series UM690 (Nvidia GeForce RTX 3060 Ti FE TB3) | |
| Acemagic AM20 (Nvidia GeForce RTX 3060 Ti FE) | |
| Unigine Superposition | |
| 1280x720 720p Low | |
| Minisforum Venus Series UM790 Pro (Nvidia GeForce RTX 3060 Ti FE TB3) | |
| Intel NUC 13 Pro Kit NUC13ANK (Nvidia GeForce RTX 3060 Ti FE TB3) | |
| Geekom Mini IT12 (Nvidia GeForce RTX 3060 Ti FE TB3) | |
| Minisforum Venus Series UM690 (Nvidia GeForce RTX 3060 Ti FE TB3) | |
| Ace Magician AM08Pro (Nvidia GeForce RTX 3060 Ti FE TB3) | |
| Acemagic AM20 (Nvidia GeForce RTX 3060 Ti FE) | |
| Morefine M600 (Nvidia GeForce RTX 3060 Ti FE TB3) | |
| 1920x1080 1080p High | |
| Intel NUC 13 Pro Kit NUC13ANK (Nvidia GeForce RTX 3060 Ti FE TB3) | |
| Geekom Mini IT12 (Nvidia GeForce RTX 3060 Ti FE TB3) | |
| Morefine M600 (Nvidia GeForce RTX 3060 Ti FE TB3) | |
| Acemagic AM20 (Nvidia GeForce RTX 3060 Ti FE) | |
| Minisforum Venus Series UM690 (Nvidia GeForce RTX 3060 Ti FE TB3) | |
| Ace Magician AM08Pro (Nvidia GeForce RTX 3060 Ti FE TB3) | |
| Minisforum Venus Series UM790 Pro (Nvidia GeForce RTX 3060 Ti FE TB3) | |
| 1920x1080 1080p Extreme | |
| Geekom Mini IT12 (Nvidia GeForce RTX 3060 Ti FE TB3) | |
| Intel NUC 13 Pro Kit NUC13ANK (Nvidia GeForce RTX 3060 Ti FE TB3) | |
| Minisforum Venus Series UM690 (Nvidia GeForce RTX 3060 Ti FE TB3) | |
| Morefine M600 (Nvidia GeForce RTX 3060 Ti FE TB3) | |
| Acemagic AM20 (Nvidia GeForce RTX 3060 Ti FE) | |
| Ace Magician AM08Pro (Nvidia GeForce RTX 3060 Ti FE TB3) | |
| Minisforum Venus Series UM790 Pro (Nvidia GeForce RTX 3060 Ti FE TB3) | |
| 3840x2160 4k Optimized | |
| Geekom Mini IT12 (Nvidia GeForce RTX 3060 Ti FE TB3) | |
| Intel NUC 13 Pro Kit NUC13ANK (Nvidia GeForce RTX 3060 Ti FE TB3) | |
| Minisforum Venus Series UM690 (Nvidia GeForce RTX 3060 Ti FE TB3) | |
| Morefine M600 (Nvidia GeForce RTX 3060 Ti FE TB3) | |
| Acemagic AM20 (Nvidia GeForce RTX 3060 Ti FE) | |
| Ace Magician AM08Pro (Nvidia GeForce RTX 3060 Ti FE TB3) | |
| Minisforum Venus Series UM790 Pro (Nvidia GeForce RTX 3060 Ti FE TB3) | |
| 7680x4320 8k Optimized | |
| Geekom Mini IT12 (Nvidia GeForce RTX 3060 Ti FE TB3) | |
| Intel NUC 13 Pro Kit NUC13ANK (Nvidia GeForce RTX 3060 Ti FE TB3) | |
| Acemagic AM20 (Nvidia GeForce RTX 3060 Ti FE) | |
| Minisforum Venus Series UM690 (Nvidia GeForce RTX 3060 Ti FE TB3) | |
| Morefine M600 (Nvidia GeForce RTX 3060 Ti FE TB3) | |
| Ace Magician AM08Pro (Nvidia GeForce RTX 3060 Ti FE TB3) | |
| Minisforum Venus Series UM790 Pro (Nvidia GeForce RTX 3060 Ti FE TB3) | |
| Unigine Valley 1.0 | |
| 1920x1080 Extreme HD DirectX AA:x8 | |
| Intel NUC 13 Pro Kit NUC13ANK (Nvidia GeForce RTX 3060 Ti FE TB3) | |
| Geekom Mini IT12 (Nvidia GeForce RTX 3060 Ti FE TB3) | |
| Minisforum Venus Series UM690 (Nvidia GeForce RTX 3060 Ti FE TB3) | |
| Minisforum Venus Series UM790 Pro (Nvidia GeForce RTX 3060 Ti FE TB3) | |
| Ace Magician AM08Pro (Nvidia GeForce RTX 3060 Ti FE TB3) | |
| Acemagic AM20 (Nvidia GeForce RTX 3060 Ti FE) | |
| Morefine M600 (Nvidia GeForce RTX 3060 Ti FE TB3) | |
| 1920x1080 Extreme HD Preset OpenGL AA:x8 | |
| Intel NUC 13 Pro Kit NUC13ANK (Nvidia GeForce RTX 3060 Ti FE TB3) | |
| Geekom Mini IT12 (Nvidia GeForce RTX 3060 Ti FE TB3) | |
| Minisforum Venus Series UM690 (Nvidia GeForce RTX 3060 Ti FE TB3) | |
| Ace Magician AM08Pro (Nvidia GeForce RTX 3060 Ti FE TB3) | |
| Morefine M600 (Nvidia GeForce RTX 3060 Ti FE TB3) | |
| Acemagic AM20 (Nvidia GeForce RTX 3060 Ti FE) | |
| Minisforum Venus Series UM790 Pro (Nvidia GeForce RTX 3060 Ti FE TB3) | |
| Unigine Heaven 4.0 | |
| Extreme Preset OpenGL | |
| Intel NUC 13 Pro Kit NUC13ANK (Nvidia GeForce RTX 3060 Ti FE TB3) | |
| Geekom Mini IT12 (Nvidia GeForce RTX 3060 Ti FE TB3) | |
| Minisforum Venus Series UM690 (Nvidia GeForce RTX 3060 Ti FE TB3) | |
| Morefine M600 (Nvidia GeForce RTX 3060 Ti FE TB3) | |
| Ace Magician AM08Pro (Nvidia GeForce RTX 3060 Ti FE TB3) | |
| Acemagic AM20 (Nvidia GeForce RTX 3060 Ti FE) | |
| Minisforum Venus Series UM790 Pro (Nvidia GeForce RTX 3060 Ti FE TB3) | |
| Extreme Preset DX11 | |
| Intel NUC 13 Pro Kit NUC13ANK (Nvidia GeForce RTX 3060 Ti FE TB3) | |
| Geekom Mini IT12 (Nvidia GeForce RTX 3060 Ti FE TB3) | |
| Minisforum Venus Series UM690 (Nvidia GeForce RTX 3060 Ti FE TB3) | |
| Morefine M600 (Nvidia GeForce RTX 3060 Ti FE TB3) | |
| Acemagic AM20 (Nvidia GeForce RTX 3060 Ti FE) | |
| Ace Magician AM08Pro (Nvidia GeForce RTX 3060 Ti FE TB3) | |
| Minisforum Venus Series UM790 Pro (Nvidia GeForce RTX 3060 Ti FE TB3) | |
| ComputeMark v2.1 | |
| 1024x600 Normal, Score | |
| Geekom Mini IT12 (Nvidia GeForce RTX 3060 Ti FE TB3) | |
| Minisforum Venus Series UM790 Pro (Nvidia GeForce RTX 3060 Ti FE TB3) | |
| Intel NUC 13 Pro Kit NUC13ANK (Nvidia GeForce RTX 3060 Ti FE TB3) | |
| Minisforum Venus Series UM690 (Nvidia GeForce RTX 3060 Ti FE TB3) | |
| Acemagic AM20 (Nvidia GeForce RTX 3060 Ti FE) | |
| Morefine M600 (Nvidia GeForce RTX 3060 Ti FE TB3) | |
| Ace Magician AM08Pro (Nvidia GeForce RTX 3060 Ti FE TB3) | |
| 1024x600 Normal, Fluid 3DTex | |
| Intel NUC 13 Pro Kit NUC13ANK (Nvidia GeForce RTX 3060 Ti FE TB3) | |
| Geekom Mini IT12 (Nvidia GeForce RTX 3060 Ti FE TB3) | |
| Minisforum Venus Series UM790 Pro (Nvidia GeForce RTX 3060 Ti FE TB3) | |
| Acemagic AM20 (Nvidia GeForce RTX 3060 Ti FE) | |
| Minisforum Venus Series UM690 (Nvidia GeForce RTX 3060 Ti FE TB3) | |
| Morefine M600 (Nvidia GeForce RTX 3060 Ti FE TB3) | |
| Ace Magician AM08Pro (Nvidia GeForce RTX 3060 Ti FE TB3) | |
| 1024x600 Normal, Fluid 2DTexArr | |
| Geekom Mini IT12 (Nvidia GeForce RTX 3060 Ti FE TB3) | |
| Minisforum Venus Series UM690 (Nvidia GeForce RTX 3060 Ti FE TB3) | |
| Intel NUC 13 Pro Kit NUC13ANK (Nvidia GeForce RTX 3060 Ti FE TB3) | |
| Minisforum Venus Series UM790 Pro (Nvidia GeForce RTX 3060 Ti FE TB3) | |
| Acemagic AM20 (Nvidia GeForce RTX 3060 Ti FE) | |
| Morefine M600 (Nvidia GeForce RTX 3060 Ti FE TB3) | |
| Ace Magician AM08Pro (Nvidia GeForce RTX 3060 Ti FE TB3) | |
| 1024x600 Normal, Mandel Vector | |
| Geekom Mini IT12 (Nvidia GeForce RTX 3060 Ti FE TB3) | |
| Minisforum Venus Series UM790 Pro (Nvidia GeForce RTX 3060 Ti FE TB3) | |
| Intel NUC 13 Pro Kit NUC13ANK (Nvidia GeForce RTX 3060 Ti FE TB3) | |
| Acemagic AM20 (Nvidia GeForce RTX 3060 Ti FE) | |
| Minisforum Venus Series UM690 (Nvidia GeForce RTX 3060 Ti FE TB3) | |
| Ace Magician AM08Pro (Nvidia GeForce RTX 3060 Ti FE TB3) | |
| Morefine M600 (Nvidia GeForce RTX 3060 Ti FE TB3) | |
| 1024x600 Normal, Mandel Scalar | |
| Geekom Mini IT12 (Nvidia GeForce RTX 3060 Ti FE TB3) | |
| Minisforum Venus Series UM790 Pro (Nvidia GeForce RTX 3060 Ti FE TB3) | |
| Intel NUC 13 Pro Kit NUC13ANK (Nvidia GeForce RTX 3060 Ti FE TB3) | |
| Minisforum Venus Series UM690 (Nvidia GeForce RTX 3060 Ti FE TB3) | |
| Acemagic AM20 (Nvidia GeForce RTX 3060 Ti FE) | |
| Morefine M600 (Nvidia GeForce RTX 3060 Ti FE TB3) | |
| Ace Magician AM08Pro (Nvidia GeForce RTX 3060 Ti FE TB3) | |
| 1024x600 Normal, QJuliaRayTrace | |
| Geekom Mini IT12 (Nvidia GeForce RTX 3060 Ti FE TB3) | |
| Intel NUC 13 Pro Kit NUC13ANK (Nvidia GeForce RTX 3060 Ti FE TB3) | |
| Minisforum Venus Series UM790 Pro (Nvidia GeForce RTX 3060 Ti FE TB3) | |
| Minisforum Venus Series UM690 (Nvidia GeForce RTX 3060 Ti FE TB3) | |
| Acemagic AM20 (Nvidia GeForce RTX 3060 Ti FE) | |
| Morefine M600 (Nvidia GeForce RTX 3060 Ti FE TB3) | |
| Ace Magician AM08Pro (Nvidia GeForce RTX 3060 Ti FE TB3) | |
| Performance rating - Percent | |
| Intel NUC 13 Pro Kit NUC13ANK (Nvidia GeForce RTX 3060 Ti FE TB3) | |
| Geekom Mini IT12 (Nvidia GeForce RTX 3060 Ti FE TB3) | |
| Geekom AS 6 (Nvidia GeForce RTX 3060 Ti FE TB3) | |
| Minisforum Venus Series UM790 Pro (Nvidia GeForce RTX 3060 Ti FE TB3) | |
| Ace Magician AM08Pro (Nvidia GeForce RTX 3060 Ti FE TB3) | |
| Minisforum Venus Series UM690 (Nvidia GeForce RTX 3060 Ti FE TB3) | |
| Morefine M600 (Nvidia GeForce RTX 3060 Ti FE TB3) | |
| Acemagic AM20 (Nvidia GeForce RTX 3060 Ti FE) | |
| GTA V - 1920x1080 Highest AA:4xMSAA + FX AF:16x | |
| Intel NUC 13 Pro Kit NUC13ANK (Nvidia GeForce RTX 3060 Ti FE TB3) | |
| Geekom Mini IT12 (Nvidia GeForce RTX 3060 Ti FE TB3) | |
| Geekom AS 6 (Nvidia GeForce RTX 3060 Ti FE TB3) | |
| Ace Magician AM08Pro (Nvidia GeForce RTX 3060 Ti FE TB3) | |
| Minisforum Venus Series UM690 (Nvidia GeForce RTX 3060 Ti FE TB3) | |
| Minisforum Venus Series UM790 Pro (Nvidia GeForce RTX 3060 Ti FE TB3) | |
| Morefine M600 (Nvidia GeForce RTX 3060 Ti FE TB3) | |
| Acemagic AM20 (Nvidia GeForce RTX 3060 Ti FE) | |
| The Witcher 3 - 1920x1080 Ultra Graphics & Postprocessing (HBAO+) | |
| Intel NUC 13 Pro Kit NUC13ANK (Nvidia GeForce RTX 3060 Ti FE TB3) | |
| Geekom Mini IT12 (Nvidia GeForce RTX 3060 Ti FE TB3) | |
| Geekom AS 6 (Nvidia GeForce RTX 3060 Ti FE TB3) | |
| Minisforum Venus Series UM790 Pro (Nvidia GeForce RTX 3060 Ti FE TB3) | |
| Minisforum Venus Series UM690 (Nvidia GeForce RTX 3060 Ti FE TB3) | |
| Morefine M600 (Nvidia GeForce RTX 3060 Ti FE TB3) | |
| Ace Magician AM08Pro (Nvidia GeForce RTX 3060 Ti FE TB3) | |
| Acemagic AM20 (Nvidia GeForce RTX 3060 Ti FE) | |
| Dota 2 Reborn - 1920x1080 ultra (3/3) best looking | |
| Minisforum Venus Series UM790 Pro (Nvidia GeForce RTX 3060 Ti FE TB3) | |
| Intel NUC 13 Pro Kit NUC13ANK (Nvidia GeForce RTX 3060 Ti FE TB3) | |
| Geekom Mini IT12 (Nvidia GeForce RTX 3060 Ti FE TB3) | |
| Geekom AS 6 (Nvidia GeForce RTX 3060 Ti FE TB3) | |
| Ace Magician AM08Pro (Nvidia GeForce RTX 3060 Ti FE TB3) | |
| Minisforum Venus Series UM690 (Nvidia GeForce RTX 3060 Ti FE TB3) | |
| Acemagic AM20 (Nvidia GeForce RTX 3060 Ti FE) | |
| Morefine M600 (Nvidia GeForce RTX 3060 Ti FE TB3) | |
| Final Fantasy XV Benchmark - 1920x1080 High Quality | |
| Geekom AS 6 (Nvidia GeForce RTX 3060 Ti FE TB3) | |
| Intel NUC 13 Pro Kit NUC13ANK (Nvidia GeForce RTX 3060 Ti FE TB3) | |
| Geekom Mini IT12 (Nvidia GeForce RTX 3060 Ti FE TB3) | |
| Minisforum Venus Series UM790 Pro (Nvidia GeForce RTX 3060 Ti FE TB3) | |
| Ace Magician AM08Pro (Nvidia GeForce RTX 3060 Ti FE TB3) | |
| Acemagic AM20 (Nvidia GeForce RTX 3060 Ti FE) | |
| Minisforum Venus Series UM690 (Nvidia GeForce RTX 3060 Ti FE TB3) | |
| Morefine M600 (Nvidia GeForce RTX 3060 Ti FE TB3) | |
| Strange Brigade - 1920x1080 ultra AA:ultra AF:16 | |
| Geekom AS 6 (Nvidia GeForce RTX 3060 Ti FE TB3) | |
| Intel NUC 13 Pro Kit NUC13ANK (Nvidia GeForce RTX 3060 Ti FE TB3) | |
| Geekom Mini IT12 (Nvidia GeForce RTX 3060 Ti FE TB3) | |
| Minisforum Venus Series UM790 Pro (Nvidia GeForce RTX 3060 Ti FE TB3) | |
| Ace Magician AM08Pro (Nvidia GeForce RTX 3060 Ti FE TB3) | |
| Morefine M600 (Nvidia GeForce RTX 3060 Ti FE TB3) | |
| Minisforum Venus Series UM690 (Nvidia GeForce RTX 3060 Ti FE TB3) | |
| Acemagic AM20 (Nvidia GeForce RTX 3060 Ti FE) | |
| Far Cry 5 - 1920x1080 Ultra Preset AA:T | |
| Intel NUC 13 Pro Kit NUC13ANK (Nvidia GeForce RTX 3060 Ti FE TB3) | |
| Minisforum Venus Series UM790 Pro (Nvidia GeForce RTX 3060 Ti FE TB3) | |
| Geekom Mini IT12 (Nvidia GeForce RTX 3060 Ti FE TB3) | |
| Ace Magician AM08Pro (Nvidia GeForce RTX 3060 Ti FE TB3) | |
| Geekom AS 6 (Nvidia GeForce RTX 3060 Ti FE TB3) | |
| Minisforum Venus Series UM690 (Nvidia GeForce RTX 3060 Ti FE TB3) | |
| Acemagic AM20 (Nvidia GeForce RTX 3060 Ti FE) | |
| Morefine M600 (Nvidia GeForce RTX 3060 Ti FE TB3) | |
| Far Cry New Dawn - 1920x1080 Ultra Preset | |
| Intel NUC 13 Pro Kit NUC13ANK (Nvidia GeForce RTX 3060 Ti FE TB3) | |
| Minisforum Venus Series UM790 Pro (Nvidia GeForce RTX 3060 Ti FE TB3) | |
| Geekom Mini IT12 (Nvidia GeForce RTX 3060 Ti FE TB3) | |
| Ace Magician AM08Pro (Nvidia GeForce RTX 3060 Ti FE TB3) | |
| Geekom AS 6 (Nvidia GeForce RTX 3060 Ti FE TB3) | |
| Minisforum Venus Series UM690 (Nvidia GeForce RTX 3060 Ti FE TB3) | |
| Acemagic AM20 (Nvidia GeForce RTX 3060 Ti FE) | |
| Morefine M600 (Nvidia GeForce RTX 3060 Ti FE TB3) | |
| Borderlands 3 - 1920x1080 Badass Overall Quality (DX11) | |
| Geekom Mini IT12 (Nvidia GeForce RTX 3060 Ti FE TB3) | |
| Intel NUC 13 Pro Kit NUC13ANK (Nvidia GeForce RTX 3060 Ti FE TB3) | |
| Geekom AS 6 (Nvidia GeForce RTX 3060 Ti FE TB3) | |
| Minisforum Venus Series UM790 Pro (Nvidia GeForce RTX 3060 Ti FE TB3) | |
| Ace Magician AM08Pro (Nvidia GeForce RTX 3060 Ti FE TB3) | |
| Minisforum Venus Series UM690 (Nvidia GeForce RTX 3060 Ti FE TB3) | |
| Acemagic AM20 (Nvidia GeForce RTX 3060 Ti FE) | |
| Morefine M600 (Nvidia GeForce RTX 3060 Ti FE TB3) | |
| F1 22 - 1920x1080 Ultra High Preset AA:T AF:16x | |
| Geekom AS 6 (Nvidia GeForce RTX 3060 Ti FE TB3) | |
| Intel NUC 13 Pro Kit NUC13ANK (Nvidia GeForce RTX 3060 Ti FE TB3) | |
| Geekom Mini IT12 (Nvidia GeForce RTX 3060 Ti FE TB3) | |
| Minisforum Venus Series UM790 Pro (Nvidia GeForce RTX 3060 Ti FE TB3) | |
| Ace Magician AM08Pro (Nvidia GeForce RTX 3060 Ti FE TB3) | |
| Minisforum Venus Series UM690 (Nvidia GeForce RTX 3060 Ti FE TB3) | |
| Morefine M600 (Nvidia GeForce RTX 3060 Ti FE TB3) | |
| Acemagic AM20 (Nvidia GeForce RTX 3060 Ti FE) | |
| Tiny Tina's Wonderlands - 1920x1080 Badass Preset (DX12) | |
| Geekom AS 6 (Nvidia GeForce RTX 3060 Ti FE TB3) | |
| Geekom Mini IT12 (Nvidia GeForce RTX 3060 Ti FE TB3) | |
| Intel NUC 13 Pro Kit NUC13ANK (Nvidia GeForce RTX 3060 Ti FE TB3) | |
| Minisforum Venus Series UM790 Pro (Nvidia GeForce RTX 3060 Ti FE TB3) | |
| Morefine M600 (Nvidia GeForce RTX 3060 Ti FE TB3) | |
| Ace Magician AM08Pro (Nvidia GeForce RTX 3060 Ti FE TB3) | |
| Acemagic AM20 (Nvidia GeForce RTX 3060 Ti FE) | |
| Minisforum Venus Series UM690 (Nvidia GeForce RTX 3060 Ti FE TB3) | |
| baixo | média | alto | ultra | QHD | 4K DLSS | 4K | |
|---|---|---|---|---|---|---|---|
| GTA V (2015) | 161.5 | 148.2 | 88 | 59.7 | 41.8 | 32.3 | |
| The Witcher 3 (2015) | 209 | 167.7 | 107.1 | 56.2 | 49.8 | 60.8 | |
| Dota 2 Reborn (2015) | 126.9 | 114.3 | 111.9 | 106.4 | 94.7 | ||
| Final Fantasy XV Benchmark (2018) | 172.5 | 129.9 | 91.8 | 74.2 | 47.1 | ||
| X-Plane 11.11 (2018) | 102.3 | 88.2 | 71.4 | 62.8 | |||
| Far Cry 5 (2018) | 120 | 107 | 103 | 96 | 88 | 56 | |
| Strange Brigade (2018) | 167.8 | 129.7 | 128.1 | 125.2 | 115.8 | 80.4 | |
| Shadow of the Tomb Raider (2018) | 113.8 | 90.9 | 89.4 | 86.2 | 78.8 | 52 | |
| Far Cry New Dawn (2019) | 103 | 92 | 87 | 78 | 74 | 56 | |
| Metro Exodus (2019) | 112.9 | 77 | 58.6 | 44.1 | 39.3 | 30.2 | |
| Borderlands 3 (2019) | 106.2 | 94.1 | 84.1 | 74.5 | 60.8 | 37.2 | |
| F1 2020 (2020) | 170.5 | 95 | 96.7 | 81 | 72.4 | 52.3 | |
| F1 2021 (2021) | 112.7 | 85.4 | 55.6 | 42.4 | 38.9 | 33.2 | |
| Far Cry 6 (2021) | 61.8 | 53 | 43.8 | 37.4 | 37 | ||
| God of War (2022) | 99.4 | 89.1 | 73.7 | 56.7 | 50.8 | 37.9 | |
| GRID Legends (2022) | 100.1 | 82.4 | 67.7 | 57.8 | 52 | 43 | |
| Tiny Tina's Wonderlands (2022) | 153 | 124.7 | 90.8 | 74.4 | 57.7 | 34.7 | |
| F1 22 (2022) | 47.9 | 43.9 | 34.2 | 22.4 | 21.5 | 17.5 | |
| F1 23 (2023) | 52.9 | 51.9 | 43 | 27.5 | 26.1 | 26.2 | 14.1 |
Emissões - Bom desempenho, mas ainda econômico
Emissões de ruído
Em comparação com a concorrência, o Acemagic AM20 não ganha pontos em termos de ruído operacional silencioso. O mini PC só funciona silenciosamente quando está ocioso e com pouca carga. Sob carga média, já conseguimos atingir 44,7 dB(A). No teste de estresse, medimos 45,4 dB(A), o máximo com o qual o pequeno computador companheiro é claramente audível. O Blackview MP200mostra que é possível fazer ainda mais barulho.
Barulho
| Ocioso |
| 26.1 / 26.1 / 26.4 dB |
| Carga |
| 44.7 / 45.4 dB |
 | ||
30 dB silencioso 40 dB(A) audível 50 dB(A) ruidosamente alto |
||
min: | ||
| Acemagic AM20 R7 7735H, Radeon 680M | Minisforum Venus Series UM790 Pro R9 7940HS, Radeon 780M | Minisforum Neptune Series NAD9 i9-12900H, Iris Xe G7 96EUs | Morefine M600, 6600U R5 6600U, Radeon 660M | Geekom AS 6, R9 6900HX R9 6900HX, Radeon 680M | Geekom Mini IT12 i7-1260P, Iris Xe G7 96EUs | Minisforum Venus Series UM560 XT R5 5600H, Vega 7 | Blackview MP200 i5-11400H, UHD Graphics Xe 16EUs | |
|---|---|---|---|---|---|---|---|---|
| Noise | -1% | -1% | 2% | -12% | -1% | -2% | -1% | |
| desligado / ambiente * (dB) | 25.2 | 29.7 -18% | 30.2 -20% | 29.4 -17% | 30 -19% | 29.8 -18% | 30 -19% | 25.1 -0% |
| Idle Minimum * (dB) | 26.1 | 31.7 -21% | 30.5 -17% | 29.4 -13% | 33.2 -27% | 29.9 -15% | 30.3 -16% | 25.3 3% |
| Idle Average * (dB) | 26.1 | 31.7 -21% | 30.5 -17% | 29.4 -13% | 33.6 -29% | 30.1 -15% | 30.5 -17% | 25.3 3% |
| Idle Maximum * (dB) | 26.4 | 31.7 -20% | 30.5 -16% | 29.5 -12% | 33.6 -27% | 30.2 -14% | 30.6 -16% | 25.3 4% |
| Load Average * (dB) | 44.7 | 32.8 27% | 30.5 32% | 29.6 34% | 36.8 18% | 32.1 28% | 32.5 27% | 46 -3% |
| Witcher 3 ultra * (dB) | 43.3 | 32.8 24% | ||||||
| Load Maximum * (dB) | 45.4 | 35.2 22% | 30.5 33% | 29.6 35% | 39.8 12% | 32.5 28% | 33.2 27% | 51.8 -14% |
* ... menor é melhor
Temperatura
As temperaturas do gabinete Acemagic AM20 não são motivo de críticas. No entanto, a tampa do gabinete fica mais quente do que as outras partes do gabinete e isso provavelmente se deve à dissipação de calor do SSD. Quem equipar o AM20 com três unidades de armazenamento em massa, sem dúvida, atingirá valores ainda mais altos. No teste de estresse com o Prime95, oAMD Ryzen 7 7735H atingiu um máximo de 87 °C. Isso ainda pode ser considerado relativamente insignificante, embora tenhamos observado que o consumo de energia do SoC não excedeu 35 watts. Há um limite claramente definido aqui que também se aplica ao multi-loop do Cinebench R15. Entretanto, o limite de desempenho pode ser mantido e, mesmo depois de meia hora de carga contínua, o processador funciona com 28 watts.
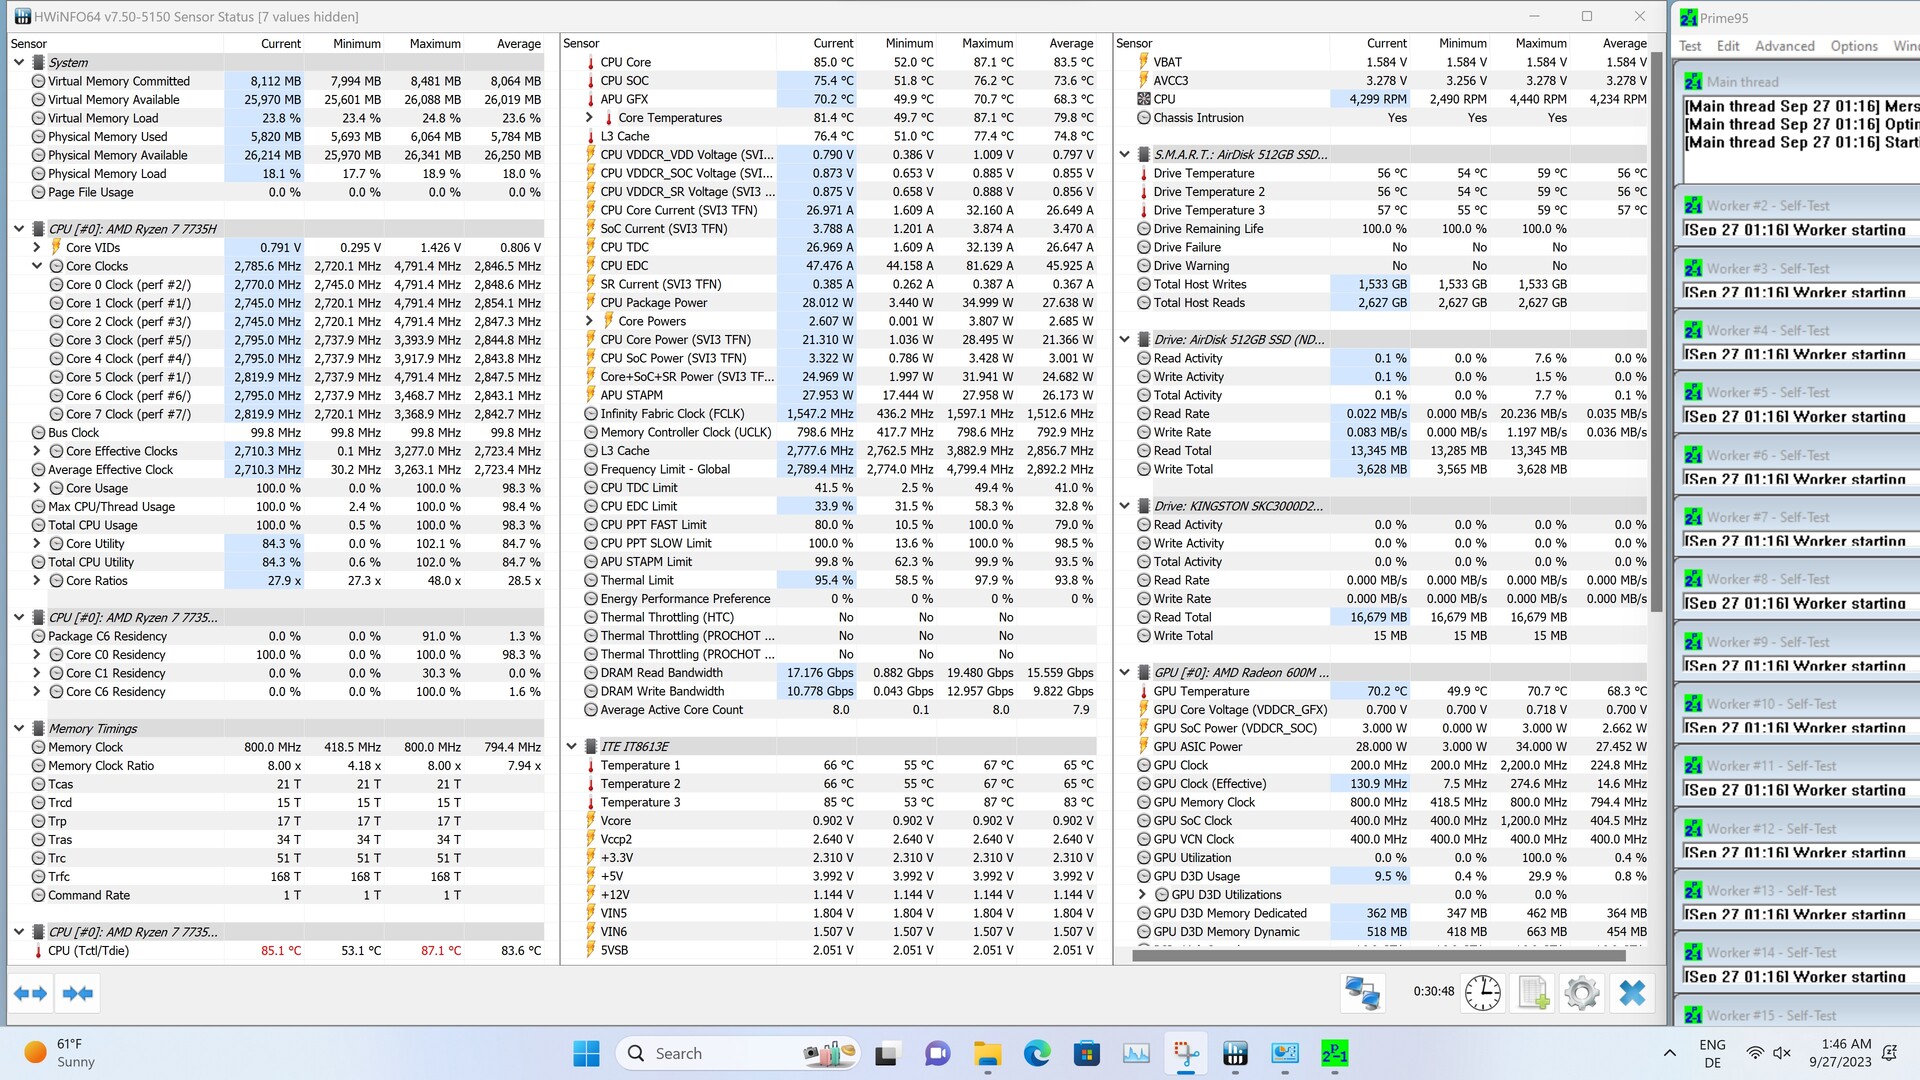
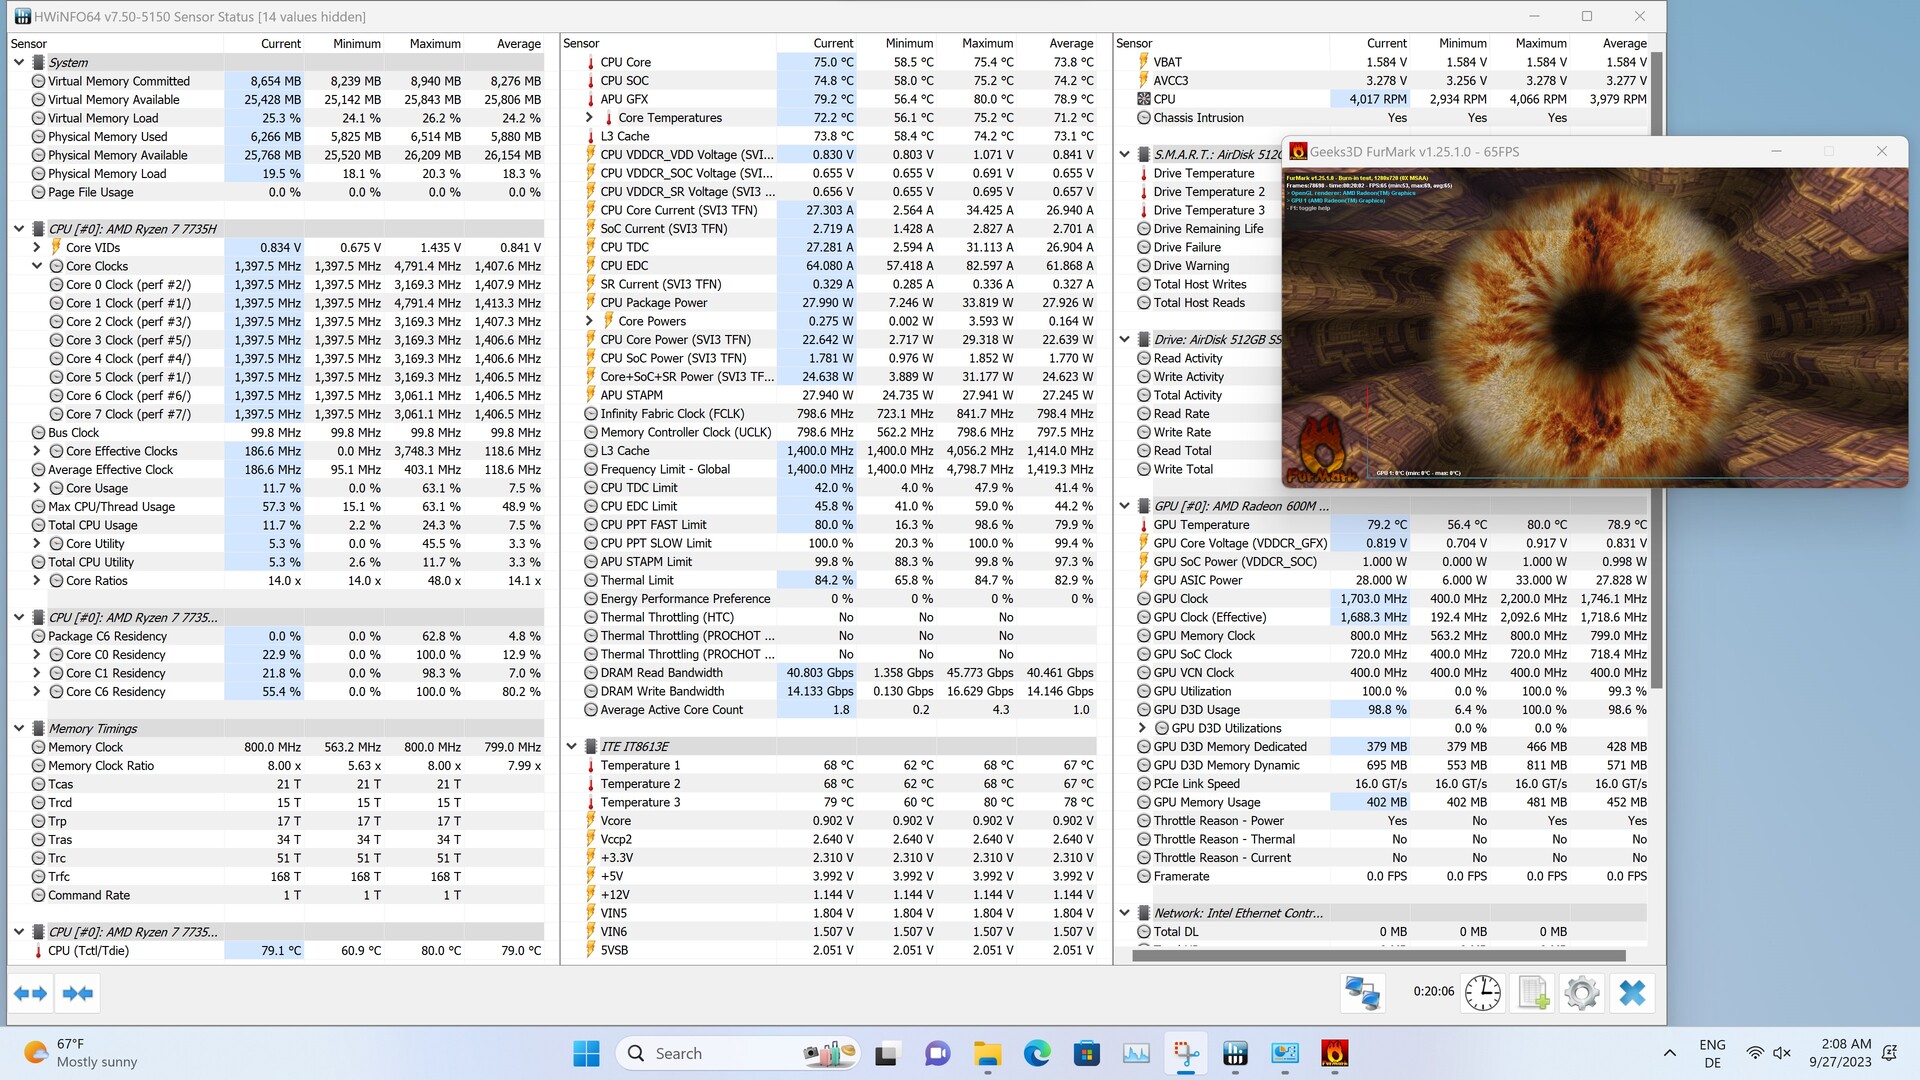
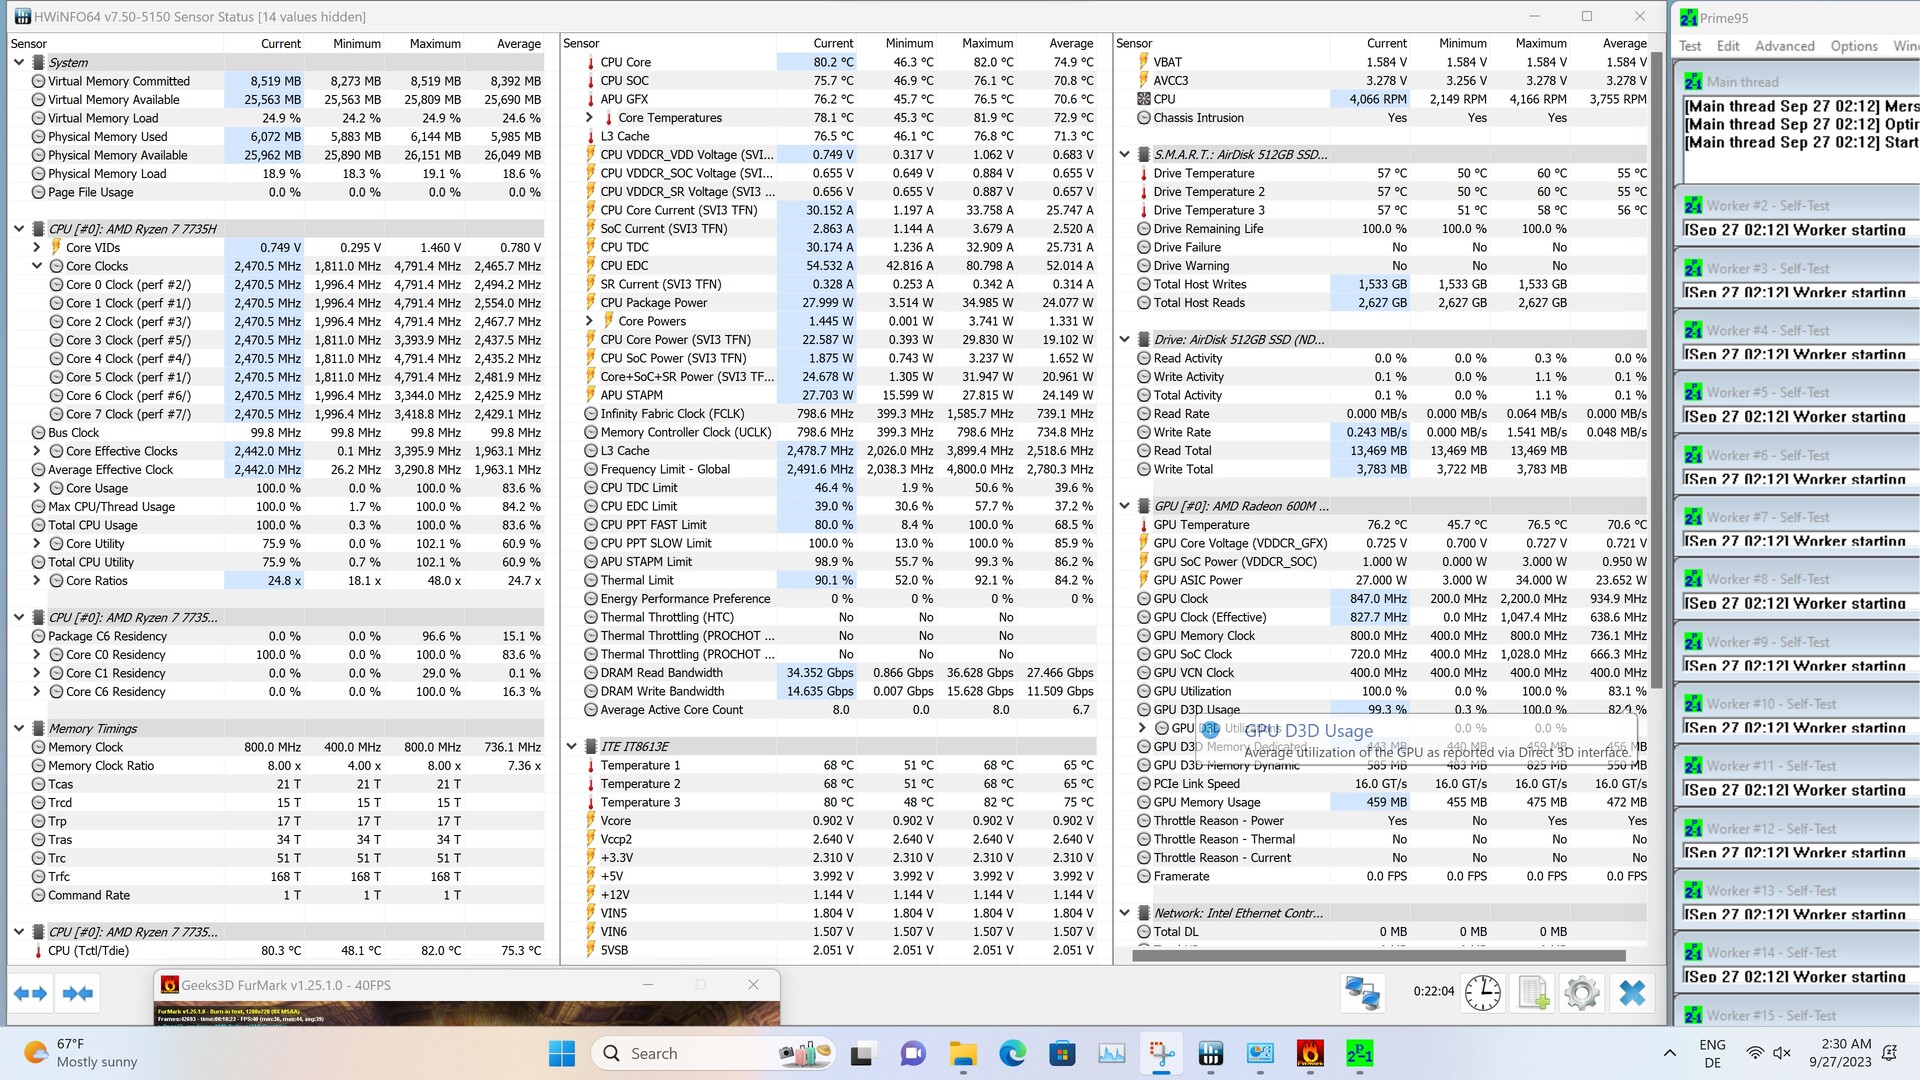
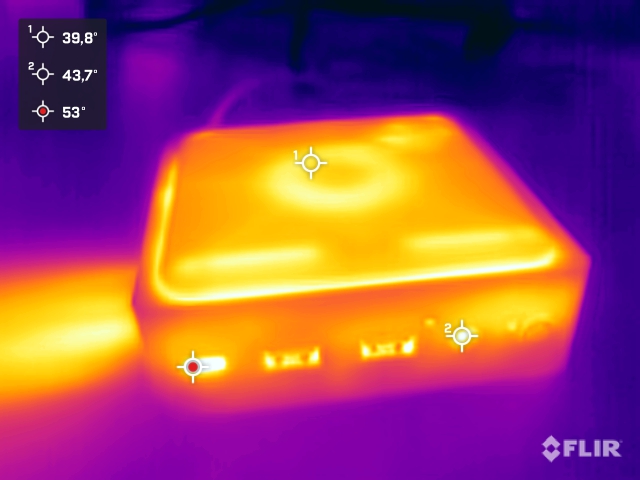
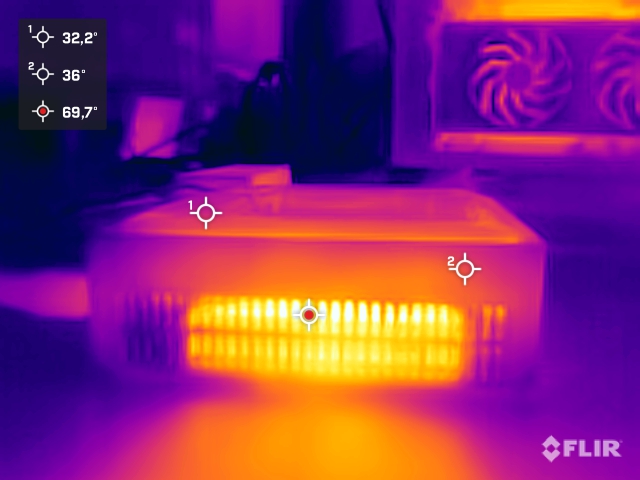
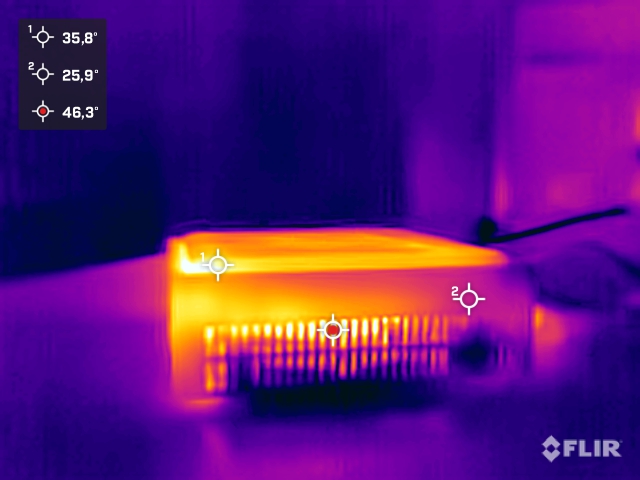
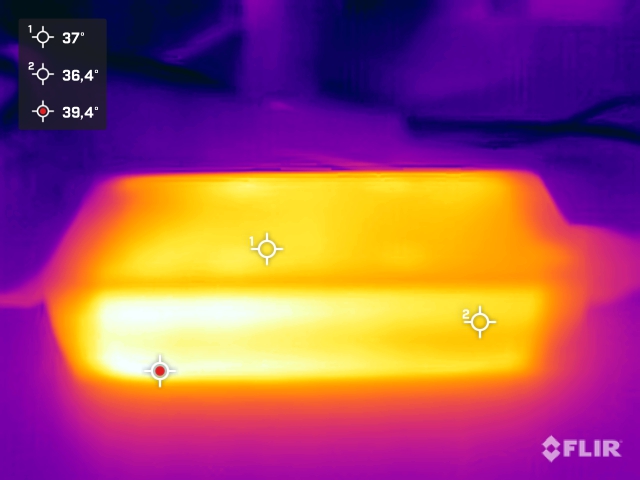
(±) A temperatura máxima no lado superior é 41.6 °C / 107 F, em comparação com a média de 35.4 °C / 96 F , variando de 20.6 a 69.5 °C para a classe Mini PC.
(+) A parte inferior aquece até um máximo de 38 °C / 100 F, em comparação com a média de 36.1 °C / 97 F
(+) Em uso inativo, a temperatura média para o lado superior é 31.7 °C / 89 F, em comparação com a média do dispositivo de 32.1 °C / ### class_avg_f### F.
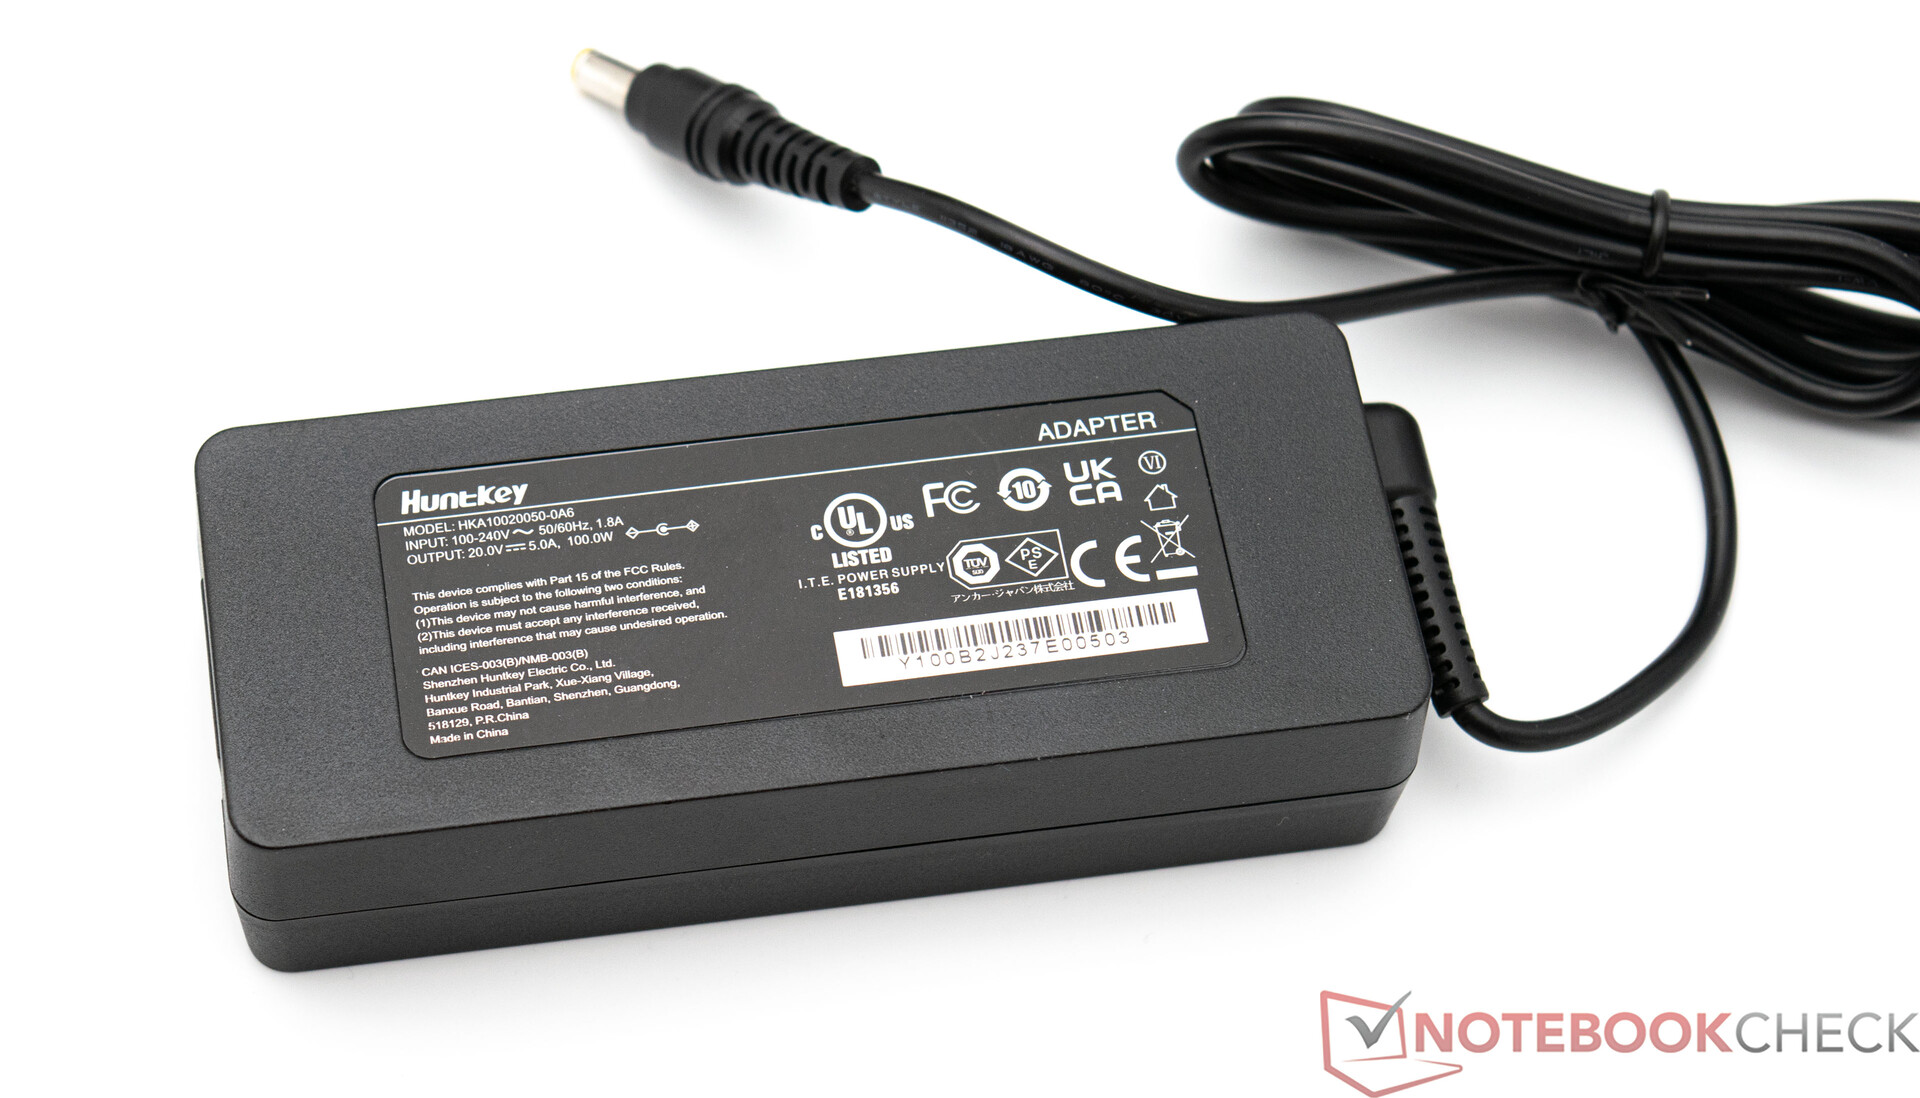
Consumo de energia
O Acemagic AM20 é um modelo extremamente econômico quando se leva em conta sua potência. OAMD Ryzen 7 7735H é certamente capaz de fazer mais se não fosse pelas limitações de resfriamento. Isso significa que o fabricante tem apenas o limite rígido de desempenho de 35 watts, ao qual o SoC adere estritamente. Basicamente, tudo isso não é um problema porque, sob carga total, com quase 65 watts, nosso exemplar de análise é o dispositivo mais econômico em comparação com seus pares - e por alguma margem. Isso faz com que a PSU pareça um pouco superdimensionada, já que pode fornecer um máximo de 100 watts. No entanto, não devemos nos esquecer de que uma estação de carregamento está integrada à caixa. Ela pode, entre outras coisas, carregar smartphones com até 10 watts. Além disso, é possível instalar unidades de armazenamento em massa adicionais que também precisam ser alimentadas com energia. Por esse motivo, agradecemos a decisão de incluir uma PSU de 100 watts.
| desligado | |
| Ocioso | |
| Carga |
|
Key:
min: | |
| Acemagic AM20 R7 7735H, Radeon 680M | Minisforum Venus Series UM790 Pro R9 7940HS, Radeon 780M | Minisforum Neptune Series NAD9 i9-12900H, Iris Xe G7 96EUs | Morefine M600, 6600U R5 6600U, Radeon 660M | Geekom AS 6, R9 6900HX R9 6900HX, Radeon 680M | Geekom Mini IT12 i7-1260P, Iris Xe G7 96EUs | Minisforum Venus Series UM560 XT R5 5600H, Vega 7 | Blackview MP200 i5-11400H, UHD Graphics Xe 16EUs | Média AMD Radeon 680M | Média da turma Mini PC | |
|---|---|---|---|---|---|---|---|---|---|---|
| Power Consumption | -2% | -53% | -1% | -9% | 8% | 16% | -24% | 2% | -29% | |
| Idle Minimum * (Watt) | 8.7 | 4.6 47% | 12.1 -39% | 8 8% | 6.8 22% | 5 43% | 6.6 24% | 9 -3% | 6.93 ? 20% | 8.67 ? -0% |
| Idle Average * (Watt) | 9.5 | 6 37% | 13 -37% | 8.7 8% | 9.4 1% | 7 26% | 6.8 28% | 10.6 -12% | 8.98 ? 5% | 10.8 ? -14% |
| Idle Maximum * (Watt) | 10.3 | 10.6 -3% | 18.2 -77% | 8.8 15% | 13.7 -33% | 10.7 -4% | 7.2 30% | 19.9 -93% | 10.5 ? -2% | 13.6 ? -32% |
| Load Average * (Watt) | 50.8 | 72.5 -43% | 70.6 -39% | 54.6 -7% | 45.3 11% | 50.3 1% | 45.1 11% | 30.9 39% | 53.5 ? -5% | 64.8 ? -28% |
| Load Maximum * (Watt) | 64.9 | 94.6 -46% | 113 -74% | 83.2 -28% | 94.8 -46% | 82 -26% | 73.4 -13% | 97.8 -51% | 70.5 ? -9% | 112.3 ? -73% |
| Cyberpunk 2077 ultra external monitor * (Watt) | 95.7 | |||||||||
| Witcher 3 ultra * (Watt) | 44.8 |
* ... menor é melhor
Power consumption with an external monitor
Pro
Contra
Veredicto - Um mini PC com uma estação de carregamento

O Acemagic AM20 adotou uma boa abordagem para se destacar na multidão de mini PCs. Atualmente, a Acemagic é um dos poucos fabricantes que oferecem a opção de carregar um smartphone sem fio colocando-o em cima do dispositivo. Portanto, combinado com seu tamanho, o AM20 tem até mesmo um ponto de venda exclusivo. Como limitação, no entanto, você terá que se contentar com o baixo desempenho de carregamento de apenas 10 watts.
A qualidade de construção é impecável, embora o uso de metal tenha sido amplamente evitado. Em termos de desempenho, você tem um SoC sólido na forma do AMD Ryzen 7 7735H. Embora o SoC faça parte da série 7000, não estamos lidando com um SoC com núcleos computacionais Zen 4, mas sim com um processador baseado no Zen 3. Mesmo assim, o AMD Ryzen 7 7735H oferece um desempenho sólido. A grande vantagem desse SoC da AMD pode ser vista na área de desempenho 3D. A AMD Radeon 680M é claramente superior à Intel, possibilitando até mesmo pequenas sessões de jogos com o Acemagic AM20.
O Acemagic AM20 é um minicomputador potente e econômico e, com seus 8 núcleos e 16 threads, as tarefas multi-threading também não são problema.
Vale a pena destacar a boa seleção de interface com duas portas de rede, bem como a porta Thunderbolt. Isso permite que o dispositivo seja expandido de forma sensata, pois até mesmo placas gráficas externas podem ser usadas. No que diz respeito à escolha do módulo WiF, teríamos preferido um mais moderno. Os níveis de ruído do dispositivo sob carga acabam sendo uma desvantagem. Devido ao seu formato pequeno, o Acemagic não tem muito espaço para outros componentes, portanto, foi necessário fazer um compromisso nessa área.
Preço e disponibilidade
O Der Acemagic AM20 pode ser encomendado diretamente na loja on-line do fabricante com um preço de 569 dólares americanos. No entanto, essa oferta só se aplica aos EUA e ao Reino Unido. Atualmente, a empresa não tem planos de cobrir a região de língua alemã.
Acemagic AM20
- 02/27/2024 v7 (old)
Sebastian Bade
Transparência
A seleção dos dispositivos a serem analisados é feita pela nossa equipe editorial. A amostra de teste foi fornecida gratuitamente ao autor pelo fabricante para fins de revisão. Não houve influência de terceiros nesta revisão, nem o fabricante recebeu uma cópia desta revisão antes da publicação. Não houve obrigação de publicar esta revisão. Como empresa de mídia independente, a Notebookcheck não está sujeita à autoridade de fabricantes, varejistas ou editores.
É assim que o Notebookcheck está testando
Todos os anos, o Notebookcheck analisa de forma independente centenas de laptops e smartphones usando procedimentos padronizados para garantir que todos os resultados sejam comparáveis. Desenvolvemos continuamente nossos métodos de teste há cerca de 20 anos e definimos padrões da indústria no processo. Em nossos laboratórios de teste, equipamentos de medição de alta qualidade são utilizados por técnicos e editores experientes. Esses testes envolvem um processo de validação em vários estágios. Nosso complexo sistema de classificação é baseado em centenas de medições e benchmarks bem fundamentados, o que mantém a objetividade.
