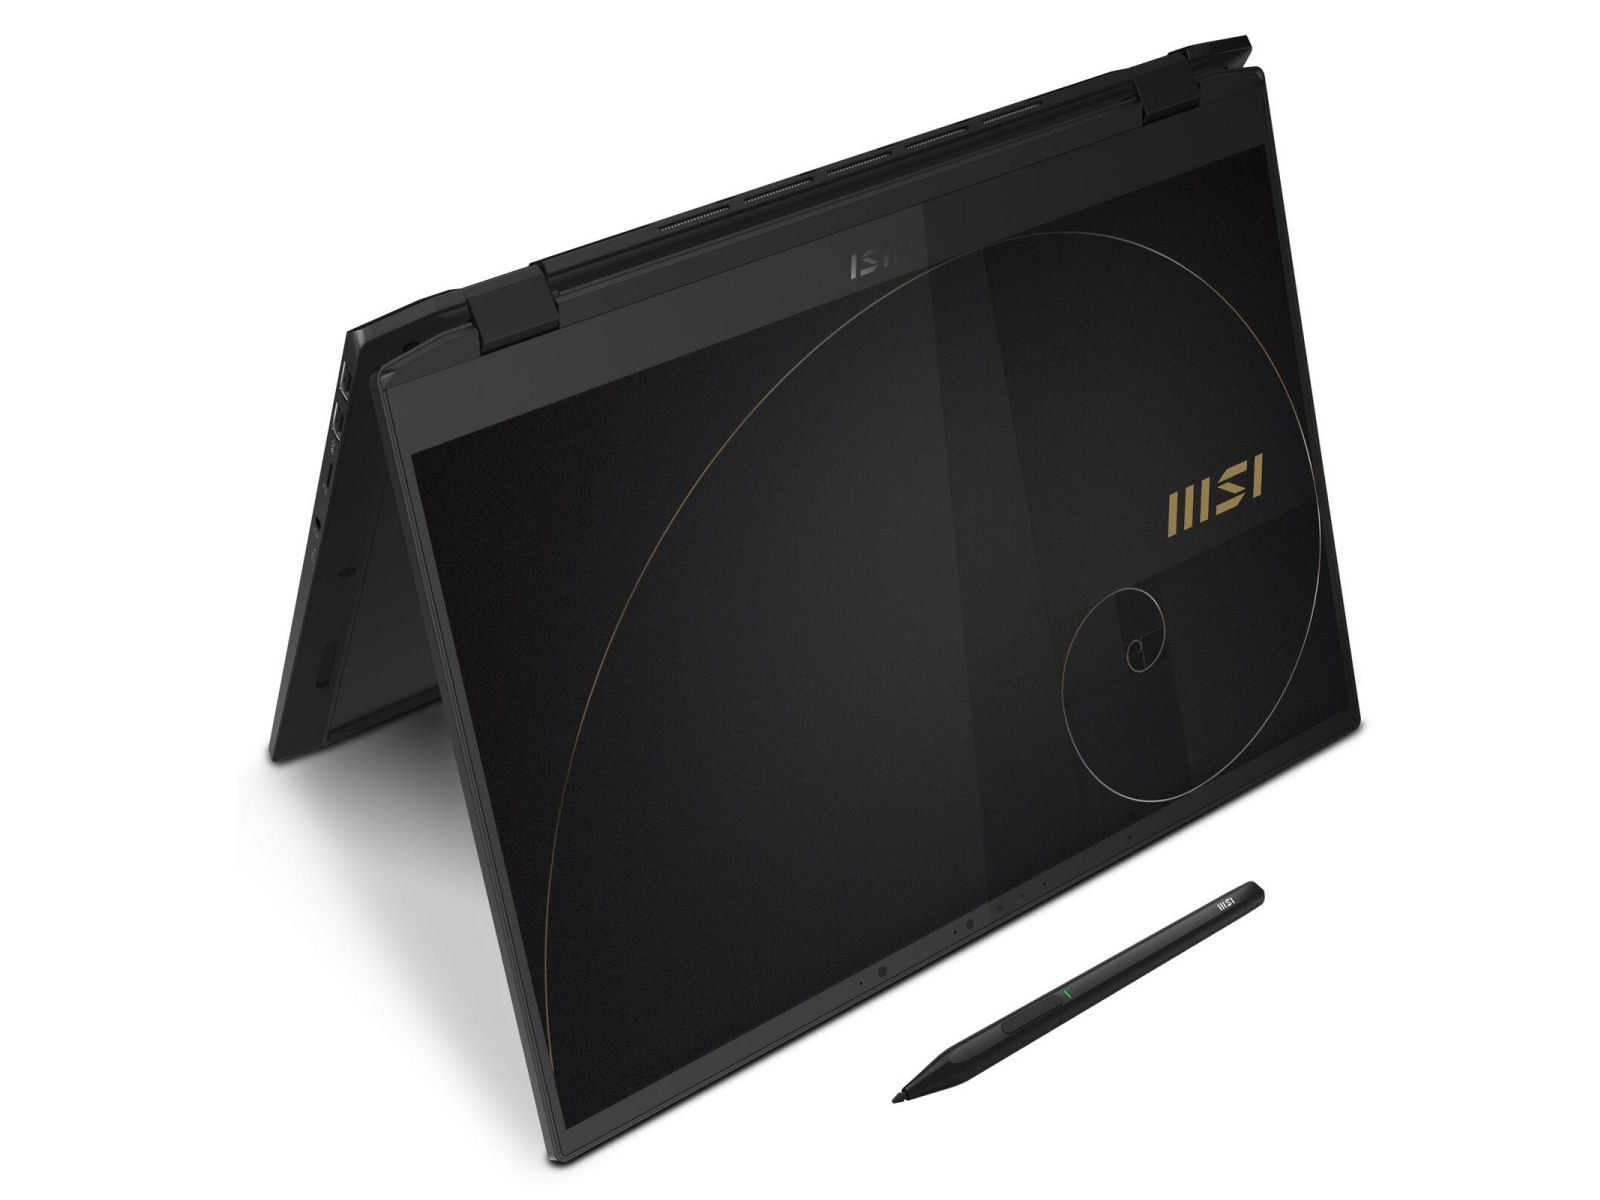
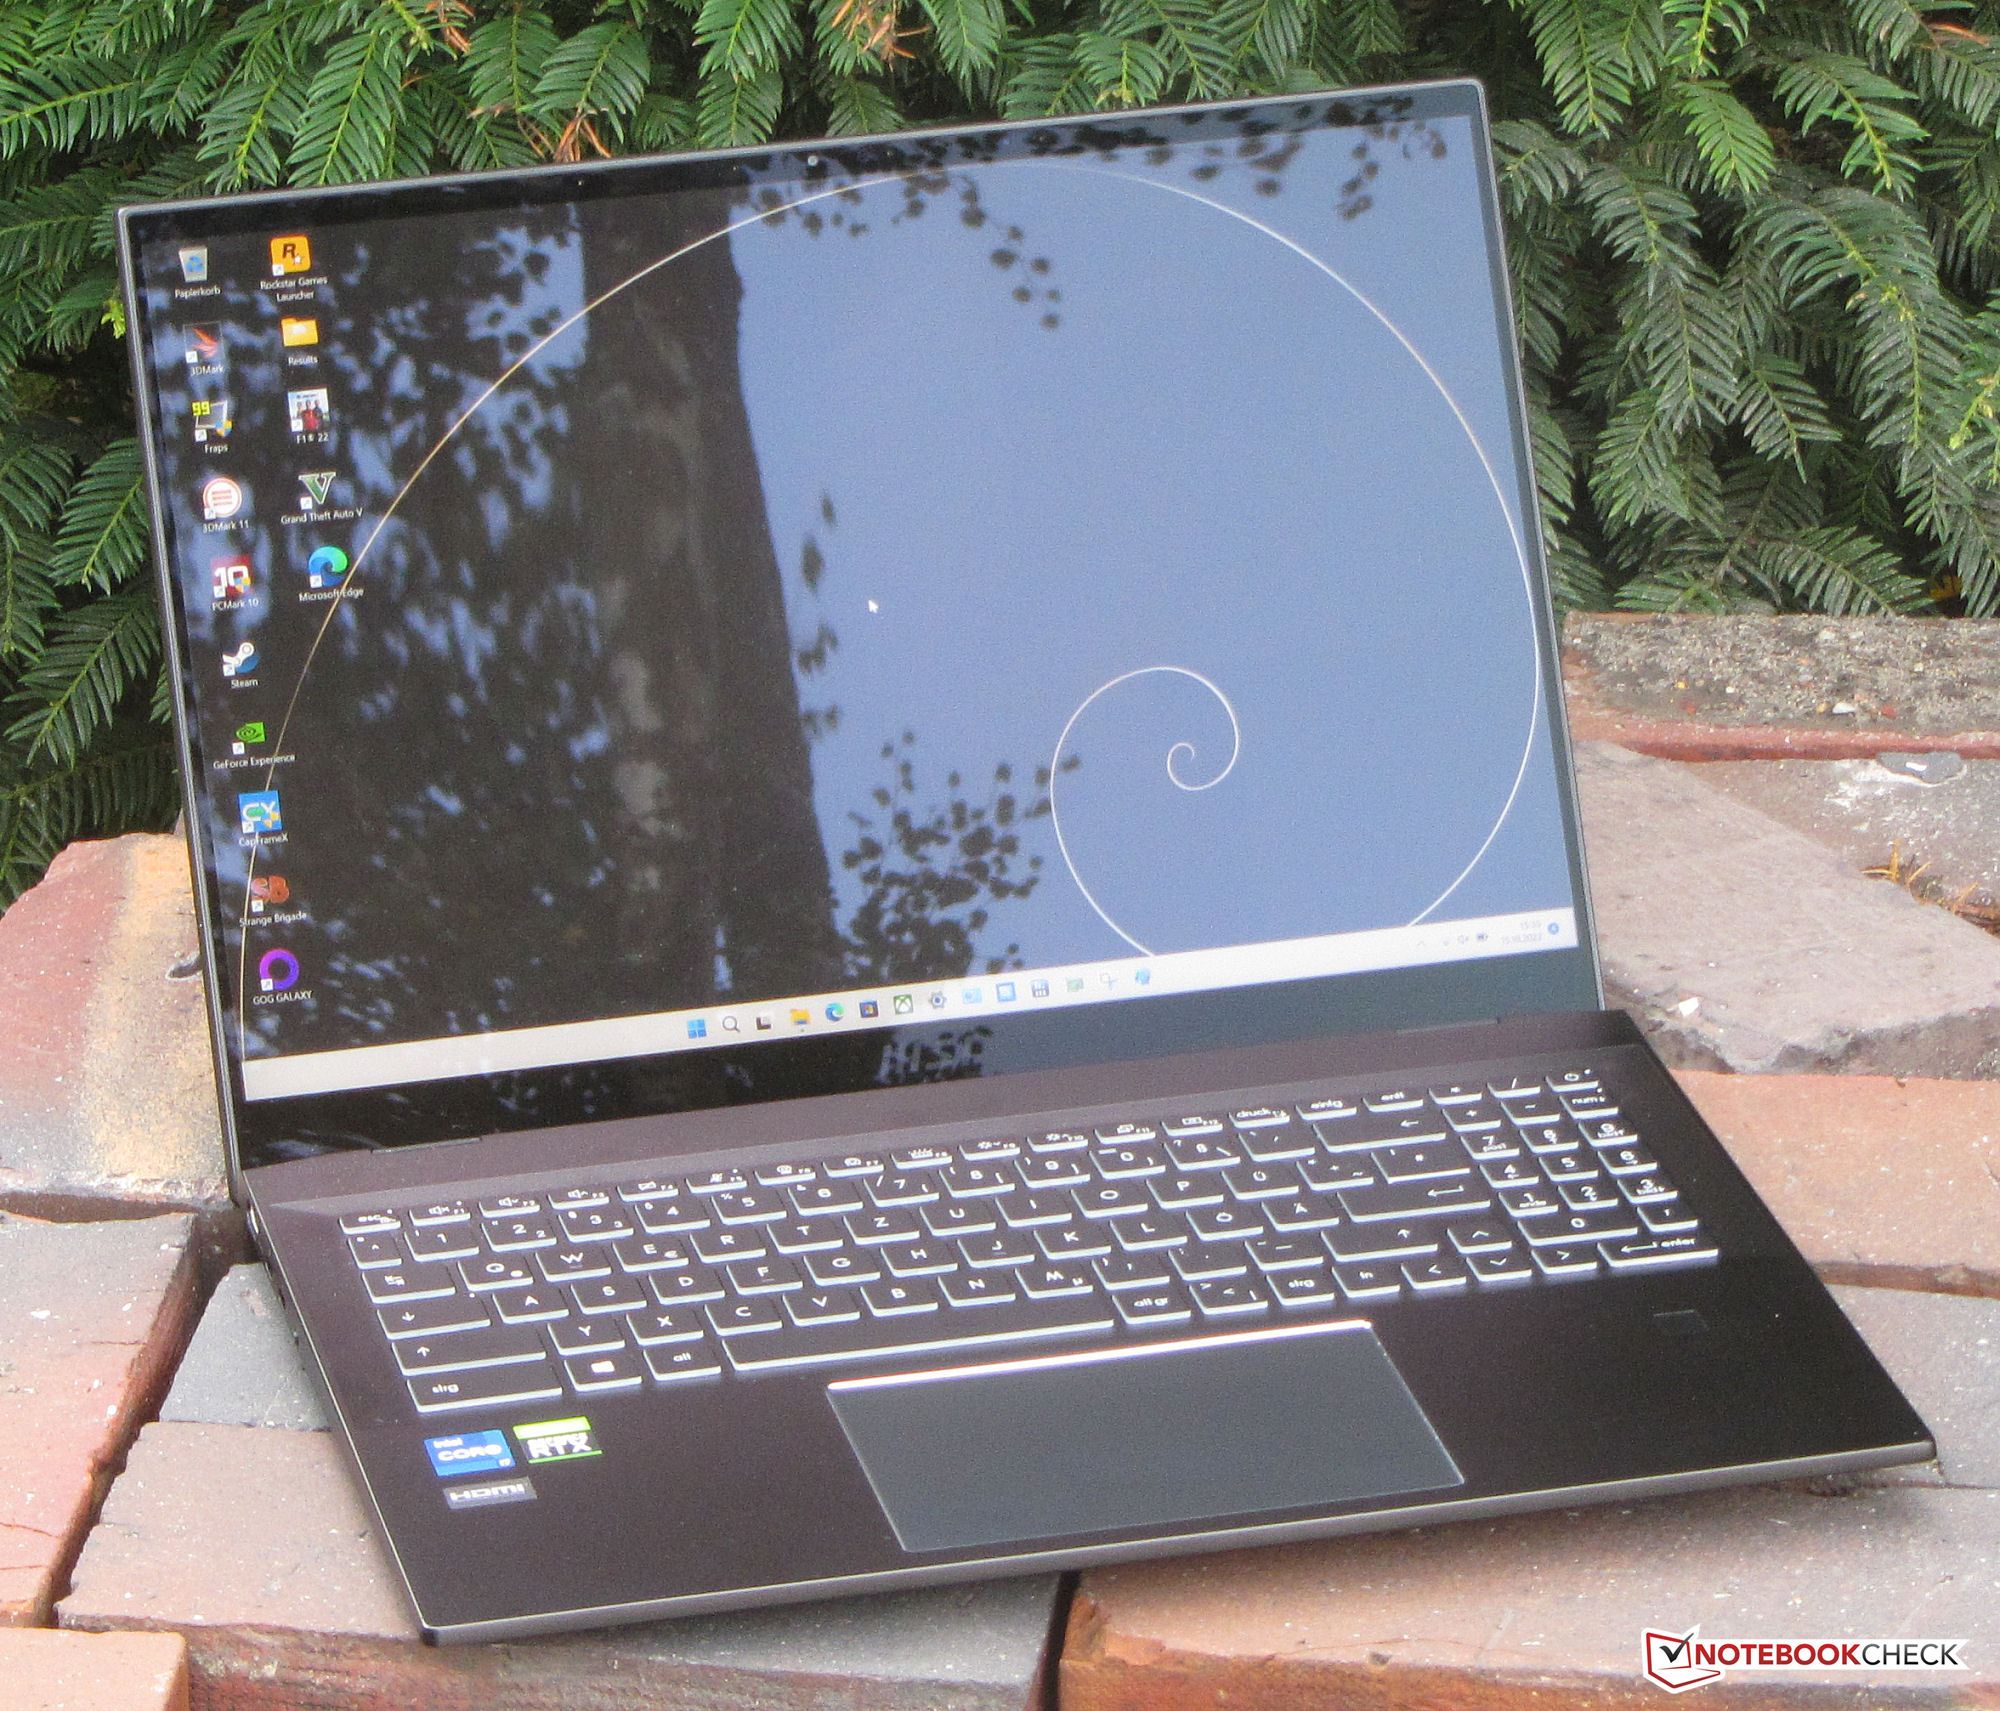
Revisão do MSI Summit E16 Flip: laptop 2 em 1 com caneta, visor 16:10 e RTX 3050 Ti

Com o Summit E16 Flip, a MSI oferece um laptop 2-em-1 cuja característica distintiva é a combinação de uma tela sensível ao toque de 16 polegadas no formato 16:10 e uma GPU de médio alcance. Nosso banco de dados não inclui nenhum concorrente direto, já que os conversíveis correspondentes geralmente não oferecem GPUs dedicados. Um conjunto expandido de concorrentes inclui dispositivos tais como a Asus ExpertBook B2 Flip B2502FBAoSamsung Galaxy Livro Pro 360 15 NP950QDBe o Dell Inspiron 16 7620 2 em 1.
Possíveis concorrentes em comparação
Avaliação | Data | Modelo | Peso | Altura | Size | Resolução | Preço |
|---|---|---|---|---|---|---|---|
| 84.2 % v7 (old) | 10/2022 | MSI Summit E16 Flip A12UDT-031 i7-1280P, GeForce RTX 3050 Ti Laptop GPU | 1.9 kg | 16.85 mm | 16.00" | 2560x1600 | |
| 83.3 % v7 (old) | 09/2022 | Asus ExpertBook B2 Flip B2502FBA-N80141X i7-1260P, Iris Xe G7 96EUs | 1.9 kg | 19.9 mm | 15.60" | 1920x1080 | |
| 85.7 % v7 (old) | 06/2022 | Dell Inspiron 16 7620 2-in-1 i7-1260P, Iris Xe G7 96EUs | 2.1 kg | 18.41 mm | 16.00" | 1920x1200 | |
| 86.6 % v7 (old) | 03/2022 | Samsung Galaxy Book Pro 360 15 NP950QDB-KC3DE i5-1135G7, Iris Xe G7 80EUs | 1.4 kg | 11 mm | 15.60" | 1920x1080 |
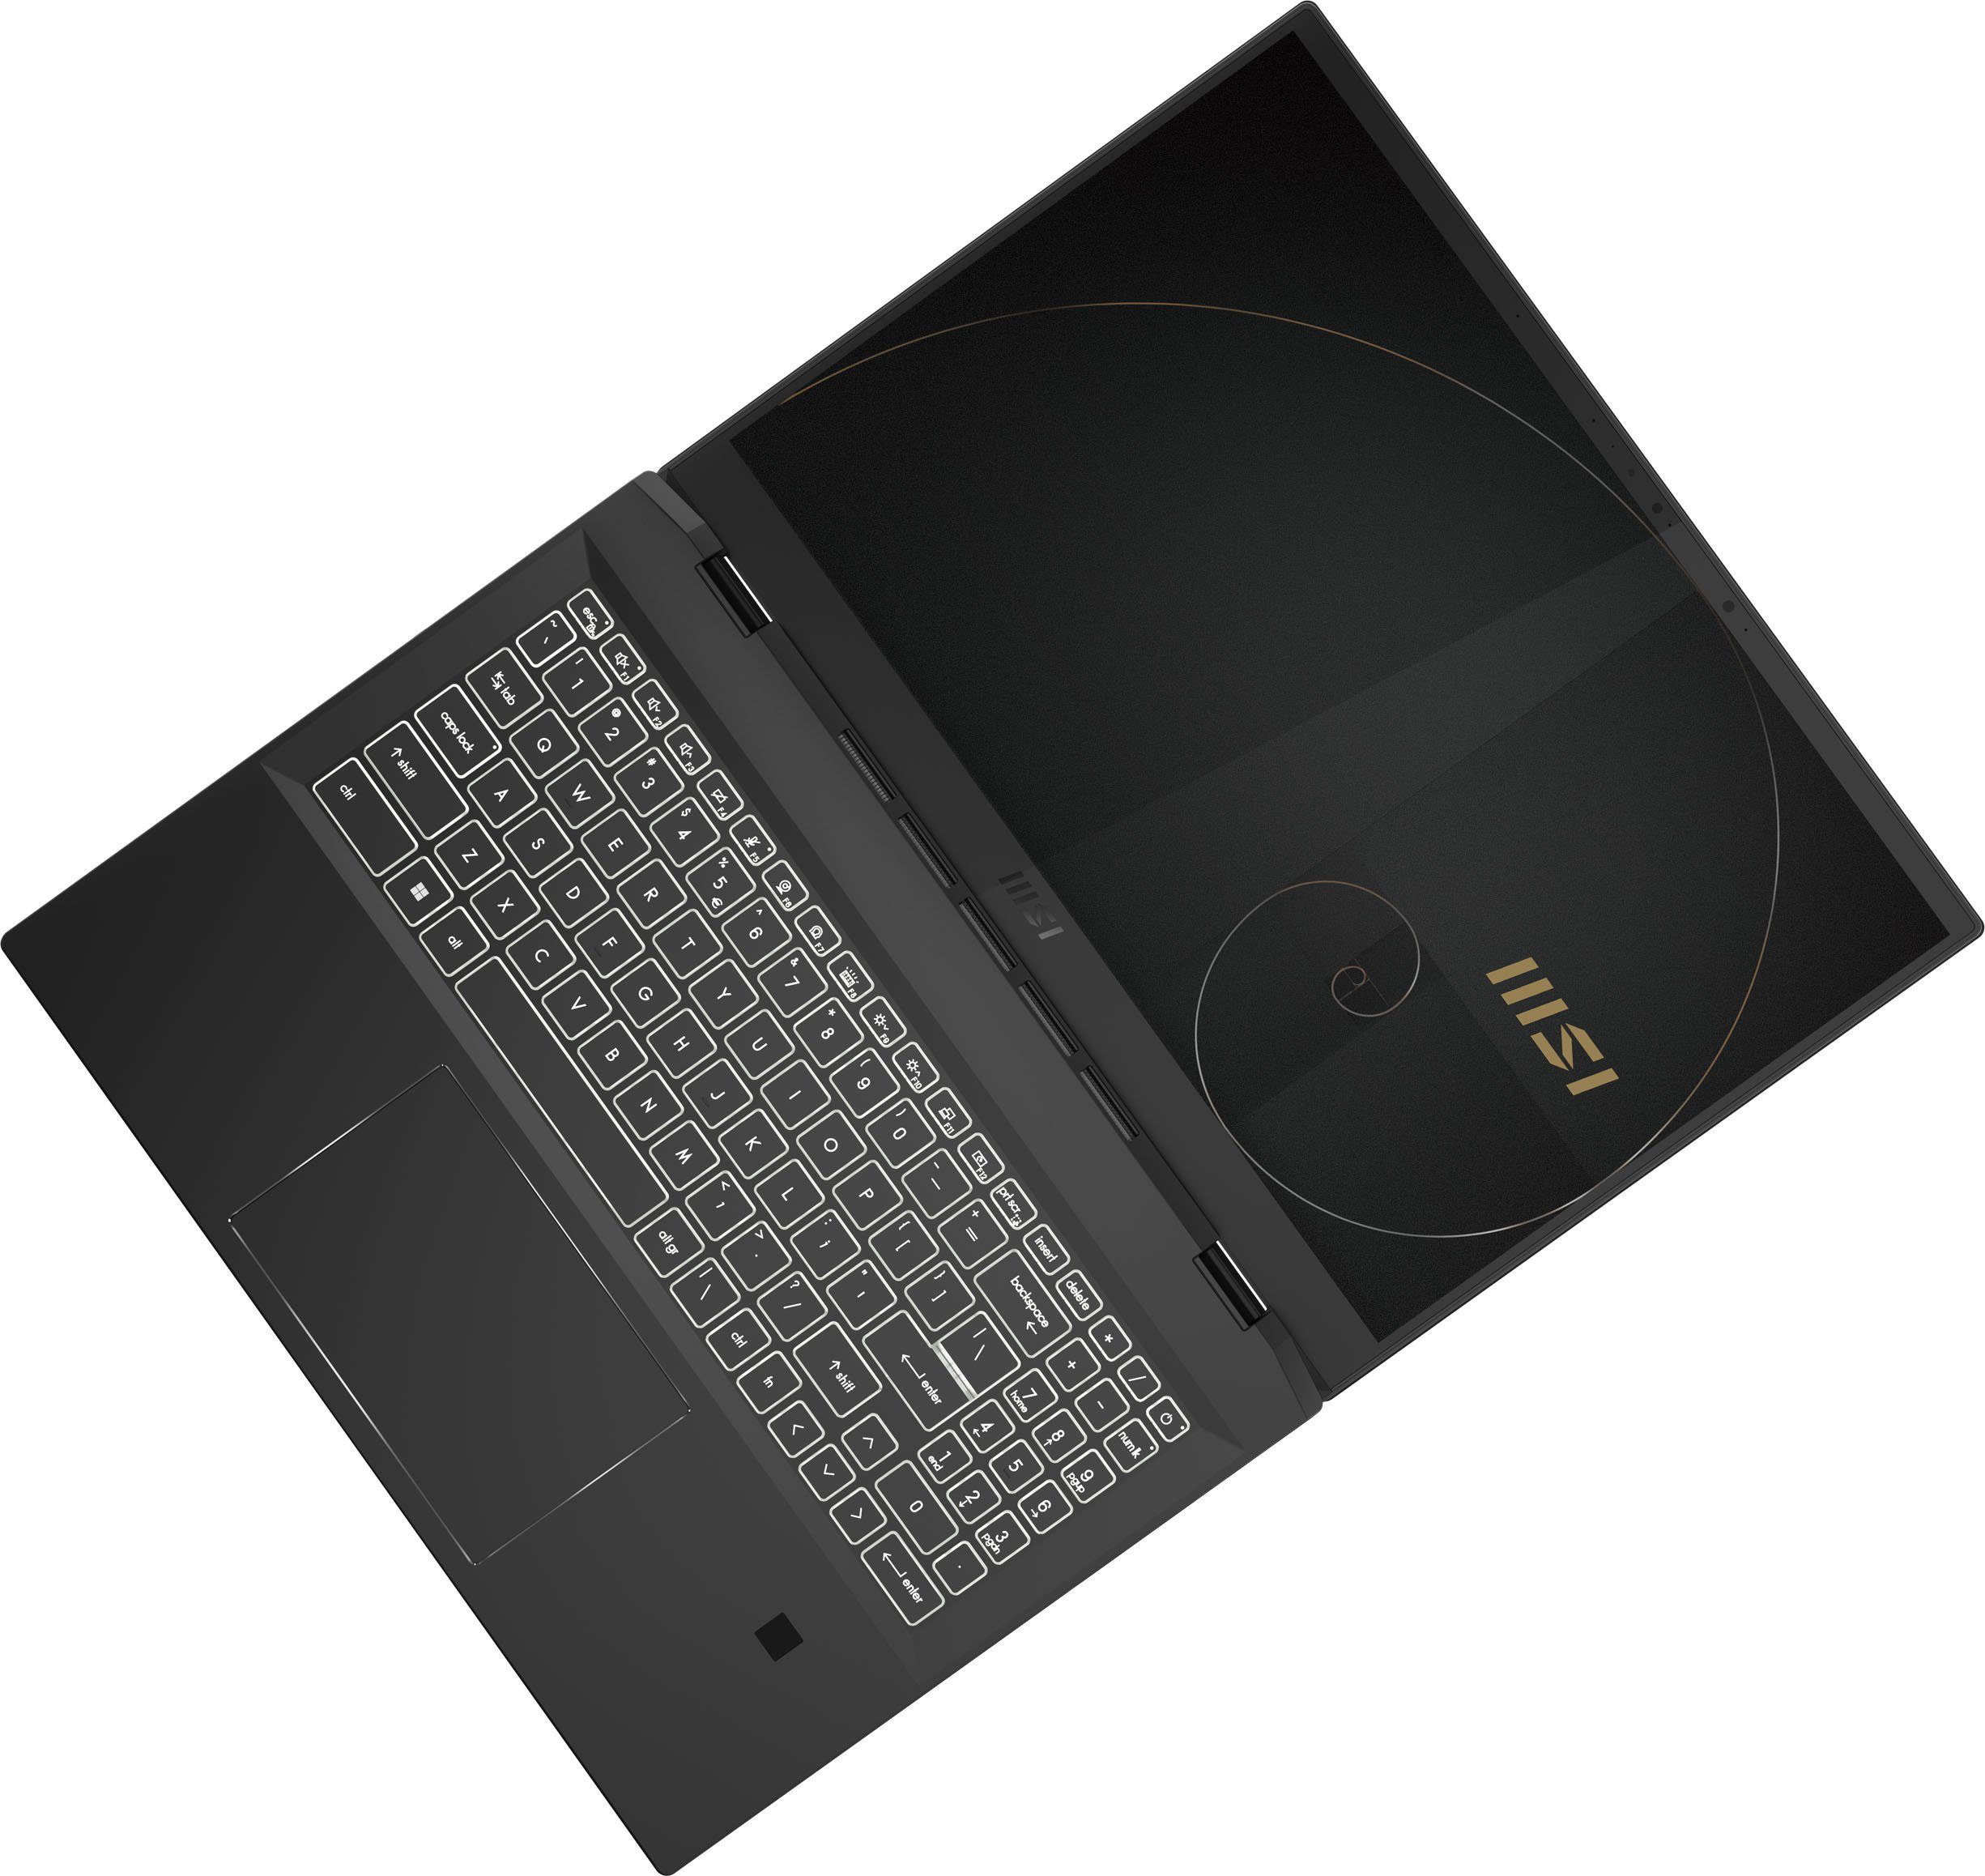
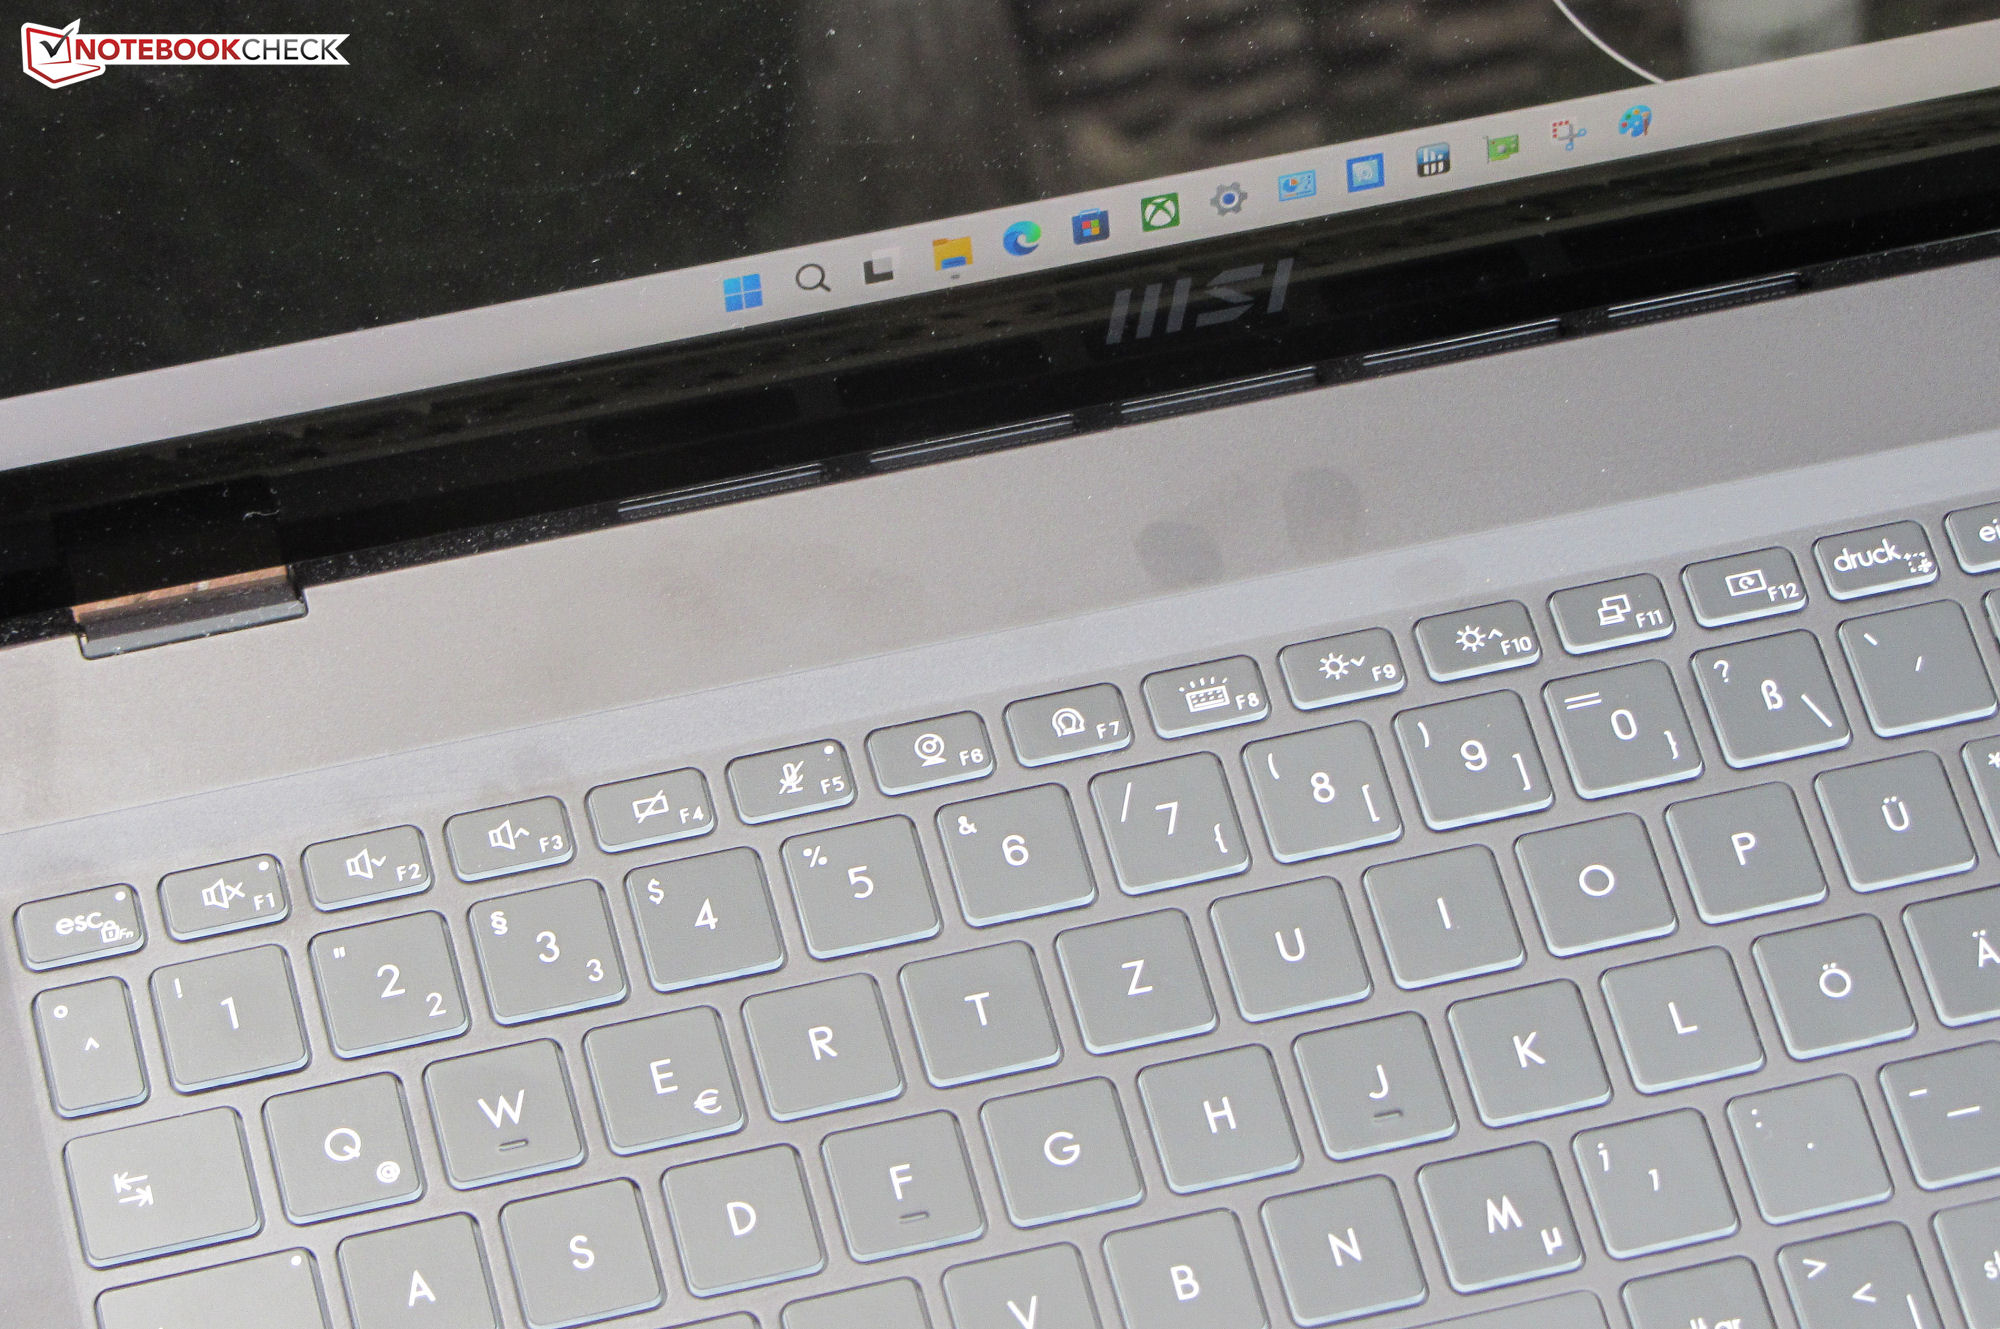
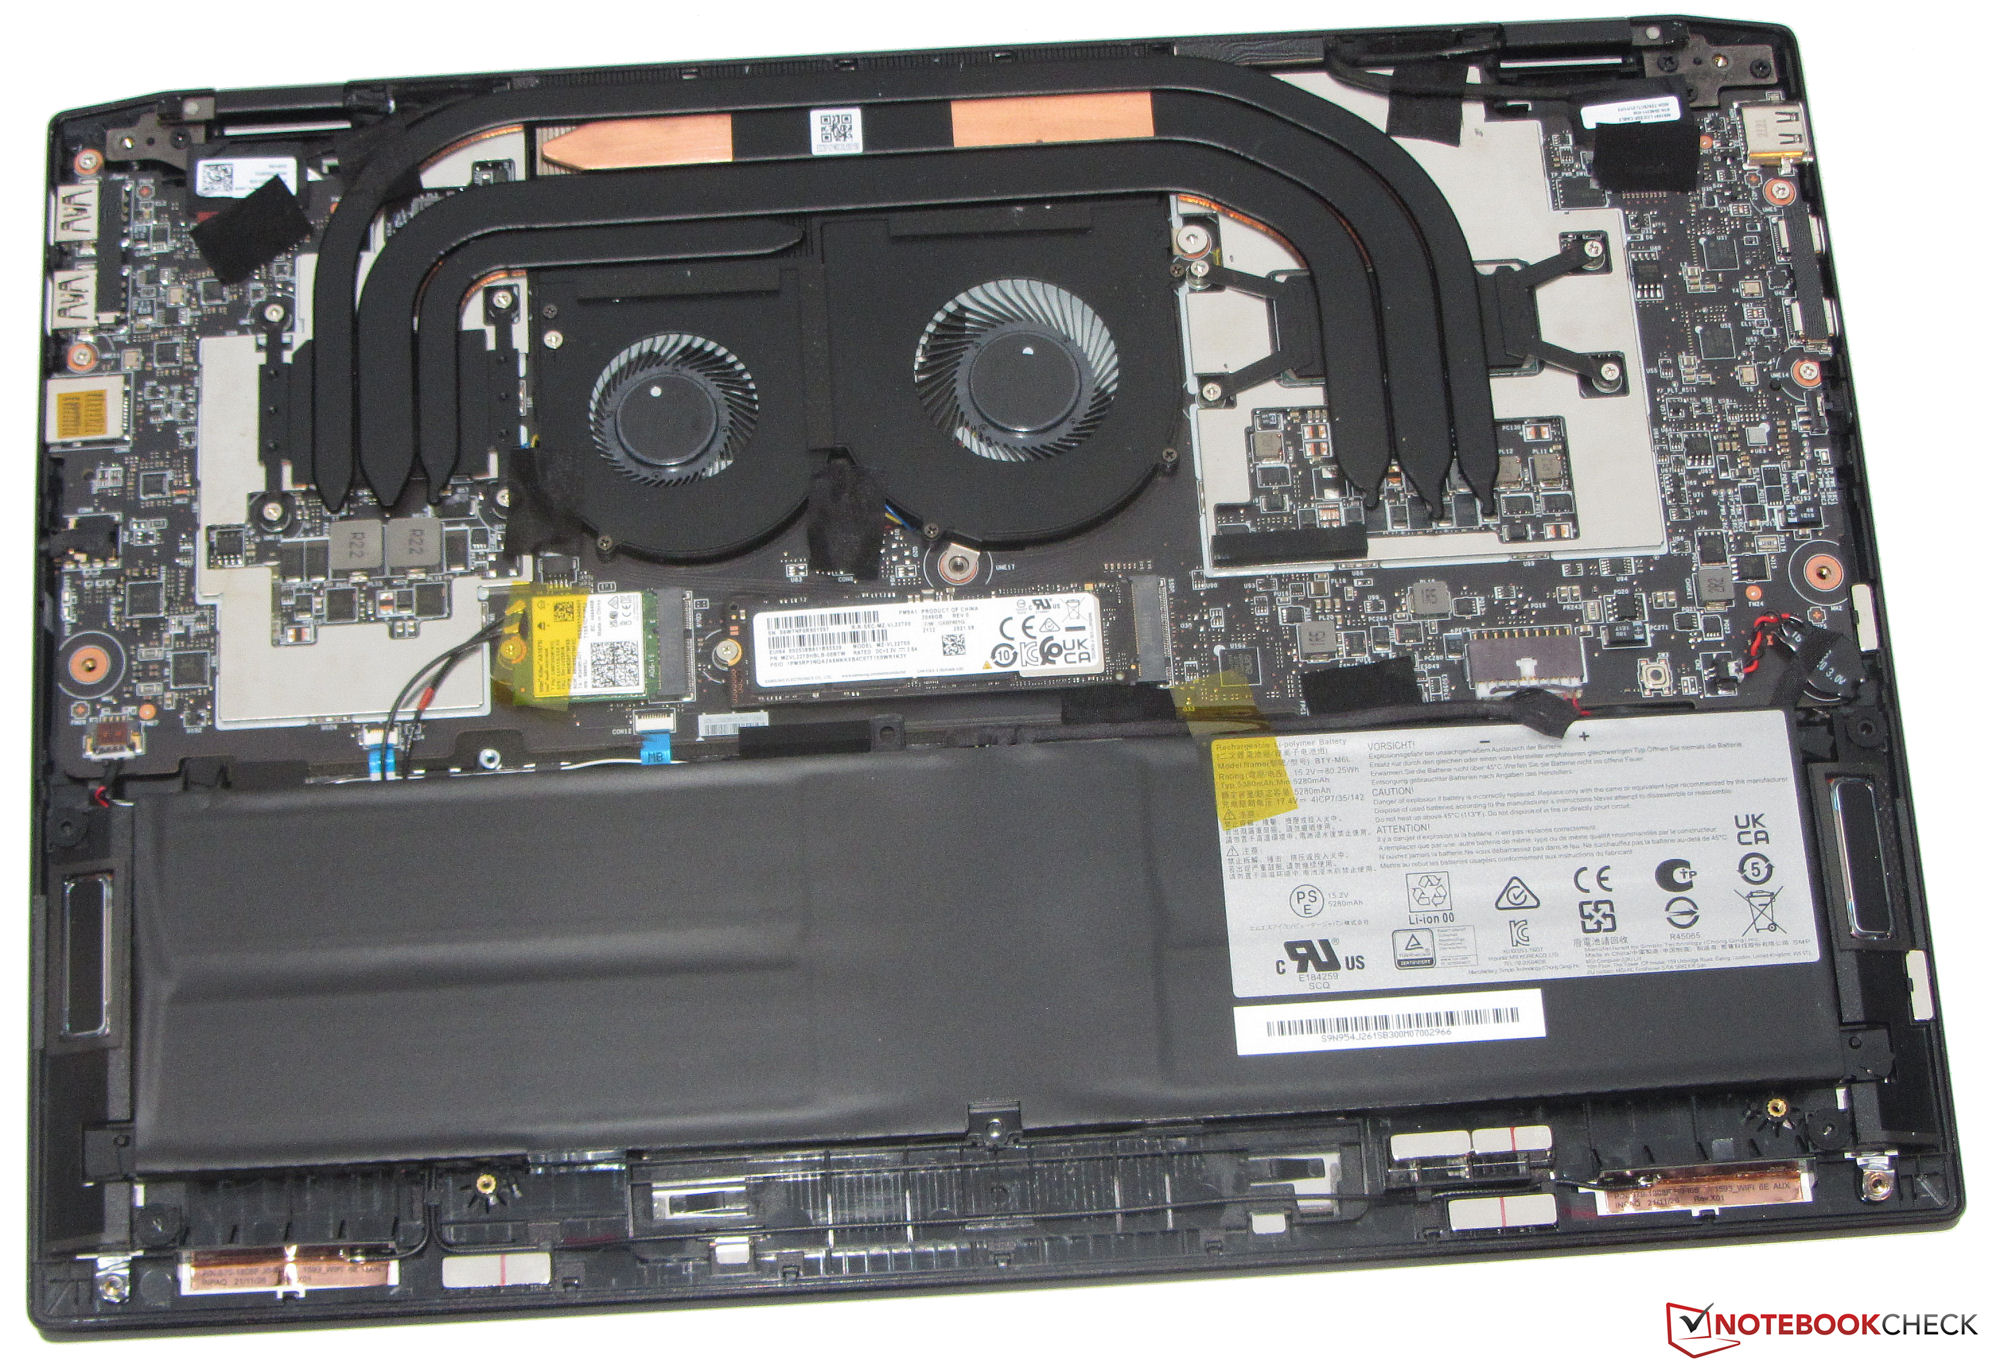
Estojo e Equipamento - MSI Flip oferece Thunderbolt 4
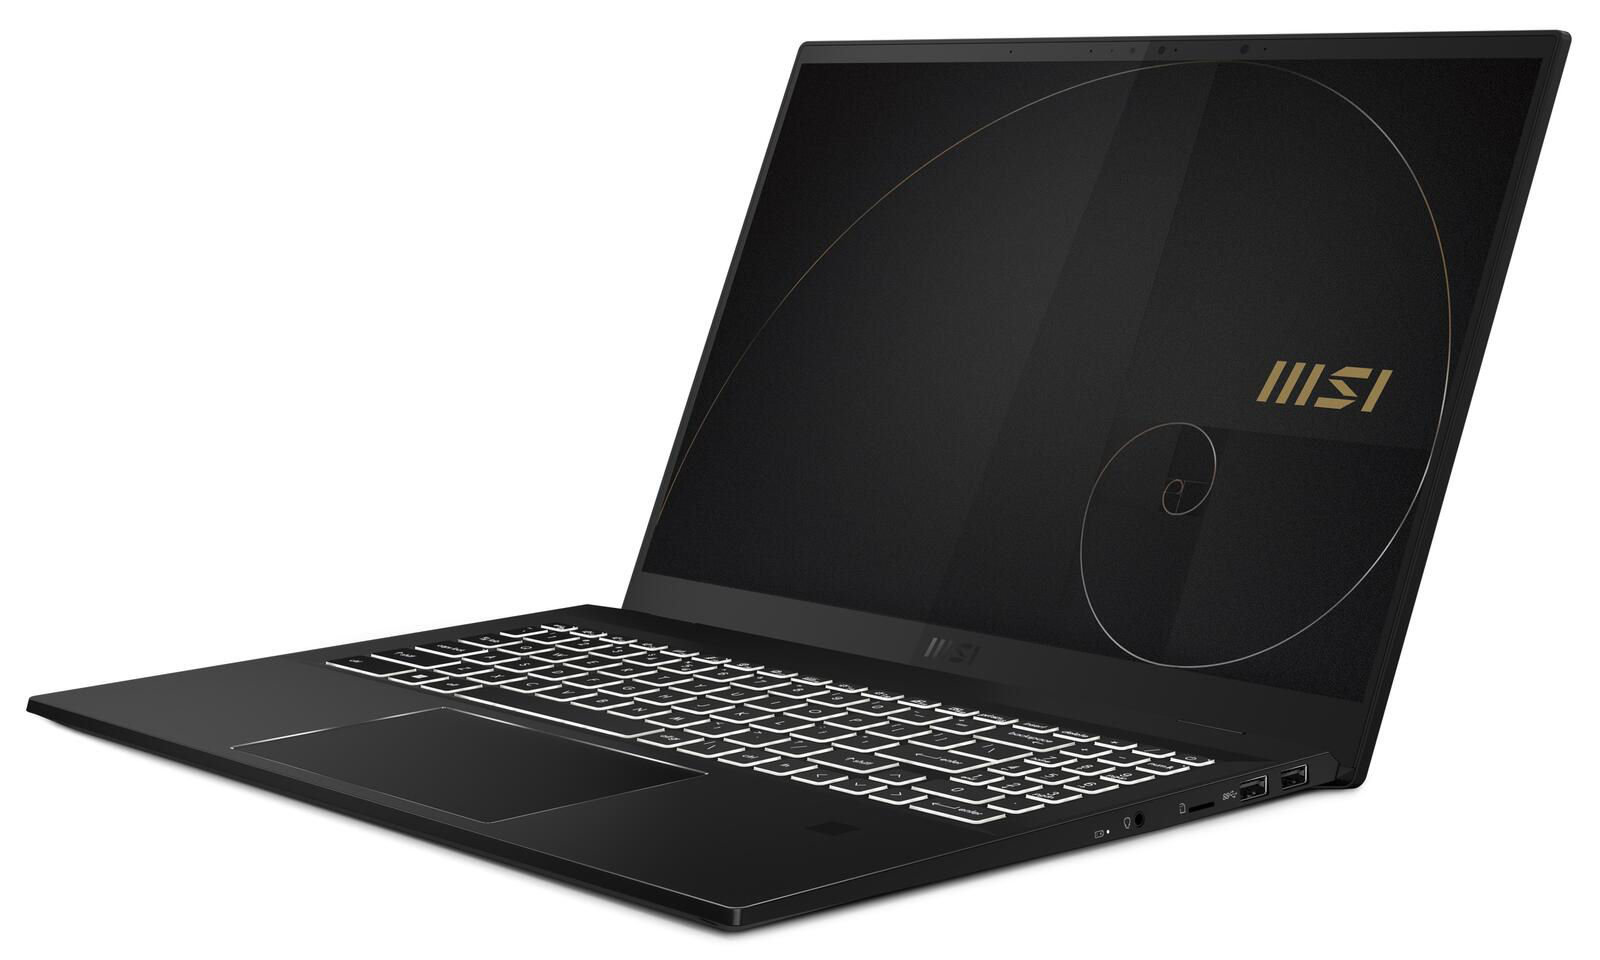
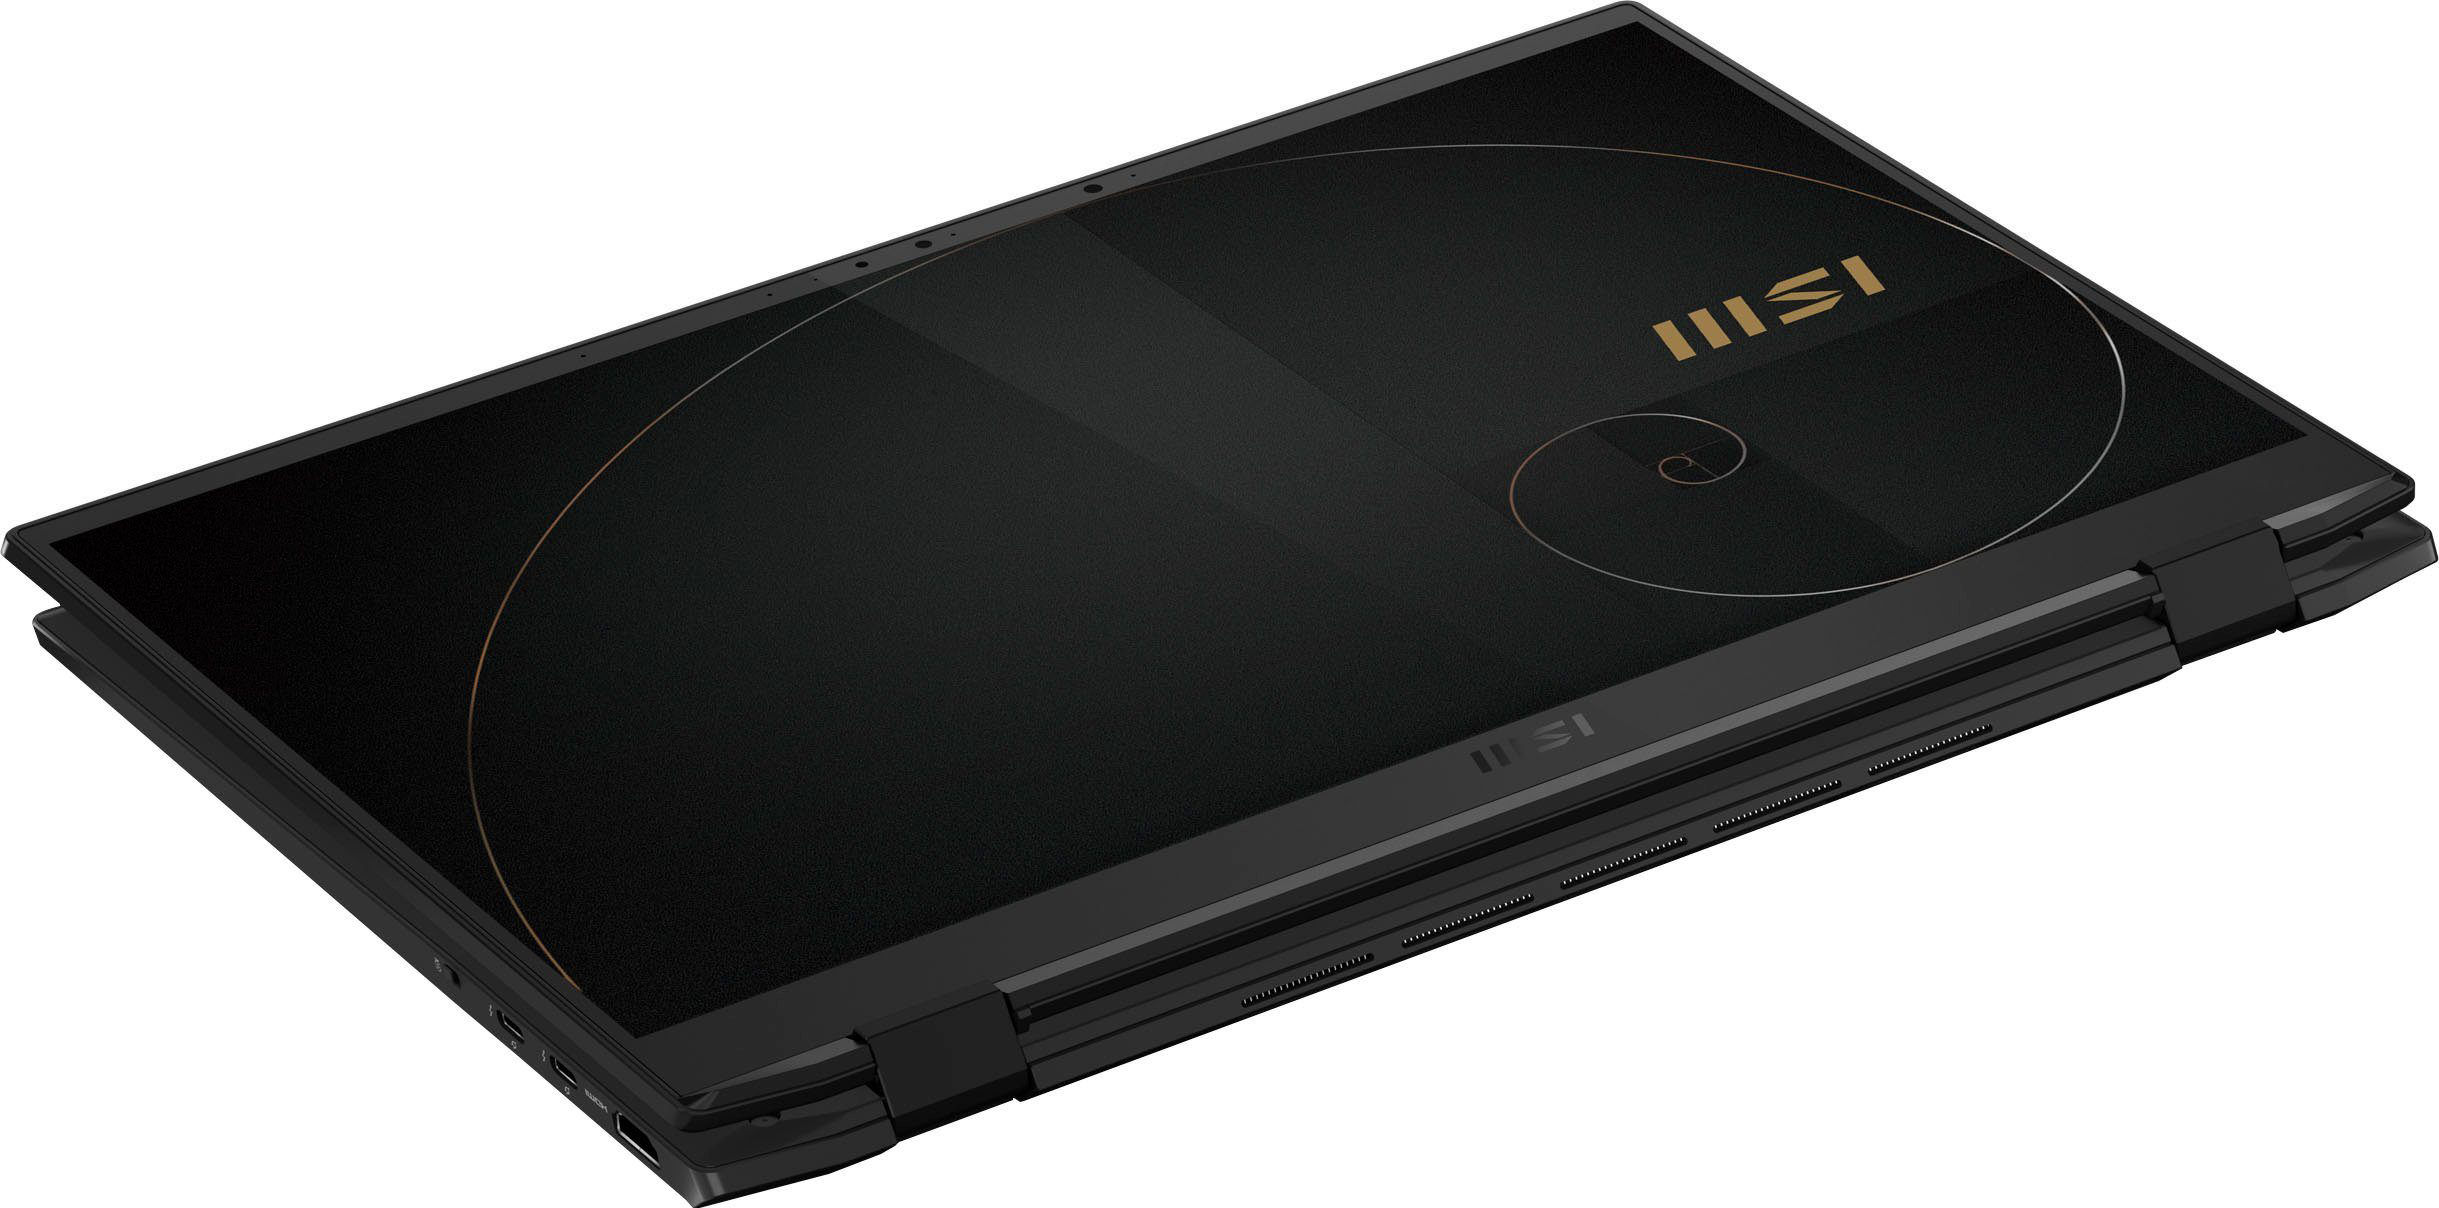
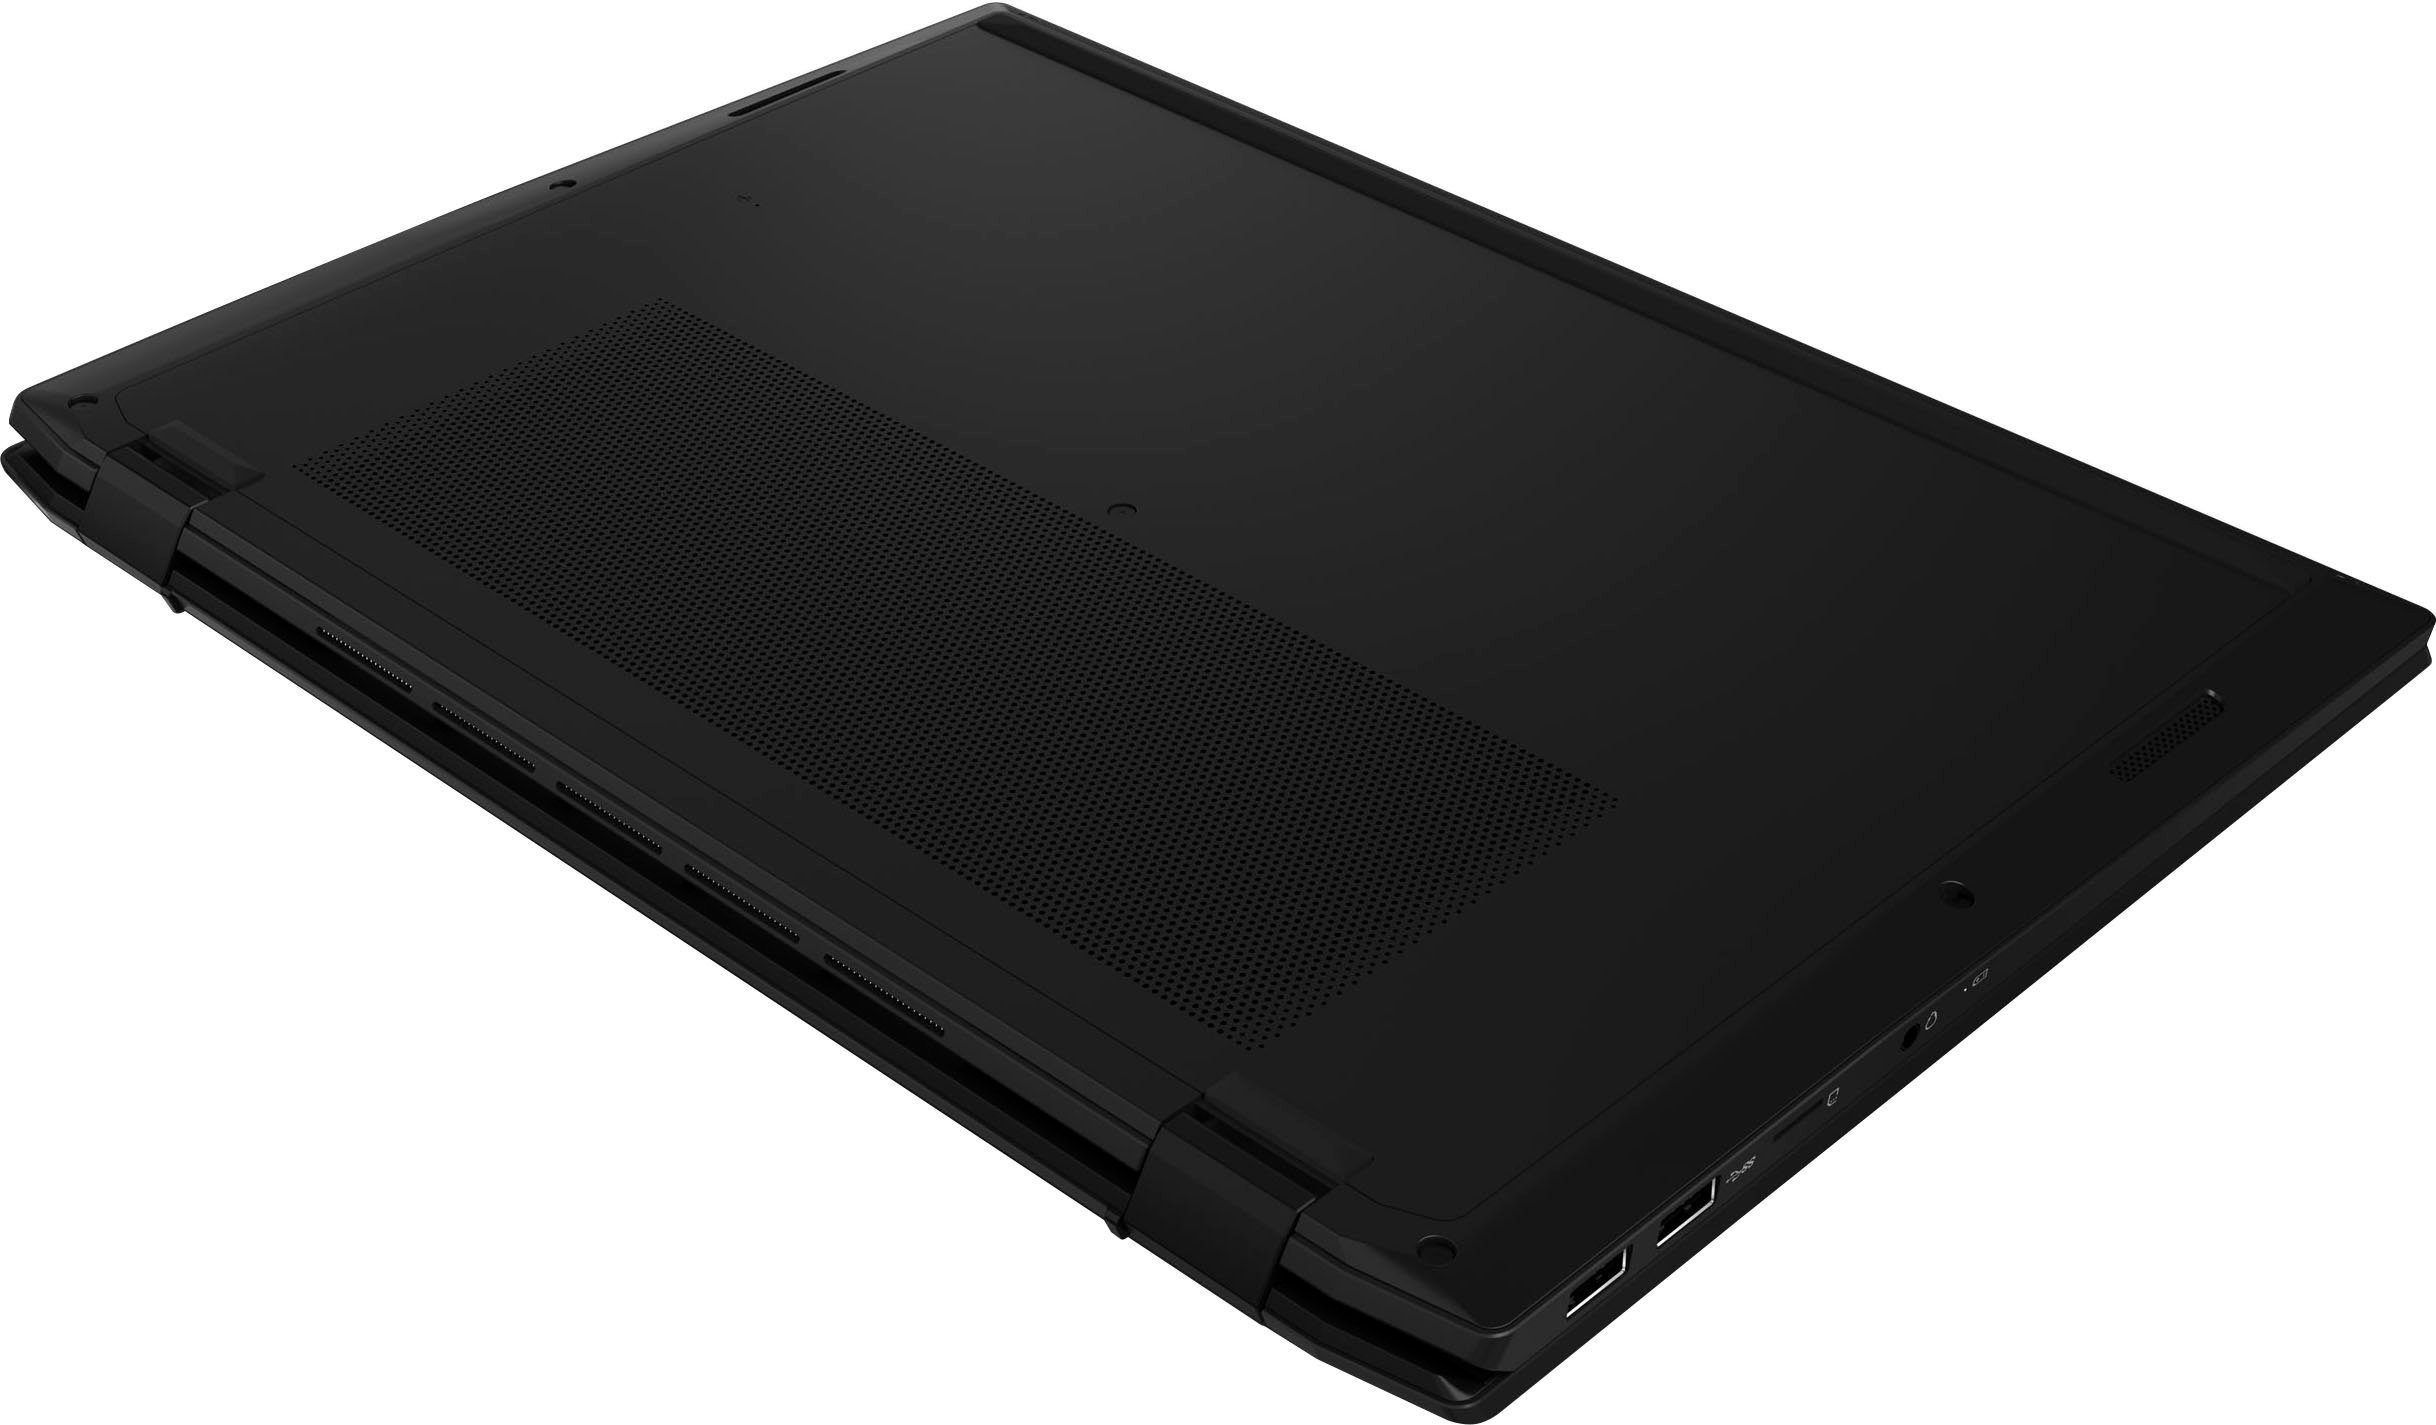
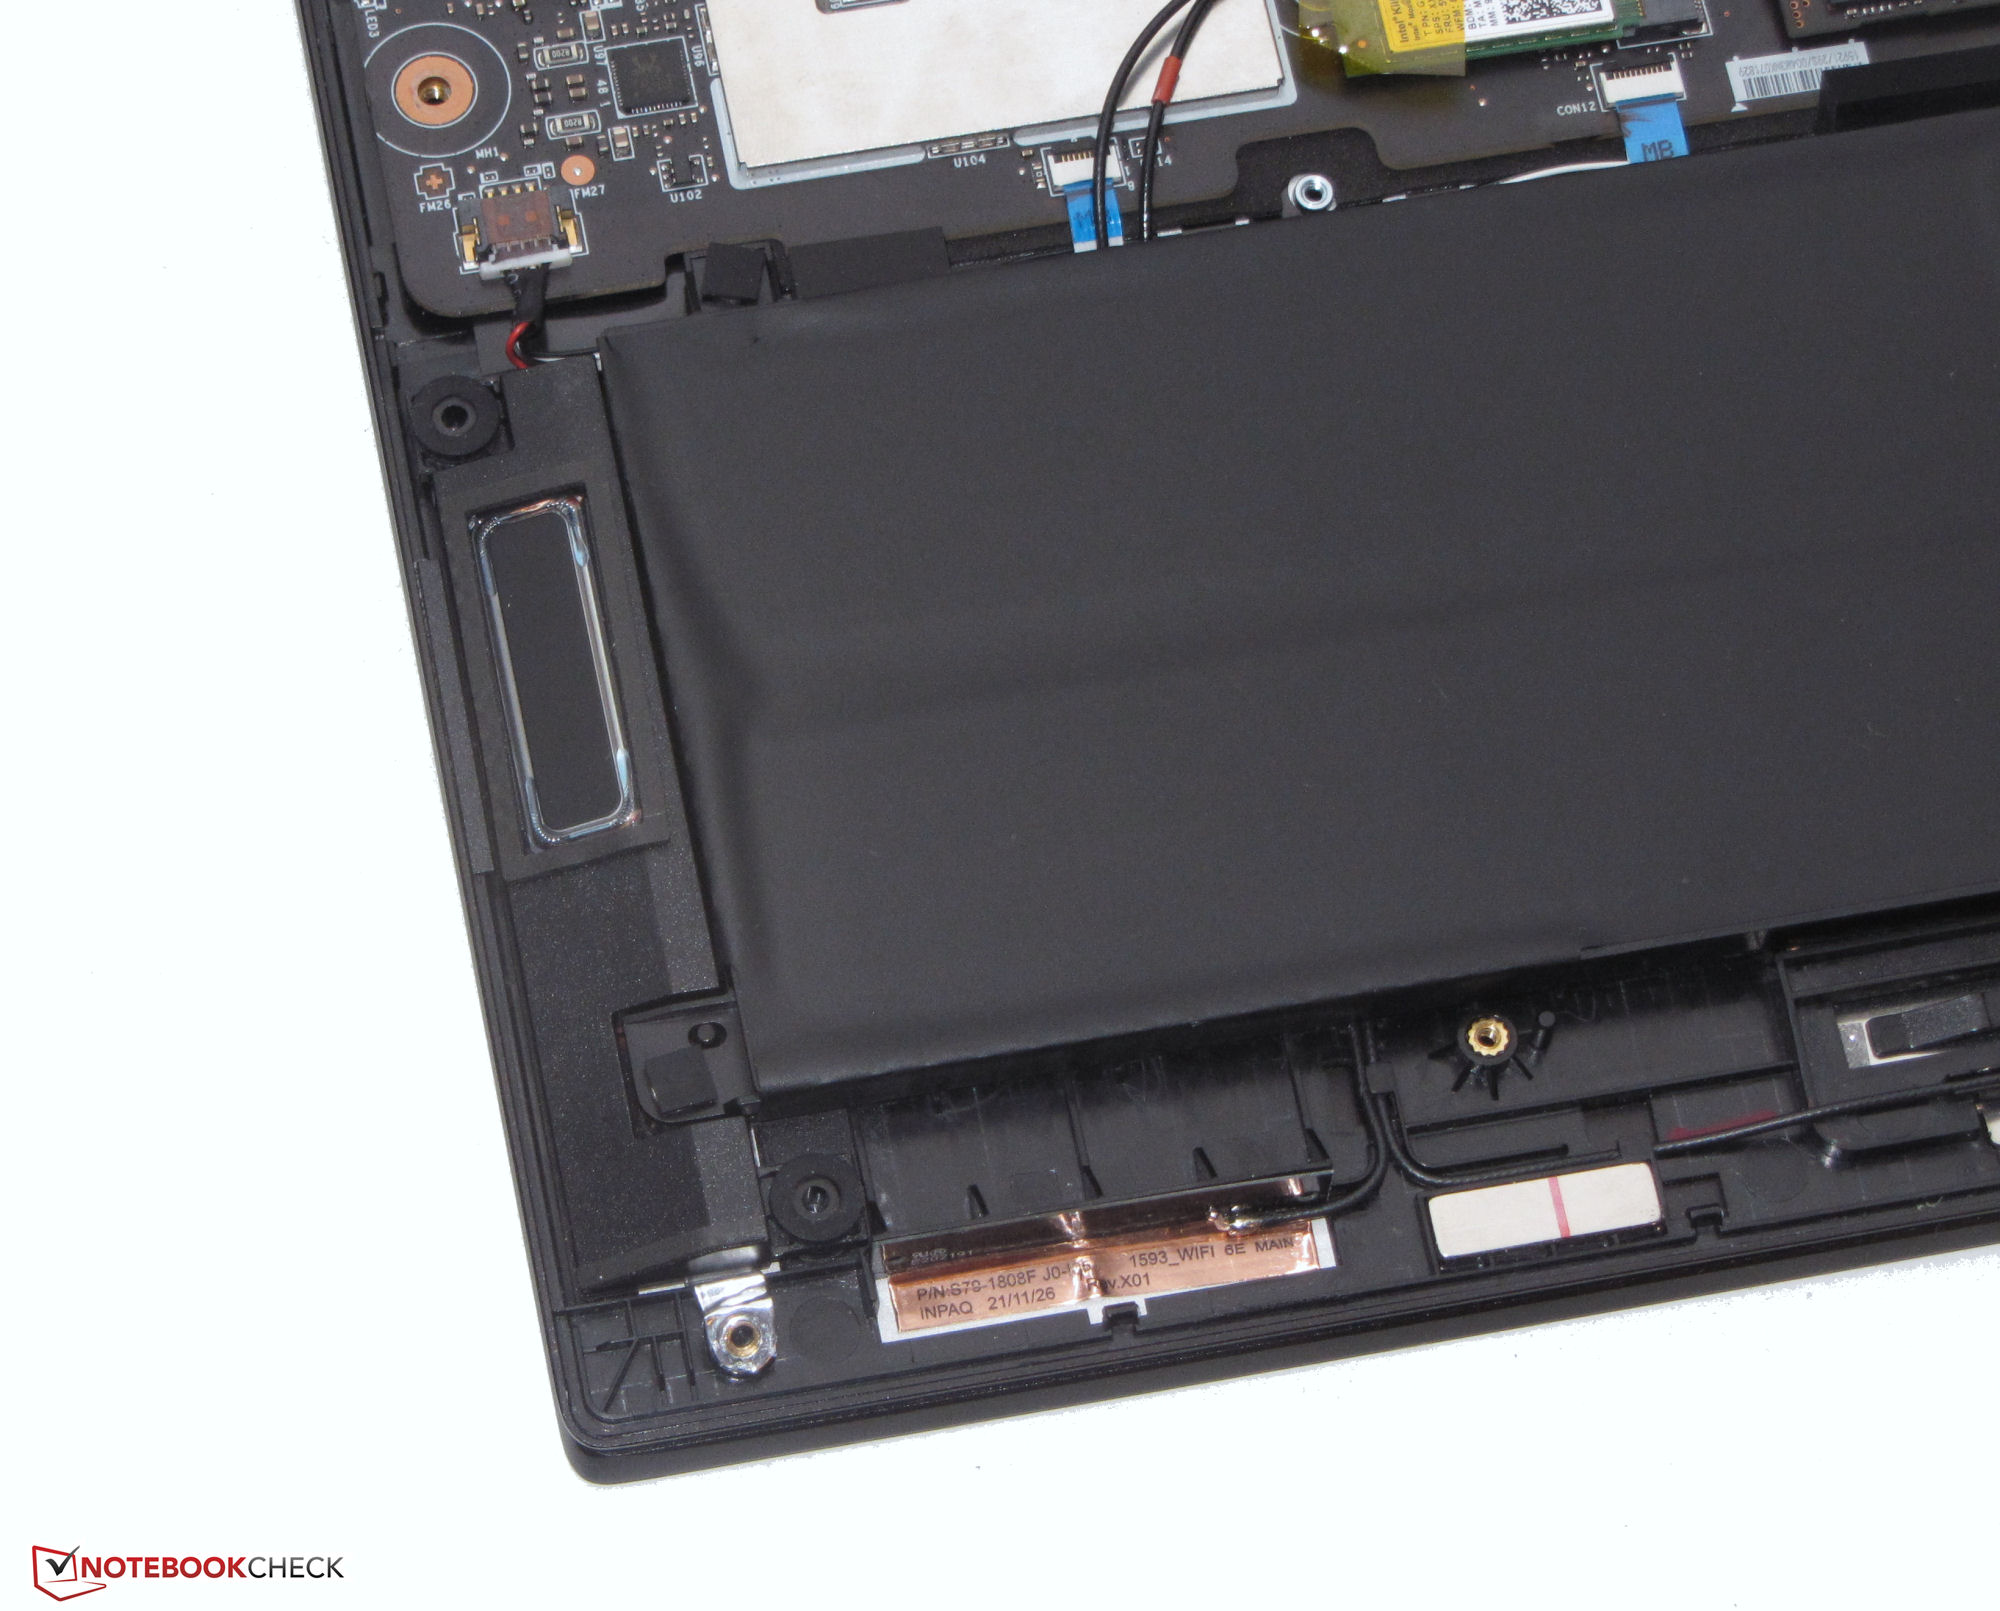
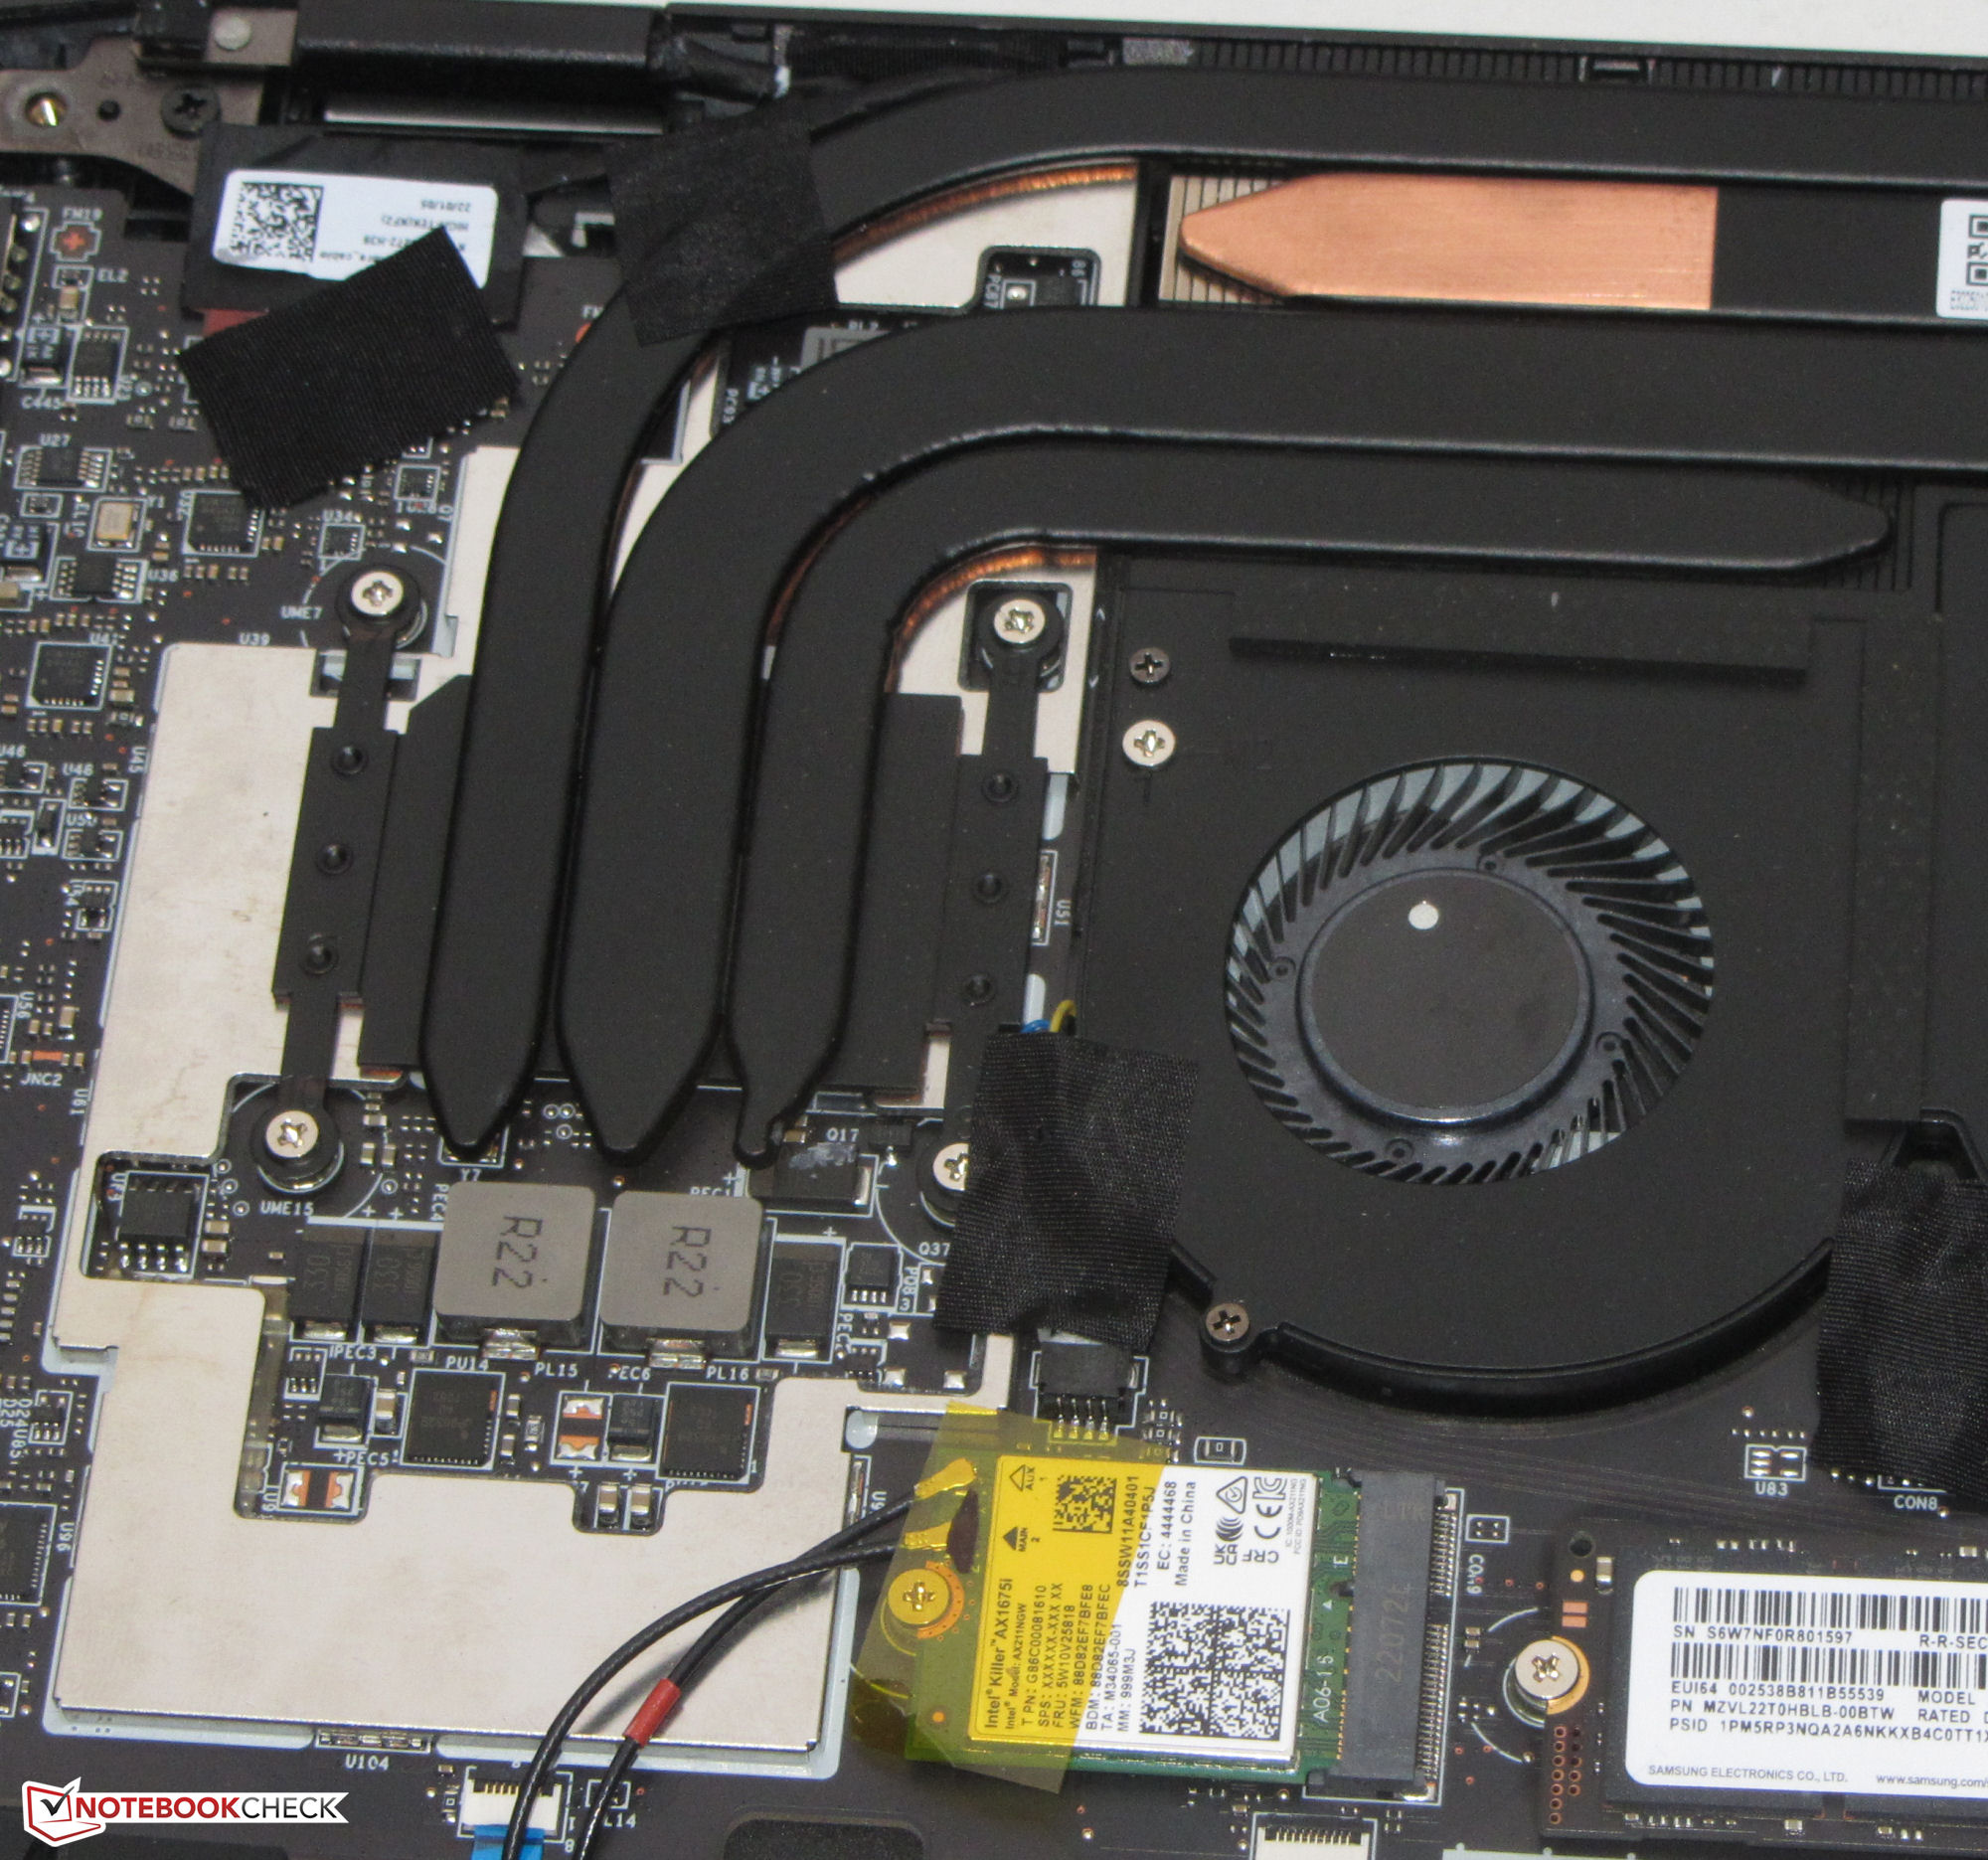
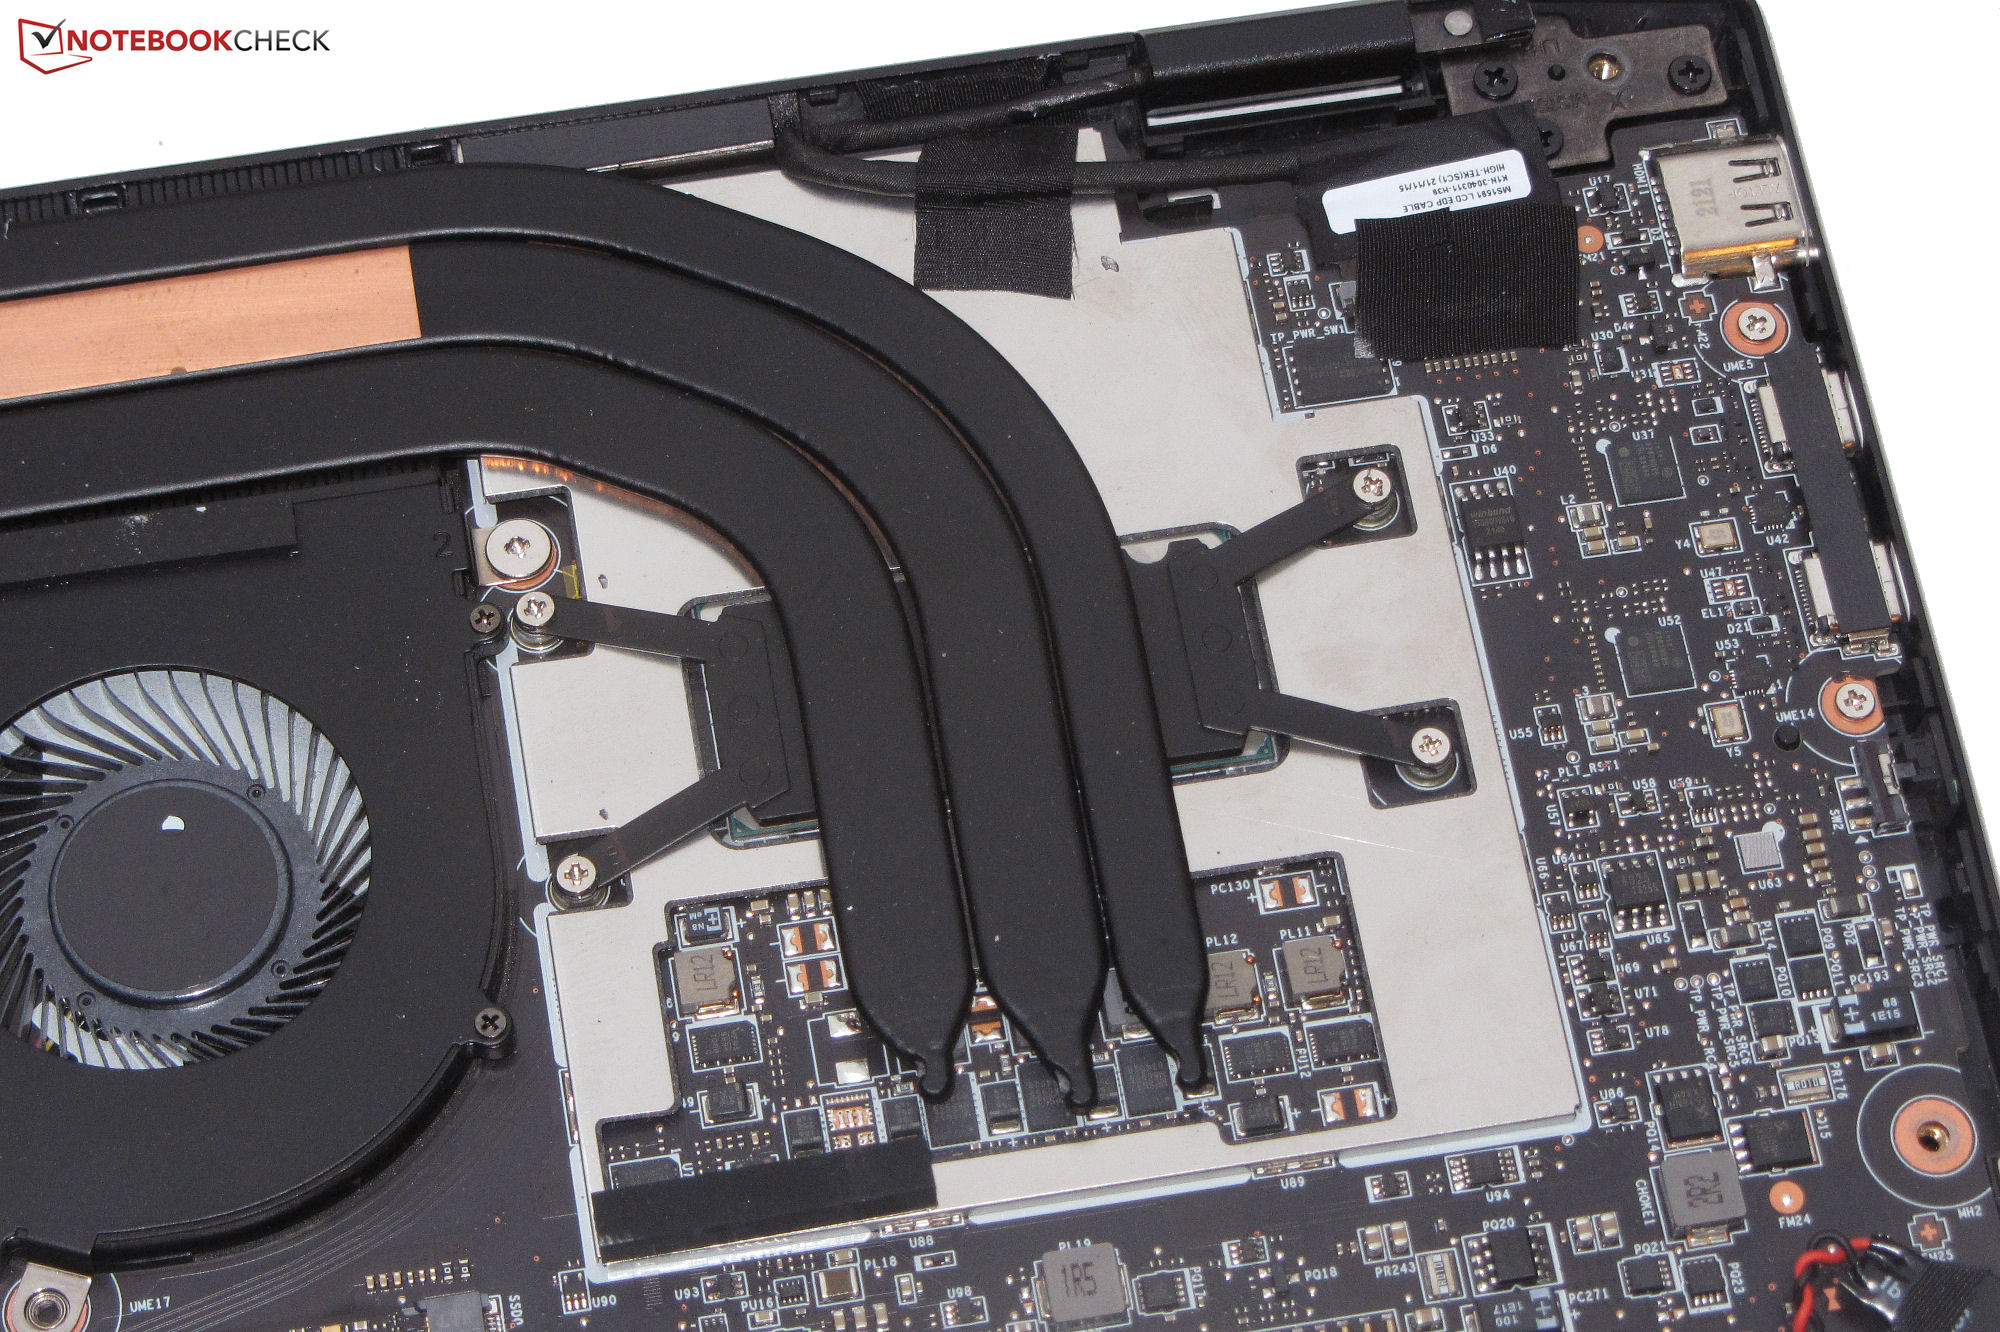
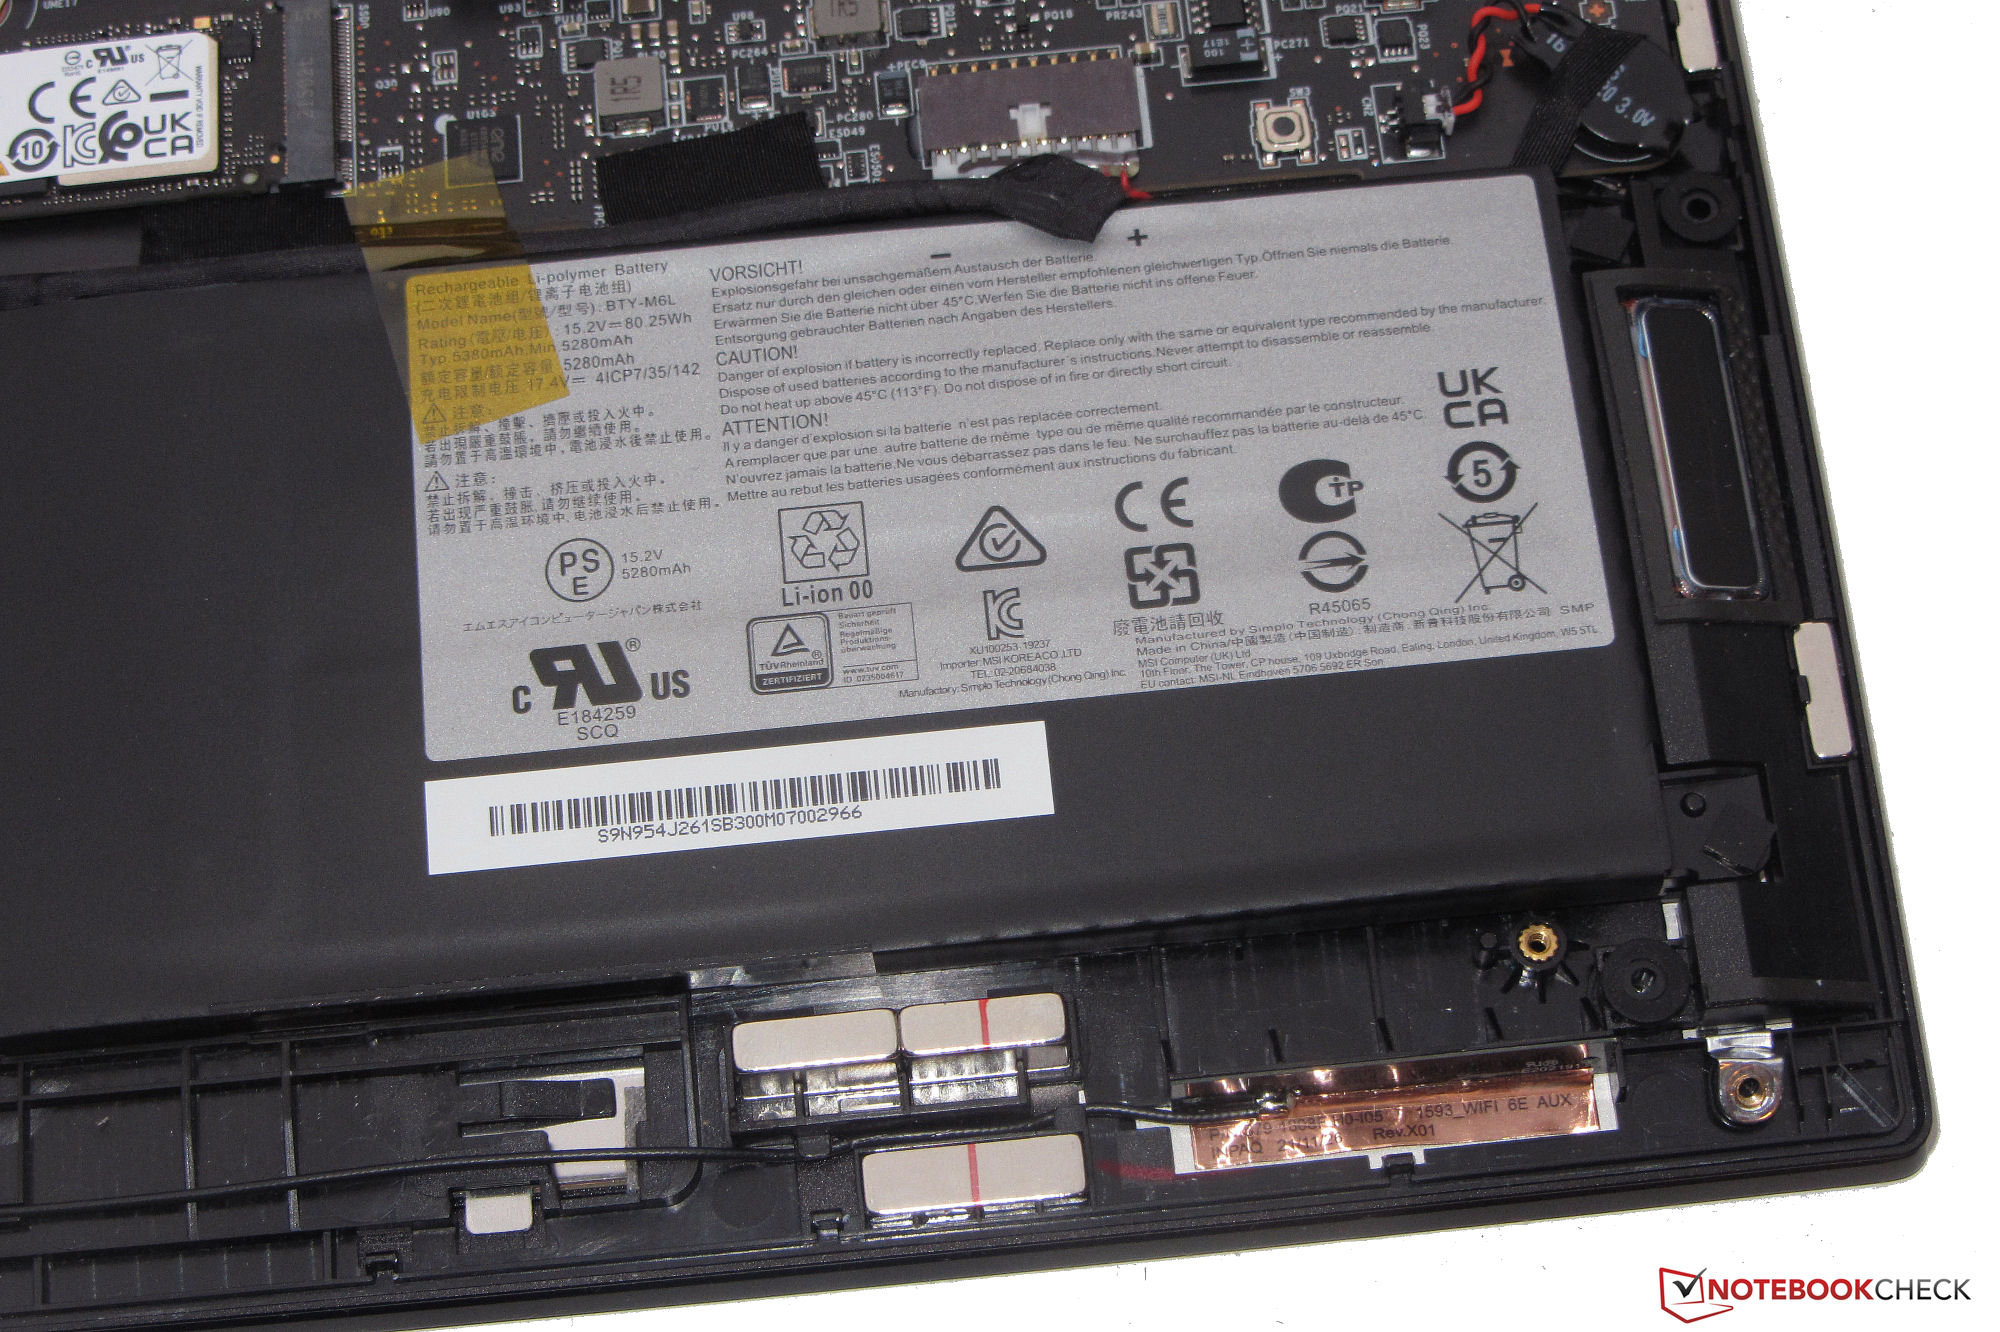
A caixa metálica fina e preta do E16 não apresenta nenhuma falha no acabamento. Não encontramos nenhuma falha excessiva ou protuberâncias materiais. Embora a tampa e a unidade base possam ser ligeiramente deformadas, isto permanece dentro dos limites. As superfícies lisas e foscas da caixa são ligeiramente propensas a mostrar impressões digitais. A bateria, que é aparafusada em vez de colada, assim como o resto das partes internas são acessíveis após uma fácil remoção do fundo da caixa
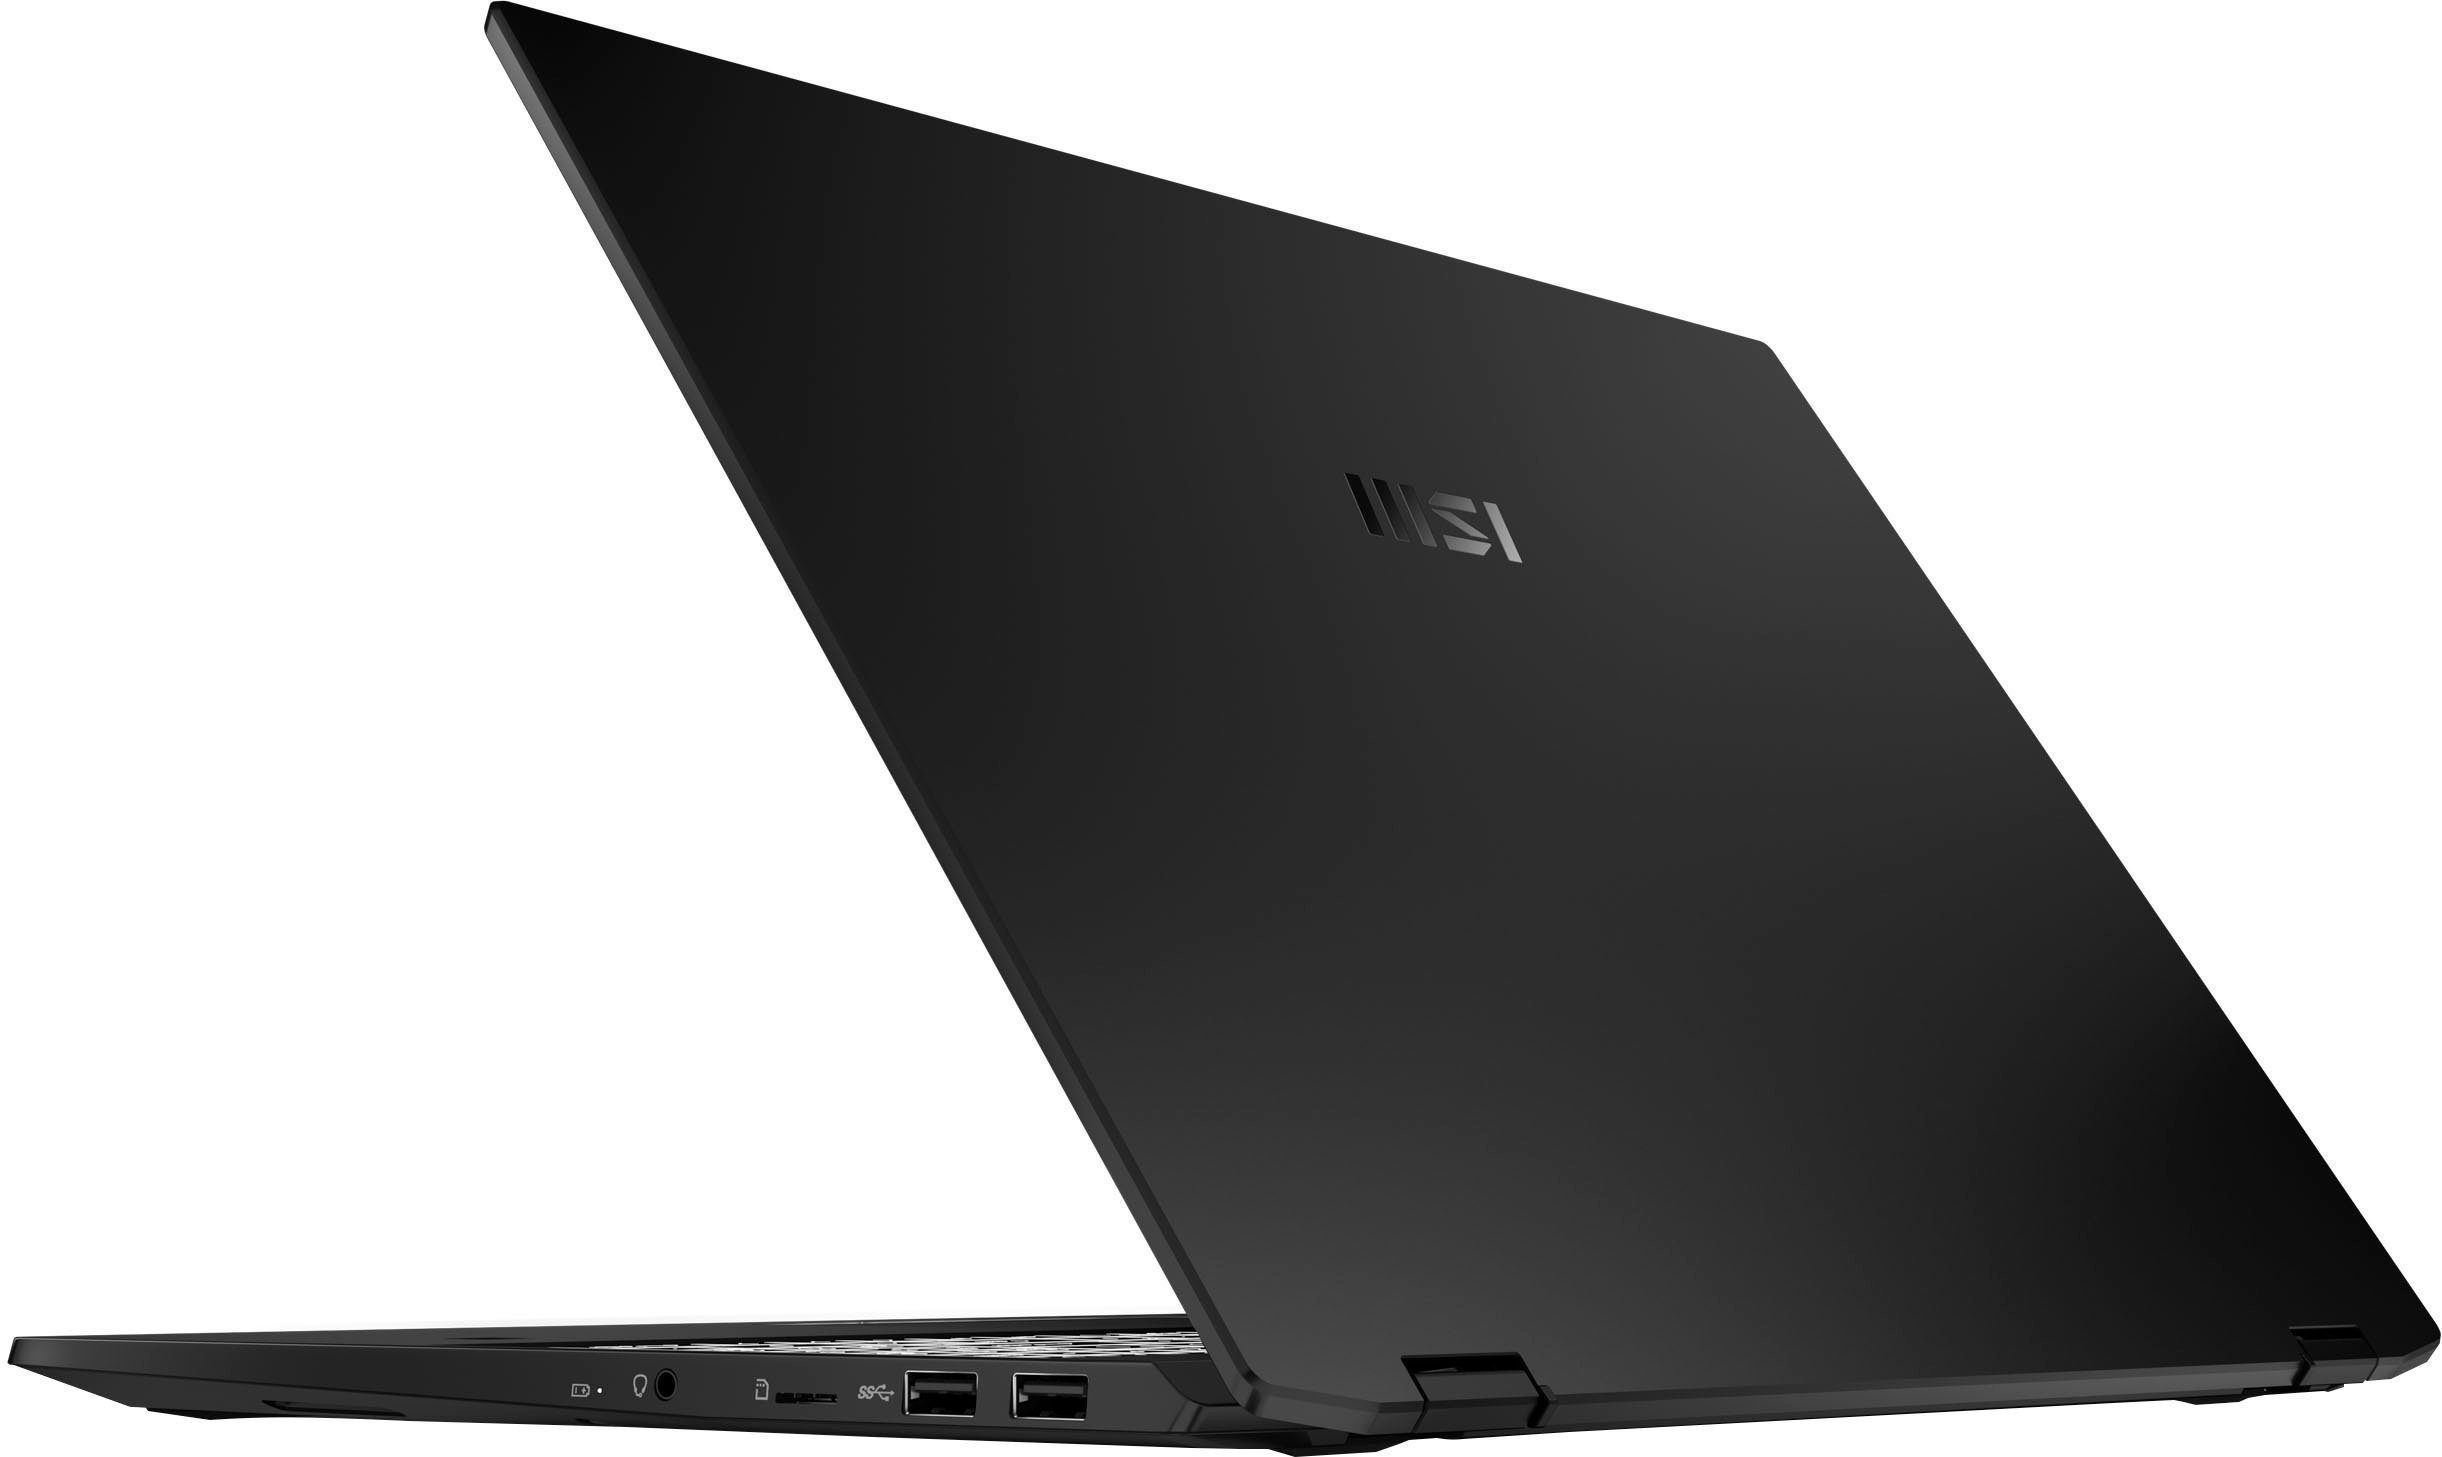
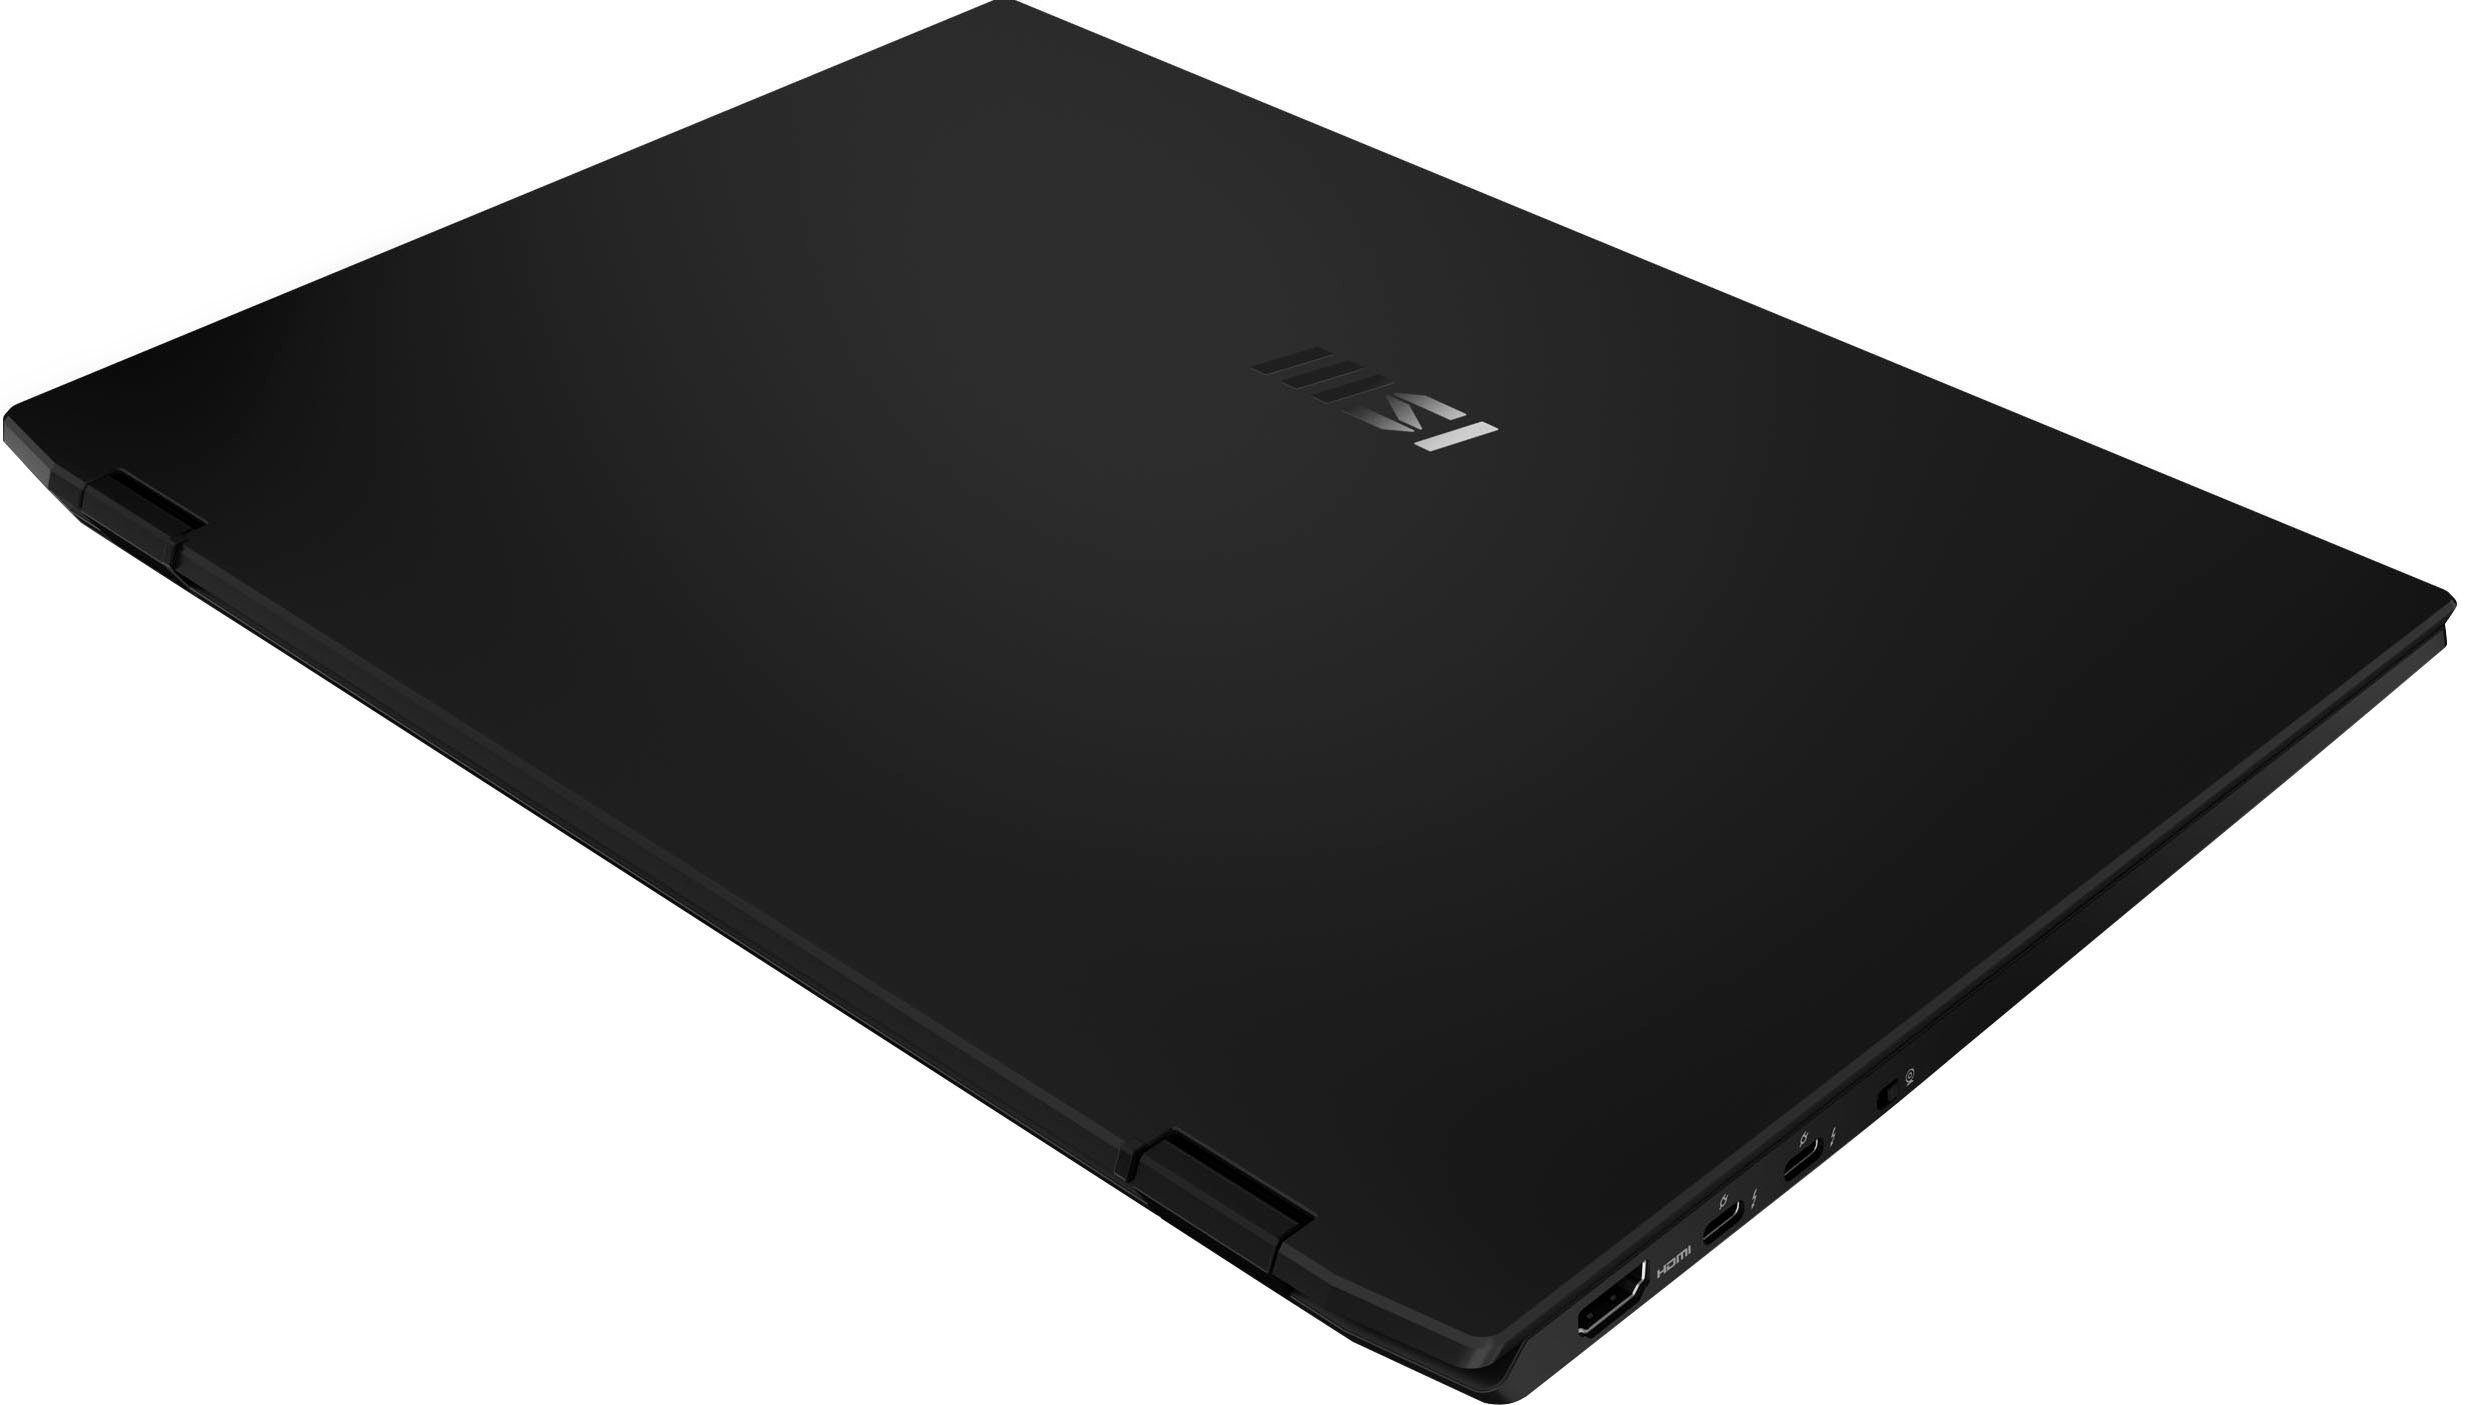
O E16 inclui duas conexões USB-A (USB 3.2 Gen 2) e duas conexões USB-C (Thunderbolt 4; Power Delivery, Displayport). O portátil de 16 polegadas oferece um total de três saídas de vídeo (2x DP, 1x HDMI). O leitor de cartões de armazenamento microSD pertence aos representantes mais rápidos de seu tipo (usando nosso cartão de armazenamento de referência AV PRO SD 128 GB V60). A webcam embutida (2,1 MP, IR, máx. 1920 x 1080 pixels) não tem uma tampa mecânica. Ao invés disso, há um botão on/off no lado esquerdo da caixa
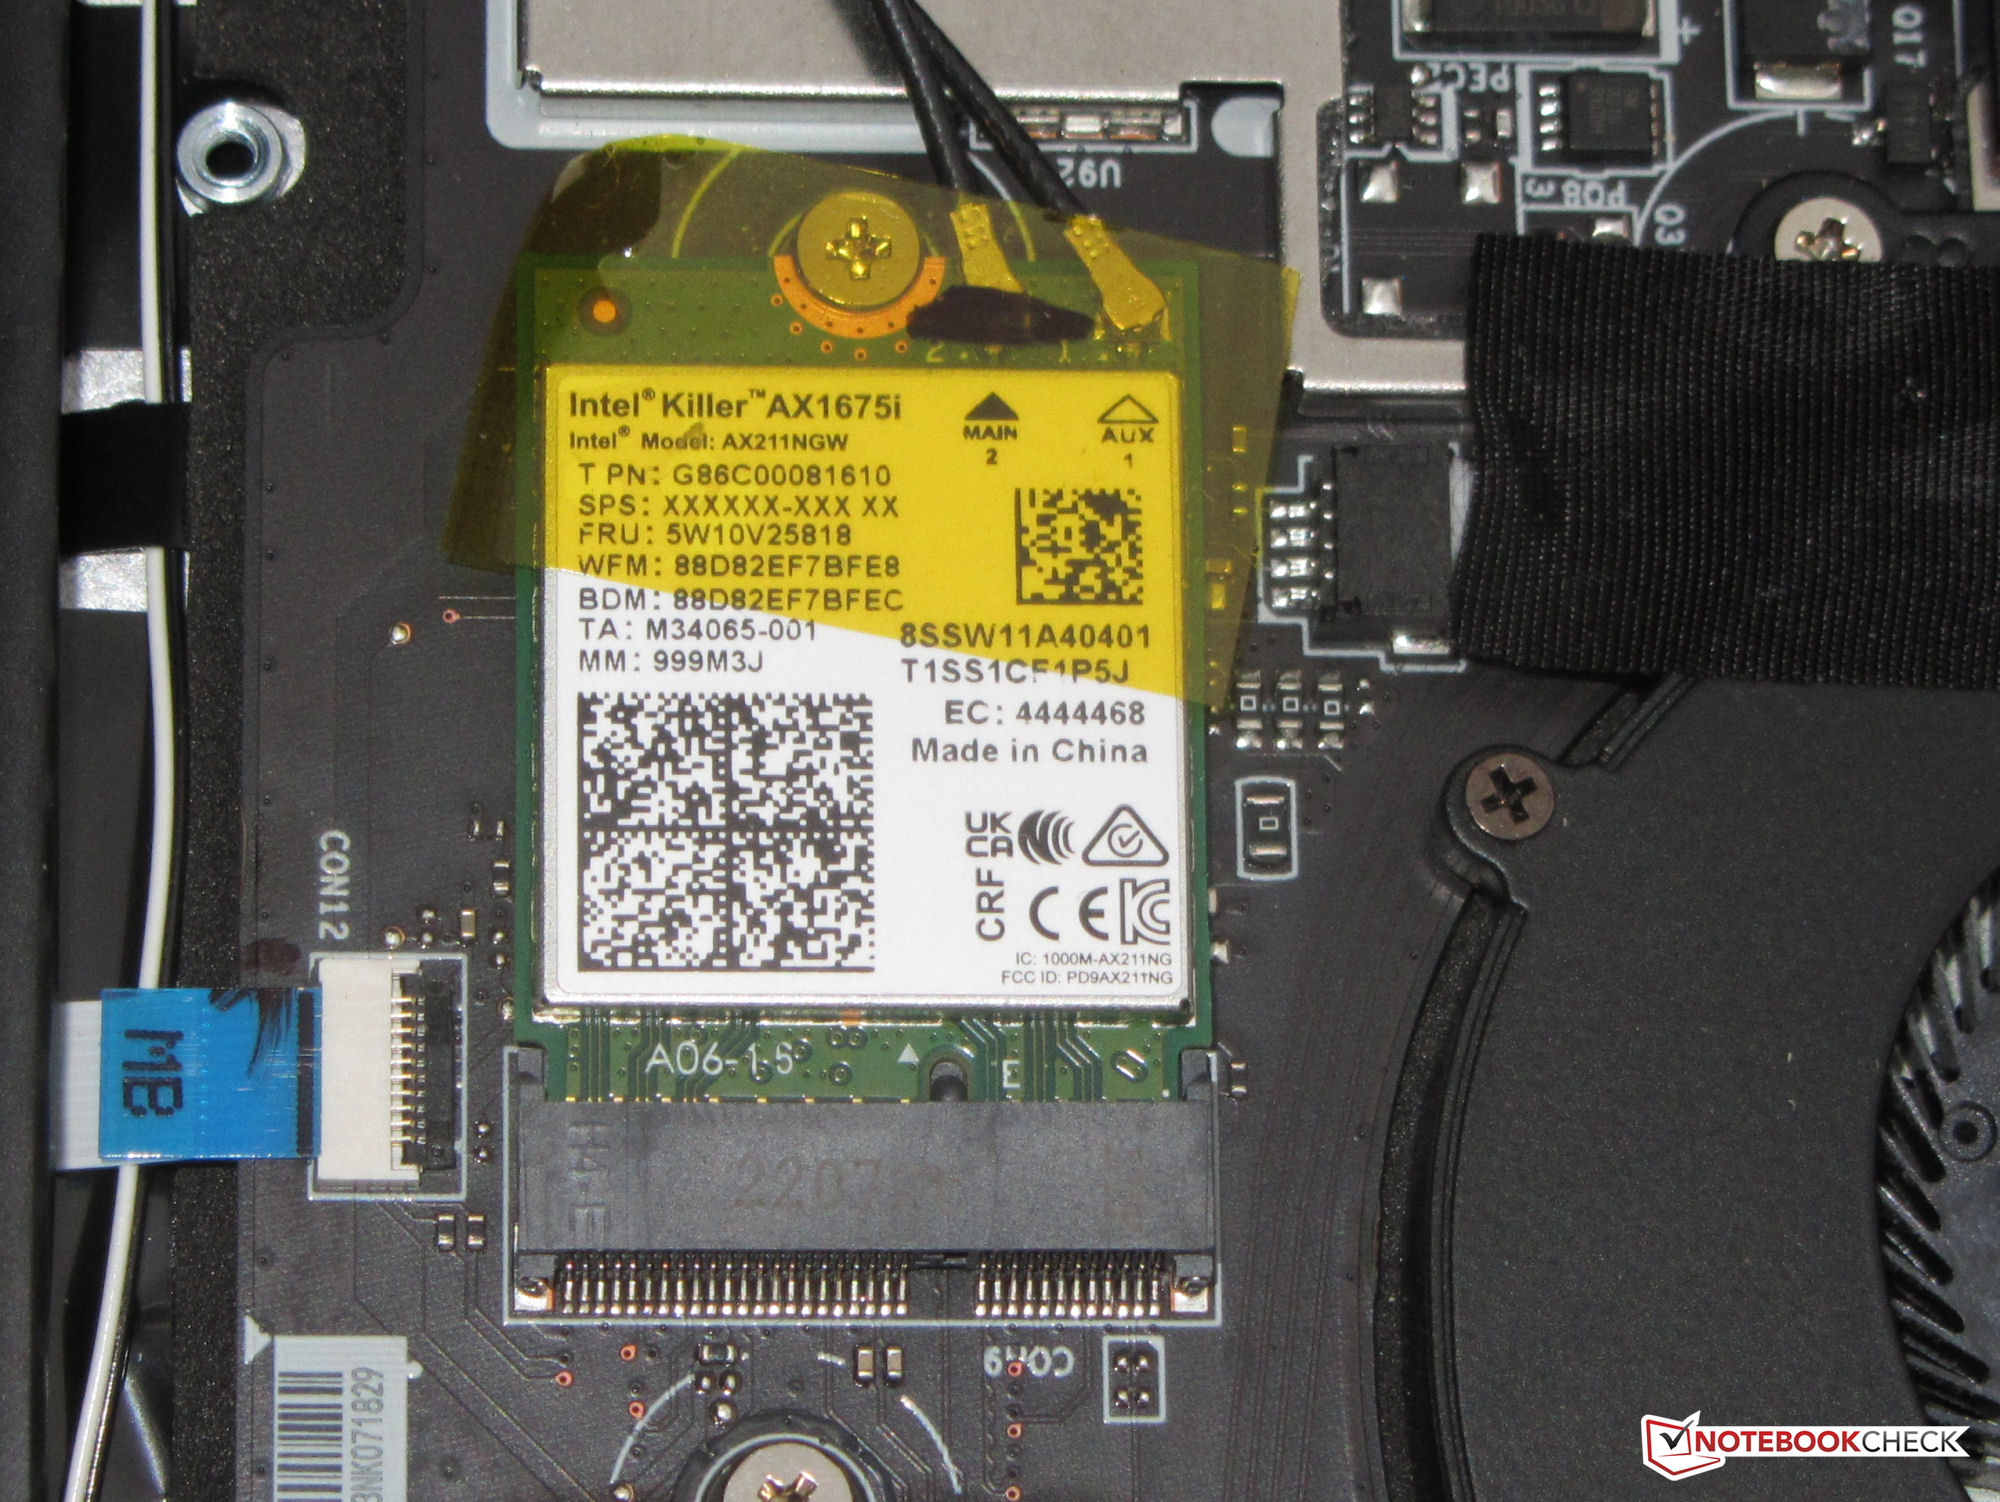
As taxas de transferência WLAN que determinamos sob condições ótimas (sem dispositivos WLAN adicionais nas proximidades e o laptop e o PC servidor nas proximidades) são excelentes e correspondem às capacidades do chip WiFi (Killer Wi-Fi 6E AX1675i; 802.11 eixos).


| SD Card Reader | |
| average JPG Copy Test (av. of 3 runs) | |
| MSI Summit E16 Flip A12UDT-031 (AV Pro SD microSD 128 GB V60) | |
| Média da turma Convertible (29.4 - 186, n=21, últimos 2 anos) | |
| Samsung Galaxy Book Pro 360 15 NP950QDB-KC3DE (AV Pro SD microSD 128 GB V60) | |
| Dell Inspiron 16 7620 2-in-1 (Toshiba Exceria Pro SDXC 64 GB UHS-II) | |
| maximum AS SSD Seq Read Test (1GB) | |
| MSI Summit E16 Flip A12UDT-031 (AV Pro SD microSD 128 GB V60) | |
| Média da turma Convertible (67.5 - 254, n=20, últimos 2 anos) | |
| Dell Inspiron 16 7620 2-in-1 (Toshiba Exceria Pro SDXC 64 GB UHS-II) | |
| Samsung Galaxy Book Pro 360 15 NP950QDB-KC3DE (AV Pro SD microSD 128 GB V60) | |


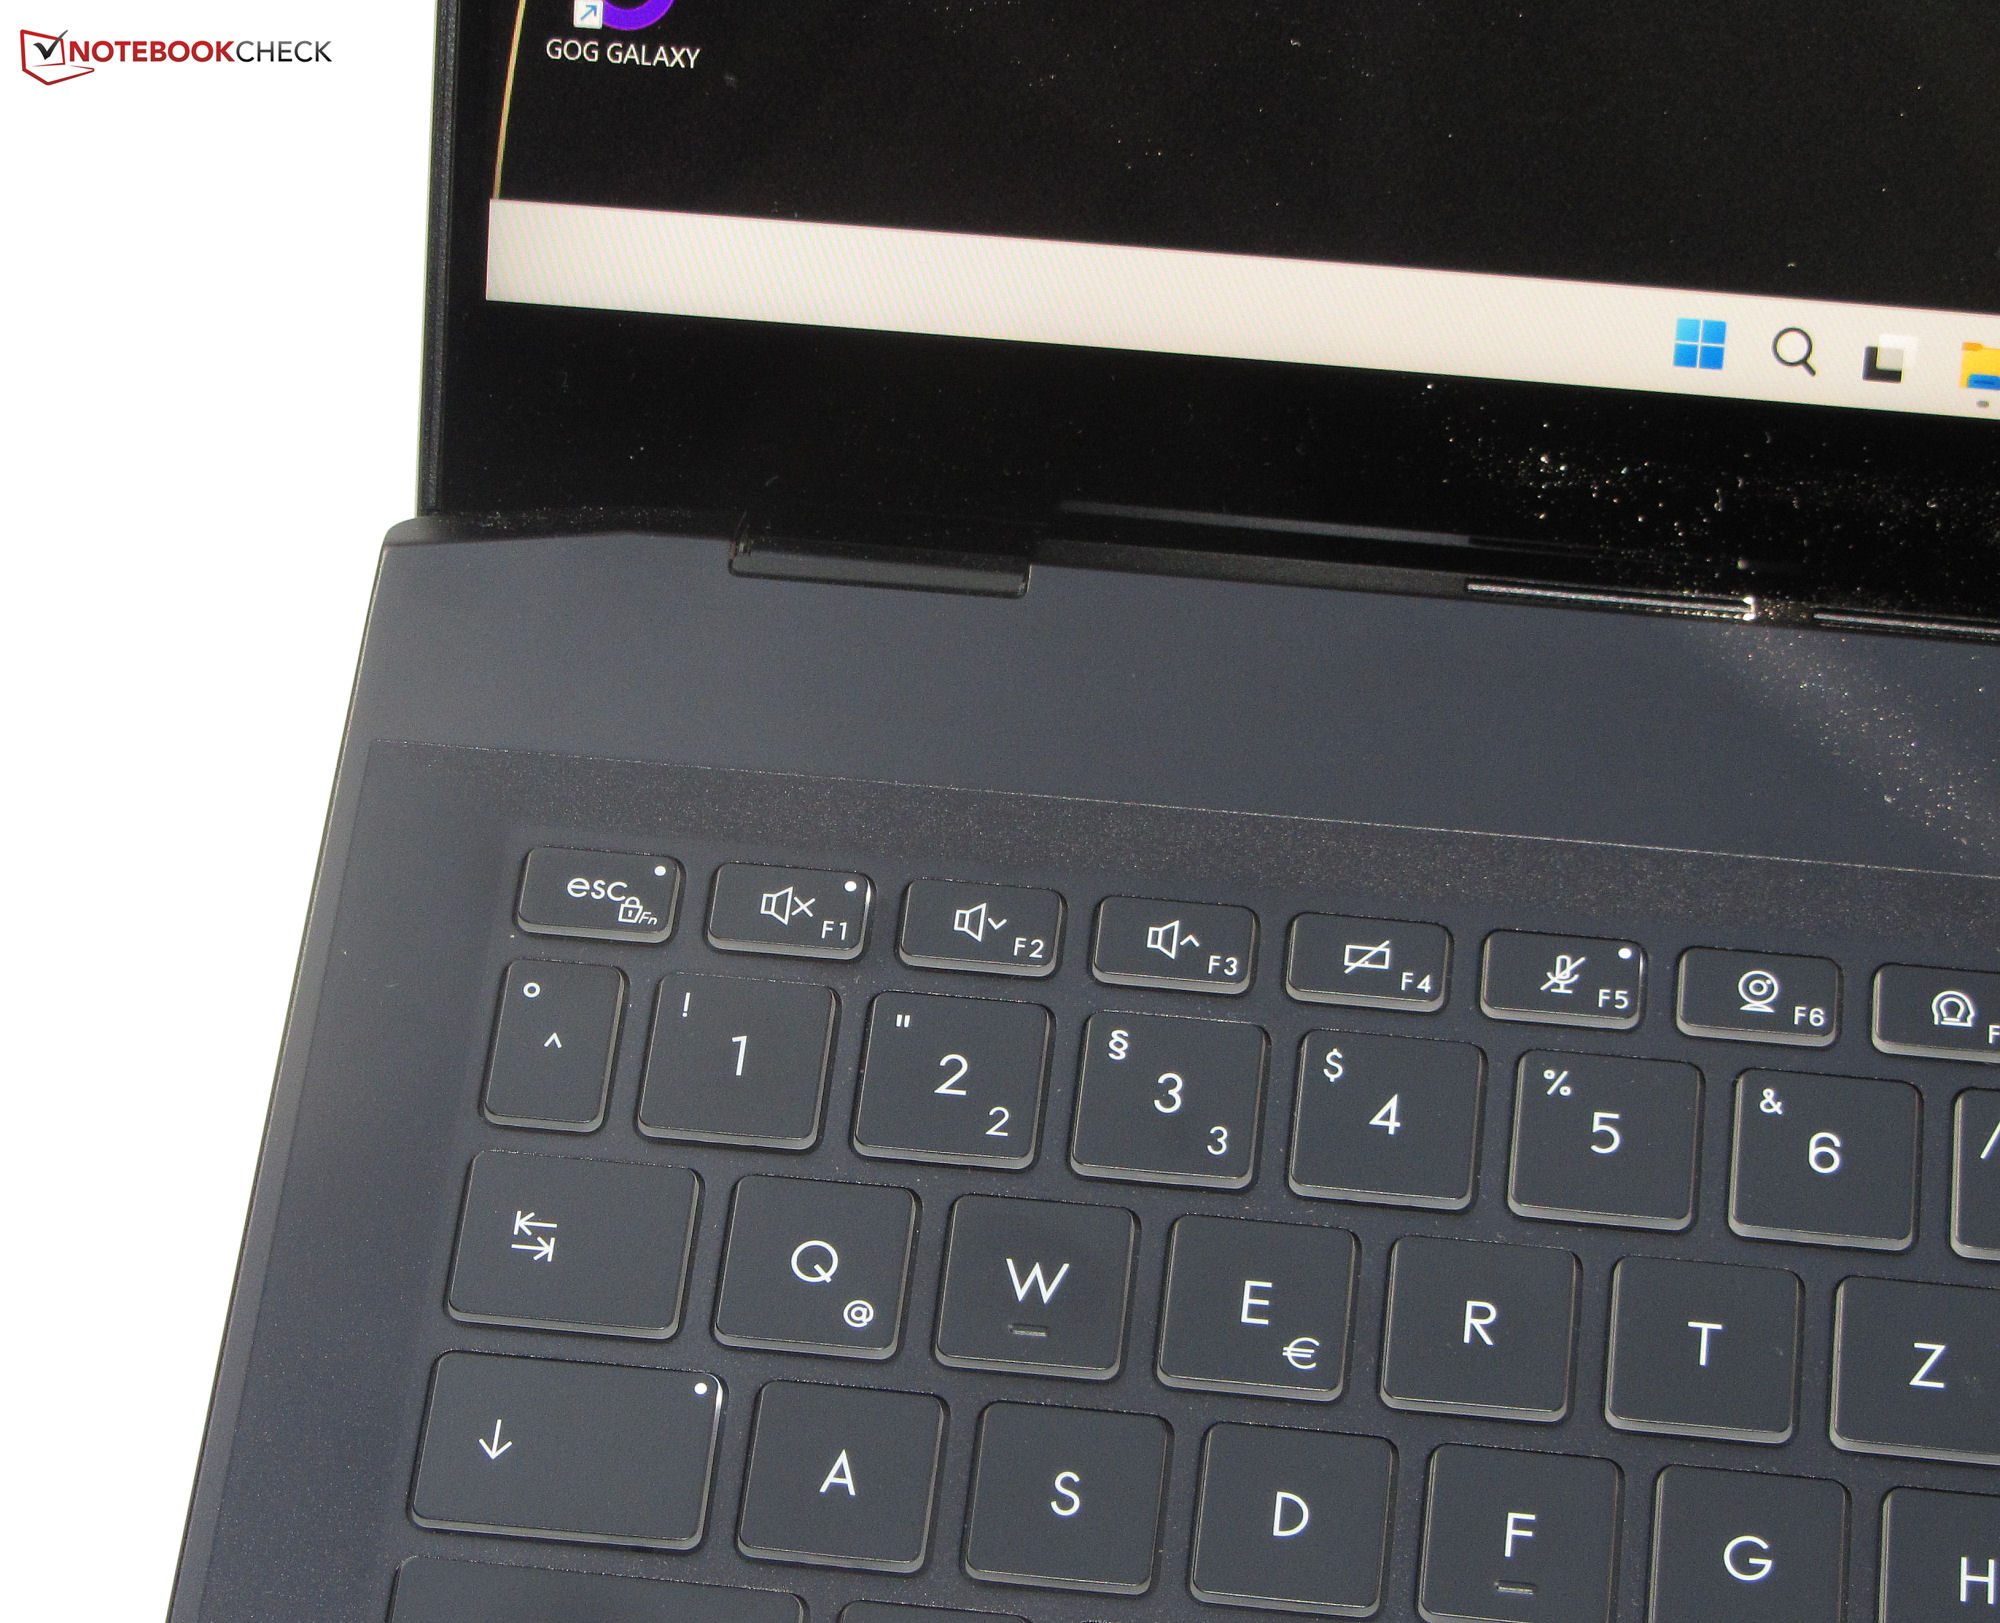
Dispositivos de entrada - A Cúpula 16 inclui uma caneta de entrada
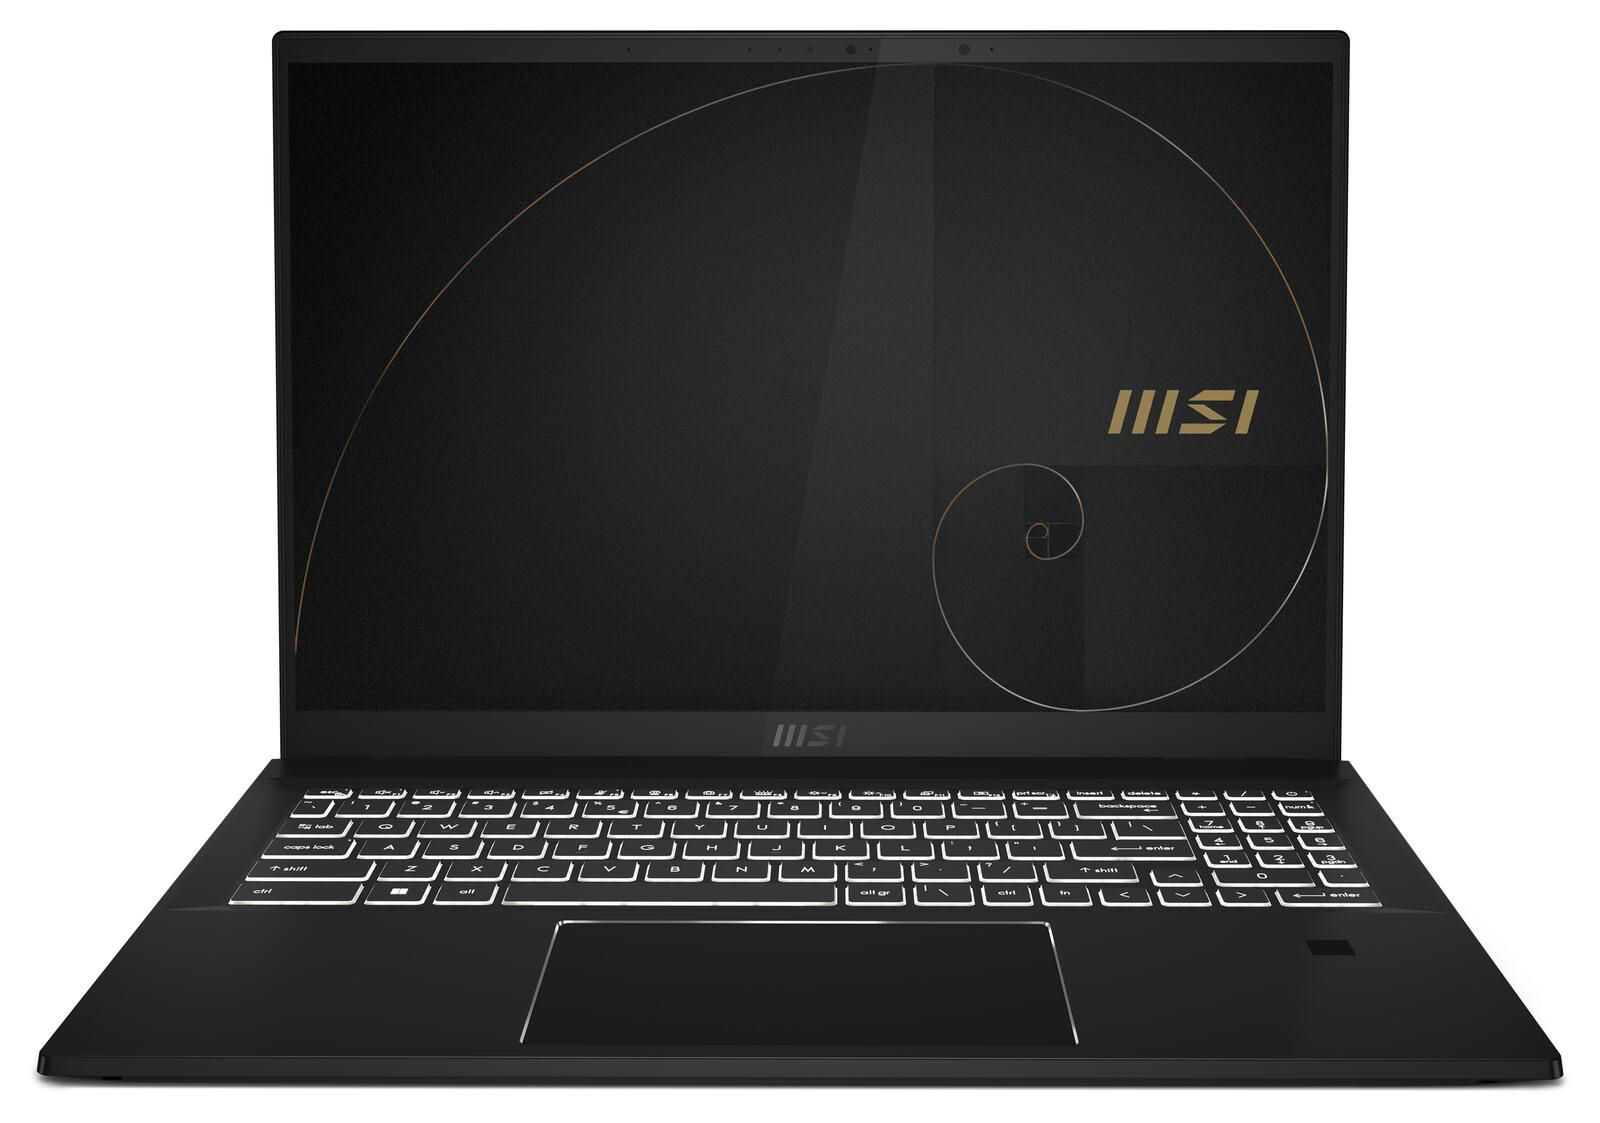
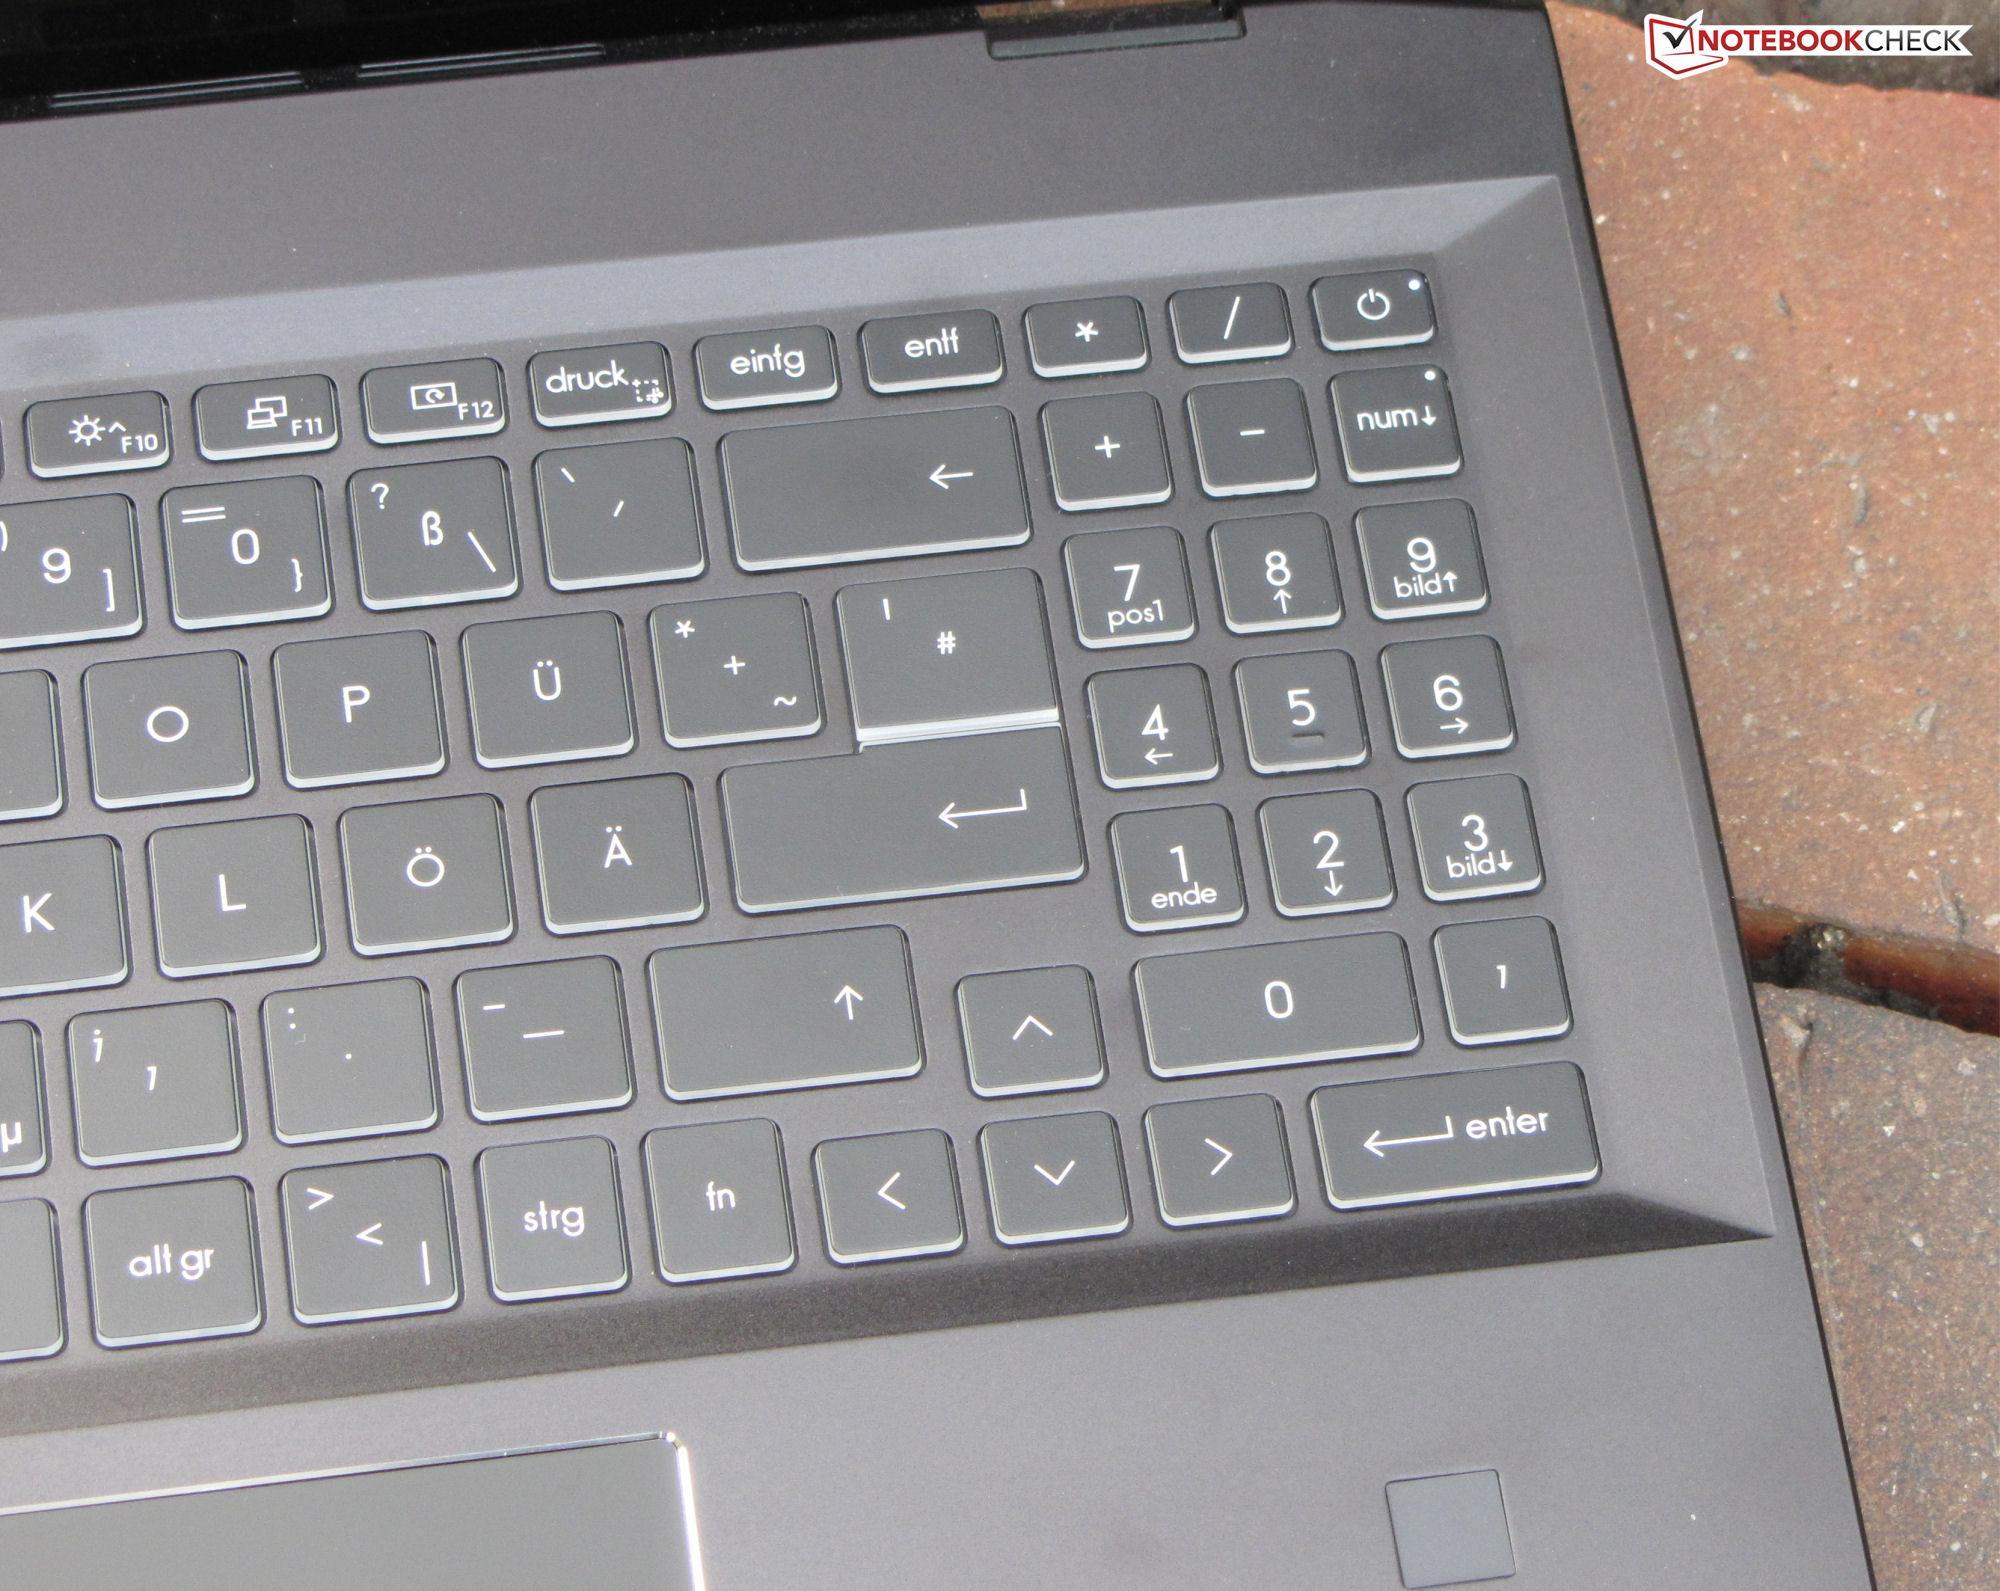
As teclas planas e suaves do teclado chiclet (iluminação em três etapas) oferecem um curso curto e um ponto de pressão claro. Nós gostamos de sua resistência. Durante a digitação, o teclado tem, no máximo, um mínimo de dar, portanto, não criou nenhum incômodo. Em geral, a MSI fornece aqui um teclado que é adequado para as tarefas diárias.
A superfície lisa do ClickPad multitouch-capable (~13 x 8,2 cm, ~5,1 x 3,2 pol.) facilita o deslizamento dos dedos. O ClickPad também responde às entradas nos cantos. Ele tem um curso curto e um ponto de pressão claro.
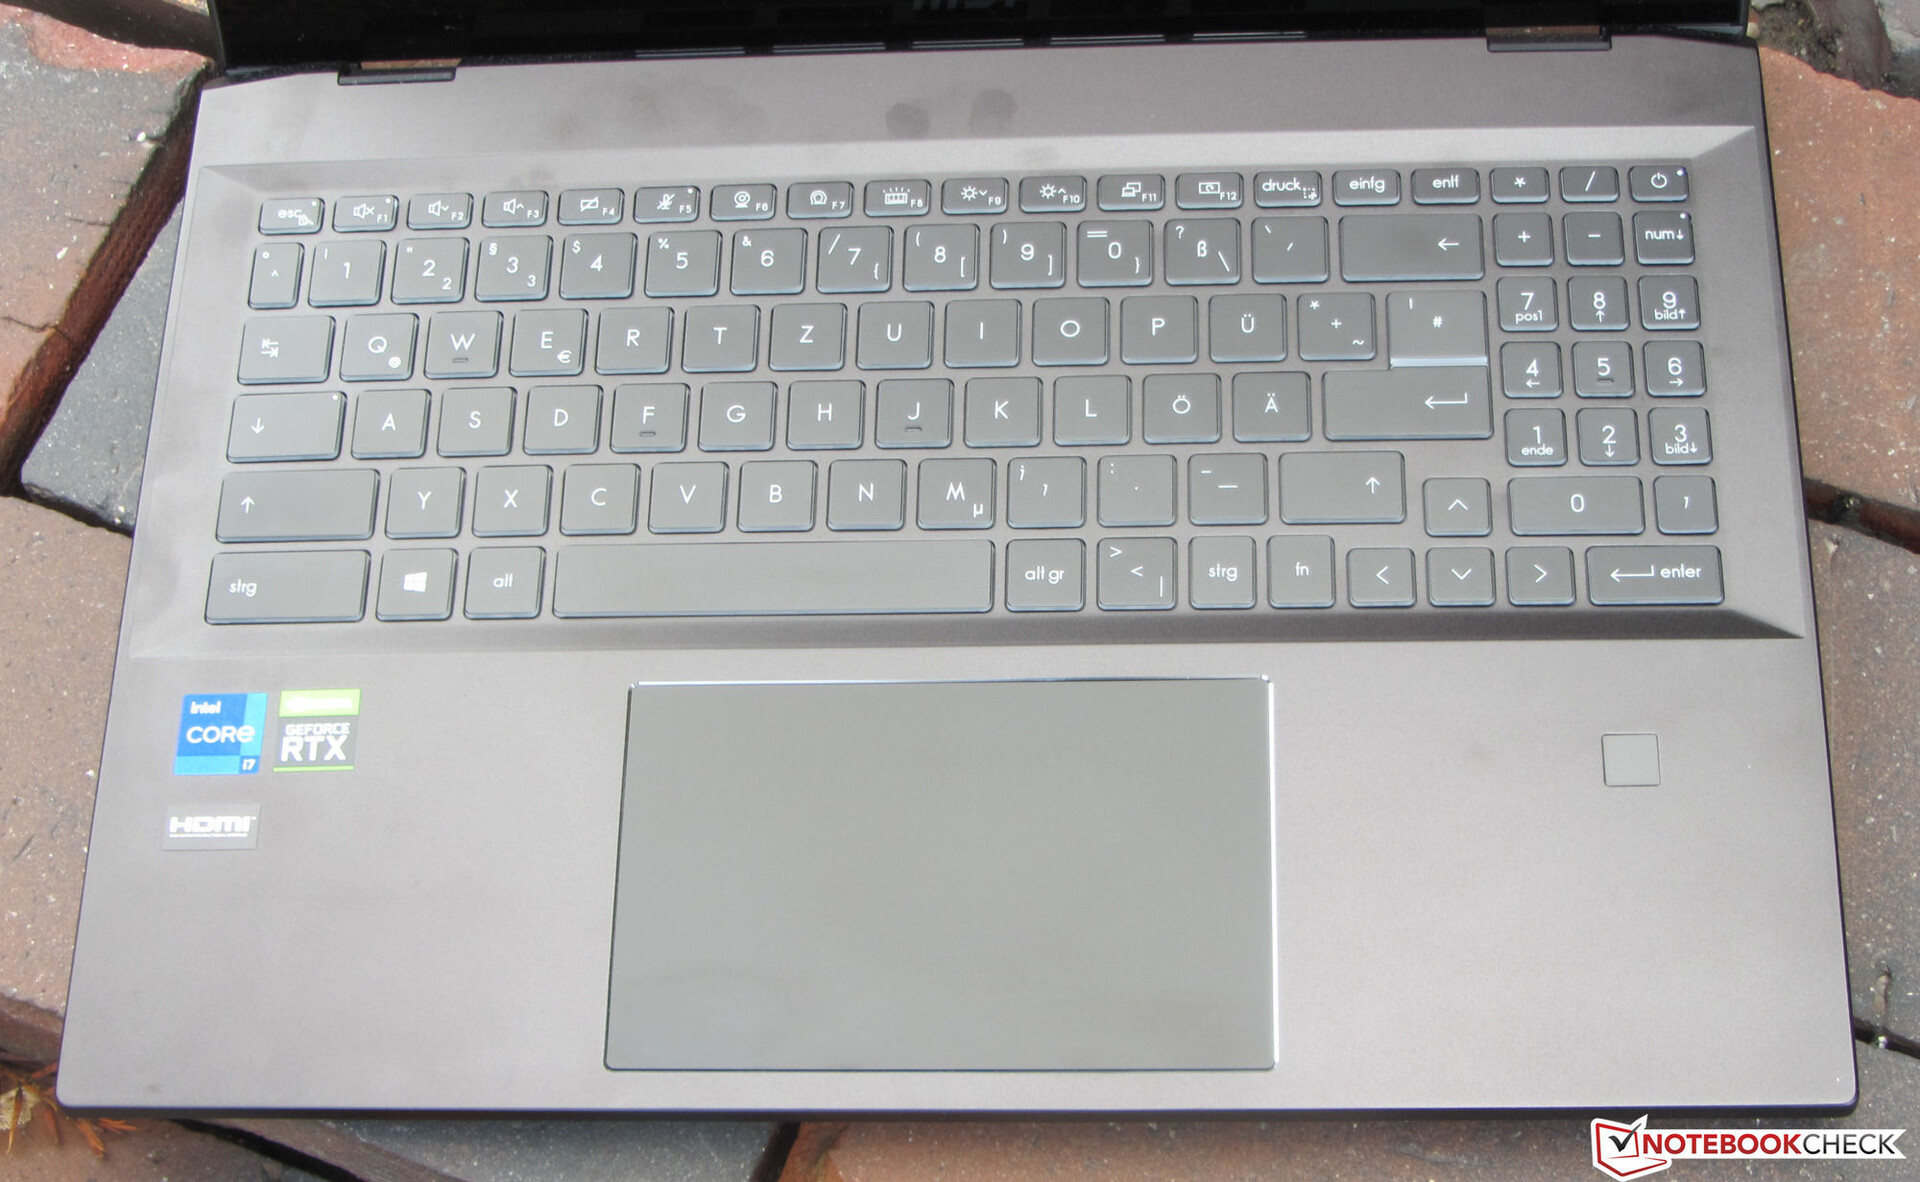
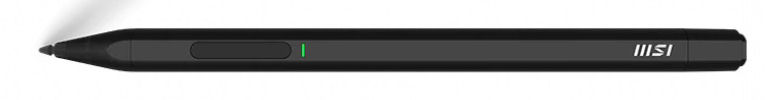
A tela sensível ao toque (10 pontos de toque) pode ser operada com os dedos ou a caneta de entrada MSI incluída (1P 14; MPP 2.0). Esta última se sente bem na mão e a ponta da caneta desliza facilmente pela tela. A caneta pode ser fixada magneticamente ao lado esquerdo da unidade base. A bateria integrada é carregada através do cabo USB-A-para-USB-C incluído. Pontas de caneta adicionais também estão incluídas.
Visor - IPS a bordo
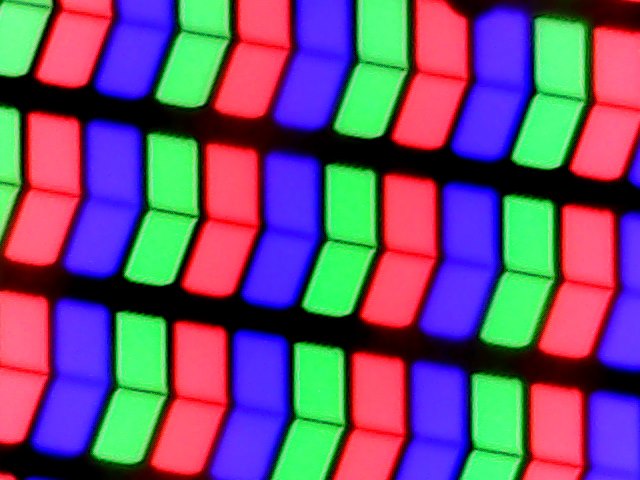
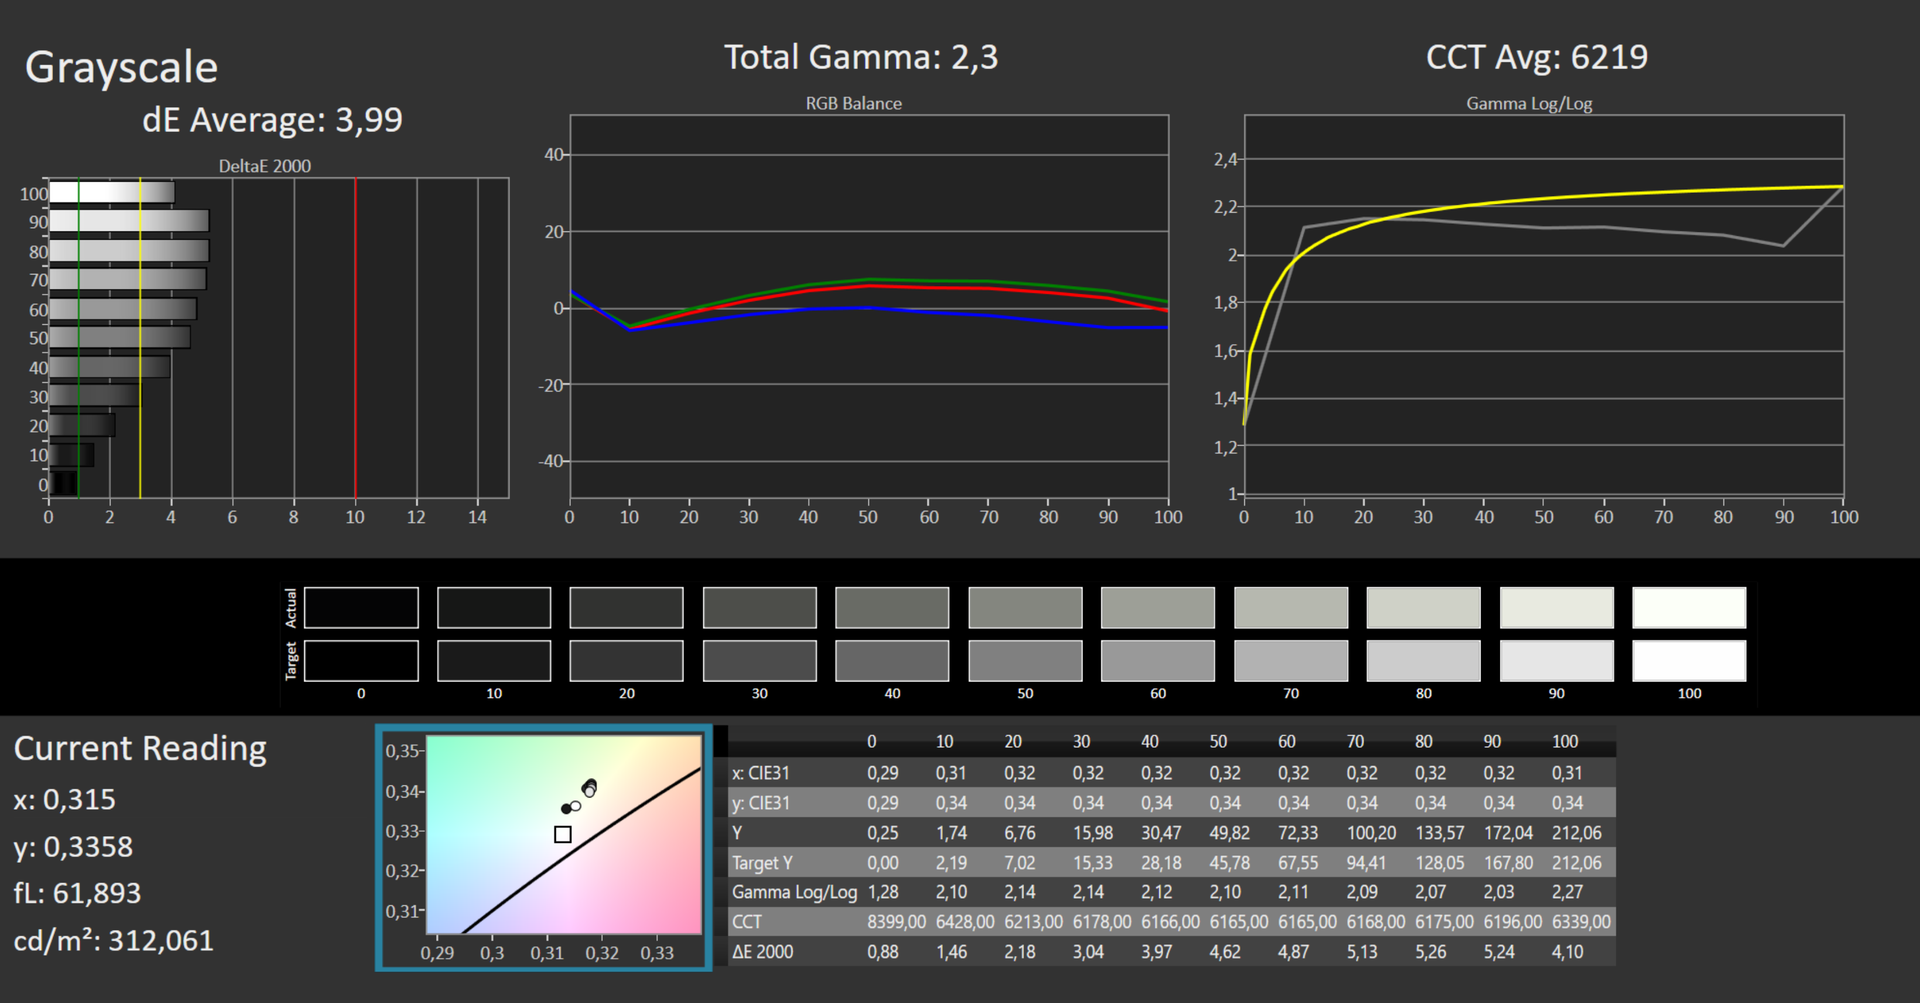
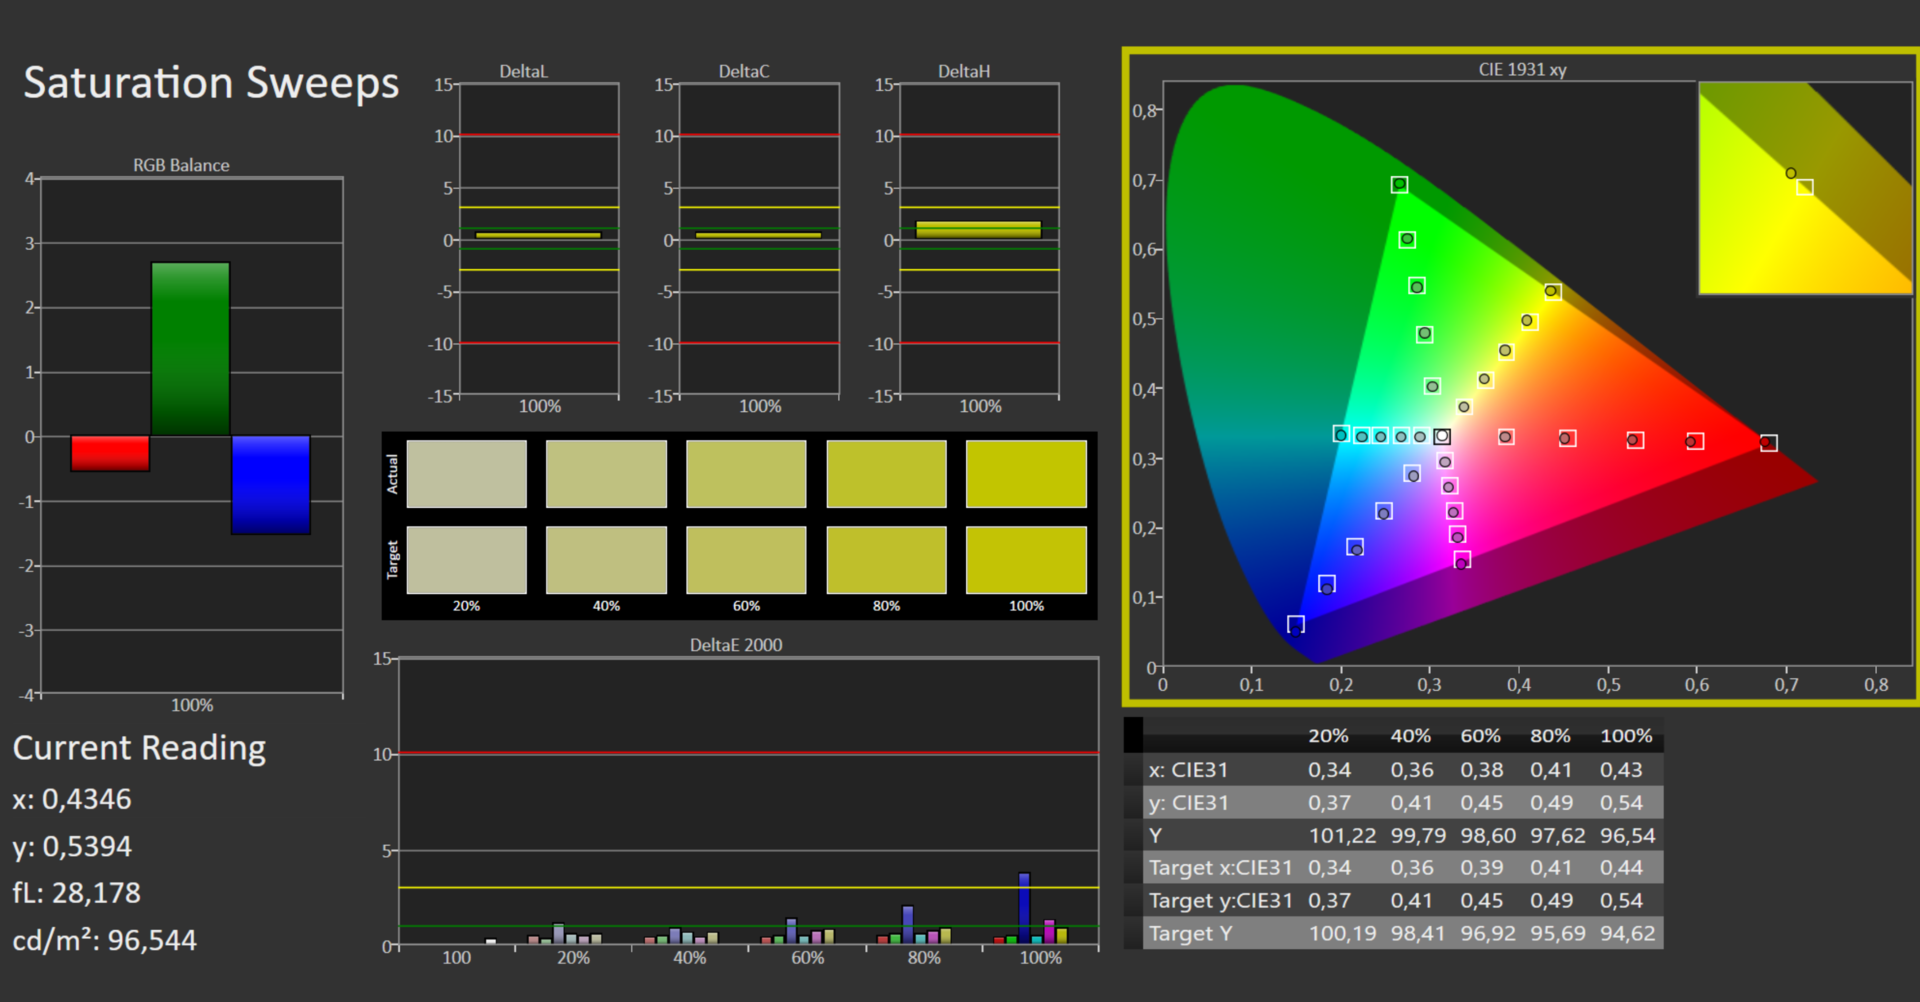
Enquanto o contraste 1121:1 do visor refletor de 16 polegadas (2560 x 1600 pixels) atinge o alvo (> 1000:1), o brilho máximo fica um pouco baixo a 294,3 cd/m². Consideramos bons valores acima de 300 cd/m². O painel de 165-Hz oferece tempos de resposta curtos. Não notamos nenhuma cintilação do PWM.
| |||||||||||||||||||||||||
iluminação: 89 %
iluminação com acumulador: 314 cd/m²
Contraste: 1121:1 (Preto: 0.28 cd/m²)
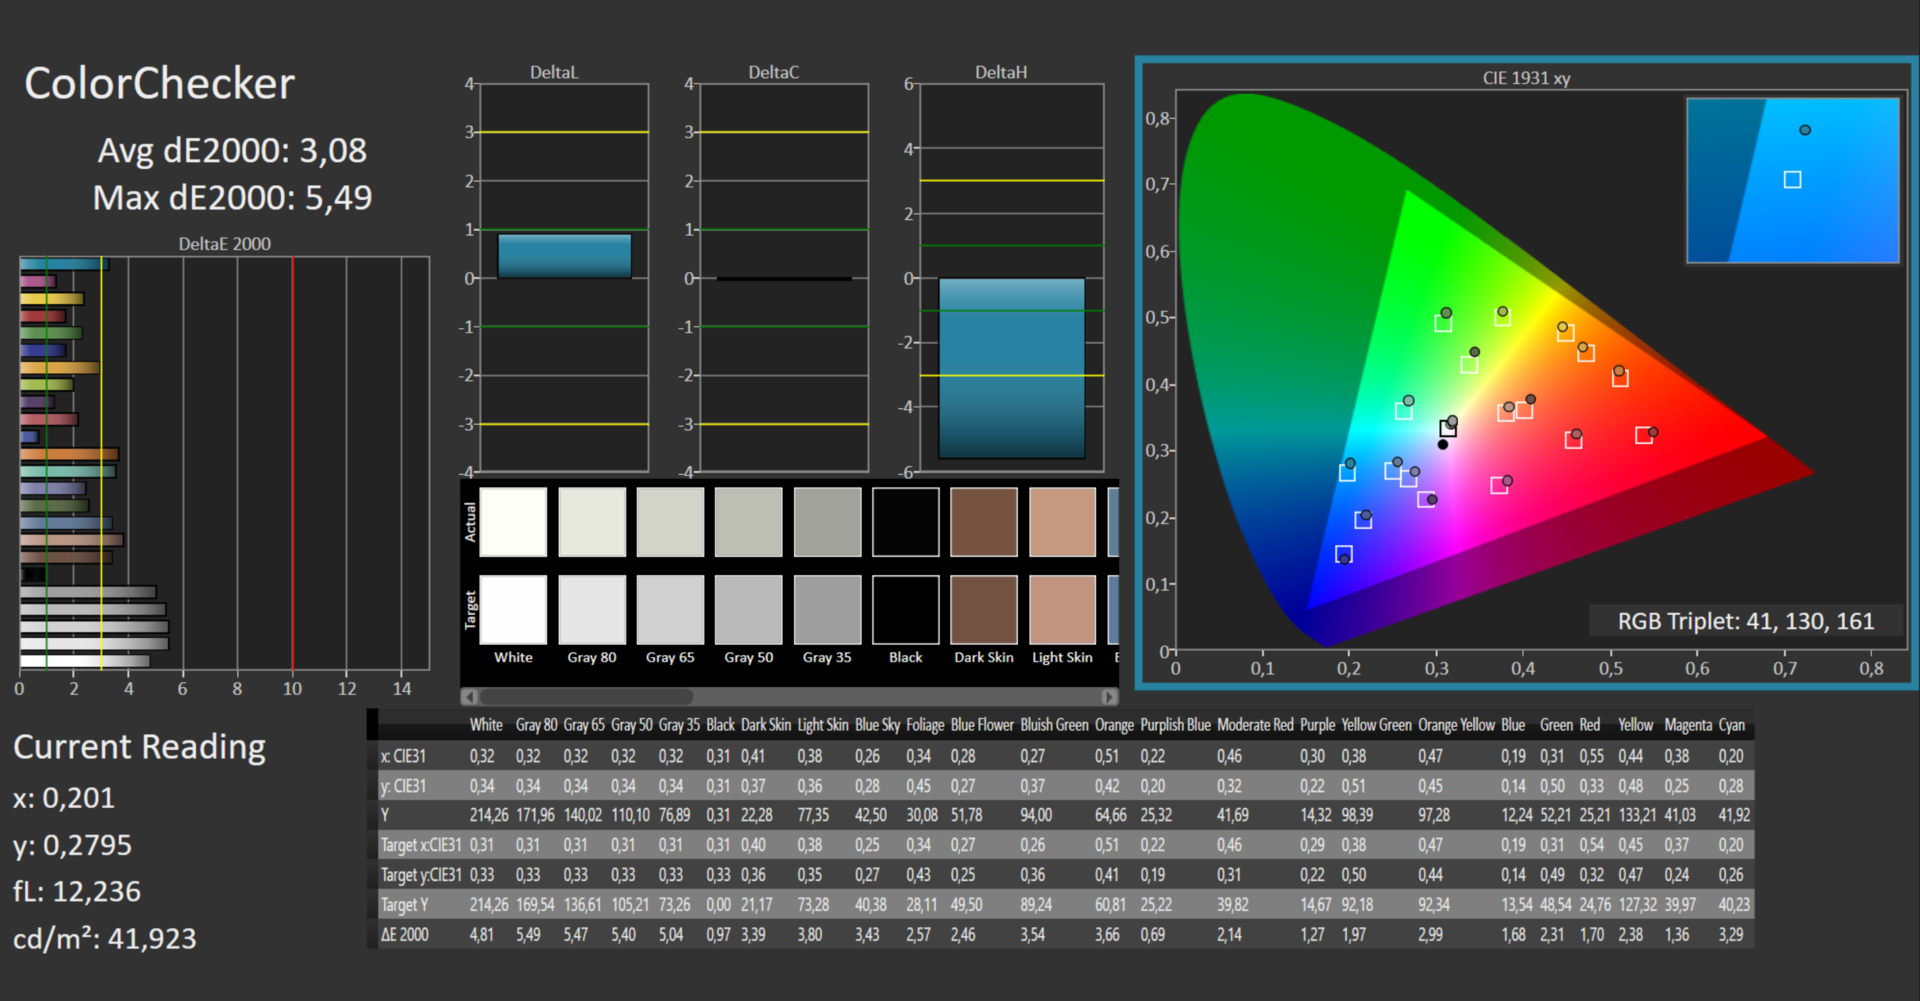
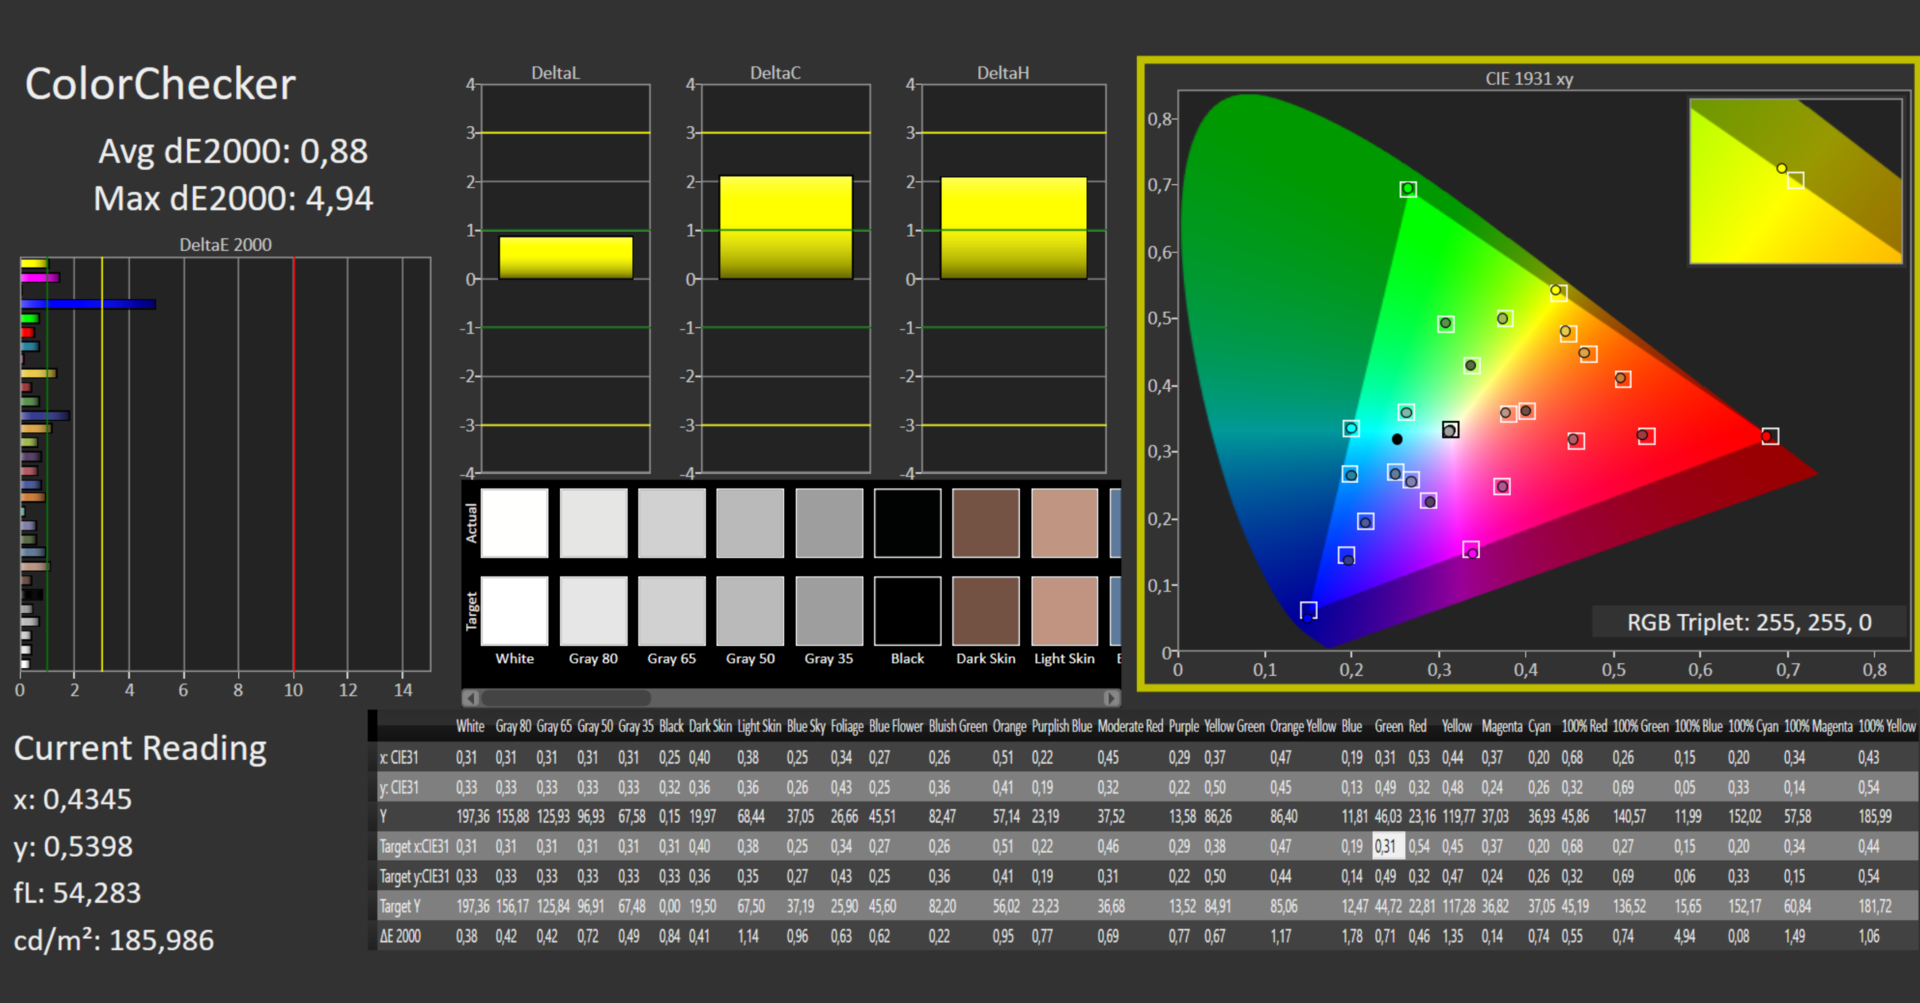
ΔE ColorChecker Calman: 3.08 | ∀{0.5-29.43 Ø4.71}
calibrated: 0.88
ΔE Greyscale Calman: 3.99 | ∀{0.09-98 Ø4.96}
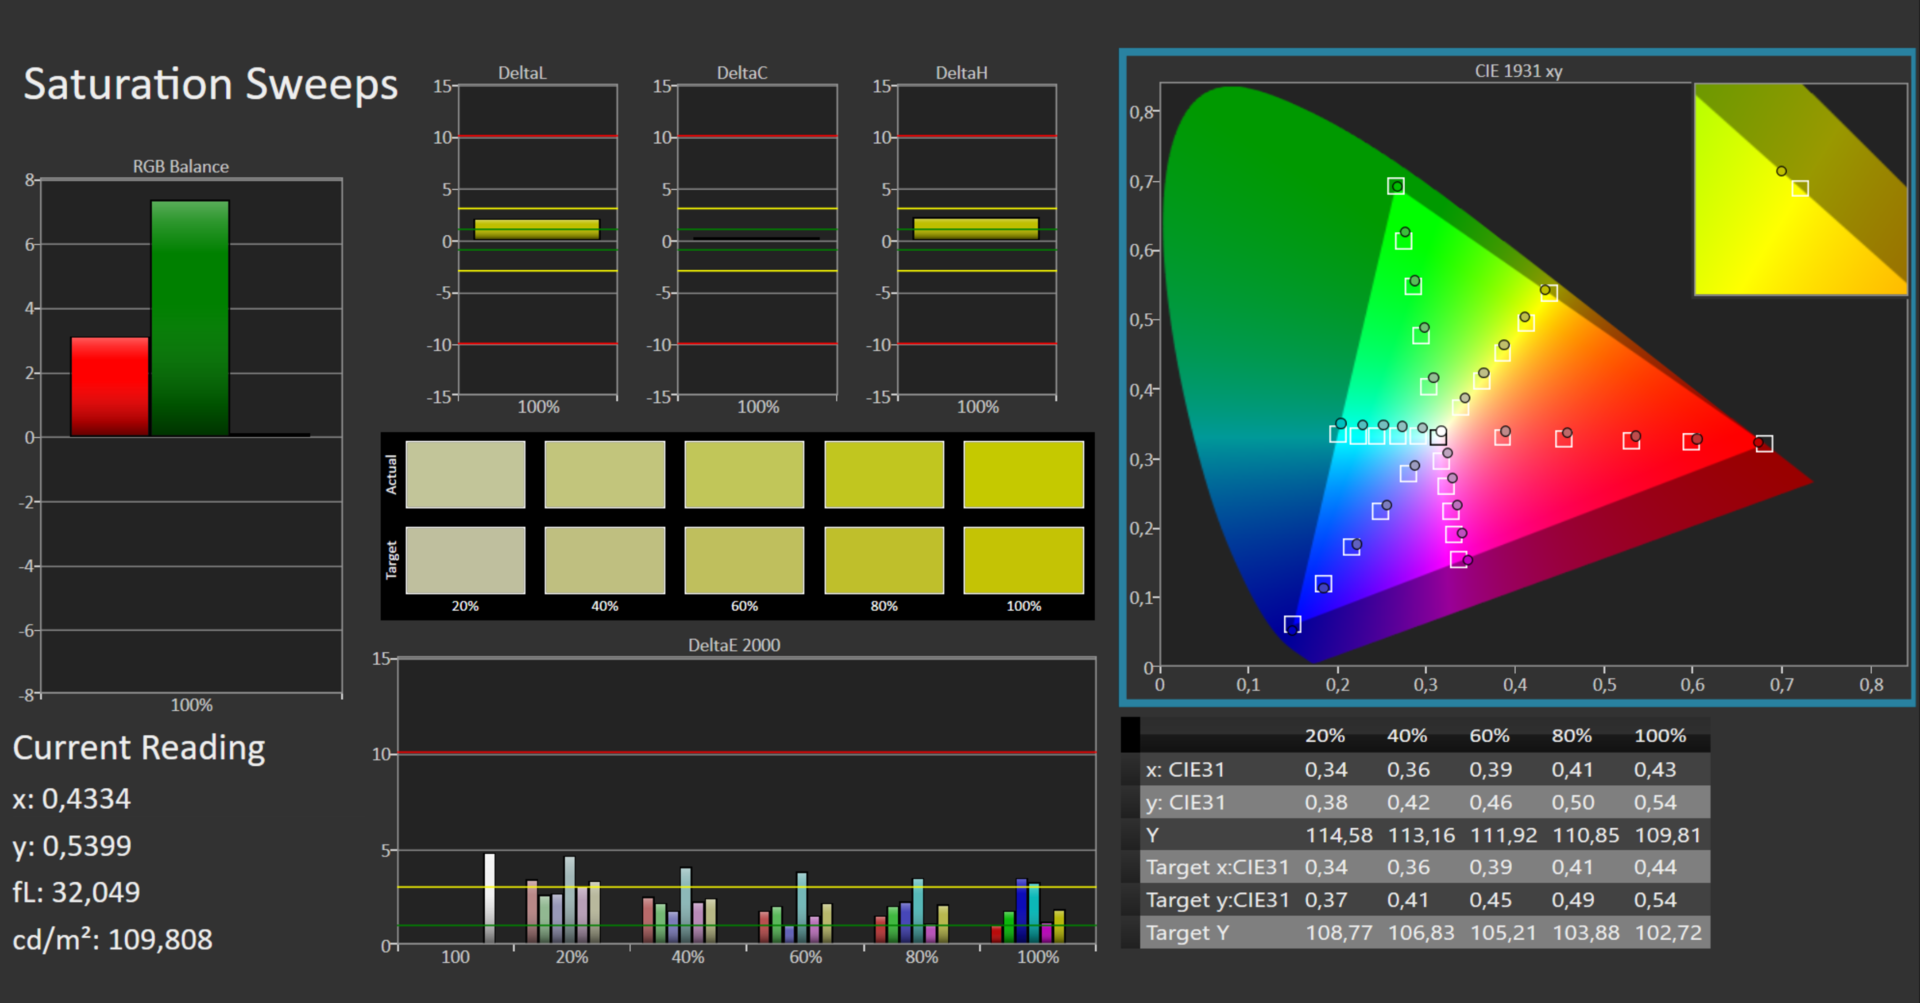
86.5% AdobeRGB 1998 (Argyll 3D)
100% sRGB (Argyll 3D)
98.9% Display P3 (Argyll 3D)
Gamma: 2.3
CCT: 6219 K
| MSI Summit E16 Flip A12UDT-031 AU Optronics B16QAN02.N, IPS, 2560x1600, 16" | Asus ExpertBook B2 Flip B2502FBA-N80141X AU Optronics B156HAN02.1, IPS, 1920x1080, 15.6" | Samsung Galaxy Book Pro 360 15 NP950QDB-KC3DE SDC4159, OLED, 1920x1080, 15.6" | Dell Inspiron 16 7620 2-in-1 BOE NV16N45, IPS, 1920x1200, 16" | |
|---|---|---|---|---|
| Display | -54% | 5% | -19% | |
| Display P3 Coverage (%) | 98.9 | 37.2 -62% | 99.9 1% | 67 -32% |
| sRGB Coverage (%) | 100 | 55.8 -44% | 100 0% | 95.9 -4% |
| AdobeRGB 1998 Coverage (%) | 86.5 | 38.4 -56% | 97.6 13% | 69.3 -20% |
| Response Times | -101% | 82% | -139% | |
| Response Time Grey 50% / Grey 80% * (ms) | 13 ? | 32 ? -146% | 2 ? 85% | 32 ? -146% |
| Response Time Black / White * (ms) | 9 ? | 14 ? -56% | 2 ? 78% | 20.8 ? -131% |
| PWM Frequency (Hz) | 60 | |||
| Screen | -68% | 48% | -20% | |
| Brightness middle (cd/m²) | 314 | 239 -24% | 290 -8% | 320.7 2% |
| Brightness (cd/m²) | 294 | 221 -25% | 290 -1% | 309 5% |
| Brightness Distribution (%) | 89 | 89 0% | 99 11% | 90 1% |
| Black Level * (cd/m²) | 0.28 | 0.51 -82% | 0.05 82% | 0.36 -29% |
| Contrast (:1) | 1121 | 469 -58% | 5800 417% | 891 -21% |
| Colorchecker dE 2000 * | 3.08 | 5.66 -84% | 1.84 40% | 4.18 -36% |
| Colorchecker dE 2000 max. * | 5.49 | 20.35 -271% | 3.83 30% | 8.48 -54% |
| Colorchecker dE 2000 calibrated * | 0.88 | 2.69 -206% | 0.77 12% | |
| Greyscale dE 2000 * | 3.99 | 3.89 3% | 1.24 69% | 6.3 -58% |
| Gamma | 2.3 96% | 2.43 91% | 2.2 100% | 2.21 100% |
| CCT | 6219 105% | 6183 105% | 6686 97% | 6258 104% |
| Média Total (Programa/Configurações) | -74% /
-70% | 45% /
44% | -59% /
-37% |
* ... menor é melhor
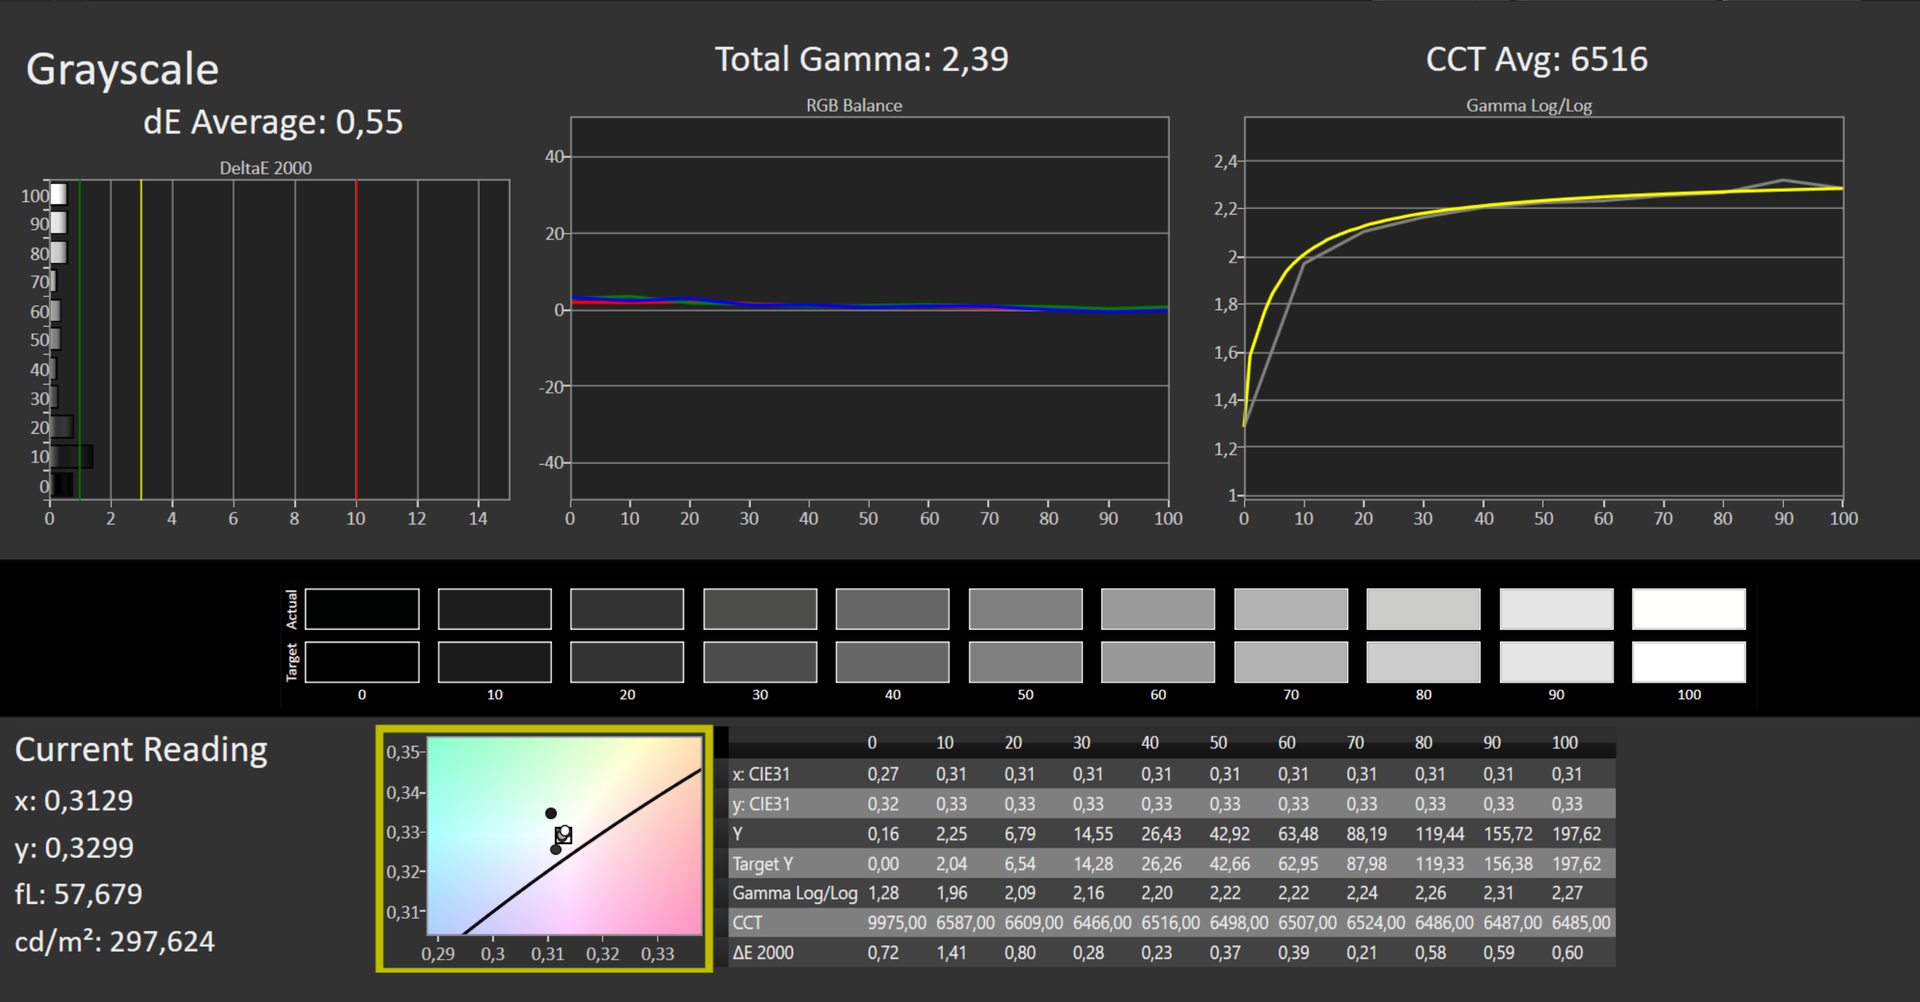
No estado de entrega, a tela exibe as cores com muita precisão. Com um valor de 3,08, o desvio de cor mal falha o alvo do DeltaE < 3. Uma calibração reduz o desvio para 0,88 e garante uma exibição mais equilibrada da escala de cinza. O espaço de cor sRGB é reproduzido completamente, o espaço de cor DCI P3 quase completamente e o espaço de cor Adobe RGB para 87%.
Você pode baixar e usar o perfil de cor que criamos gratuitamente. O link está na caixa de informações acima no display
Exibir tempos de resposta
| ↔ Tempo de resposta preto para branco | ||
|---|---|---|
| 9 ms ... ascensão ↗ e queda ↘ combinadas | ↗ 5 ms ascensão |  |
| ↘ 4 ms queda | ||
| A tela mostra taxas de resposta rápidas em nossos testes e deve ser adequada para jogos. Em comparação, todos os dispositivos testados variam de 0.1 (mínimo) a 240 (máximo) ms. » 25 % de todos os dispositivos são melhores. Isso significa que o tempo de resposta medido é melhor que a média de todos os dispositivos testados (19.8 ms). | ||
| ↔ Tempo de resposta 50% cinza a 80% cinza | ||
| 13 ms ... ascensão ↗ e queda ↘ combinadas | ↗ 6 ms ascensão |  |
| ↘ 7 ms queda | ||
| A tela mostra boas taxas de resposta em nossos testes, mas pode ser muito lenta para jogadores competitivos. Em comparação, todos os dispositivos testados variam de 0.165 (mínimo) a 636 (máximo) ms. » 27 % de todos os dispositivos são melhores. Isso significa que o tempo de resposta medido é melhor que a média de todos os dispositivos testados (30.9 ms). | ||
Cintilação da tela / PWM (modulação por largura de pulso)
| Tela tremeluzindo / PWM não detectado |  | ||
[pwm_comparison] Em comparação: 52 % de todos os dispositivos testados não usam PWM para escurecer a tela. Se PWM foi detectado, uma média de 7748 (mínimo: 5 - máximo: 343500) Hz foi medida. | |||
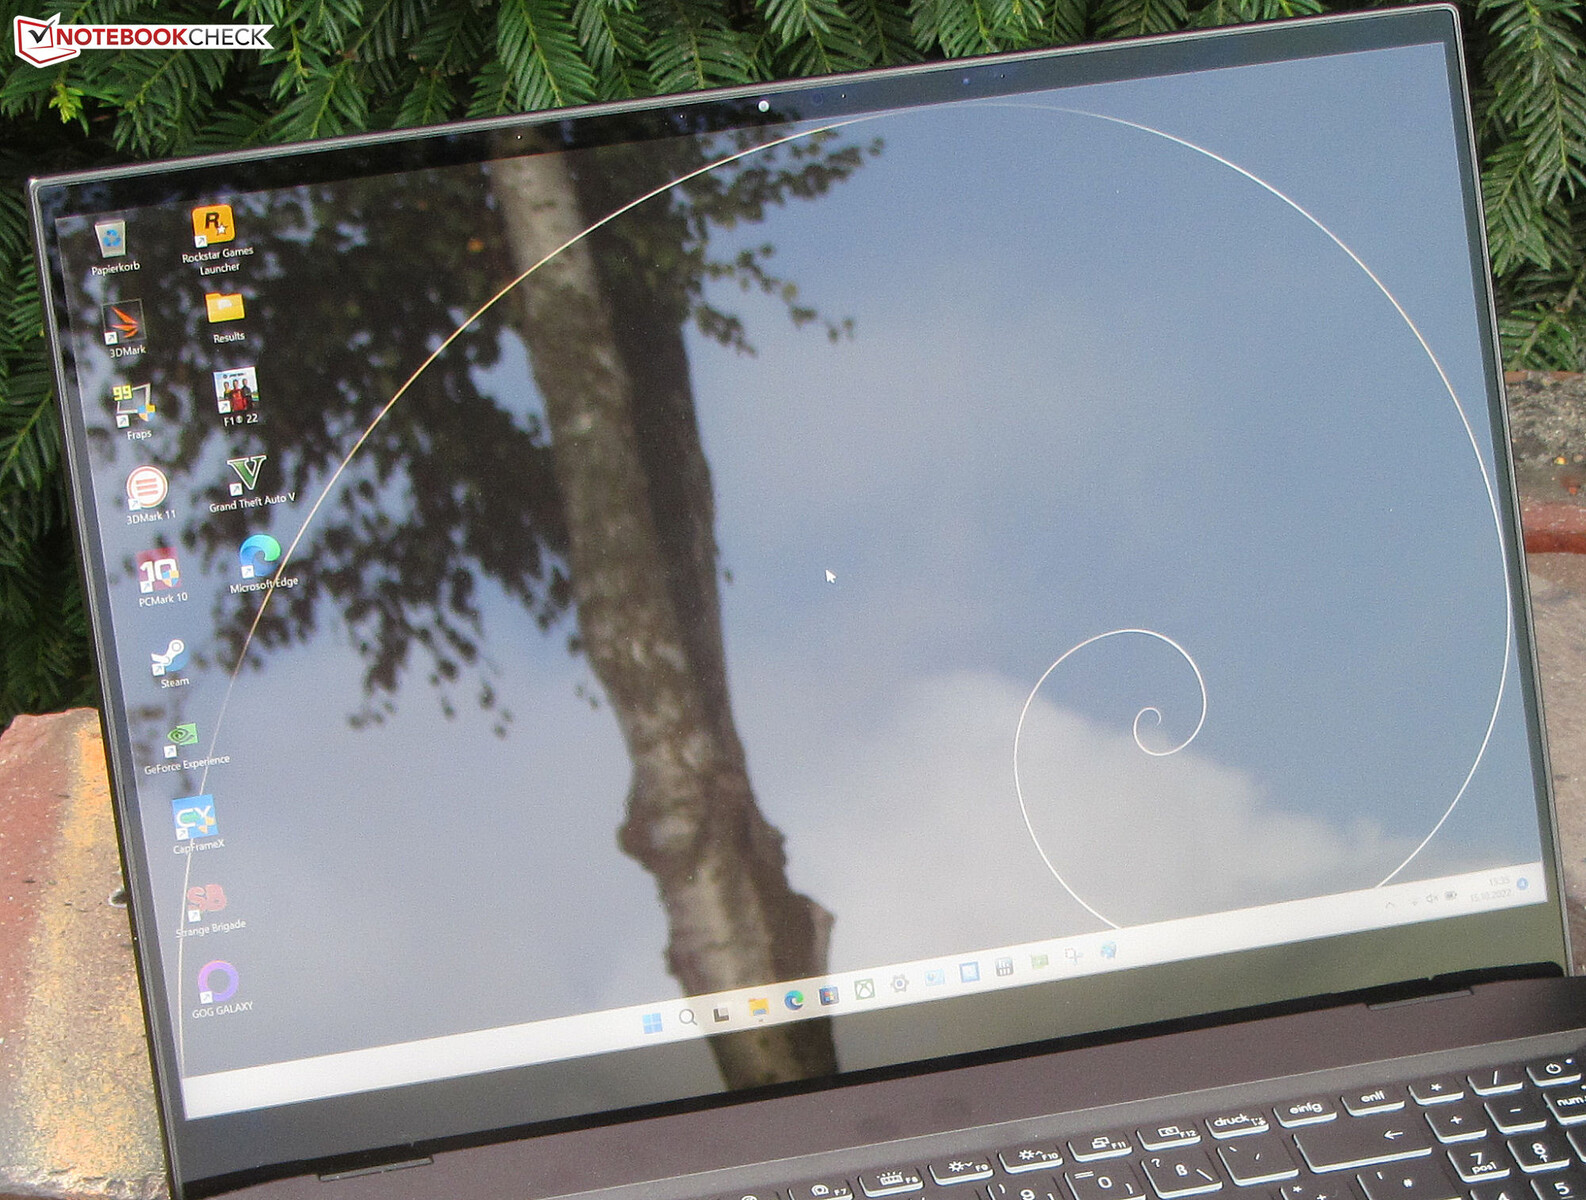
Os ângulos de visão do painel IPS são estáveis, e pode ser lido de qualquer posição. Ao ar livre, a superfície refletiva da tela torna a leitura da tela difícil.
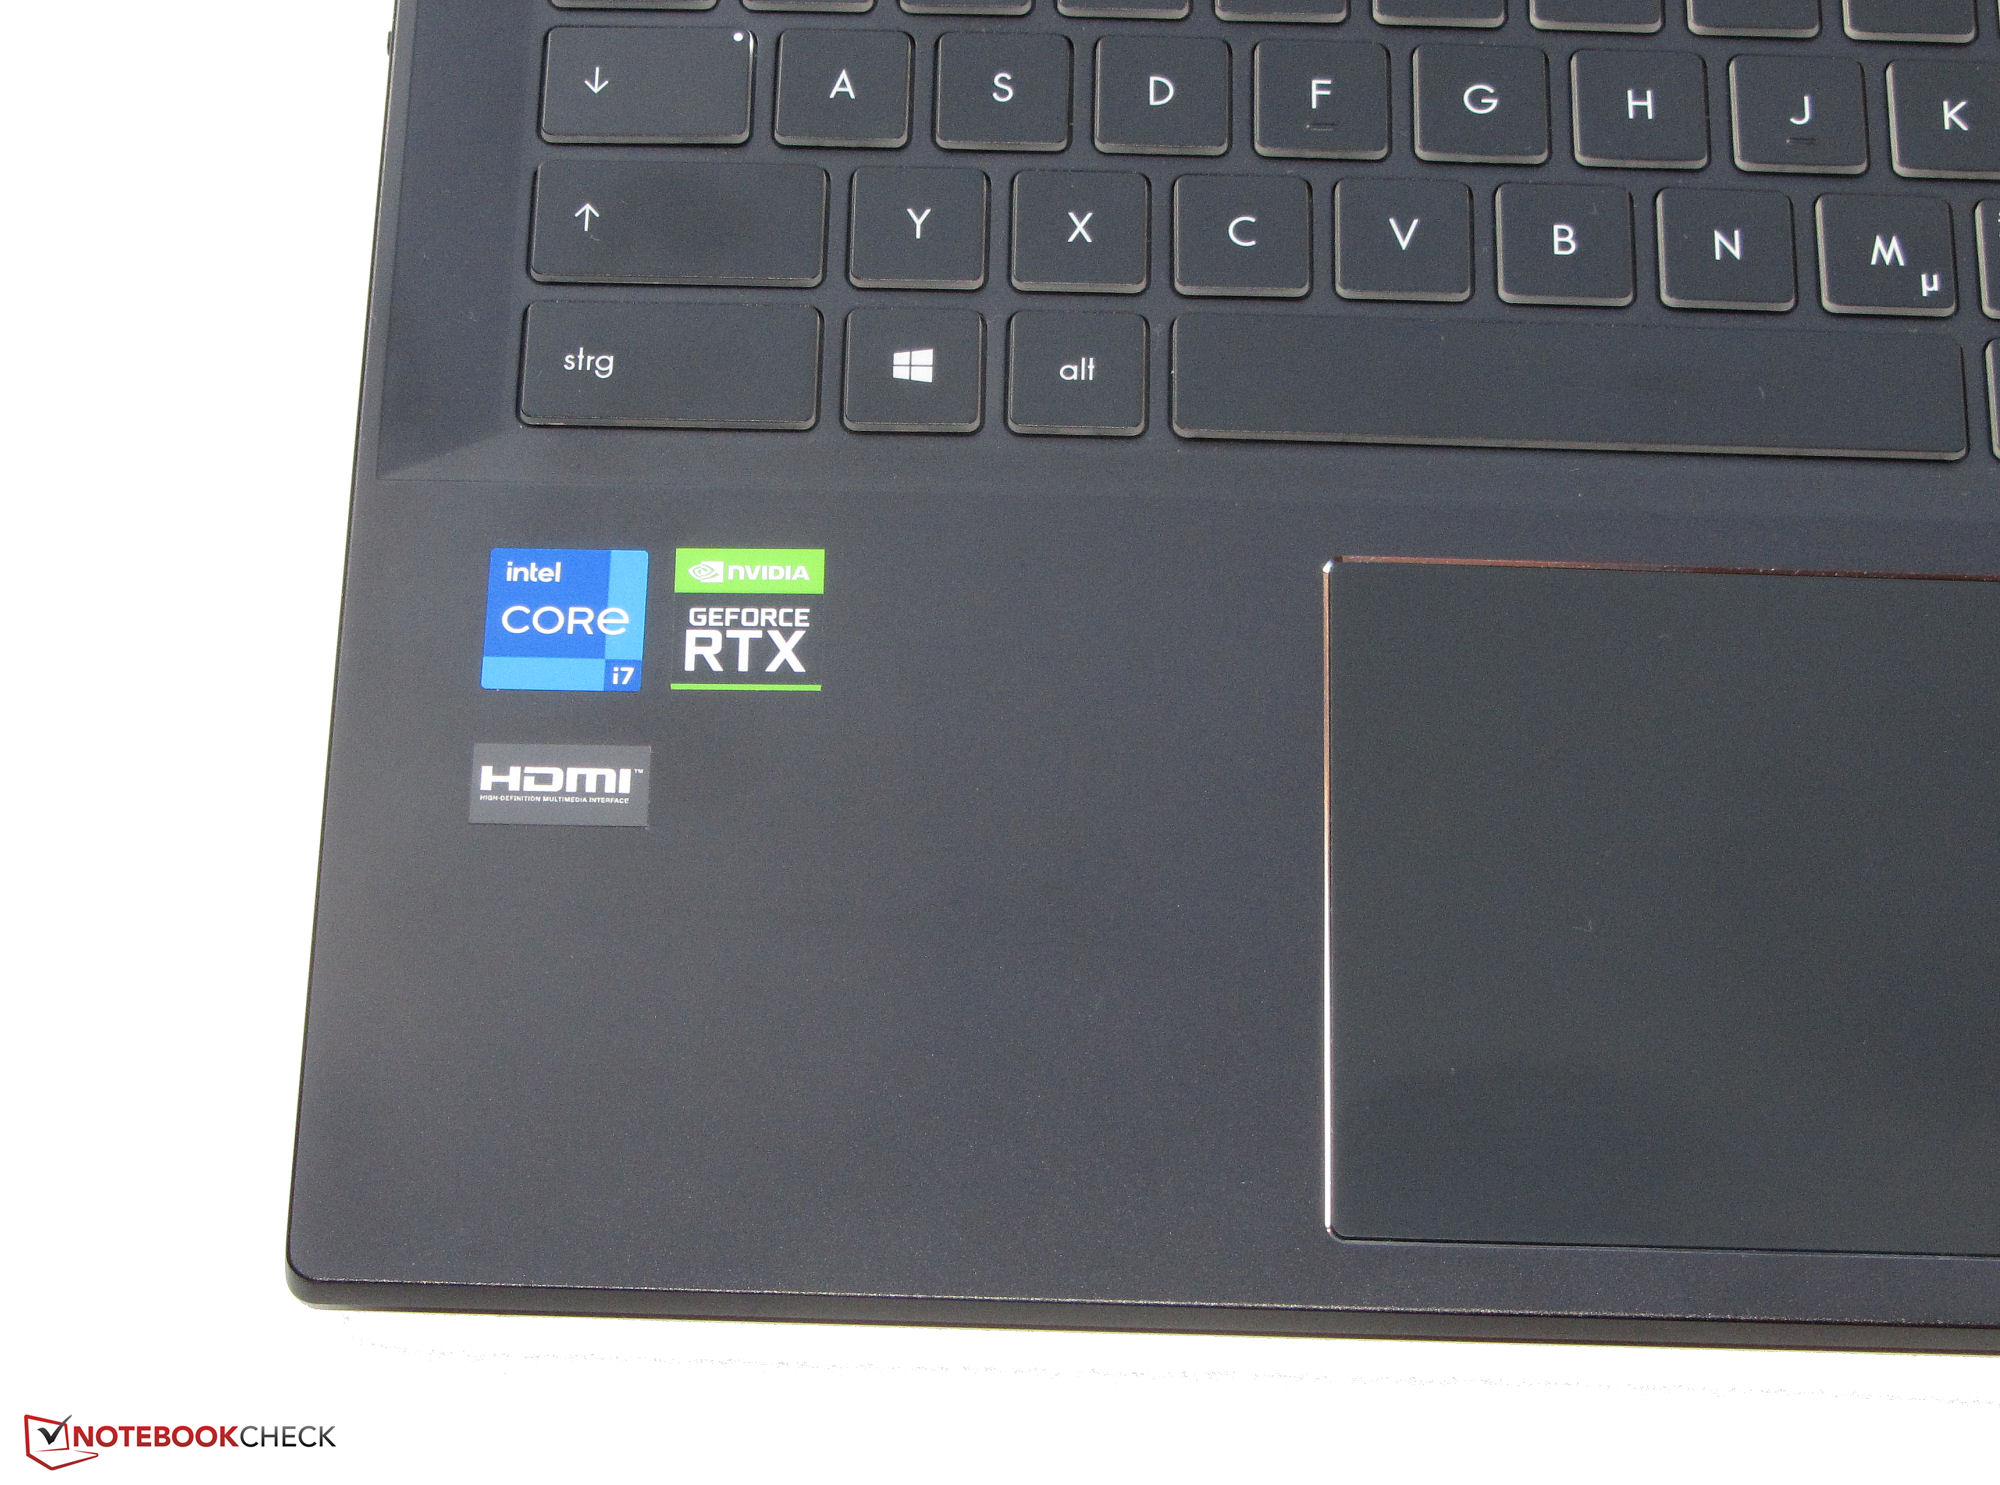
Desempenho - Alder Lake meets Ampere
O Summit E16 Flip oferece desempenho computacional mais do que suficiente para tarefas de escritório e Internet. Uma GPU dedicada acelera os aplicativos gráficos intensivos e permite jogar jogos de computador.
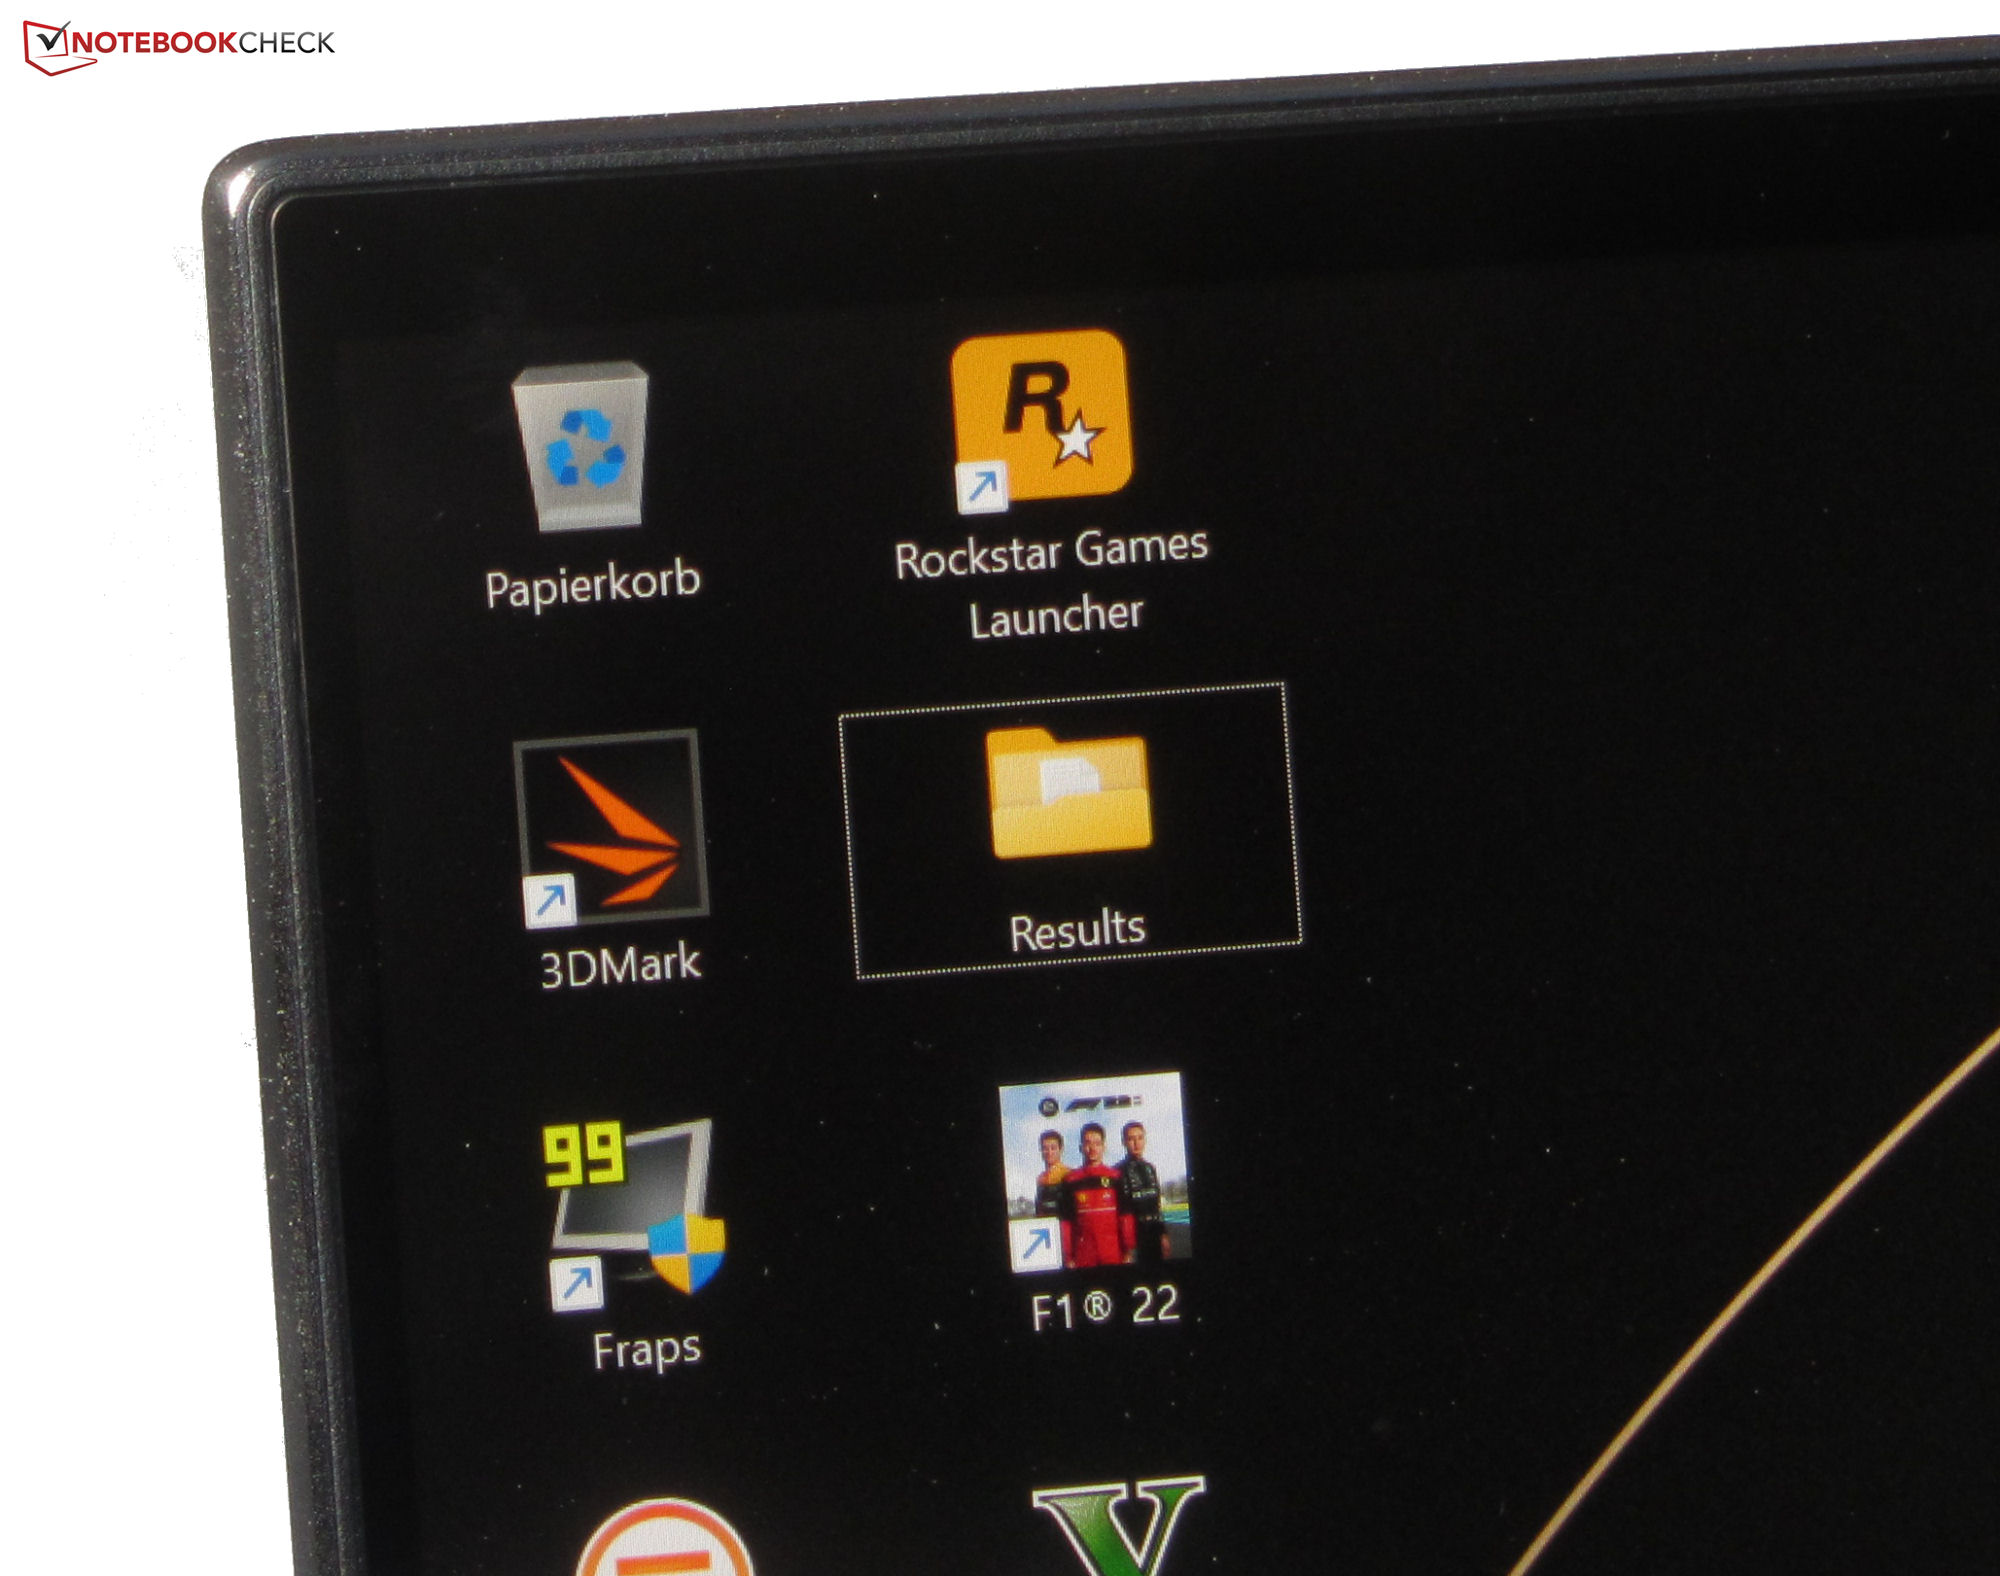
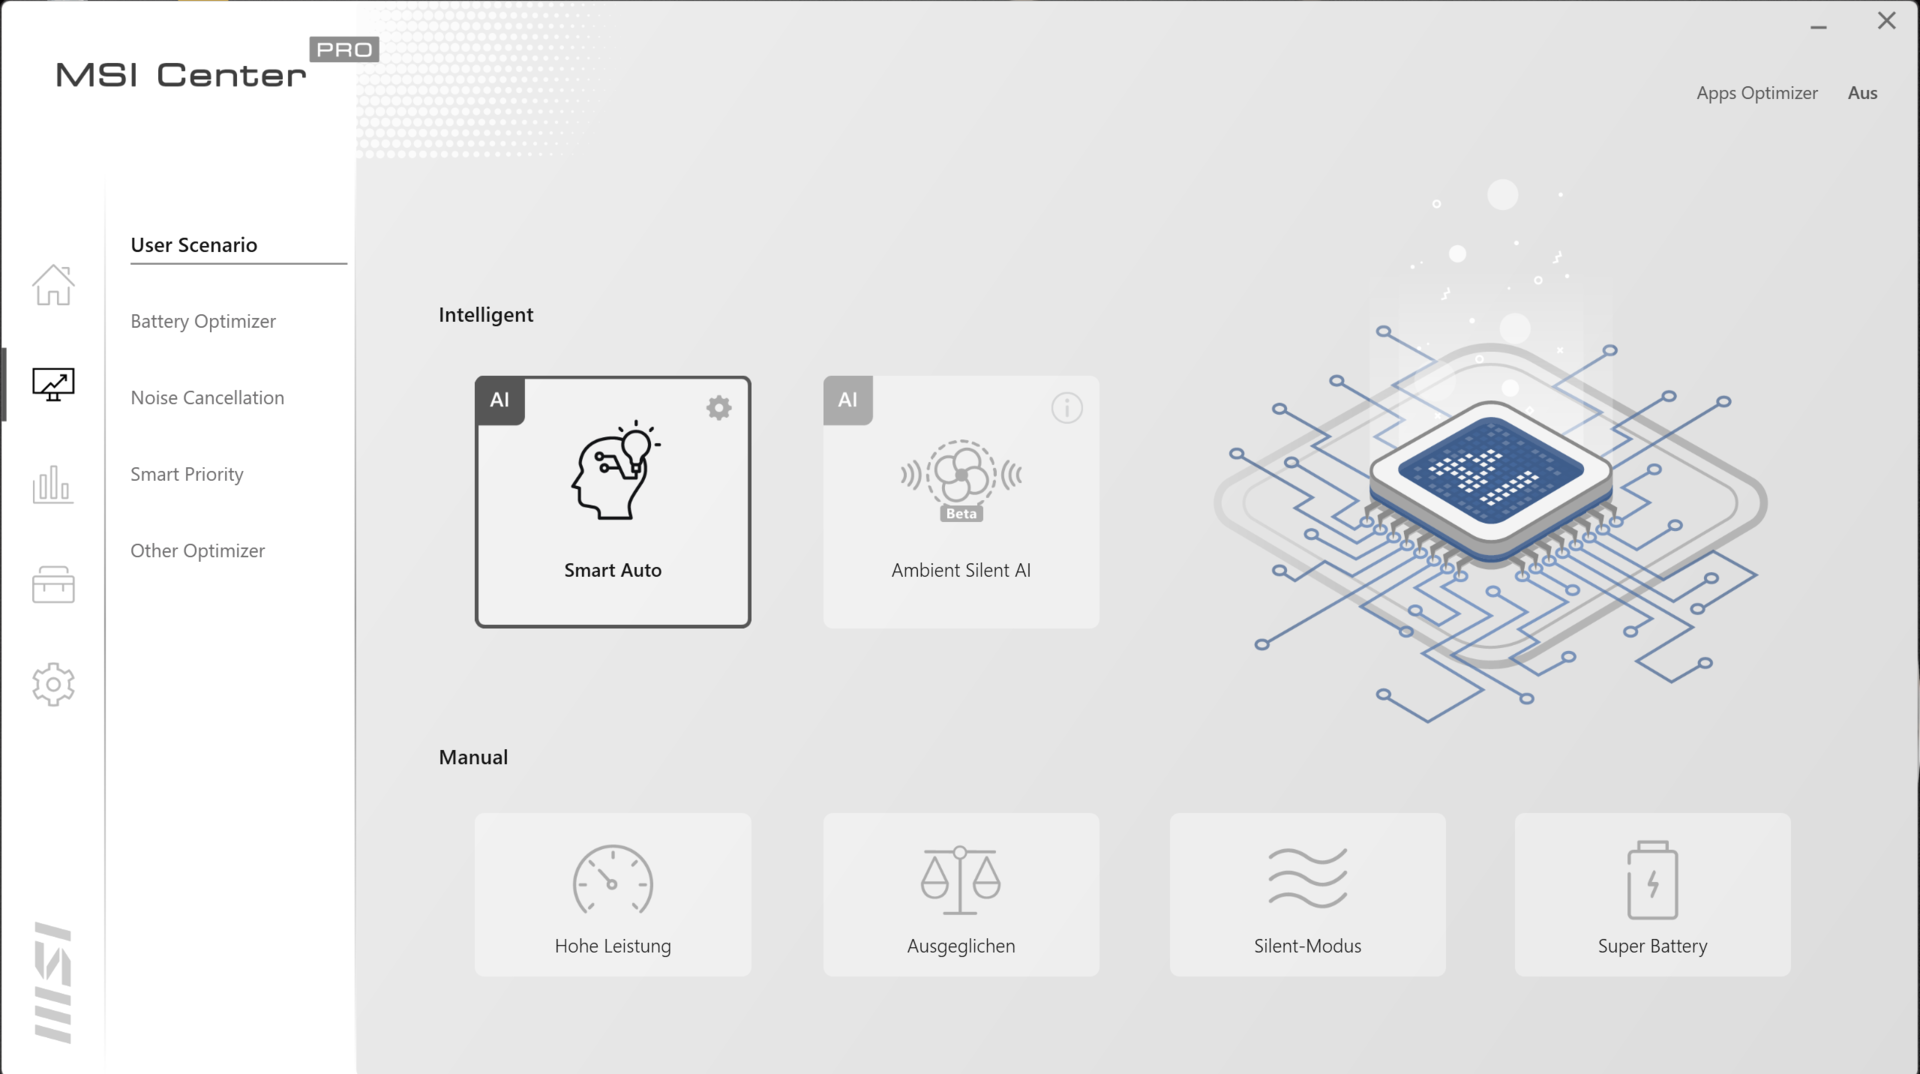
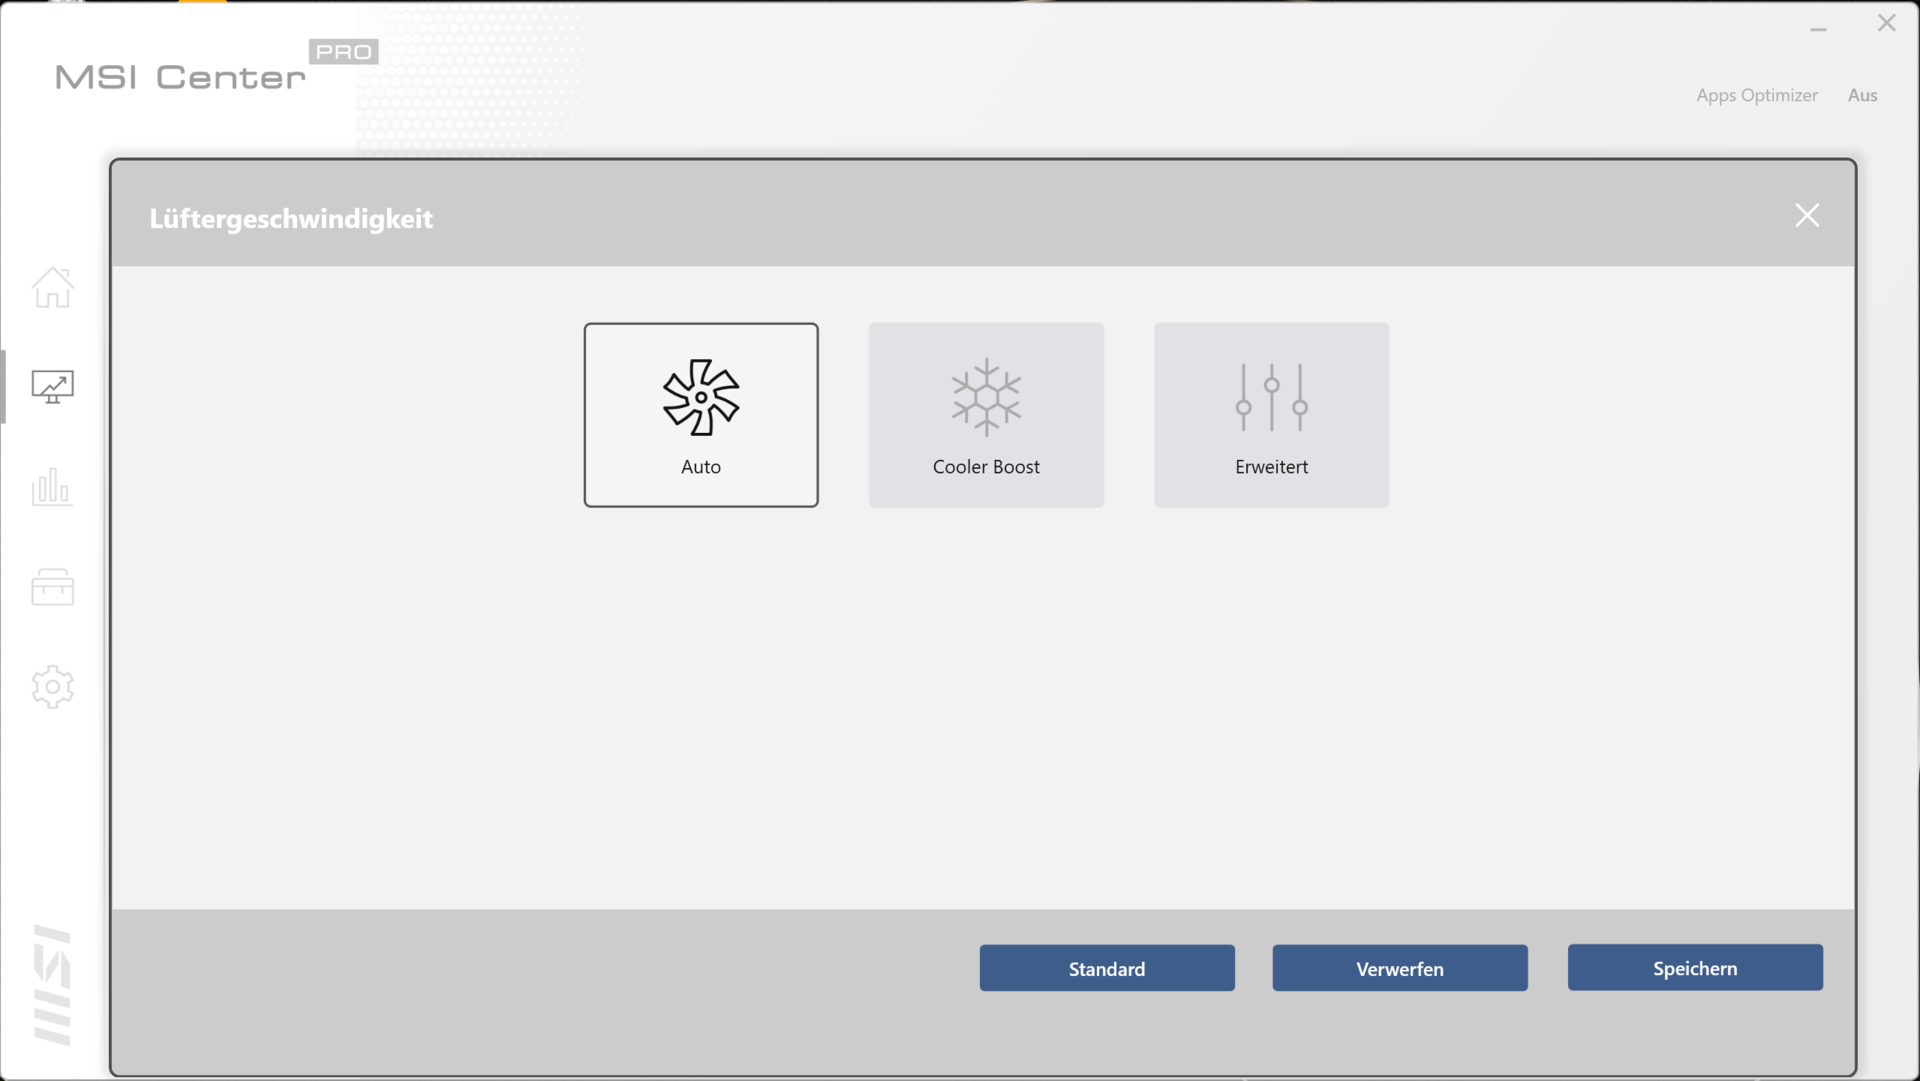
Condições de teste
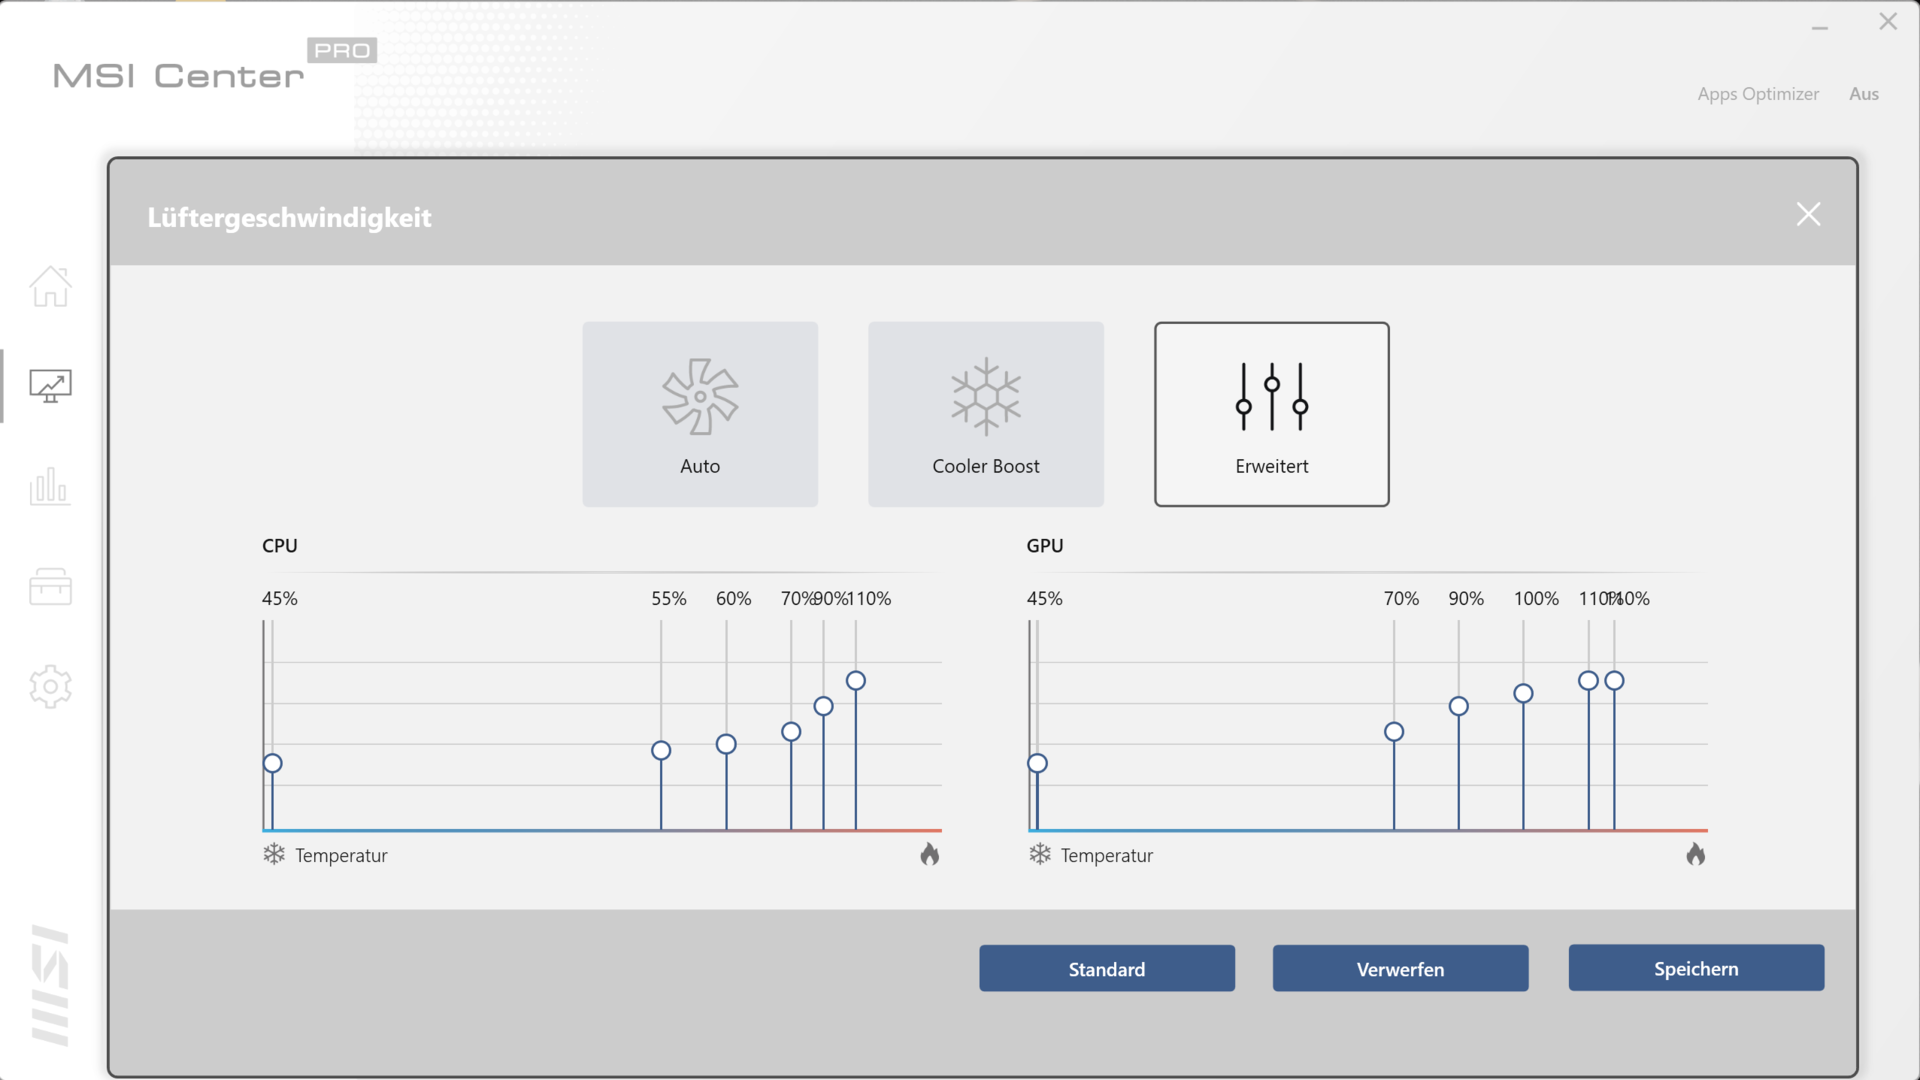
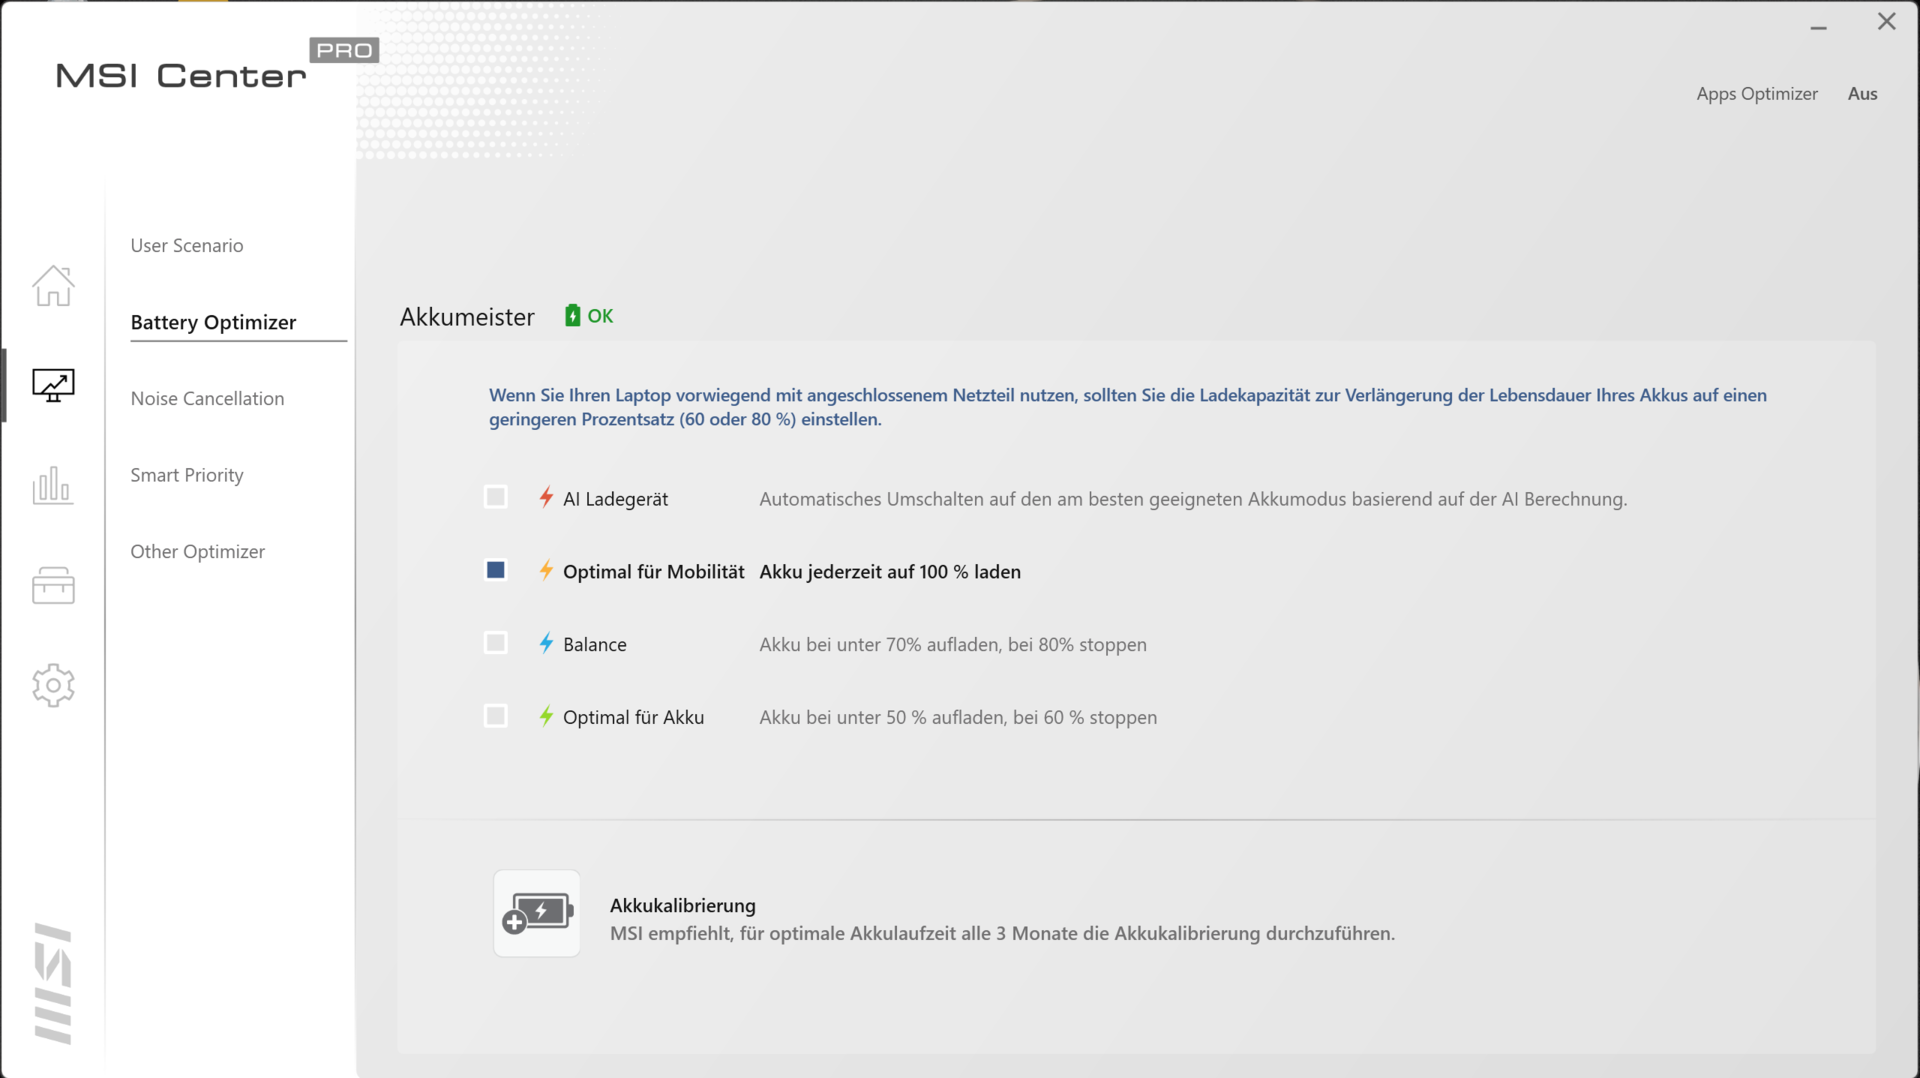
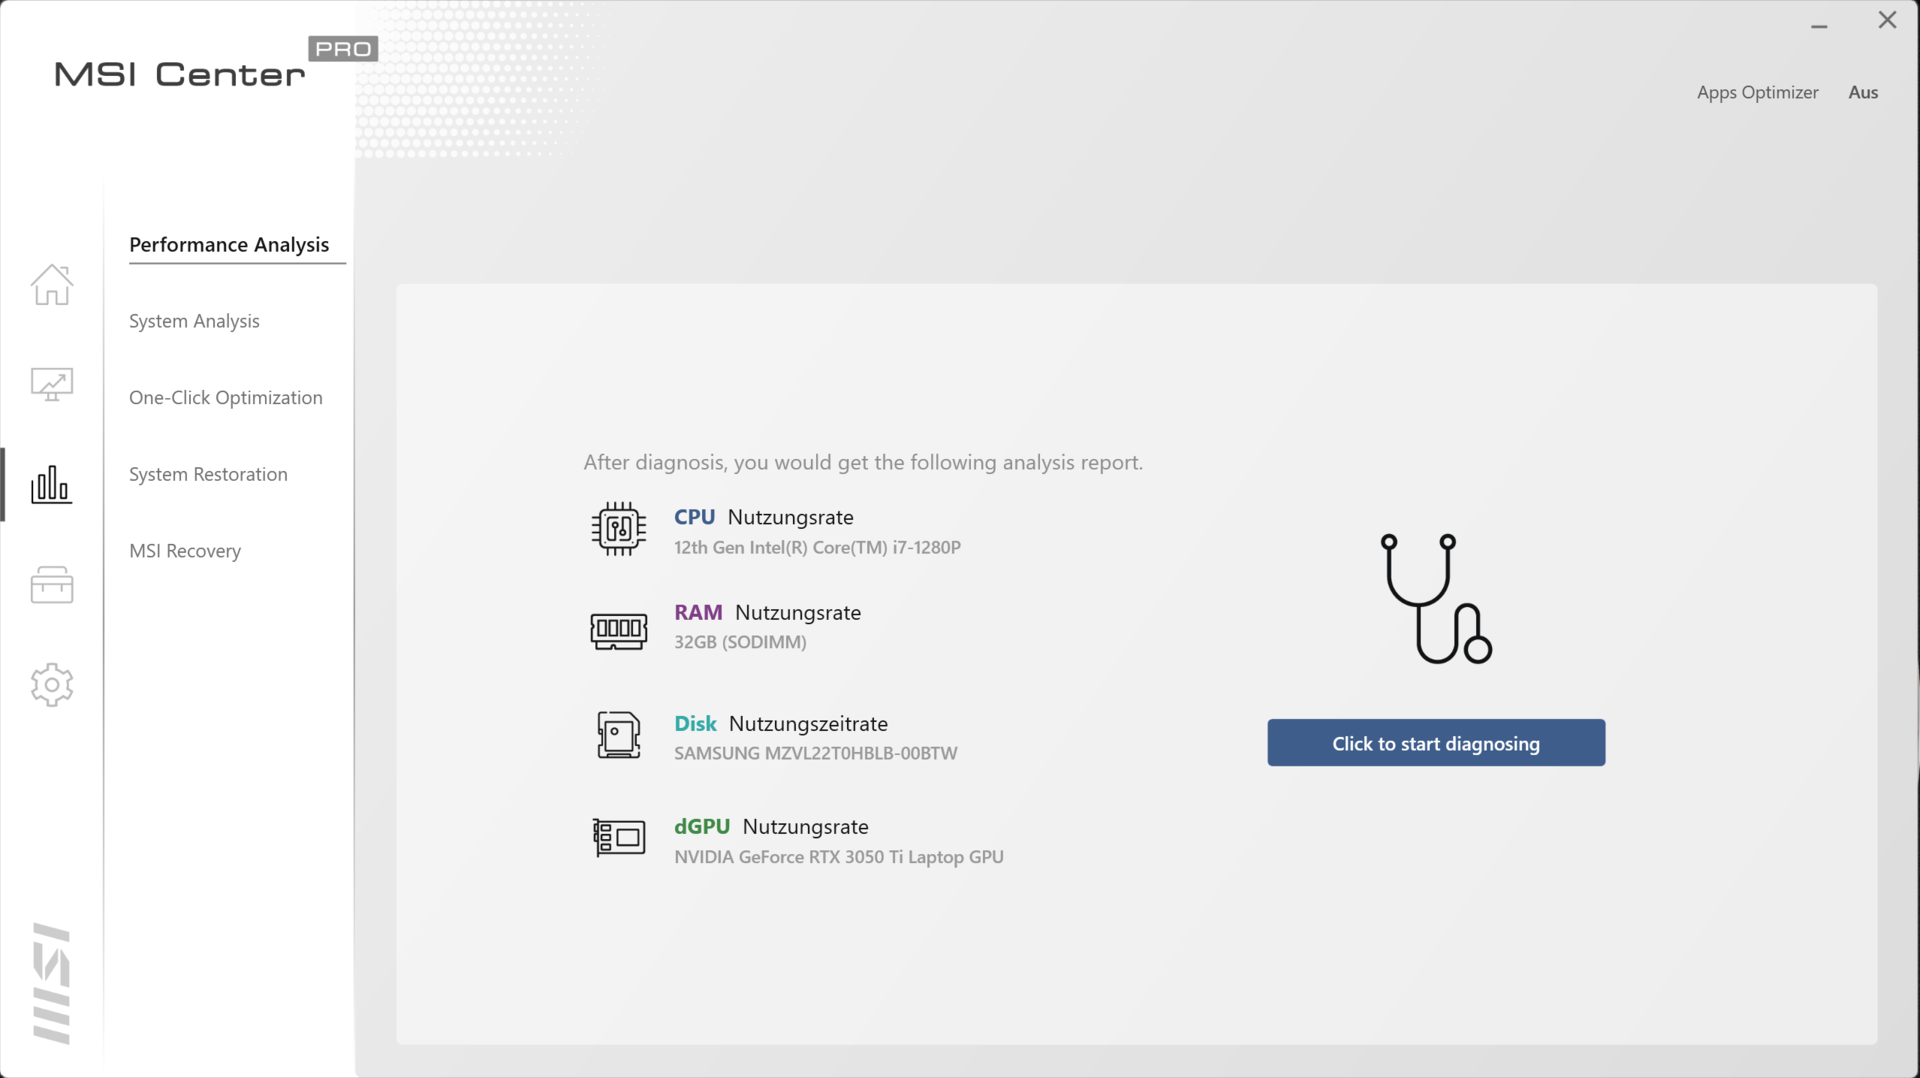
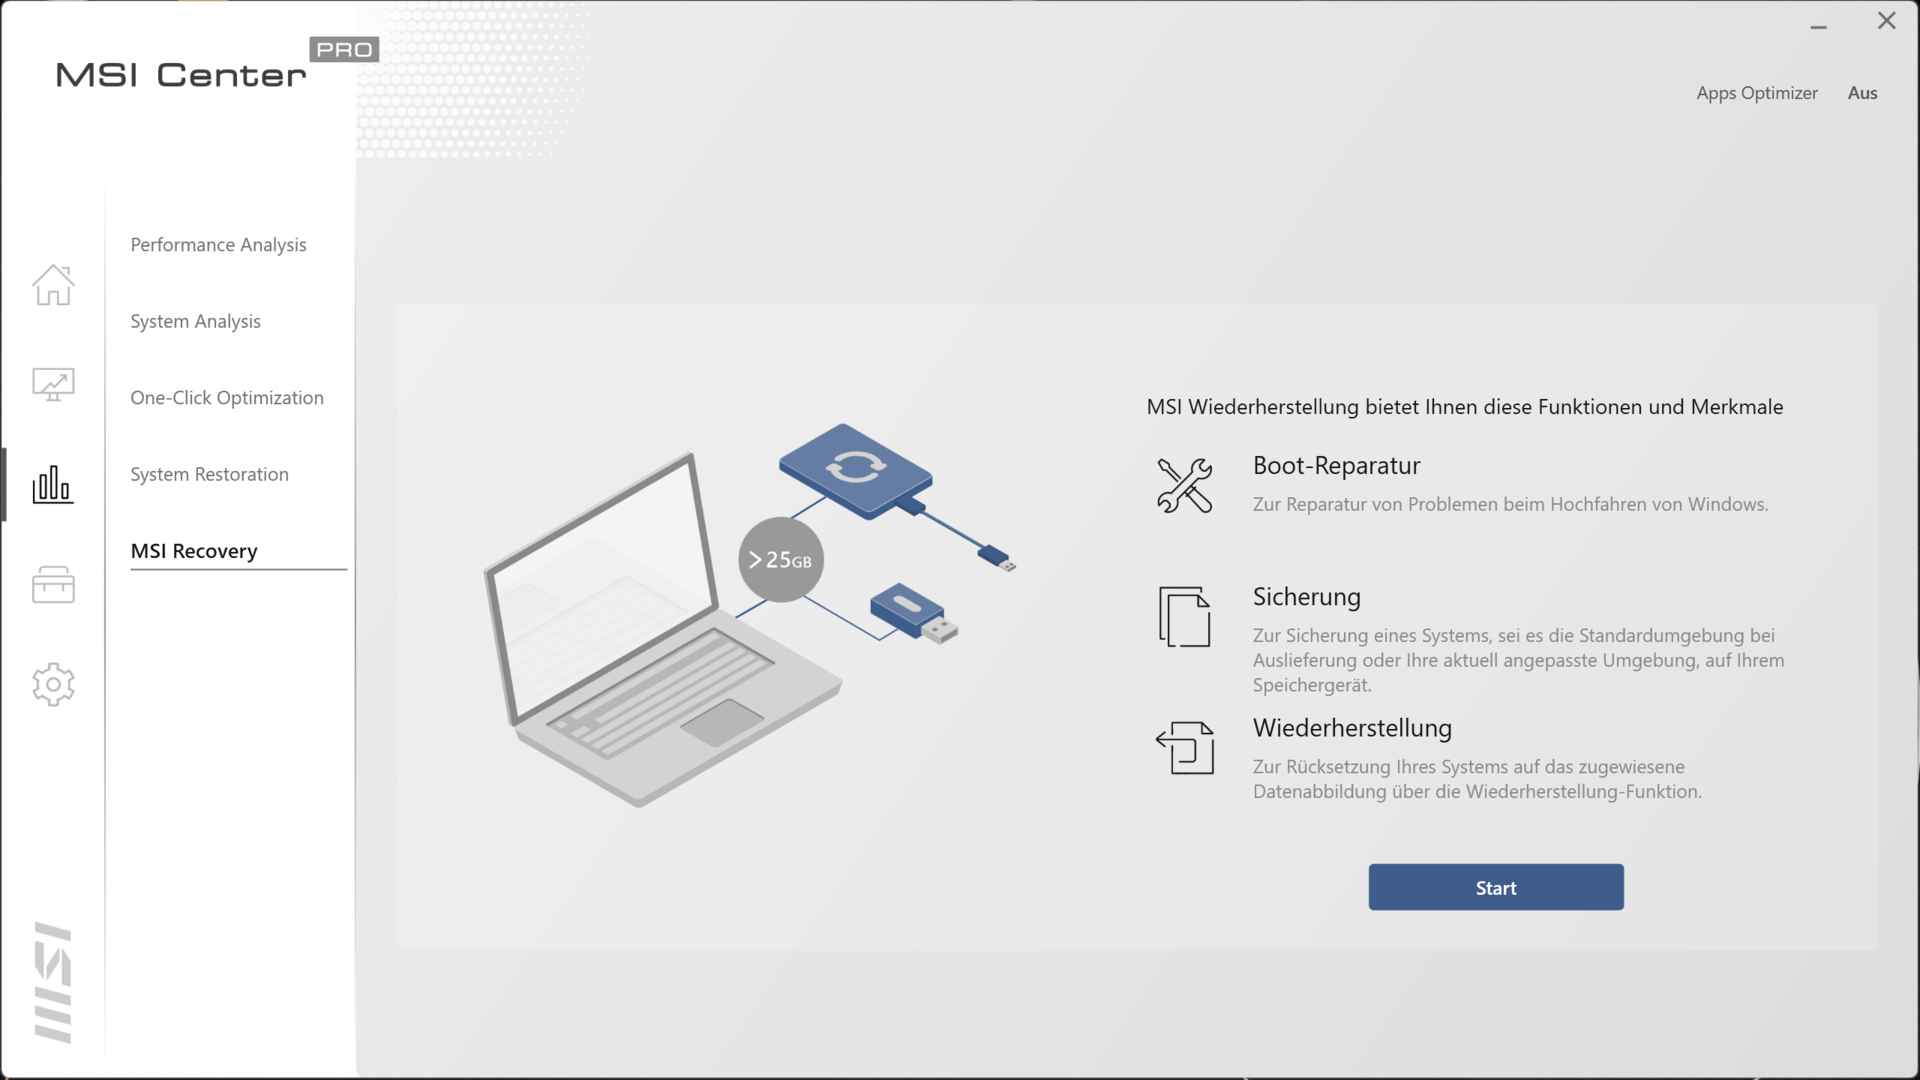
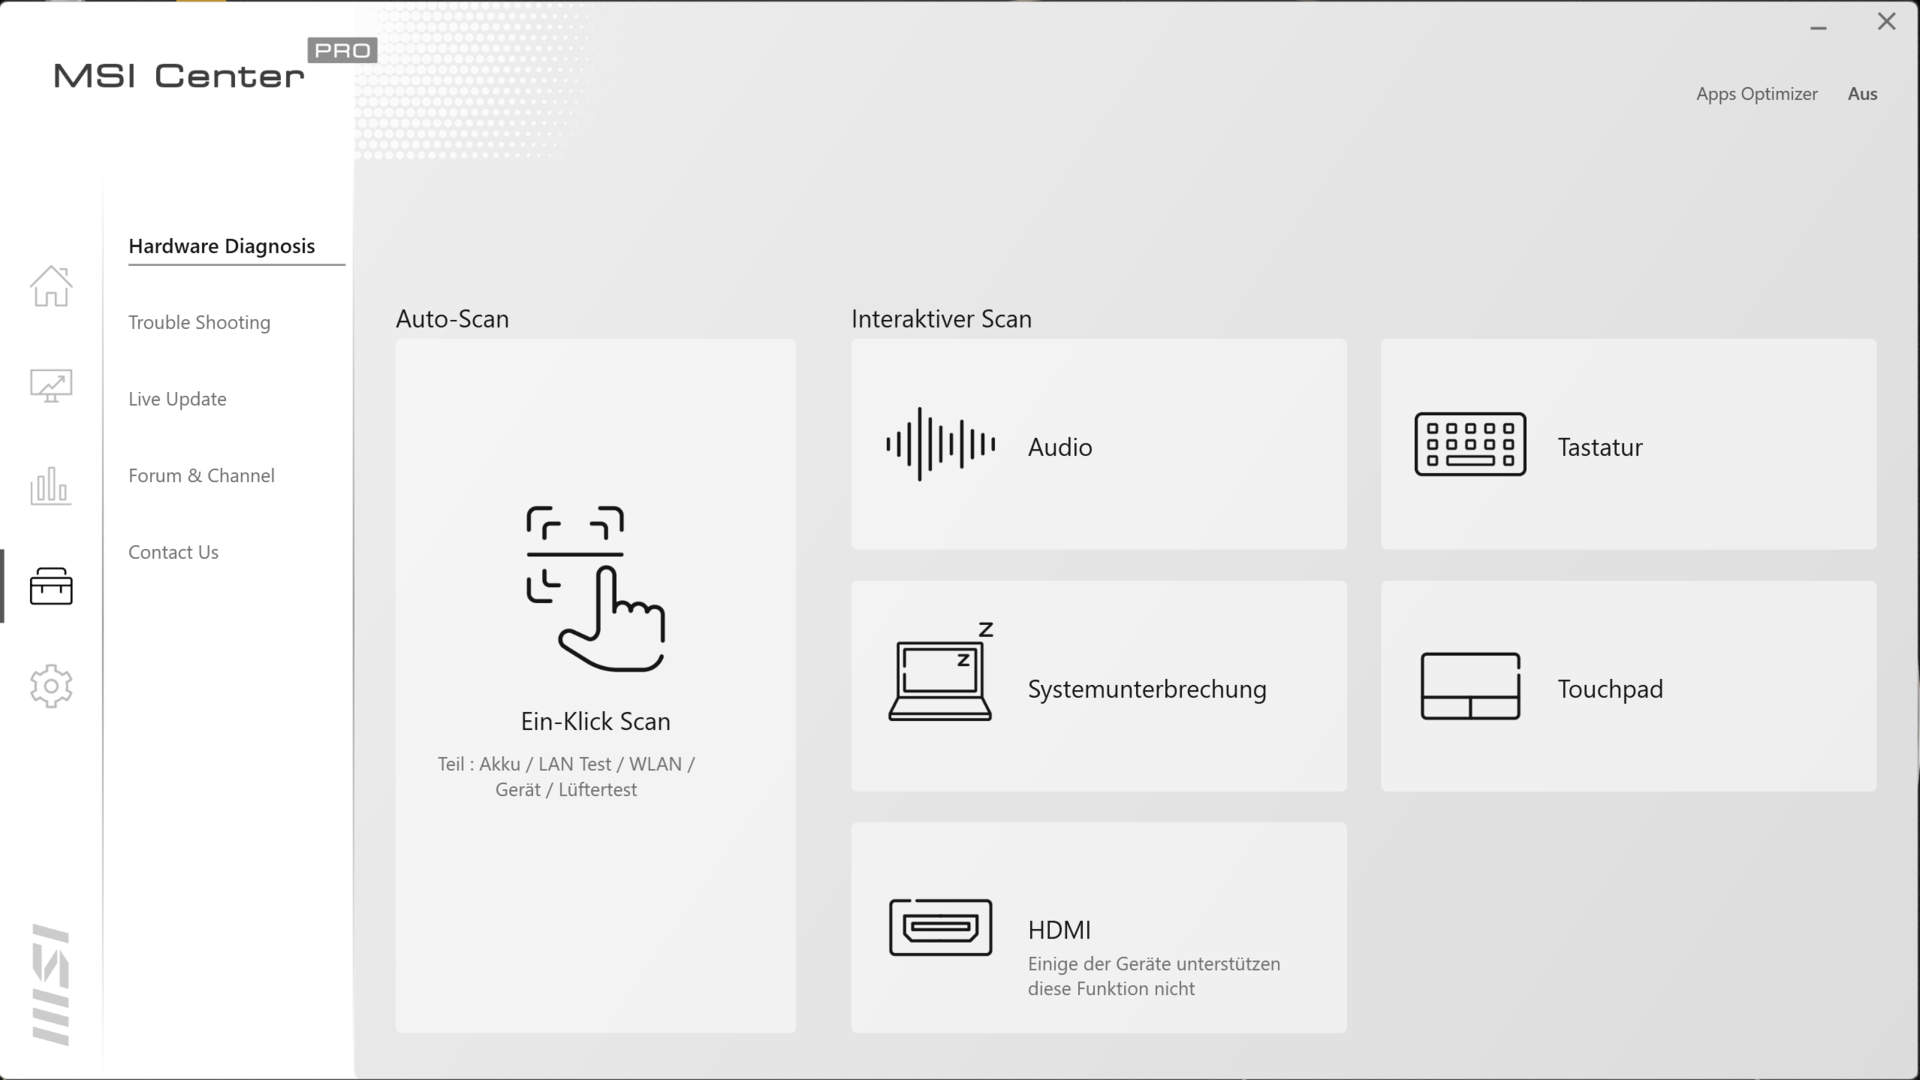
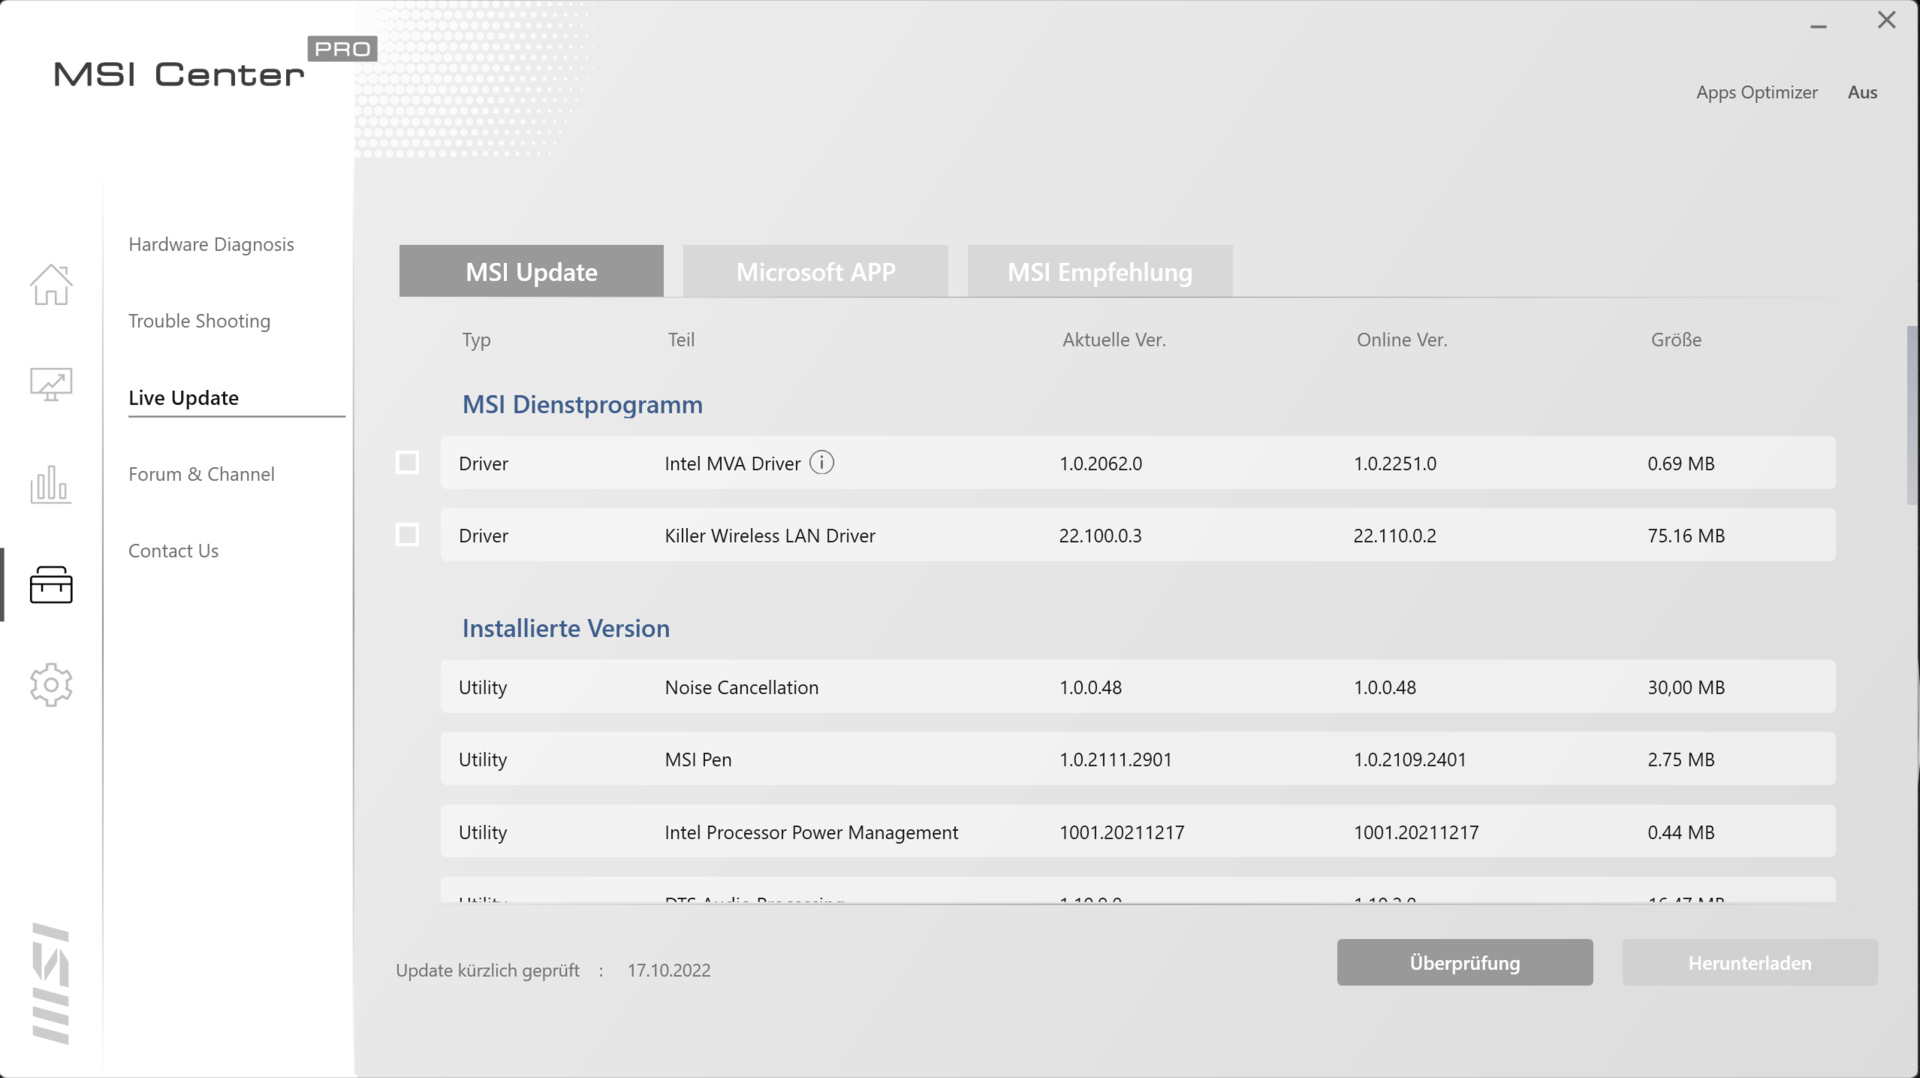
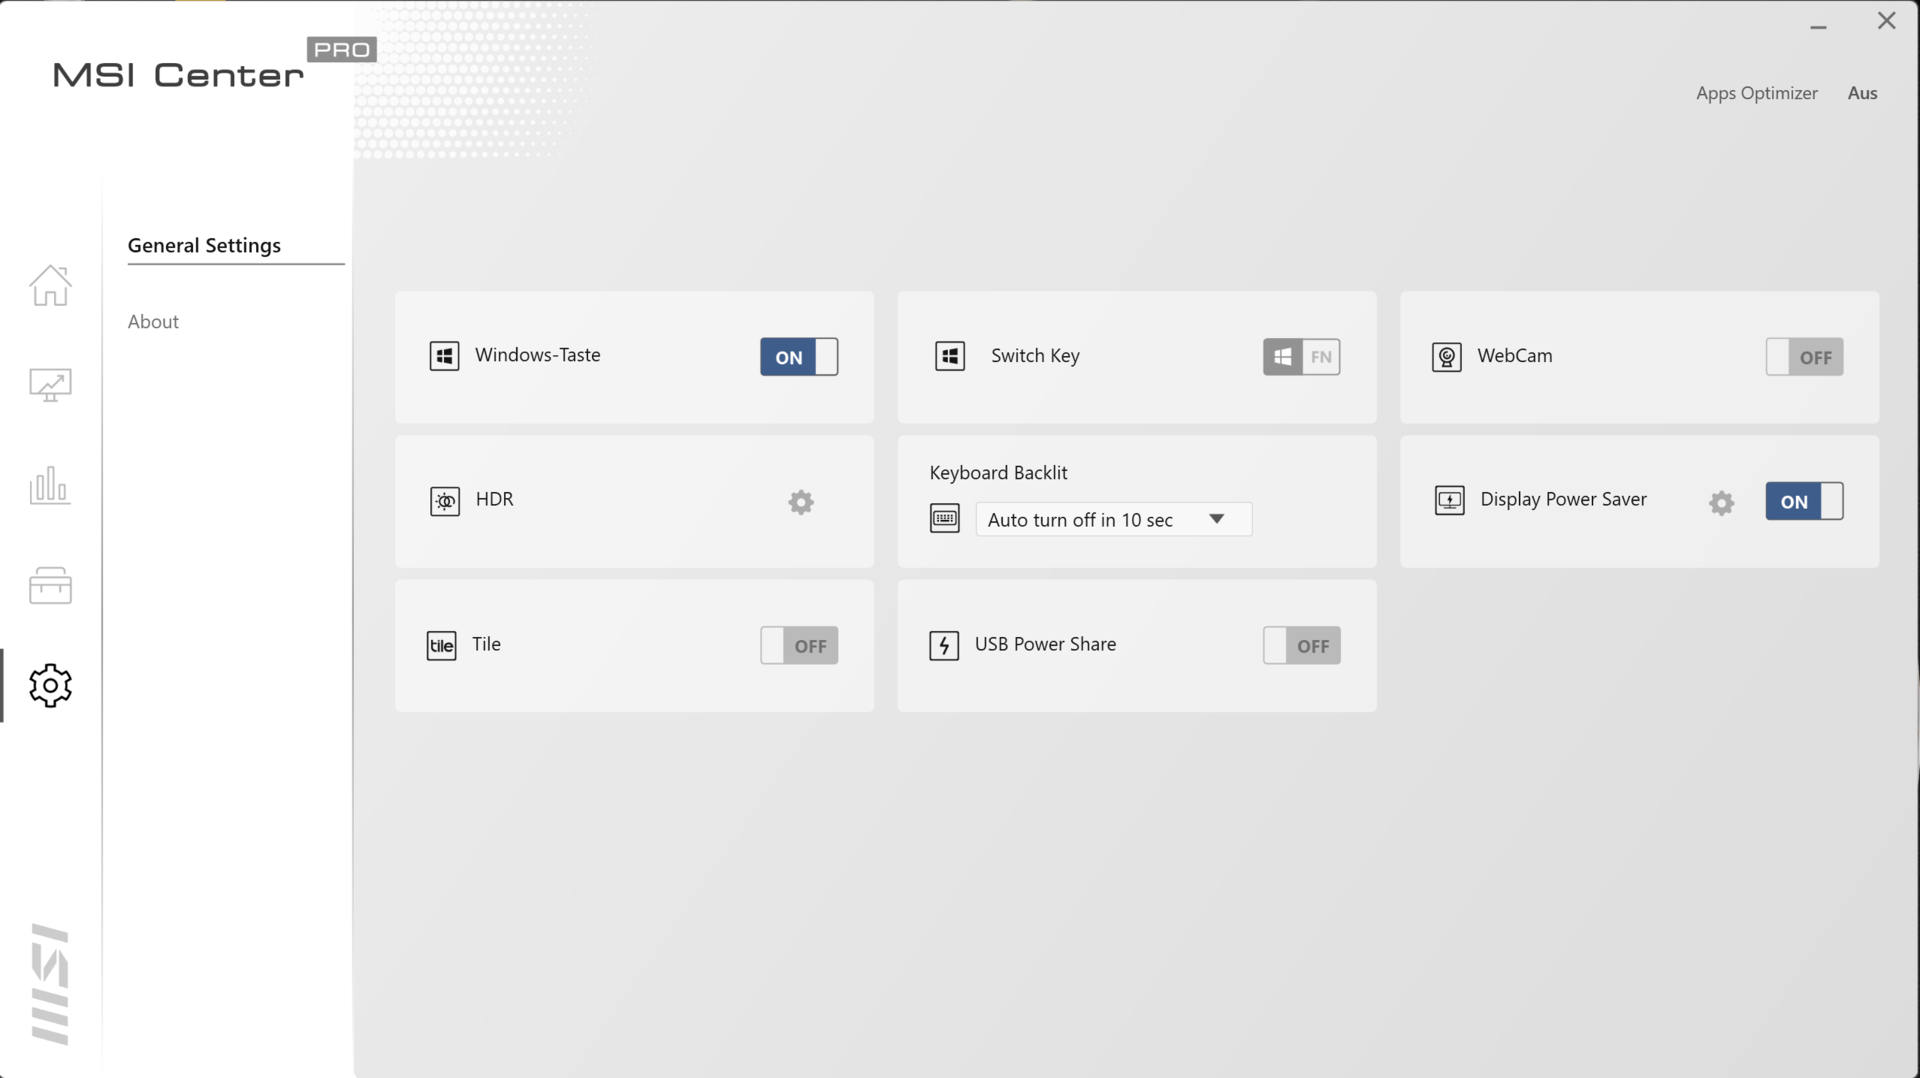
O software MSI Center Pro pré-instalado (ver imagens) e a tecla F7 permitem alternar entre quatro perfis de energia (High Performance, Balanced, Silent Mode, Super Battery) do laptop. Quando você usa a função"Automático Inteligente" baseada em IA, como no nosso caso, o MSI Center escolhe automaticamente o perfil que se adapta ao cenário. Os perfis influenciam apenas a performance da CPU e não a performance da GPU.
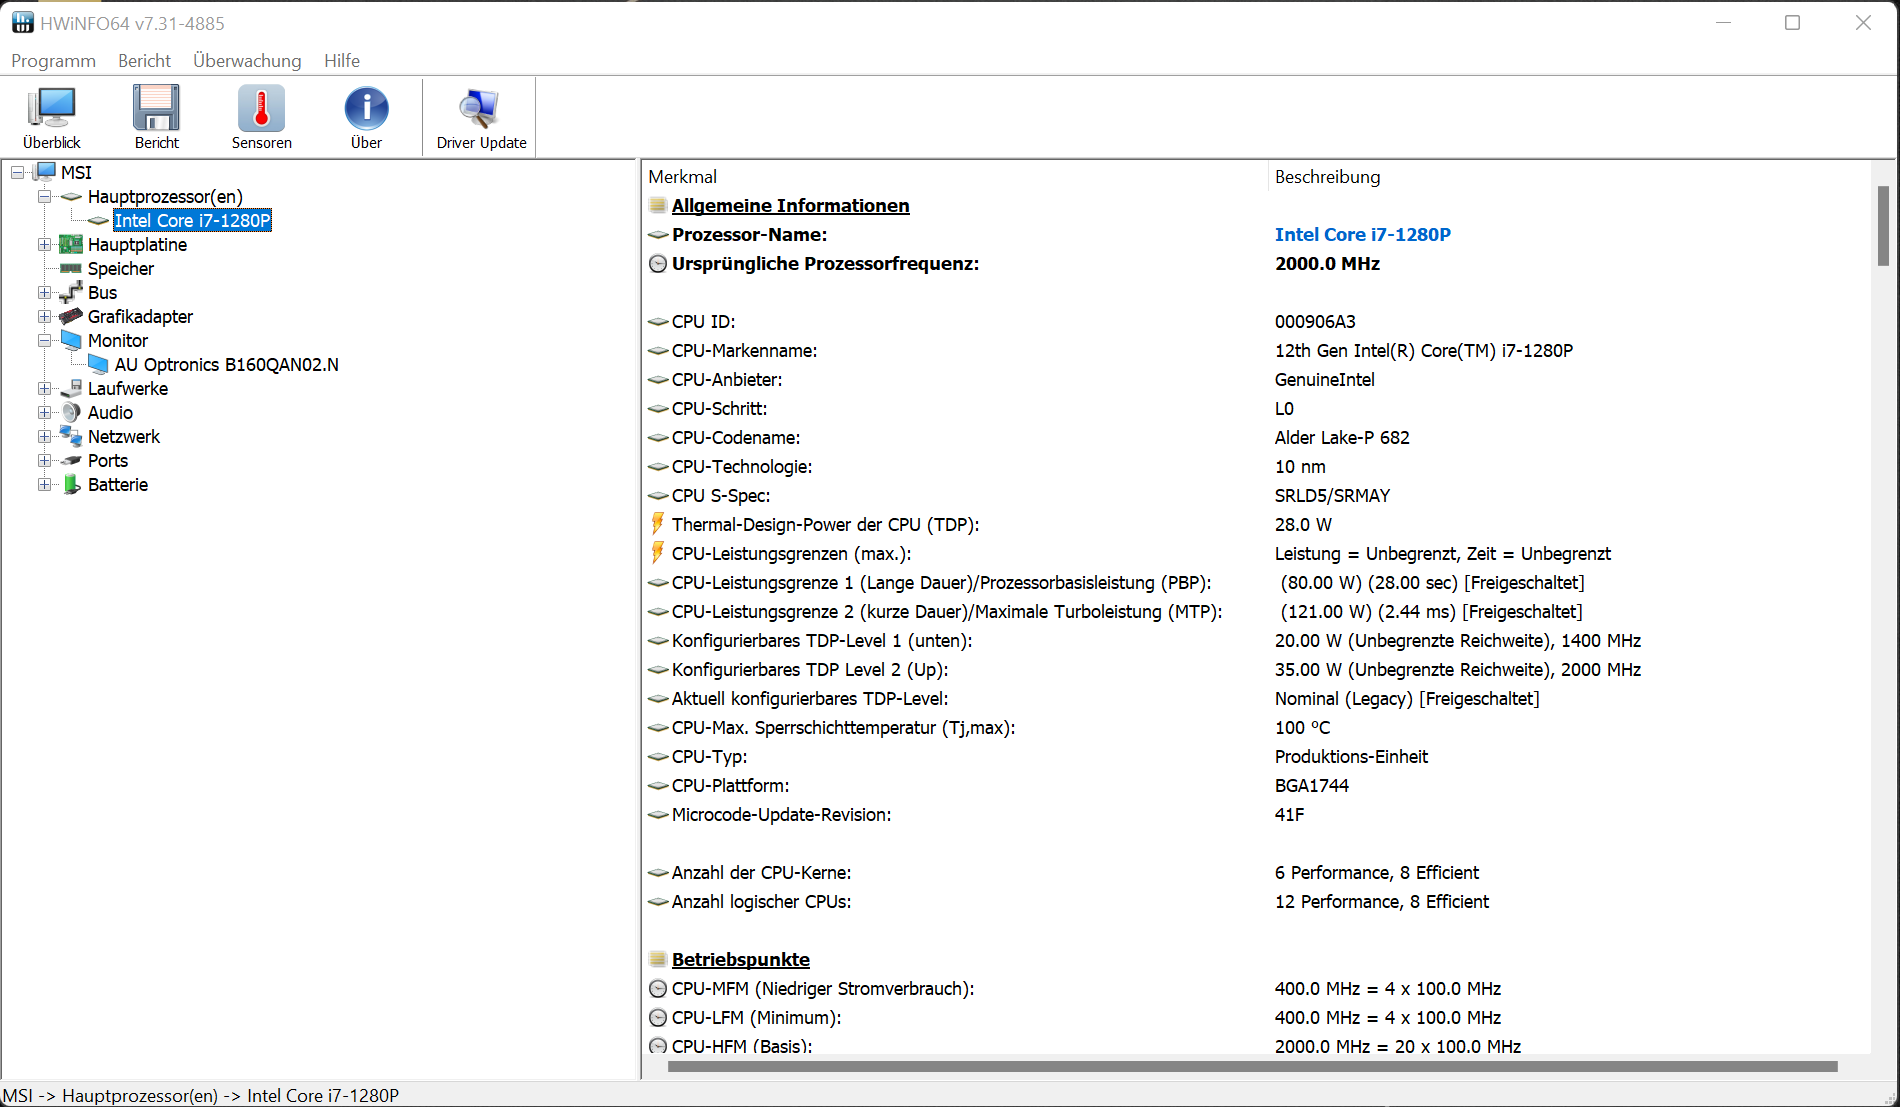
Processador
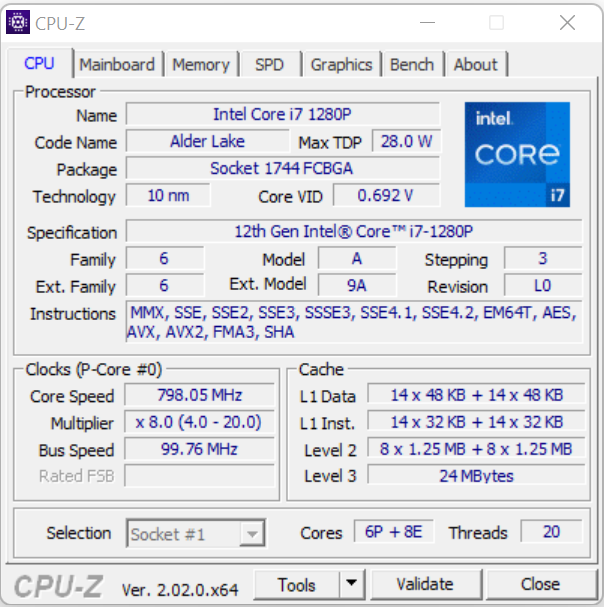
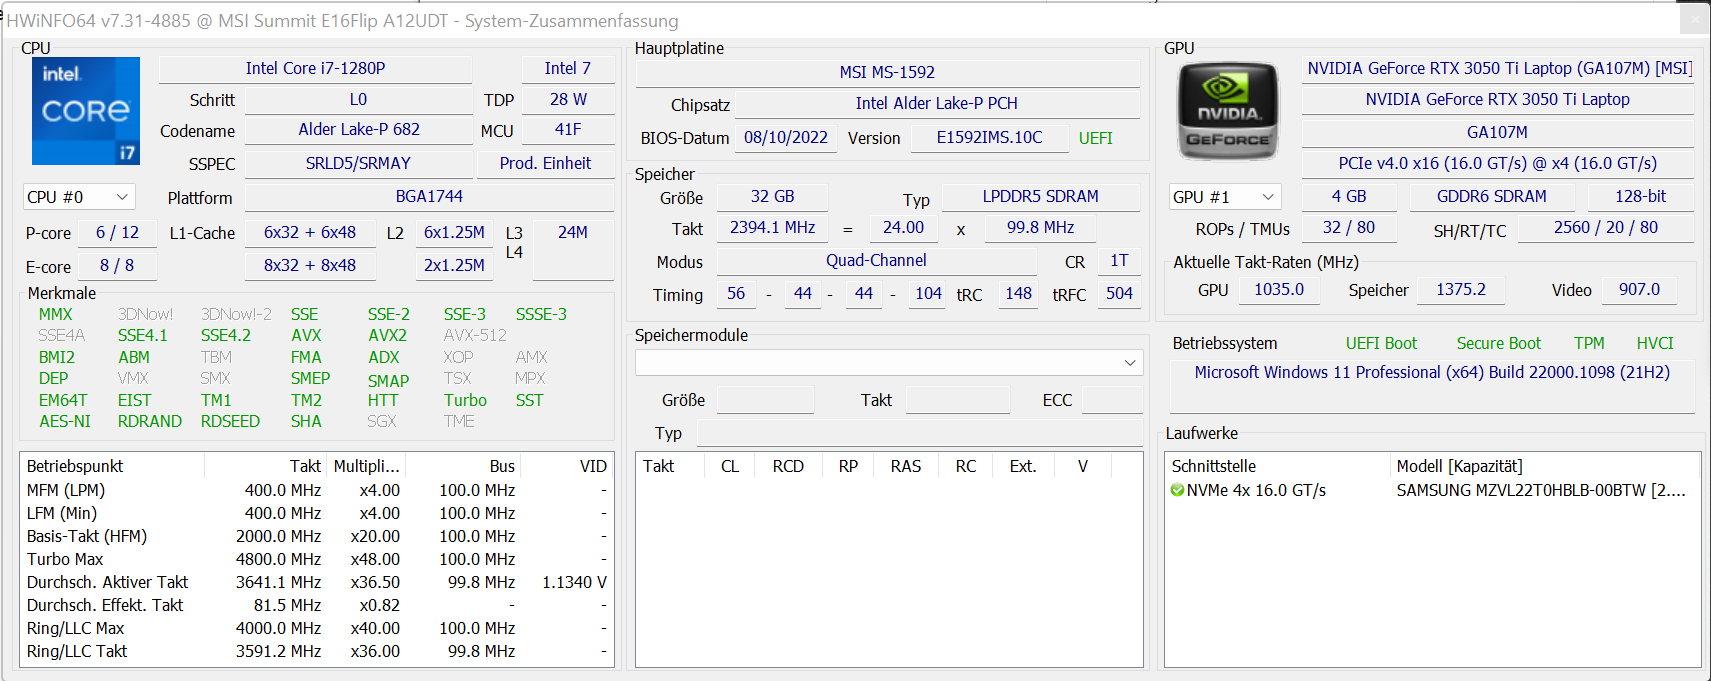
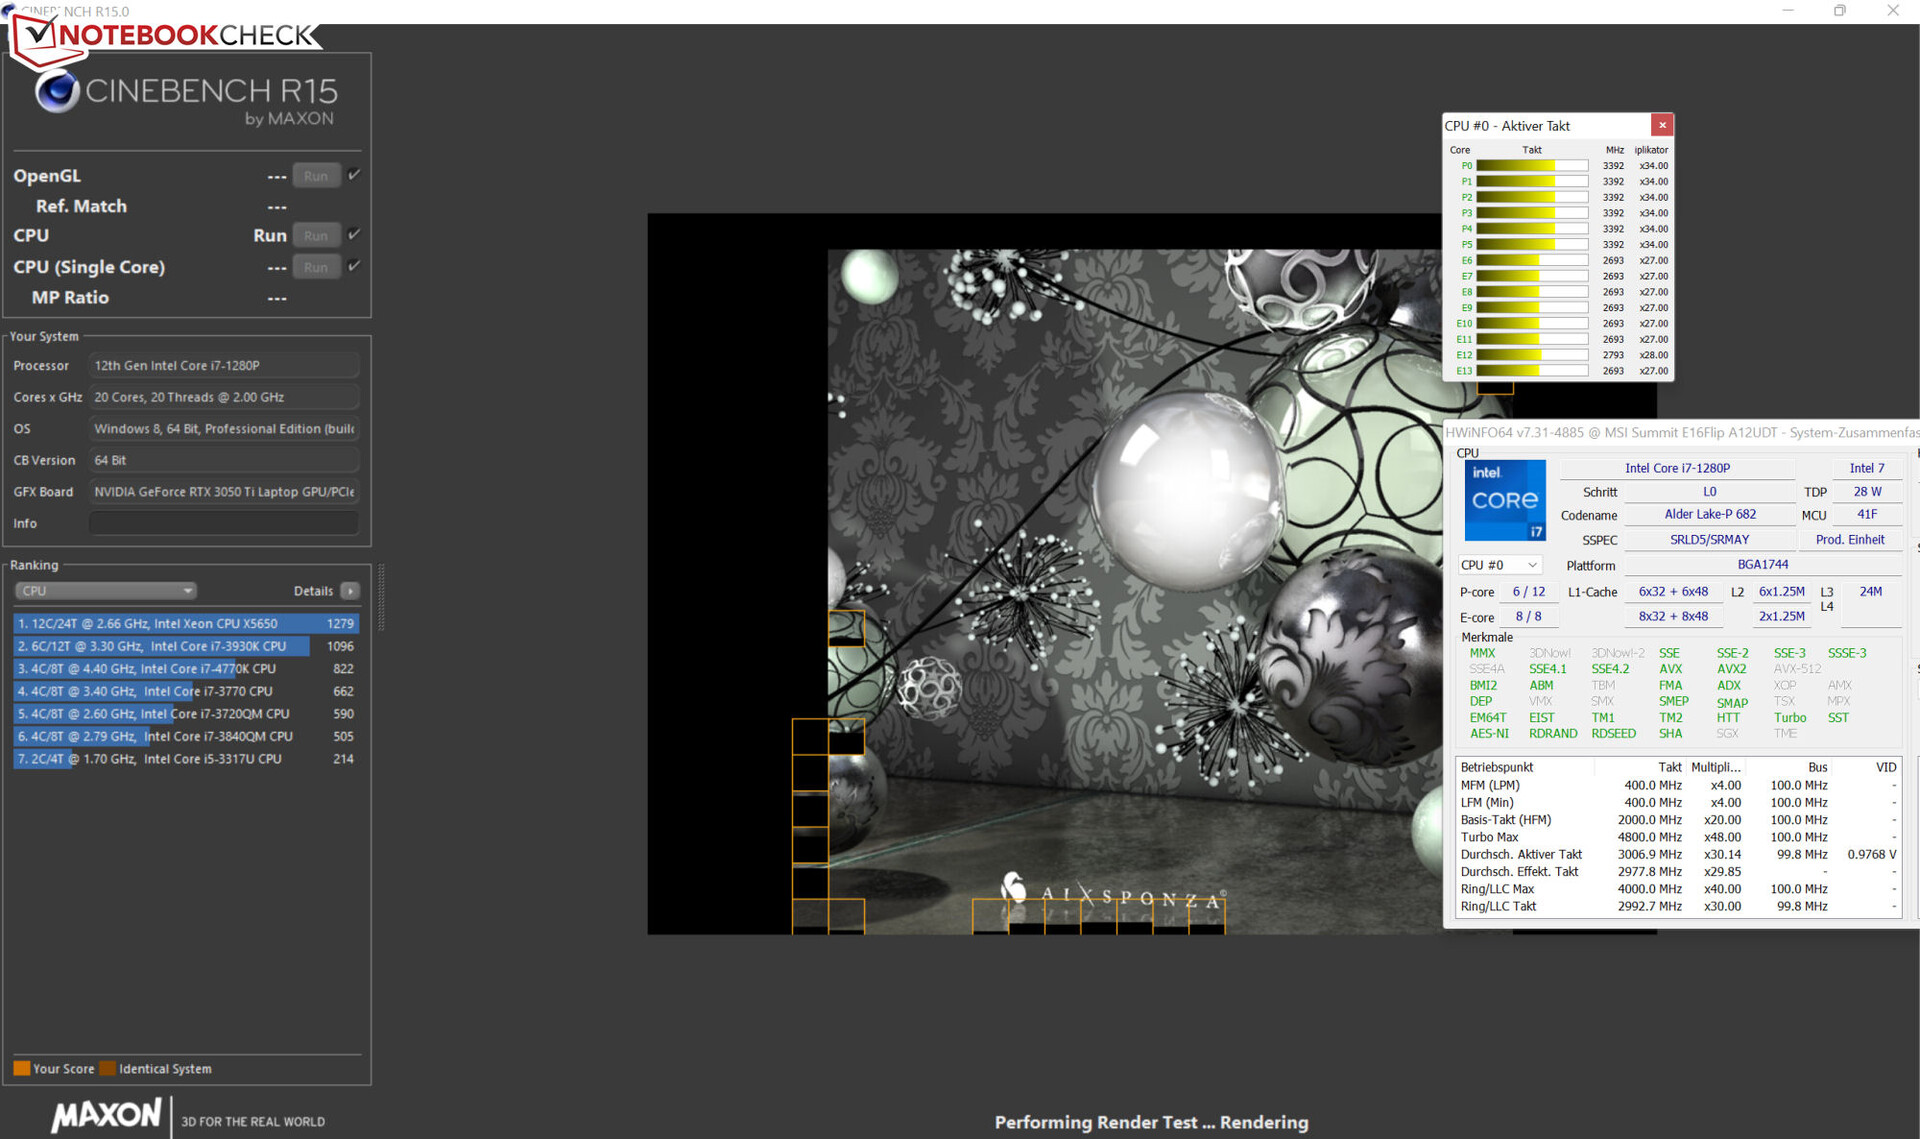
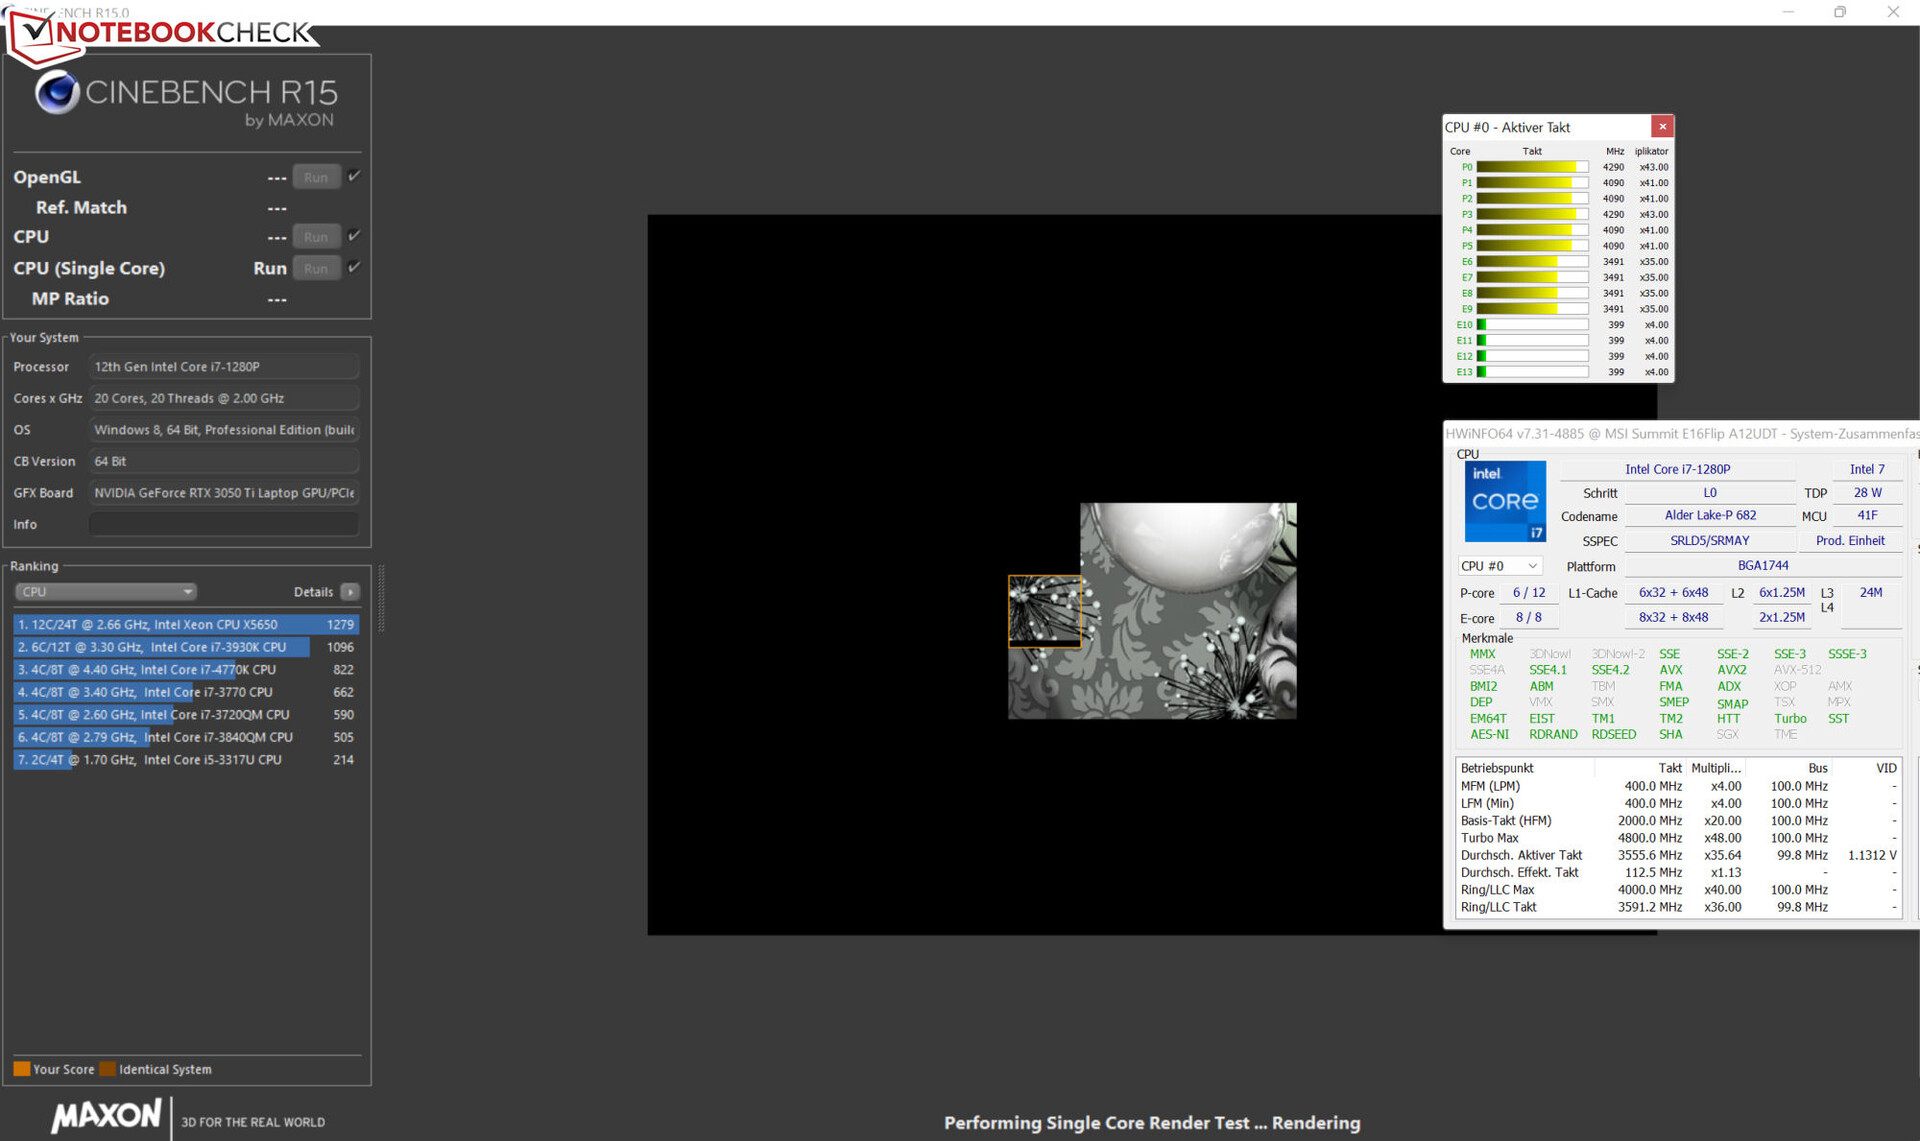
O Lago do AmieiroCore-i7-1280Po processador consiste em 6 núcleos de desempenho (hyperthreading, 2,4 a 4,8 GHz) e 8 núcleos de eficiência (sem hyperthreading, 1,8 a 3,7 GHz), resultando em um total de 20 núcleos de CPU lógica.
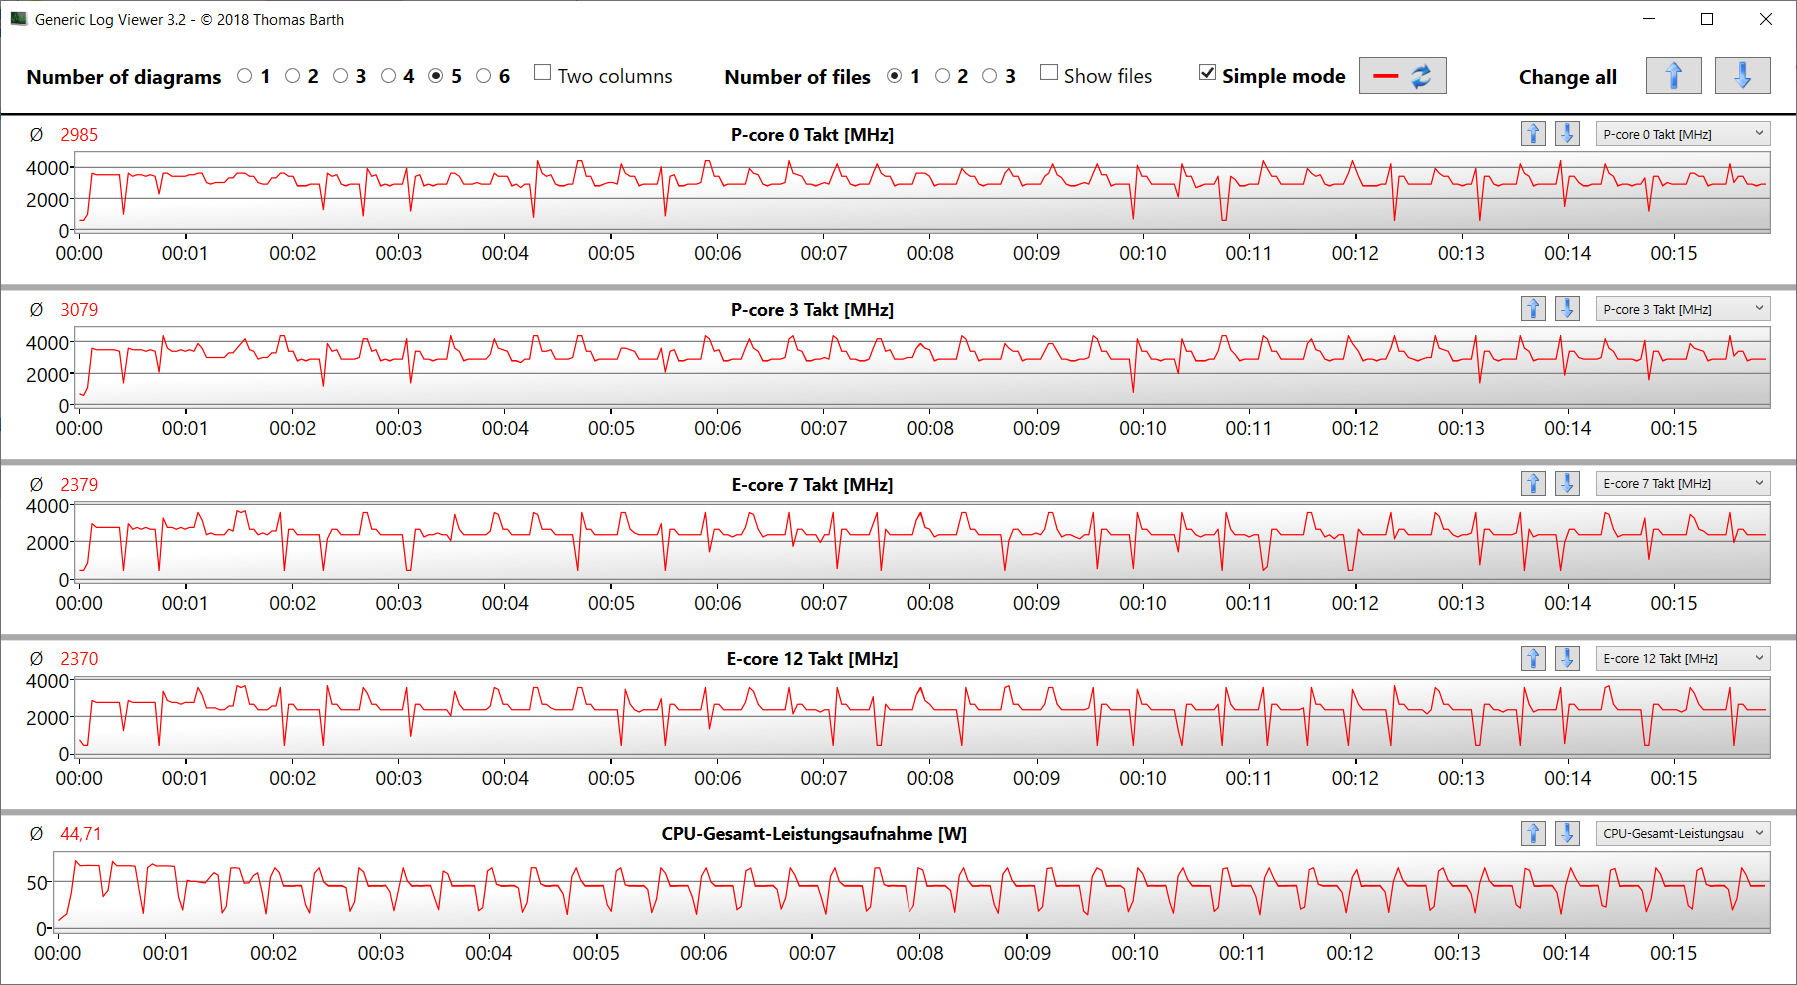
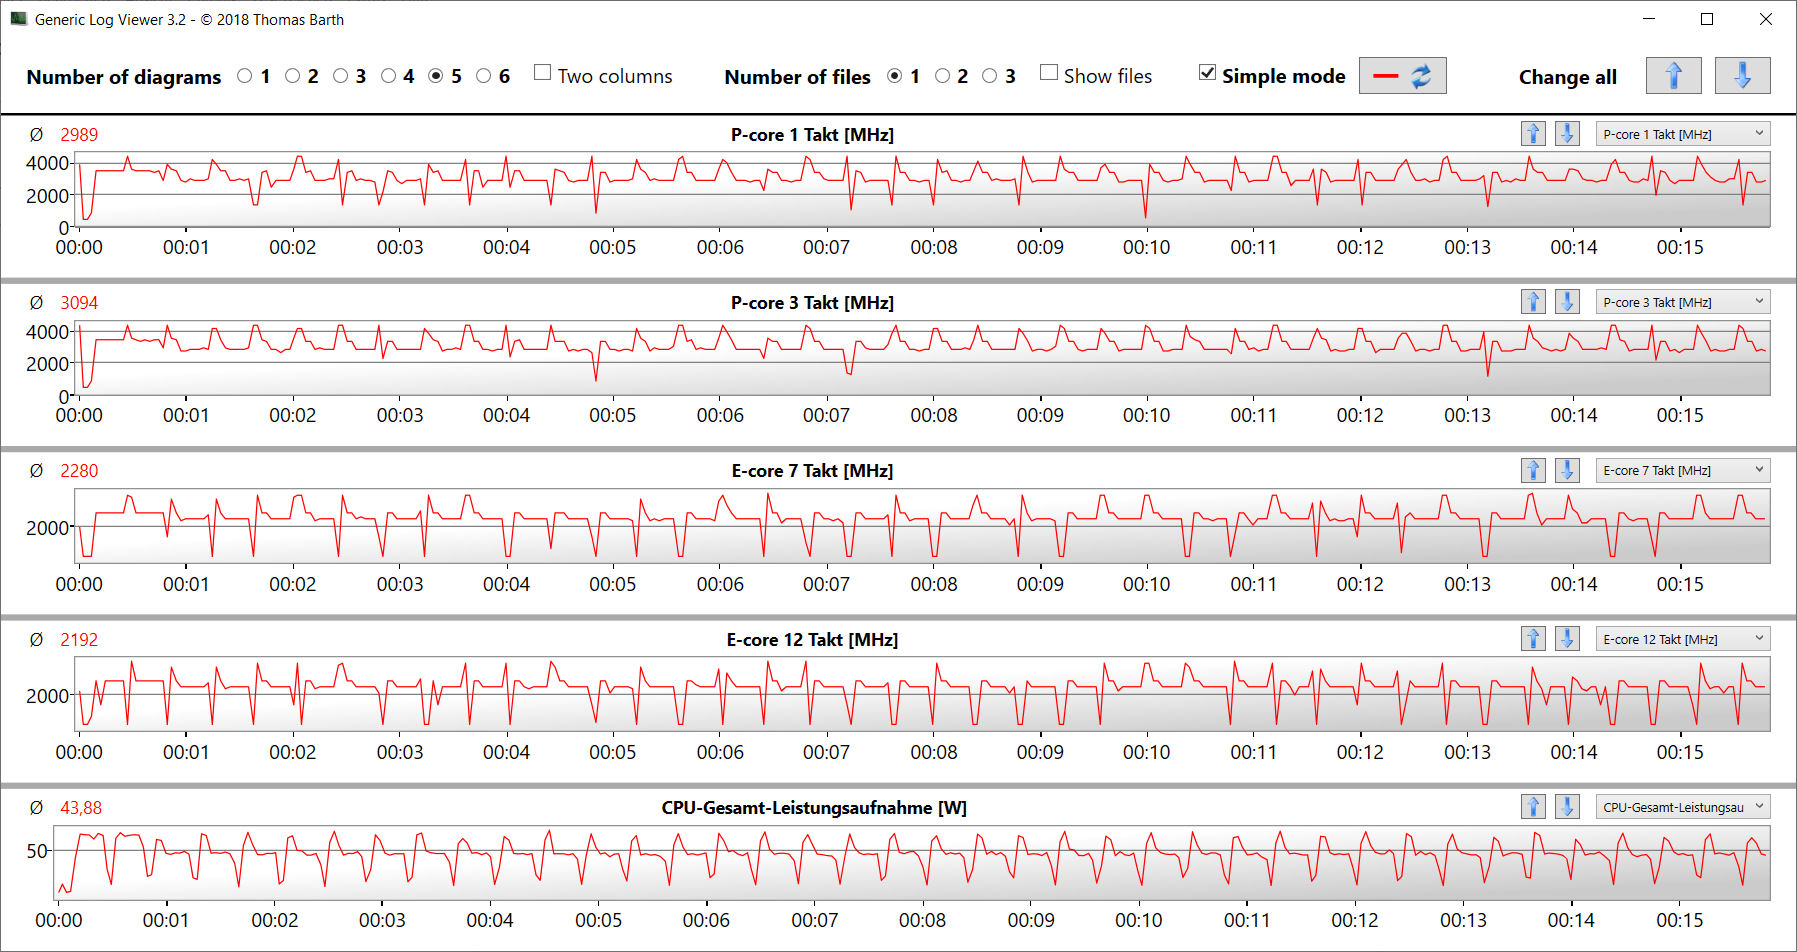
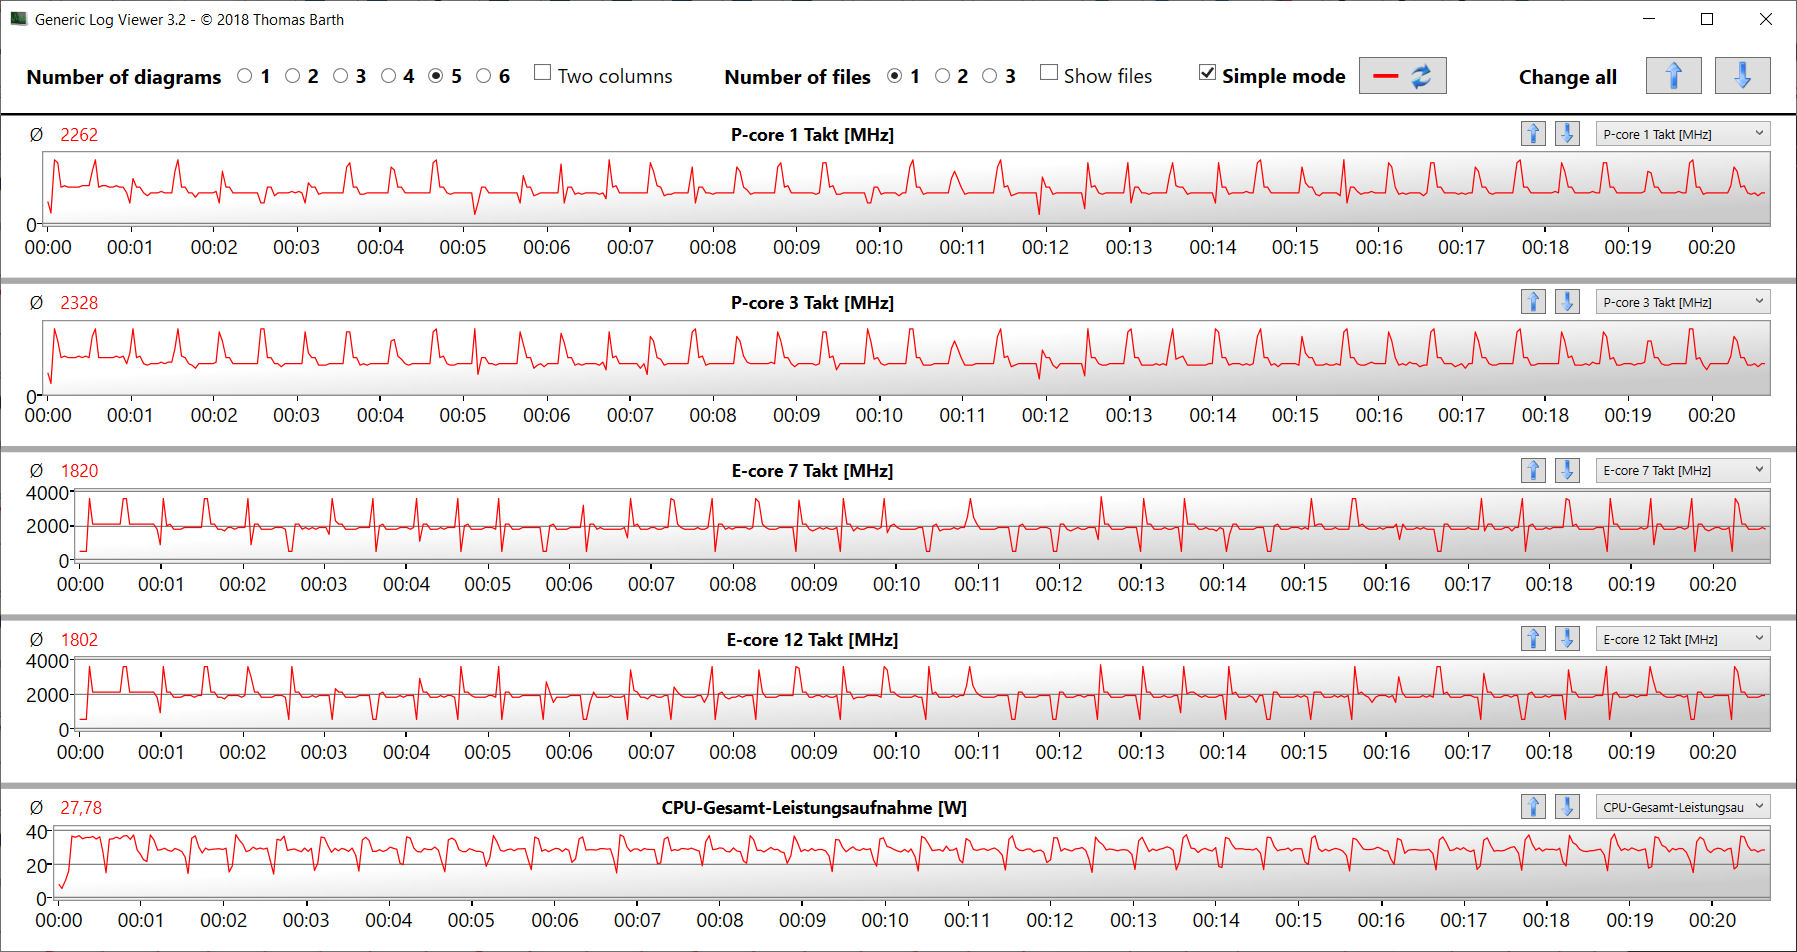
O processador passa pelo teste multi-tarefa do benchmark Cinebench R15 com velocidades de relógio na faixa média Turbo (P: 3,3 - 3,4 GHz, E: 2,8 - 2,9 GHz). O teste de rosca única utiliza a velocidade total do relógio Turbo (P: 3,5 - 4,8 GHz, E: 400 MHz - 3,5 GHz). Na operação por bateria, as velocidades do relógio são minimamente mais baixas. Usamos aqui o perfil de "Alto Desempenho". Ao usar os outros três perfis de potência, as velocidades do relógio são significativamente mais baixas em peças
Enquanto o teste de loop CB15 confirma o uso constante da velocidade Turbo da CPU, a velocidade do relógio cai ligeiramente após a terceira corrida.
Cinebench R15 Multi Constant Load Test
* ... menor é melhor
AIDA64: FP32 Ray-Trace | FPU Julia | CPU SHA3 | CPU Queen | FPU SinJulia | FPU Mandel | CPU AES | CPU ZLib | FP64 Ray-Trace | CPU PhotoWorxx
| Performance rating | |
| MSI Summit E16 Flip A12UDT-031 | |
| Média da turma Convertible | |
| Média Intel Core i7-1280P | |
| Samsung Galaxy Book Pro 360 15 NP950QDB-KC3DE | |
| Dell Inspiron 16 7620 2-in-1 | |
| Asus ExpertBook B2 Flip B2502FBA-N80141X | |
| AIDA64 / FP32 Ray-Trace | |
| Média da turma Convertible (1480 - 64158, n=48, últimos 2 anos) | |
| MSI Summit E16 Flip A12UDT-031 | |
| Média Intel Core i7-1280P (7466 - 13068, n=6) | |
| Samsung Galaxy Book Pro 360 15 NP950QDB-KC3DE | |
| Asus ExpertBook B2 Flip B2502FBA-N80141X | |
| Dell Inspiron 16 7620 2-in-1 | |
| AIDA64 / FPU Julia | |
| MSI Summit E16 Flip A12UDT-031 | |
| Média da turma Convertible (11392 - 188126, n=48, últimos 2 anos) | |
| Média Intel Core i7-1280P (38904 - 66081, n=6) | |
| Asus ExpertBook B2 Flip B2502FBA-N80141X | |
| Samsung Galaxy Book Pro 360 15 NP950QDB-KC3DE | |
| Dell Inspiron 16 7620 2-in-1 | |
| AIDA64 / CPU SHA3 | |
| MSI Summit E16 Flip A12UDT-031 | |
| Média da turma Convertible (797 - 8291, n=48, últimos 2 anos) | |
| Média Intel Core i7-1280P (1826 - 2992, n=6) | |
| Samsung Galaxy Book Pro 360 15 NP950QDB-KC3DE | |
| Dell Inspiron 16 7620 2-in-1 | |
| Asus ExpertBook B2 Flip B2502FBA-N80141X | |
| AIDA64 / CPU Queen | |
| MSI Summit E16 Flip A12UDT-031 | |
| Média Intel Core i7-1280P (80180 - 100358, n=6) | |
| Dell Inspiron 16 7620 2-in-1 | |
| Média da turma Convertible (14686 - 148874, n=38, últimos 2 anos) | |
| Asus ExpertBook B2 Flip B2502FBA-N80141X | |
| Samsung Galaxy Book Pro 360 15 NP950QDB-KC3DE | |
| AIDA64 / FPU SinJulia | |
| MSI Summit E16 Flip A12UDT-031 | |
| Média da turma Convertible (1120 - 29155, n=48, últimos 2 anos) | |
| Média Intel Core i7-1280P (5880 - 8571, n=6) | |
| Dell Inspiron 16 7620 2-in-1 | |
| Asus ExpertBook B2 Flip B2502FBA-N80141X | |
| Samsung Galaxy Book Pro 360 15 NP950QDB-KC3DE | |
| AIDA64 / FPU Mandel | |
| Média da turma Convertible (4929 - 100132, n=48, últimos 2 anos) | |
| MSI Summit E16 Flip A12UDT-031 | |
| Média Intel Core i7-1280P (18907 - 32766, n=6) | |
| Samsung Galaxy Book Pro 360 15 NP950QDB-KC3DE | |
| Asus ExpertBook B2 Flip B2502FBA-N80141X | |
| Dell Inspiron 16 7620 2-in-1 | |
| AIDA64 / CPU AES | |
| Samsung Galaxy Book Pro 360 15 NP950QDB-KC3DE | |
| MSI Summit E16 Flip A12UDT-031 | |
| Média Intel Core i7-1280P (40691 - 99367, n=6) | |
| Média da turma Convertible (5271 - 190280, n=48, últimos 2 anos) | |
| Dell Inspiron 16 7620 2-in-1 | |
| Asus ExpertBook B2 Flip B2502FBA-N80141X | |
| AIDA64 / CPU ZLib | |
| MSI Summit E16 Flip A12UDT-031 | |
| Média da turma Convertible (218 - 2017, n=48, últimos 2 anos) | |
| Média Intel Core i7-1280P (540 - 880, n=6) | |
| Dell Inspiron 16 7620 2-in-1 | |
| Asus ExpertBook B2 Flip B2502FBA-N80141X | |
| Samsung Galaxy Book Pro 360 15 NP950QDB-KC3DE | |
| AIDA64 / FP64 Ray-Trace | |
| Média da turma Convertible (1169 - 34297, n=48, últimos 2 anos) | |
| MSI Summit E16 Flip A12UDT-031 | |
| Média Intel Core i7-1280P (4006 - 7184, n=6) | |
| Samsung Galaxy Book Pro 360 15 NP950QDB-KC3DE | |
| Asus ExpertBook B2 Flip B2502FBA-N80141X | |
| Dell Inspiron 16 7620 2-in-1 | |
| AIDA64 / CPU PhotoWorxx | |
| Média da turma Convertible (14193 - 85327, n=48, últimos 2 anos) | |
| Média Intel Core i7-1280P (36663 - 48416, n=6) | |
| MSI Summit E16 Flip A12UDT-031 | |
| Samsung Galaxy Book Pro 360 15 NP950QDB-KC3DE | |
| Asus ExpertBook B2 Flip B2502FBA-N80141X | |
| Dell Inspiron 16 7620 2-in-1 | |
Desempenho do sistema
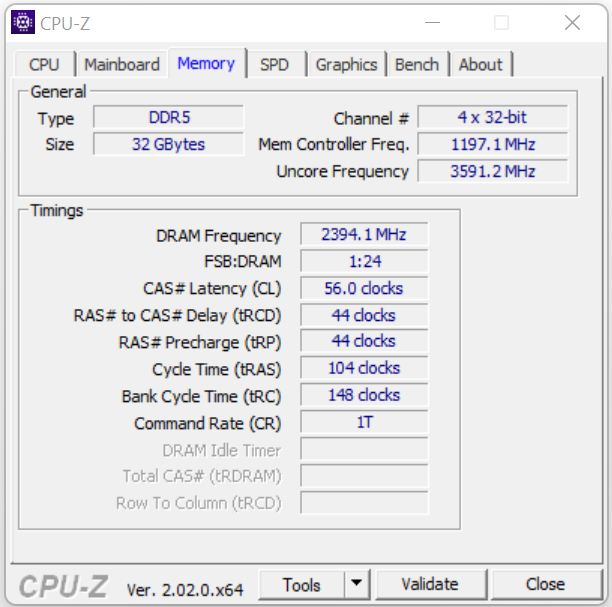
O sistema que funciona bem proporciona desempenho mais do que suficiente para aplicações Office e Internet. O núcleo gráfico dedicado também permite a execução de tarefas gráficas intensivas. As taxas de transferência da memória de trabalho estão em um nível normal para armazenamento LPDDR5-4800 (modo de canal duplo, soldado, sem bancos de armazenamento). Isto é acompanhado de muito bons resultados PC-Mark.
CrossMark: Overall | Productivity | Creativity | Responsiveness
| PCMark 10 / Score | |
| Média da turma Convertible (3229 - 10123, n=46, últimos 2 anos) | |
| Média Intel Core i7-1280P, NVIDIA GeForce RTX 3050 Ti Laptop GPU (5984 - 6379, n=2) | |
| MSI Summit E16 Flip A12UDT-031 | |
| Dell Inspiron 16 7620 2-in-1 | |
| Samsung Galaxy Book Pro 360 15 NP950QDB-KC3DE | |
| Asus ExpertBook B2 Flip B2502FBA-N80141X | |
| PCMark 10 / Essentials | |
| Média da turma Convertible (7233 - 12222, n=46, últimos 2 anos) | |
| Média Intel Core i7-1280P, NVIDIA GeForce RTX 3050 Ti Laptop GPU (9687 - 10227, n=2) | |
| MSI Summit E16 Flip A12UDT-031 | |
| Samsung Galaxy Book Pro 360 15 NP950QDB-KC3DE | |
| Dell Inspiron 16 7620 2-in-1 | |
| Asus ExpertBook B2 Flip B2502FBA-N80141X | |
| PCMark 10 / Productivity | |
| Média da turma Convertible (5062 - 17914, n=46, últimos 2 anos) | |
| Média Intel Core i7-1280P, NVIDIA GeForce RTX 3050 Ti Laptop GPU (7521 - 9165, n=2) | |
| MSI Summit E16 Flip A12UDT-031 | |
| Samsung Galaxy Book Pro 360 15 NP950QDB-KC3DE | |
| Asus ExpertBook B2 Flip B2502FBA-N80141X | |
| Dell Inspiron 16 7620 2-in-1 | |
| PCMark 10 / Digital Content Creation | |
| Média da turma Convertible (2496 - 16551, n=46, últimos 2 anos) | |
| MSI Summit E16 Flip A12UDT-031 | |
| Média Intel Core i7-1280P, NVIDIA GeForce RTX 3050 Ti Laptop GPU (7518 - 7980, n=2) | |
| Dell Inspiron 16 7620 2-in-1 | |
| Asus ExpertBook B2 Flip B2502FBA-N80141X | |
| Samsung Galaxy Book Pro 360 15 NP950QDB-KC3DE | |
| CrossMark / Overall | |
| Média Intel Core i7-1280P, NVIDIA GeForce RTX 3050 Ti Laptop GPU (1652 - 1671, n=2) | |
| MSI Summit E16 Flip A12UDT-031 | |
| Média da turma Convertible (524 - 2274, n=49, últimos 2 anos) | |
| Dell Inspiron 16 7620 2-in-1 | |
| Asus ExpertBook B2 Flip B2502FBA-N80141X | |
| CrossMark / Productivity | |
| Média Intel Core i7-1280P, NVIDIA GeForce RTX 3050 Ti Laptop GPU (1583 - 1618, n=2) | |
| MSI Summit E16 Flip A12UDT-031 | |
| Média da turma Convertible (554 - 1942, n=49, últimos 2 anos) | |
| Asus ExpertBook B2 Flip B2502FBA-N80141X | |
| Dell Inspiron 16 7620 2-in-1 | |
| CrossMark / Creativity | |
| Média da turma Convertible (550 - 2949, n=49, últimos 2 anos) | |
| MSI Summit E16 Flip A12UDT-031 | |
| Média Intel Core i7-1280P, NVIDIA GeForce RTX 3050 Ti Laptop GPU (1752 - 1761, n=2) | |
| Dell Inspiron 16 7620 2-in-1 | |
| Asus ExpertBook B2 Flip B2502FBA-N80141X | |
| CrossMark / Responsiveness | |
| Média Intel Core i7-1280P, NVIDIA GeForce RTX 3050 Ti Laptop GPU (1550 - 1594, n=2) | |
| MSI Summit E16 Flip A12UDT-031 | |
| Asus ExpertBook B2 Flip B2502FBA-N80141X | |
| Média da turma Convertible (381 - 1719, n=49, últimos 2 anos) | |
| Dell Inspiron 16 7620 2-in-1 | |
| PCMark 10 Score | 5984 pontos | |
Ajuda | ||
| AIDA64 / Memory Copy | |
| Média da turma Convertible (23880 - 161475, n=48, últimos 2 anos) | |
| Média Intel Core i7-1280P (56337 - 73486, n=6) | |
| MSI Summit E16 Flip A12UDT-031 | |
| Samsung Galaxy Book Pro 360 15 NP950QDB-KC3DE | |
| Asus ExpertBook B2 Flip B2502FBA-N80141X | |
| Dell Inspiron 16 7620 2-in-1 | |
| AIDA64 / Memory Read | |
| Média da turma Convertible (19931 - 131960, n=48, últimos 2 anos) | |
| Média Intel Core i7-1280P (63221 - 73719, n=6) | |
| MSI Summit E16 Flip A12UDT-031 | |
| Samsung Galaxy Book Pro 360 15 NP950QDB-KC3DE | |
| Asus ExpertBook B2 Flip B2502FBA-N80141X | |
| Dell Inspiron 16 7620 2-in-1 | |
| AIDA64 / Memory Write | |
| Média da turma Convertible (17473 - 216896, n=48, últimos 2 anos) | |
| Samsung Galaxy Book Pro 360 15 NP950QDB-KC3DE | |
| Média Intel Core i7-1280P (58729 - 68247, n=6) | |
| MSI Summit E16 Flip A12UDT-031 | |
| Asus ExpertBook B2 Flip B2502FBA-N80141X | |
| Dell Inspiron 16 7620 2-in-1 | |
| AIDA64 / Memory Latency | |
| MSI Summit E16 Flip A12UDT-031 | |
| Média da turma Convertible (6.9 - 536, n=48, últimos 2 anos) | |
| Média Intel Core i7-1280P (93.1 - 153.3, n=6) | |
| Samsung Galaxy Book Pro 360 15 NP950QDB-KC3DE | |
| Asus ExpertBook B2 Flip B2502FBA-N80141X | |
* ... menor é melhor
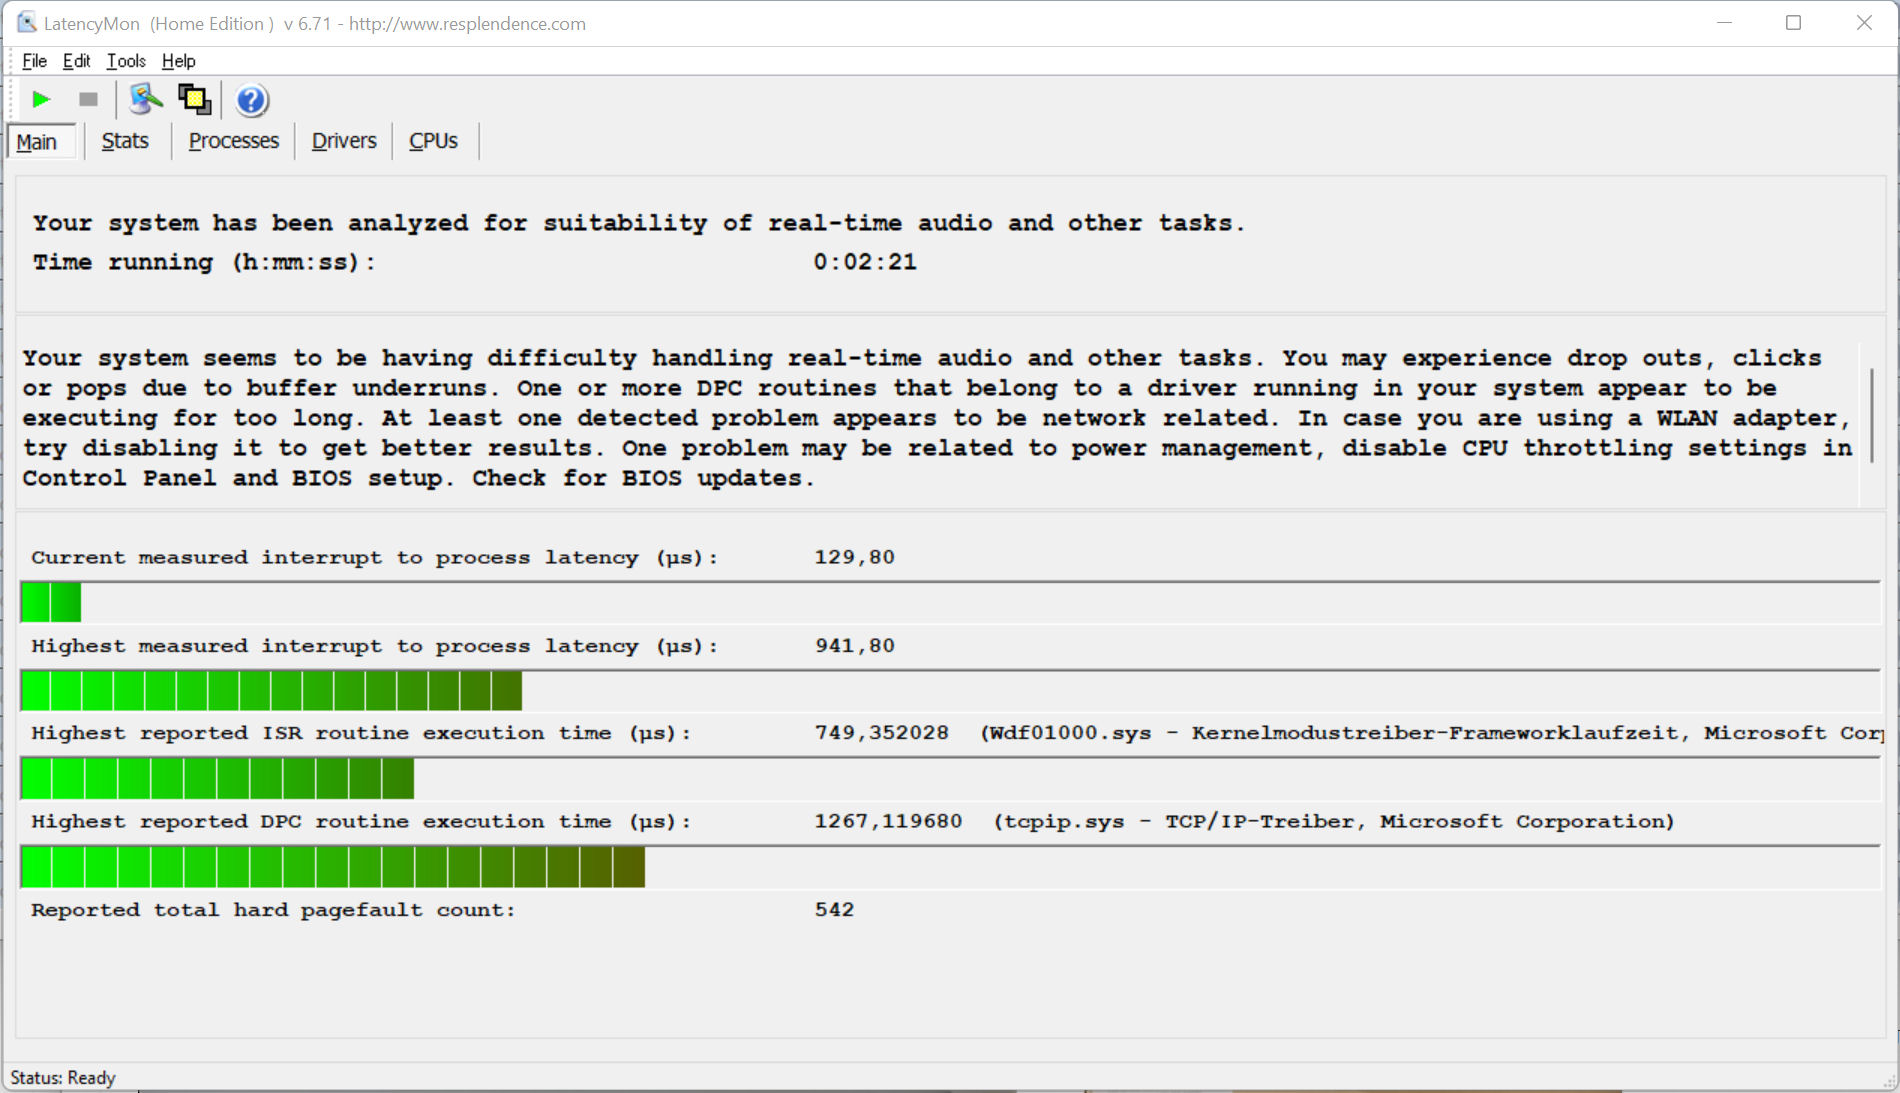
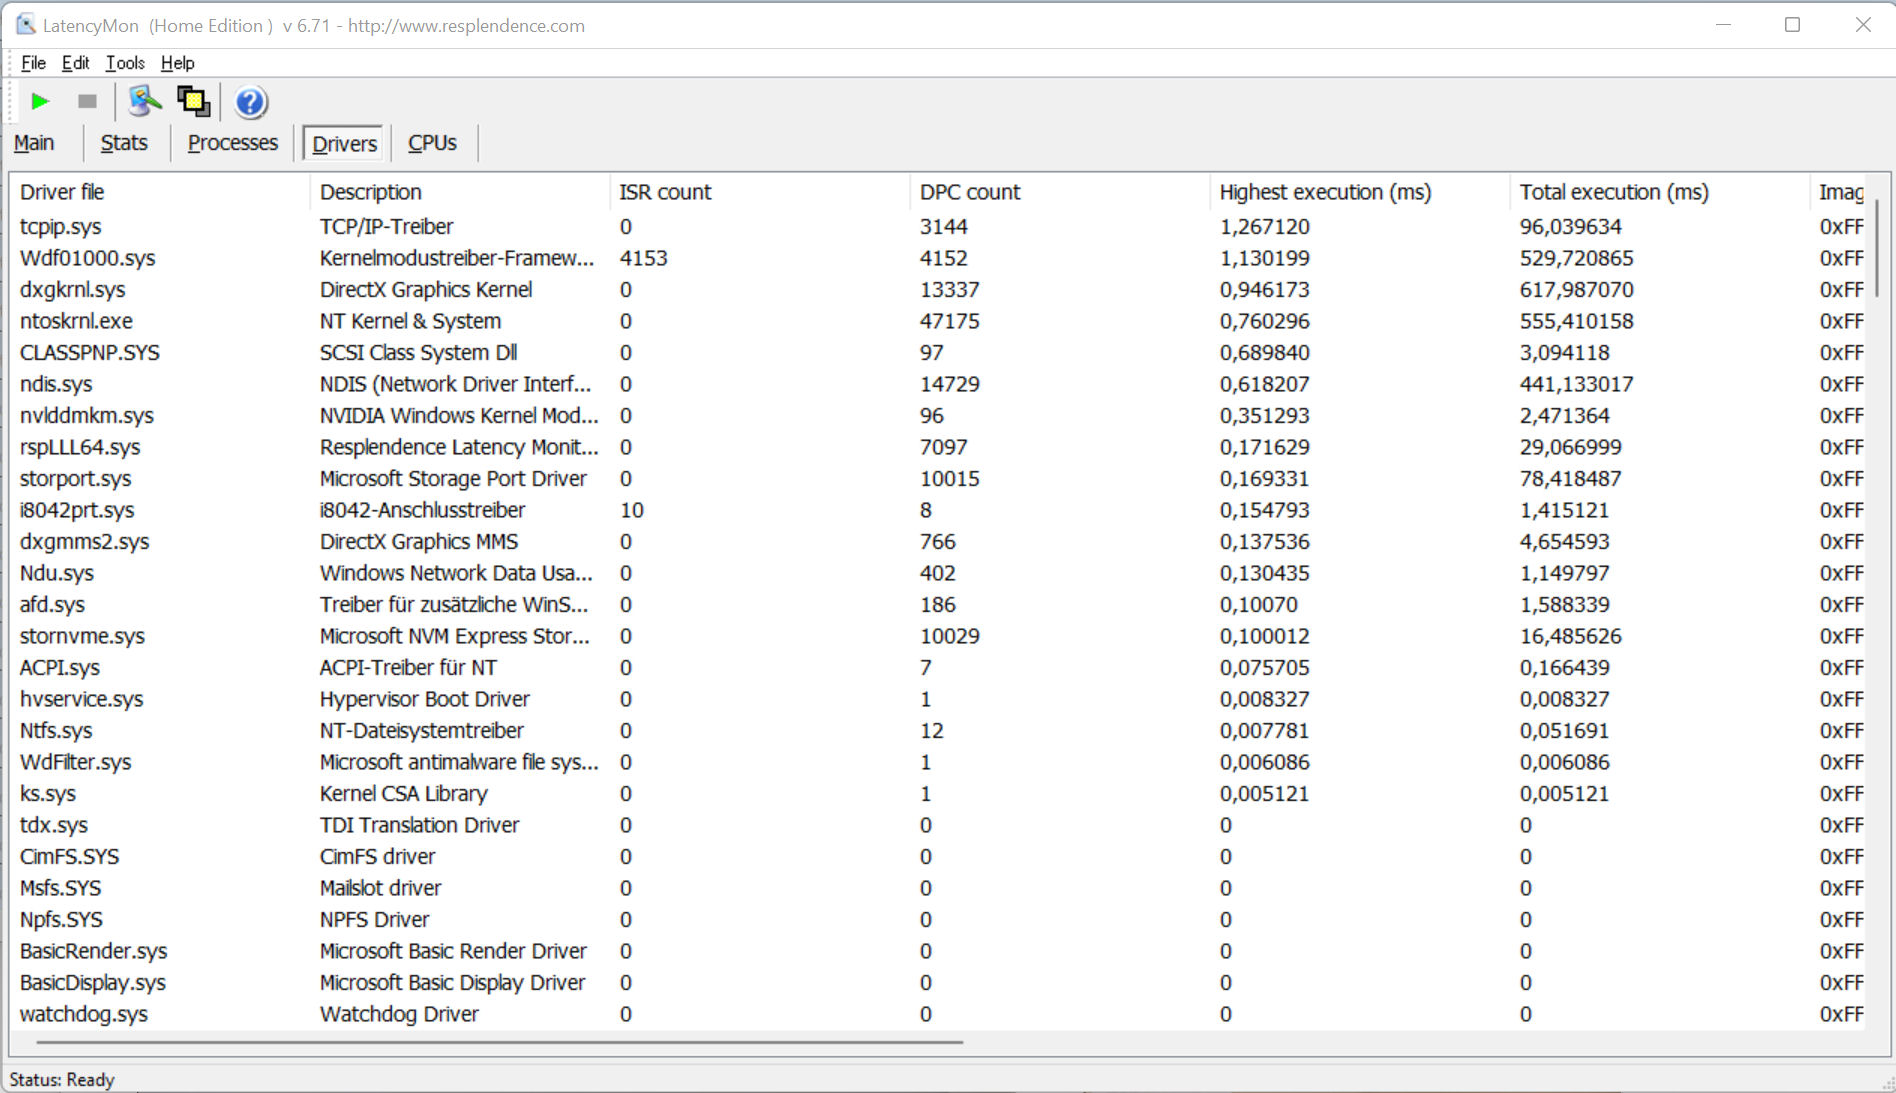
Latências DPC
O teste padronizado do Monitor de Latência (navegação na web, reprodução de vídeos de 4k, Prime95 High Load) revela algum comportamento conspícuo nas latências do DCP. O sistema não parece ser adequado para o processamento de vídeo e áudio em tempo real. Algumas futuras atualizações de software podem trazer algumas melhorias ou mesmo piorar as coisas.
| DPC Latencies / LatencyMon - interrupt to process latency (max), Web, Youtube, Prime95 | |
| Samsung Galaxy Book Pro 360 15 NP950QDB-KC3DE | |
| MSI Summit E16 Flip A12UDT-031 | |
| Asus ExpertBook B2 Flip B2502FBA-N80141X | |
| Dell Inspiron 16 7620 2-in-1 | |
* ... menor é melhor
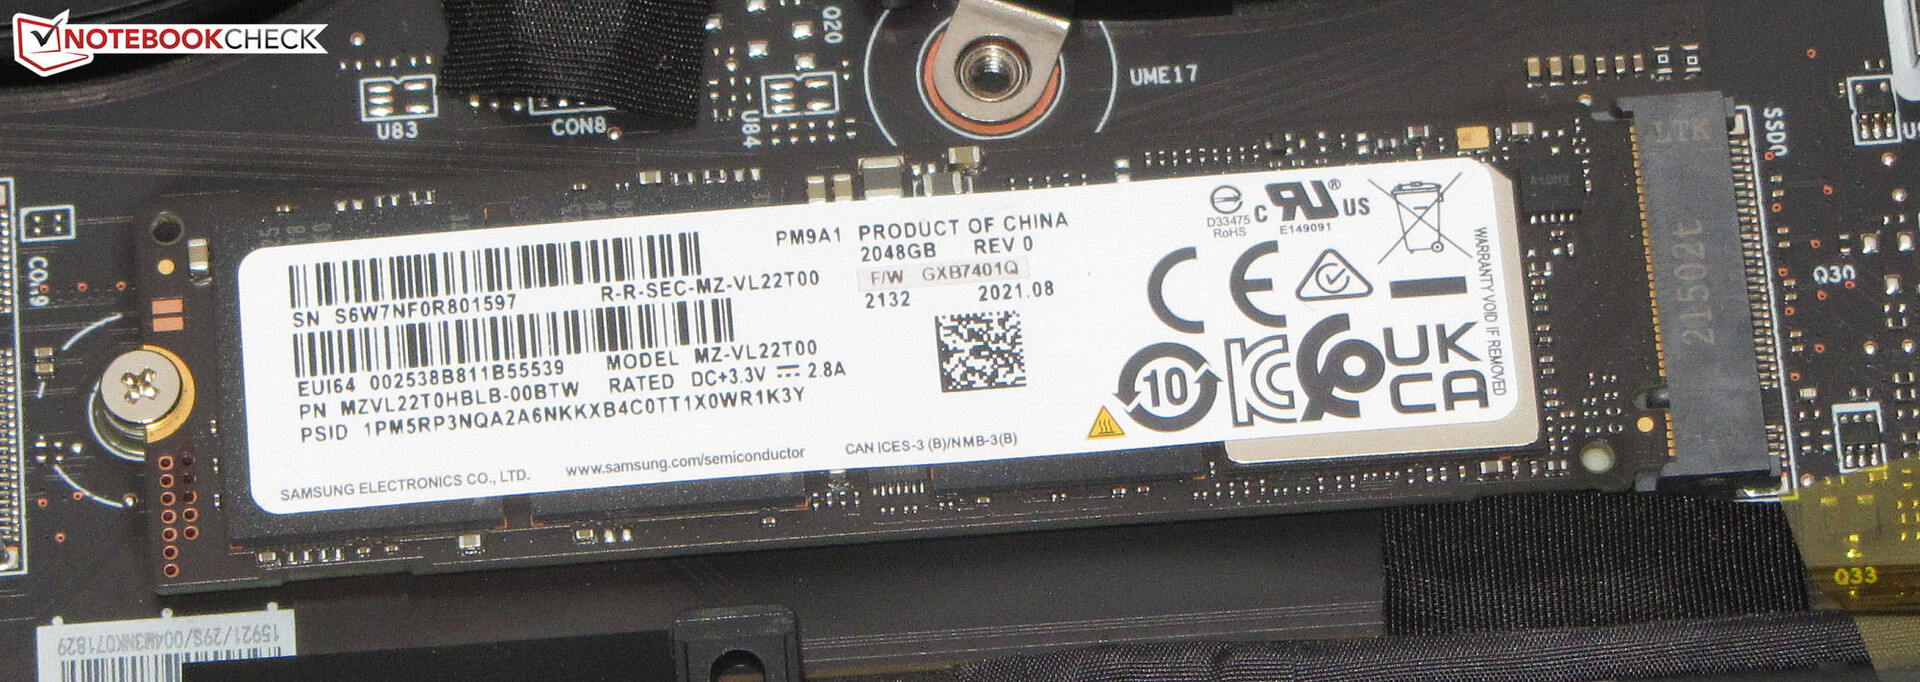
Solução de armazenamento
Um PCIe 4 SSD (M.2-2280) da Samsung com capacidade de armazenamento de 2 TB serve como unidade do sistema. As taxas de transferência se revelam excelentes.

* ... menor é melhor
Constant Performance Reading: DiskSpd Read Loop, Queue Depth 8
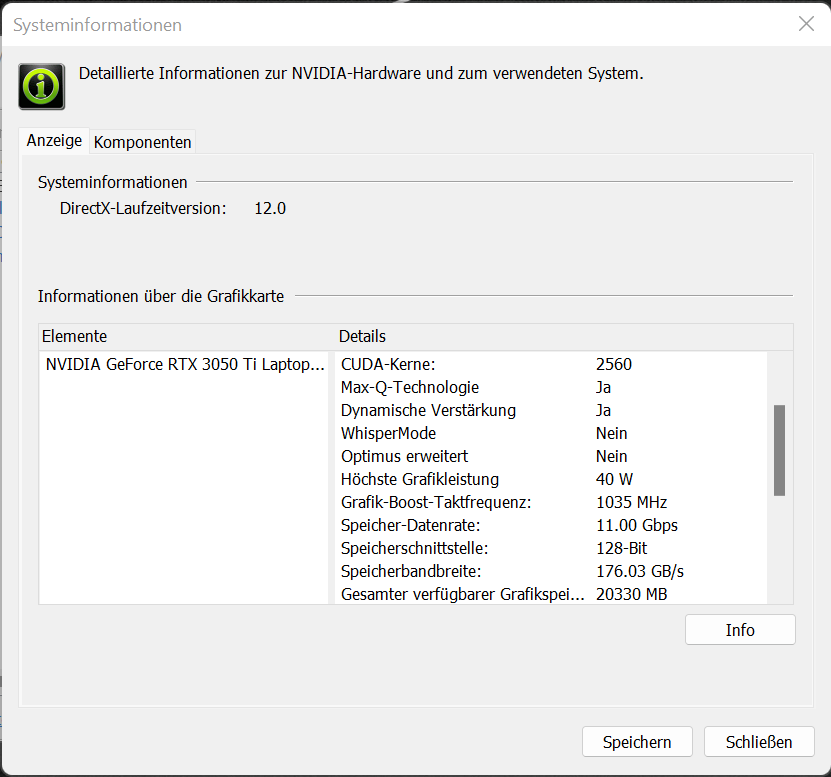
Placa Gráfica
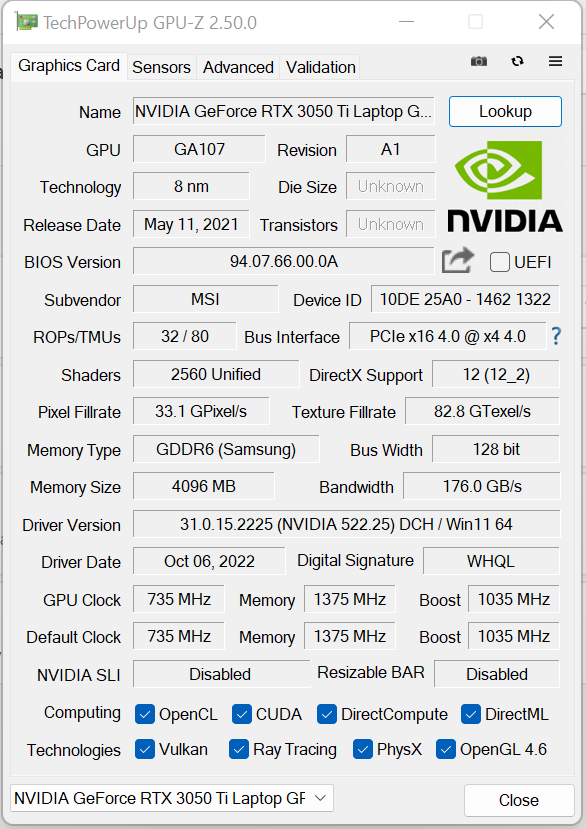
Apesar de um ajuste TGP de 40 watts no fundo das possibilidades, o GeForce Computador portátil RTX 3050 TigPU (VRAM: 4 GB GDDR6) fornece resultados de referência e taxas de quadros que se aproximam da média para o RTX 3050 Ti determinada até agora. No entanto, o TGP não é totalmente utilizado, como mostra o teste Witcher 3.
O laptop permite jogos FHD em configurações altas ao máximo. O uso da resolução total do visor muitas vezes requer a redução das configurações. O conversível não oferece um modo dGPU.
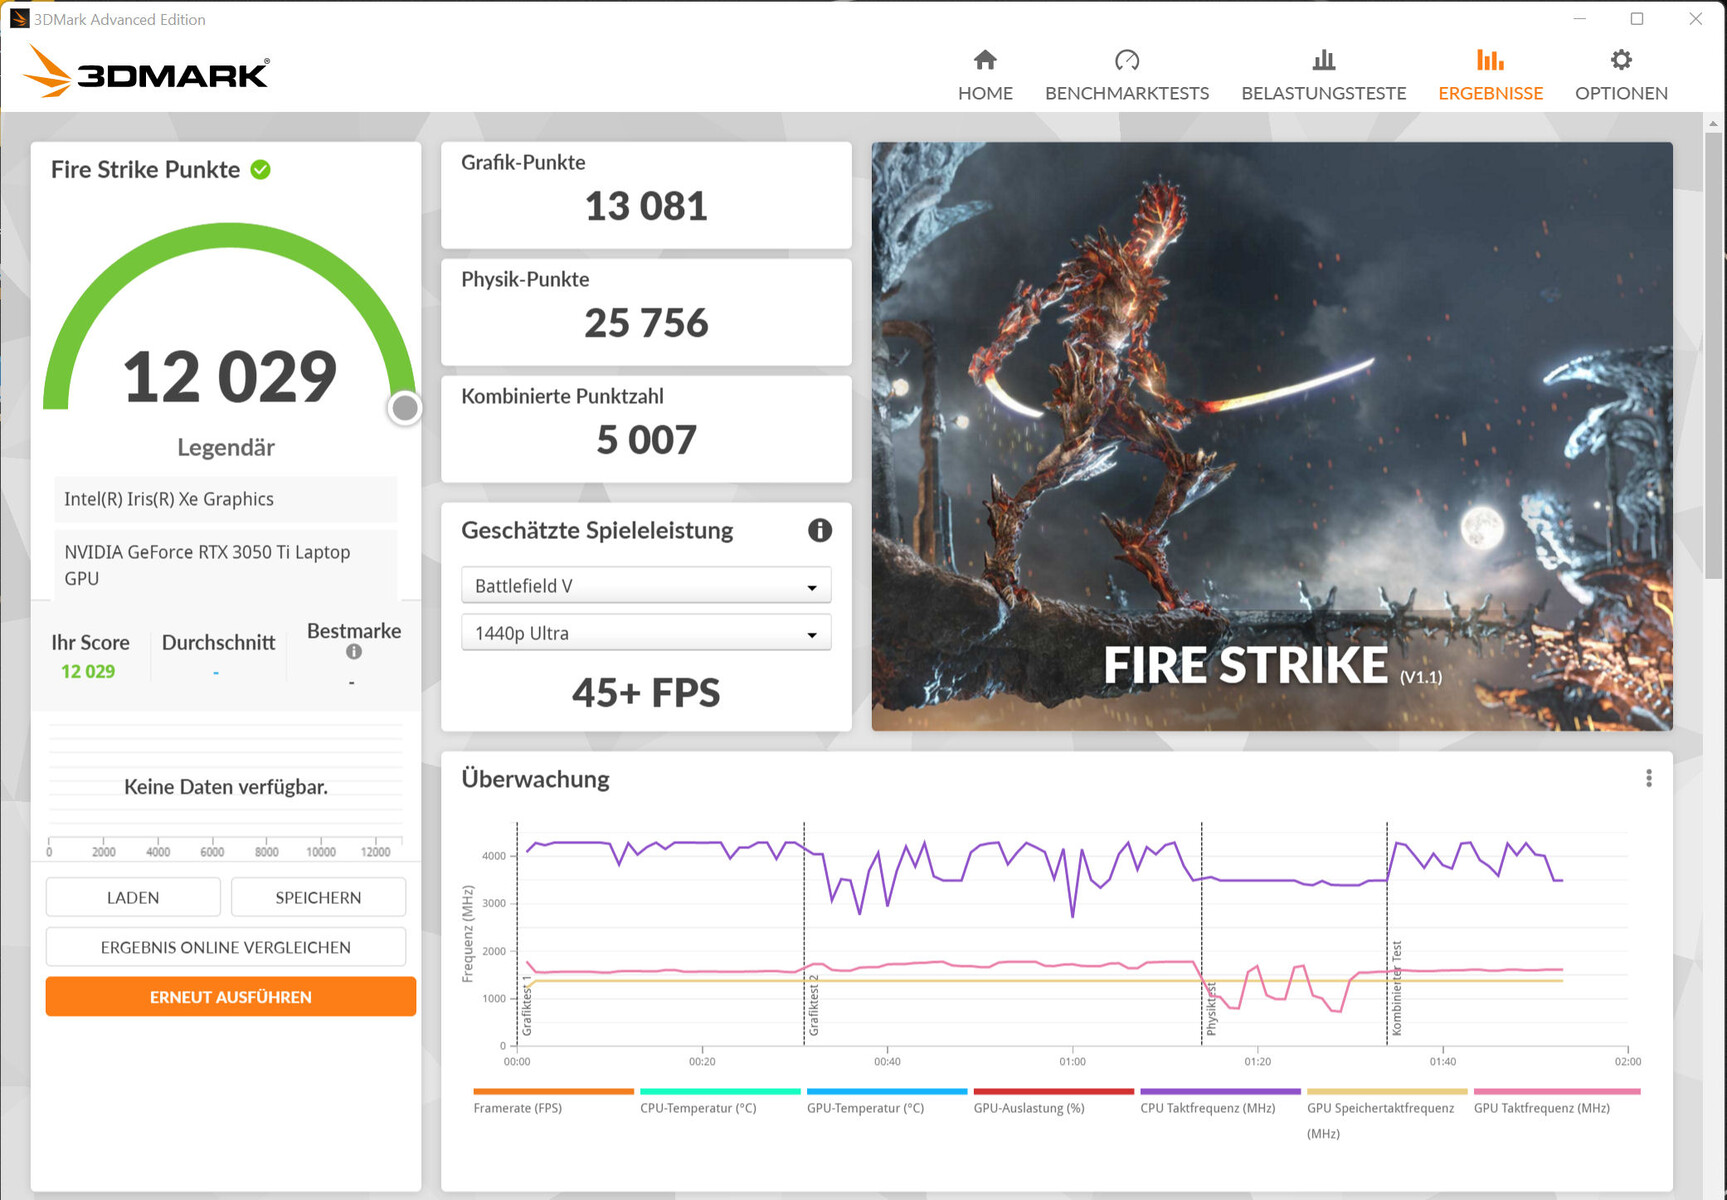
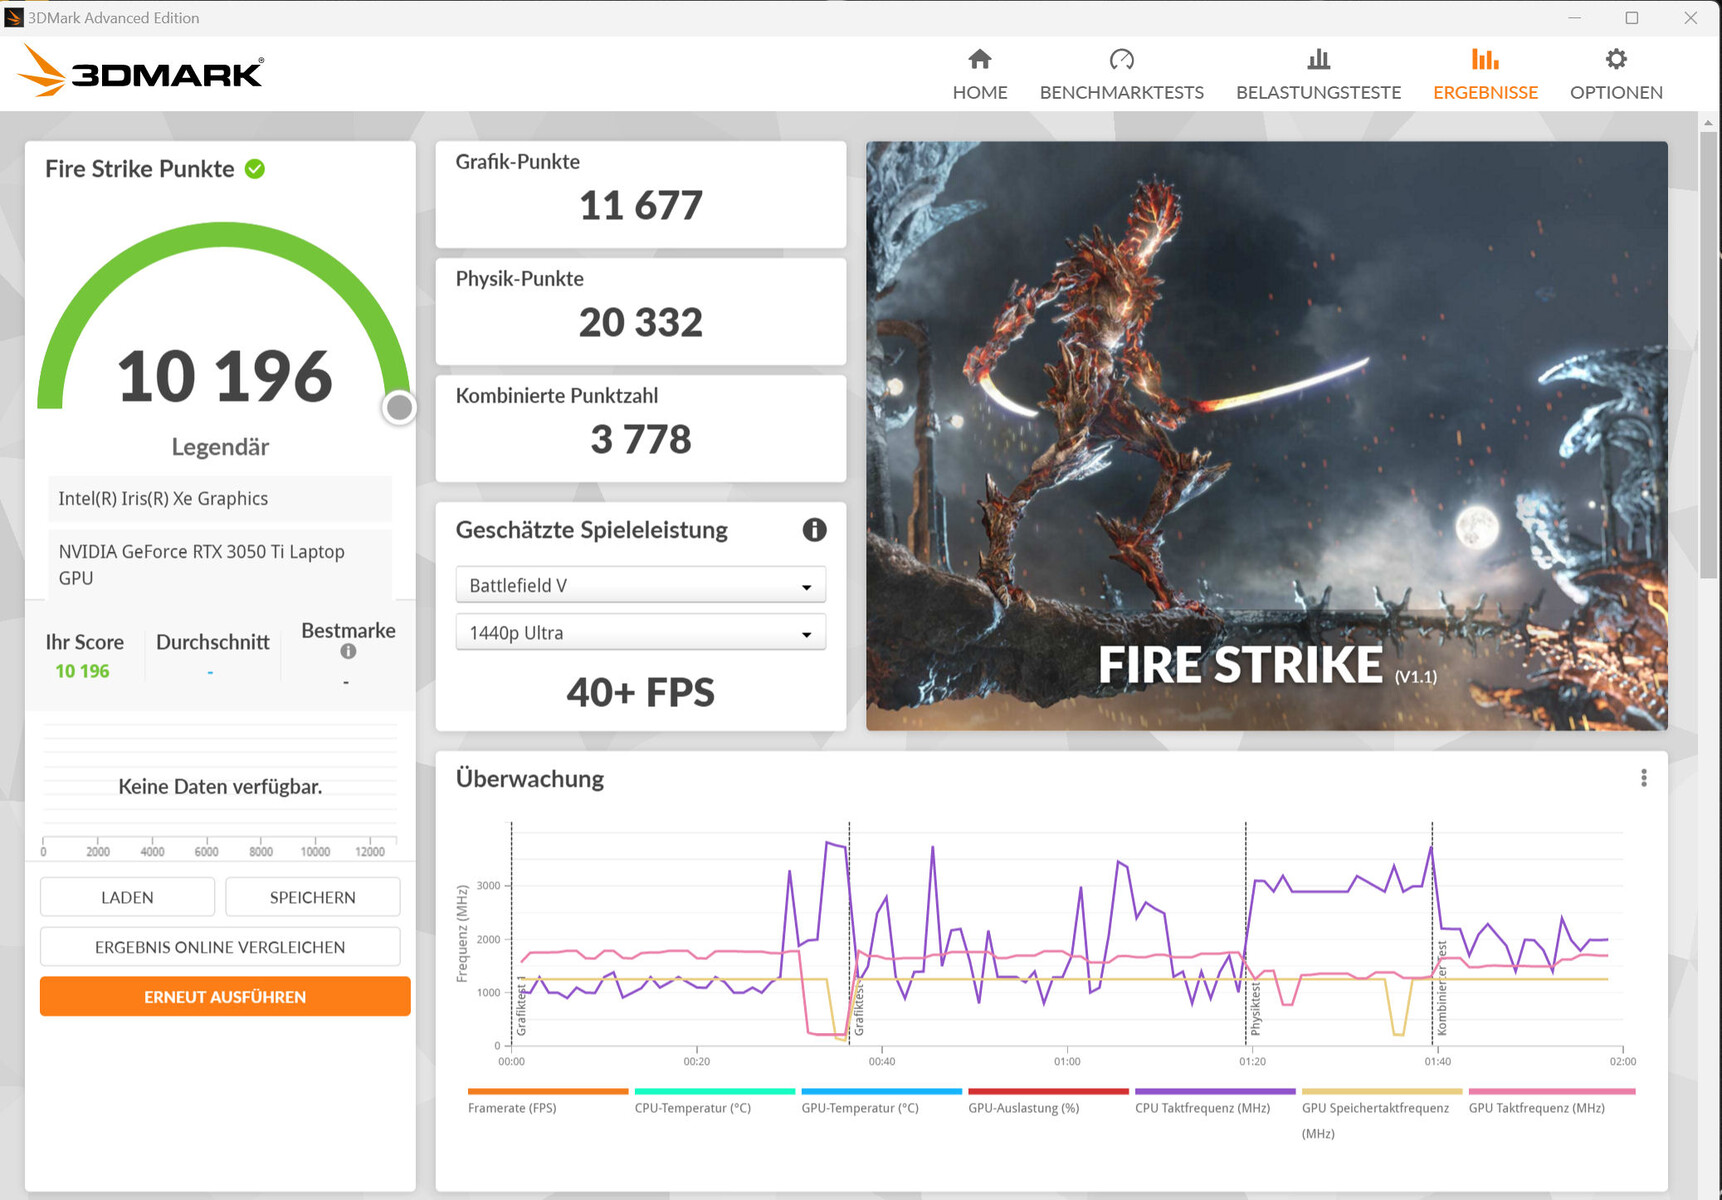
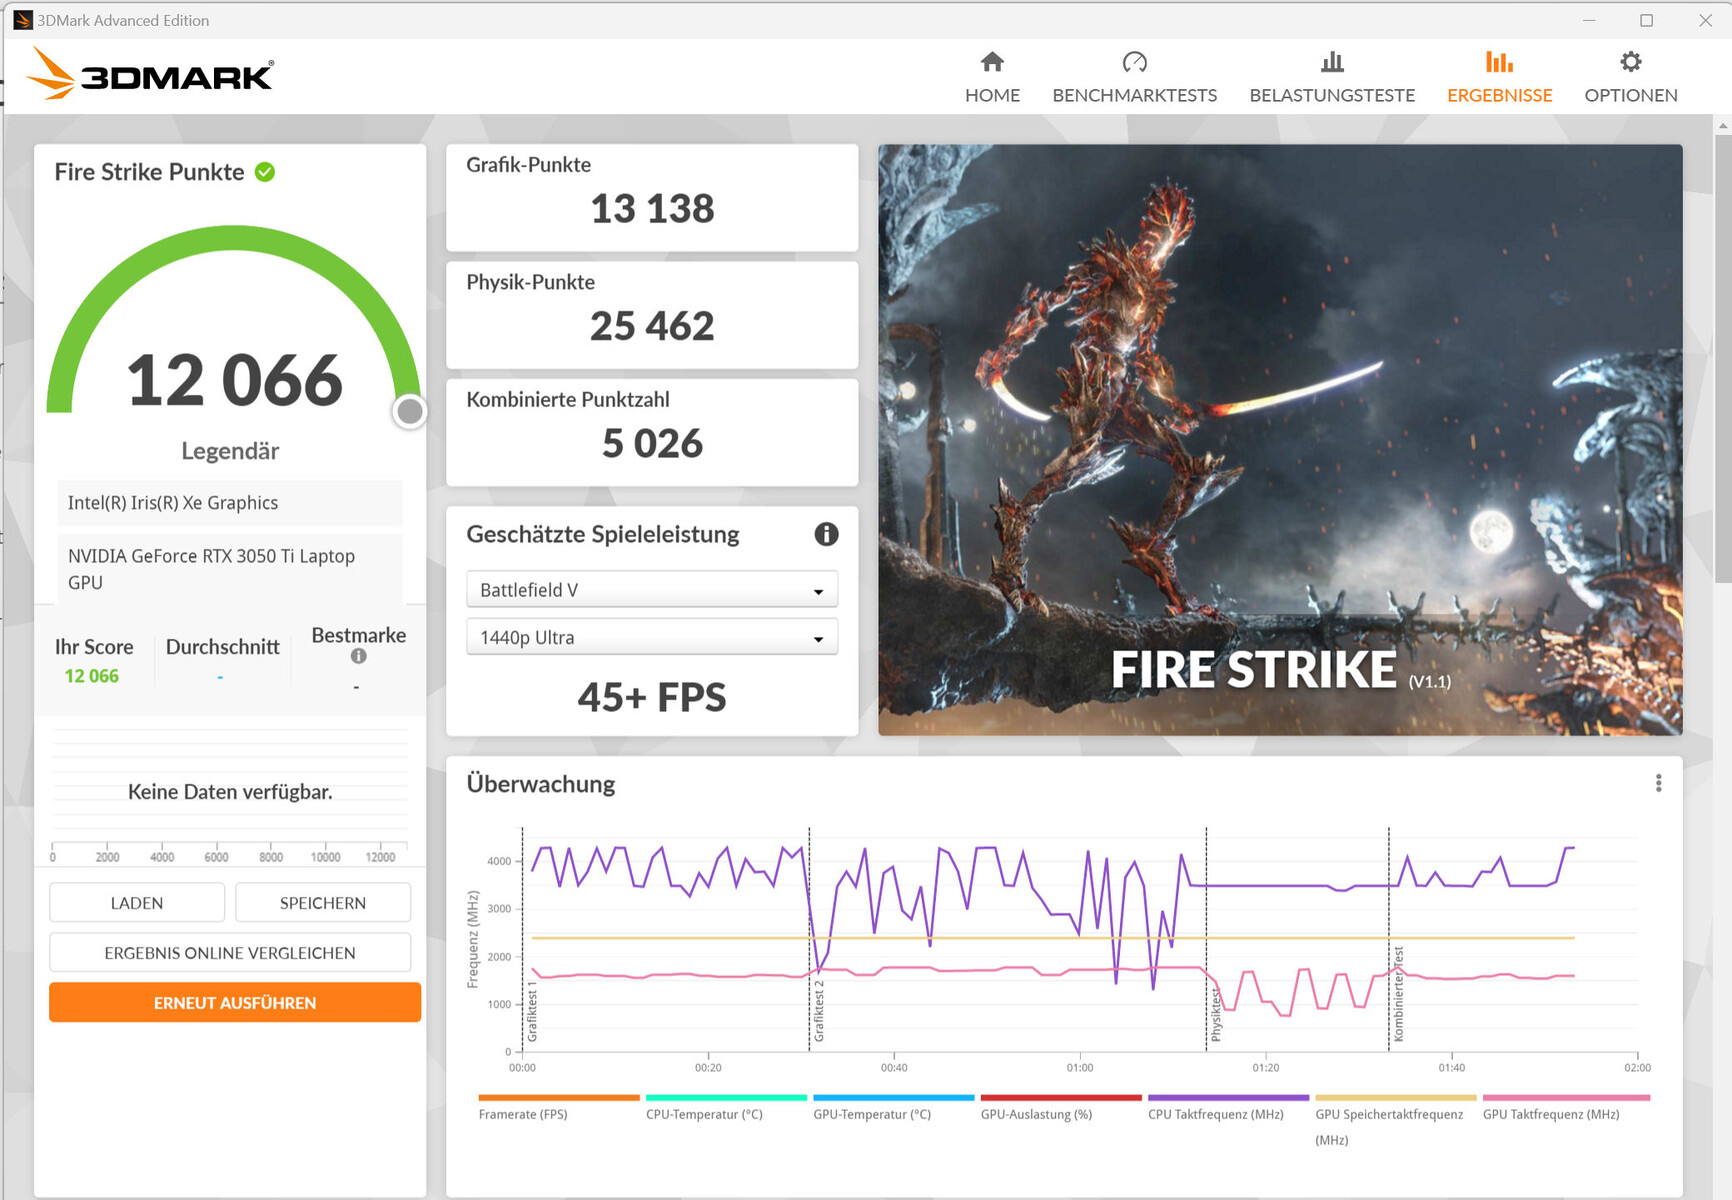

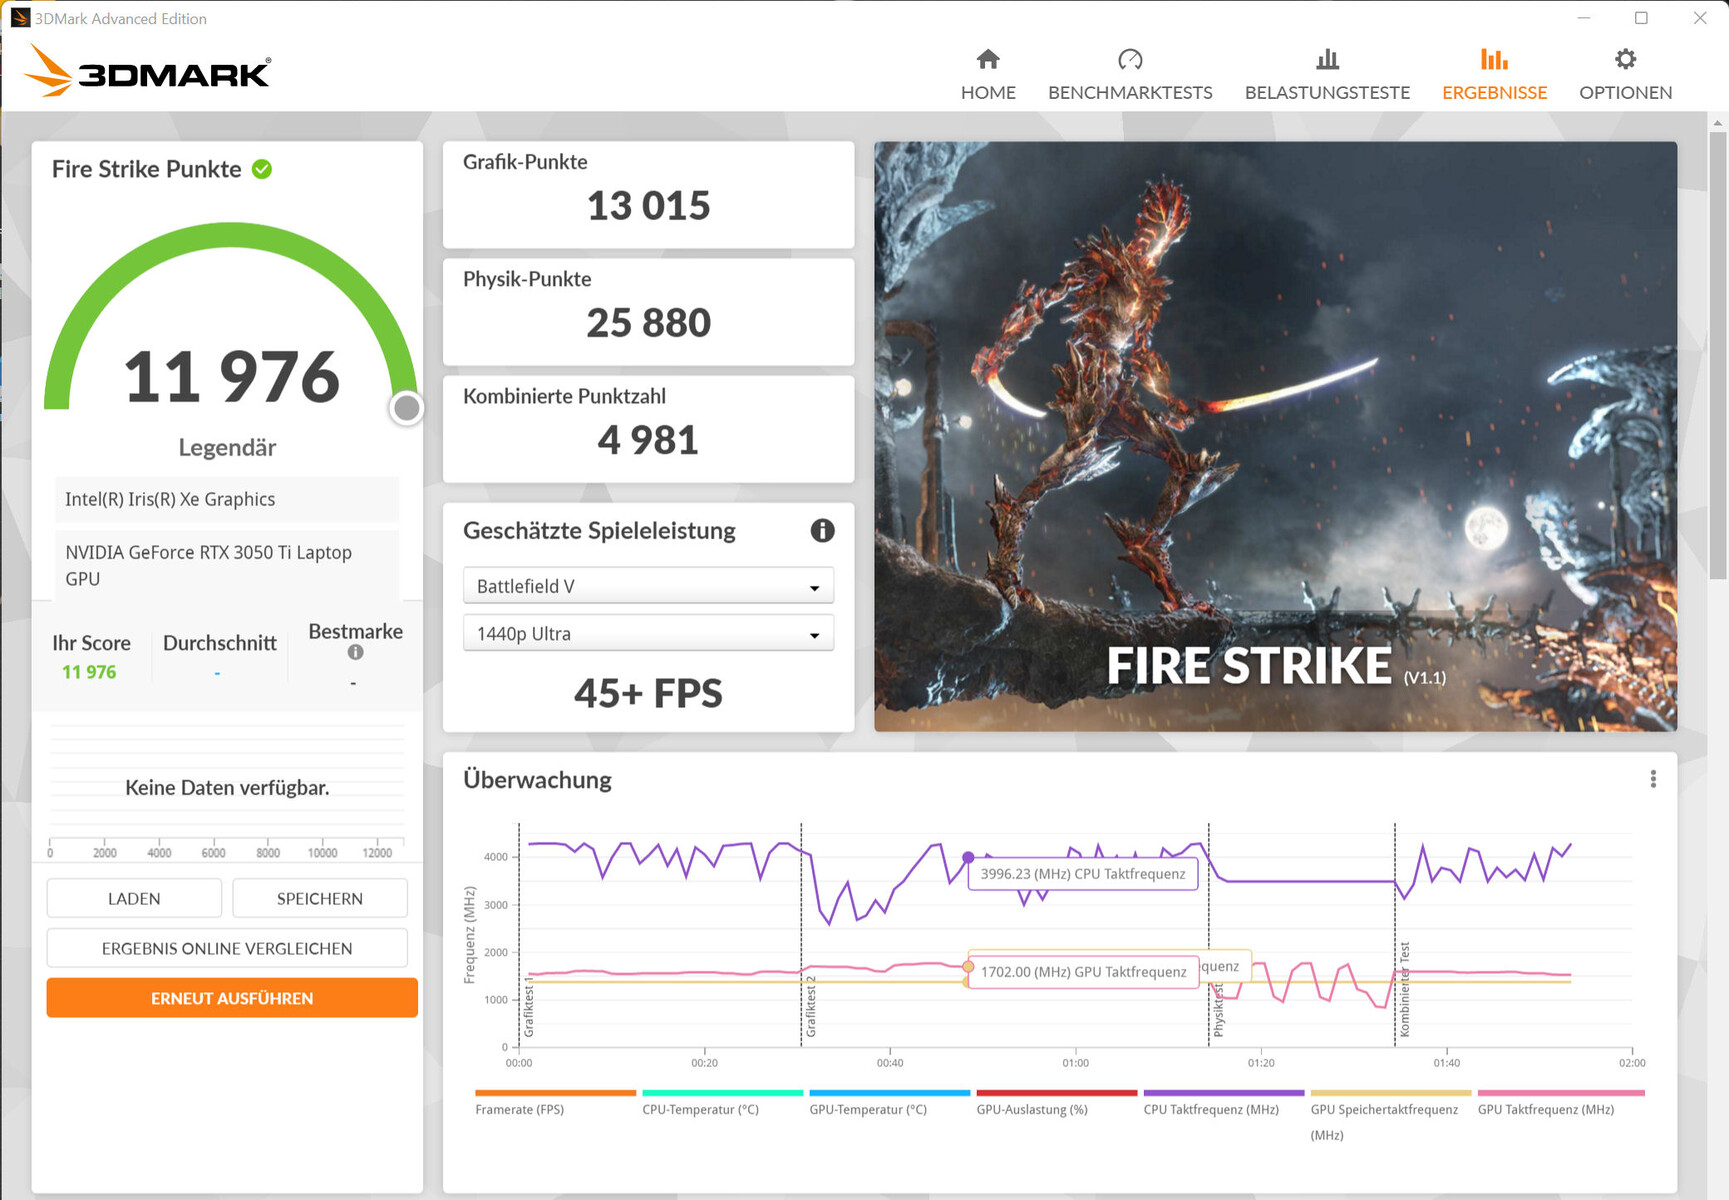
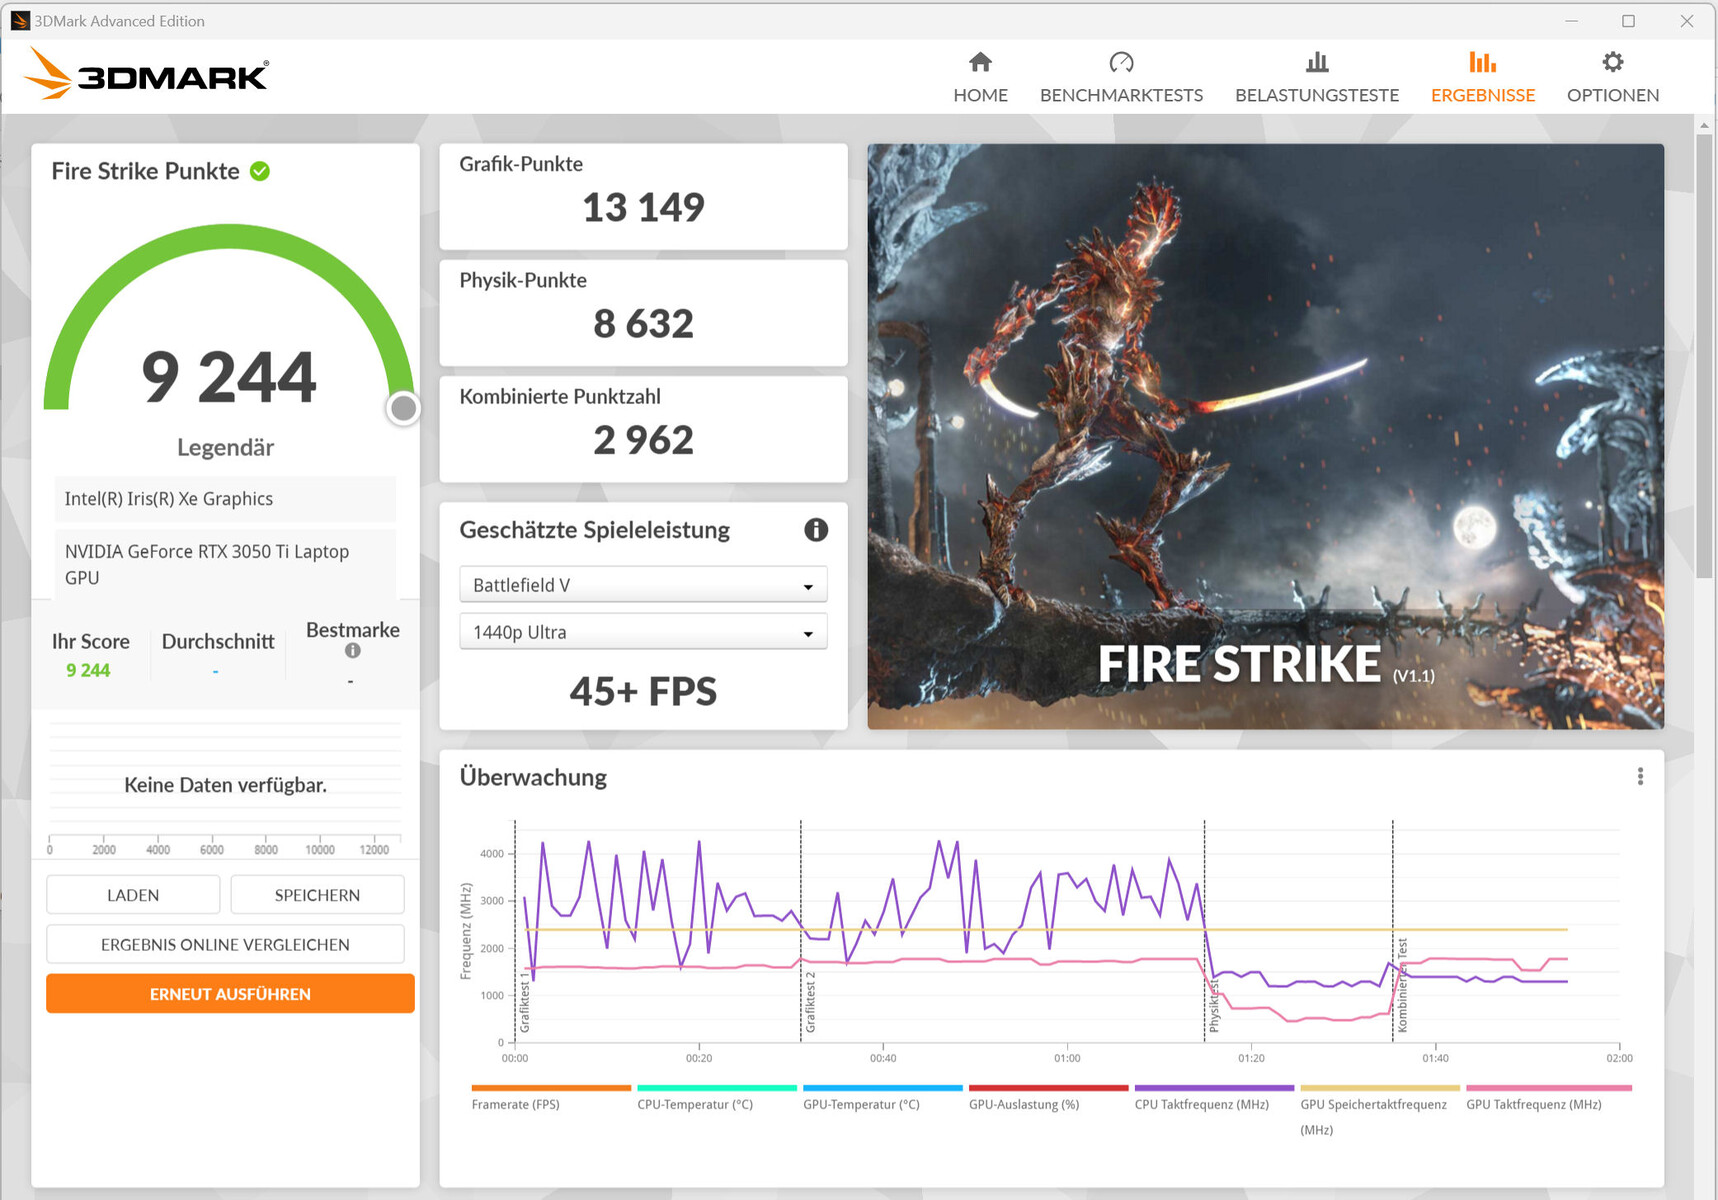
| 3DMark 11 Performance | 17757 pontos | |
| 3DMark Cloud Gate Standard Score | 42521 pontos | |
| 3DMark Fire Strike Score | 12029 pontos | |
| 3DMark Time Spy Score | 5563 pontos | |
Ajuda | ||
| Blender | |
| v3.3 Classroom OPTIX/RTX | |
| MSI Summit E16 Flip A12UDT-031 | |
| v3.3 Classroom CUDA | |
| MSI Summit E16 Flip A12UDT-031 | |
| v3.3 Classroom CPU | |
| Asus ExpertBook B2 Flip B2502FBA-N80141X | |
| Média da turma Convertible (159 - 2067, n=49, últimos 2 anos) | |
| MSI Summit E16 Flip A12UDT-031 | |
* ... menor é melhor
| The Witcher 3 - 1920x1080 Ultra Graphics & Postprocessing (HBAO+) | |
| Dell Inspiron 16 Plus 7620 | |
| Asus Zenbook Pro 15 OLED UM535Q | |
| Média NVIDIA GeForce RTX 3050 Ti Laptop GPU (19 - 58.5, n=29) | |
| MSI Summit E16 Flip A12UDT-031 | |
| Média da turma Convertible (13.4 - 101, n=3, últimos 2 anos) | |
| Dell Inspiron 16 7620 2-in-1 | |
| Asus ExpertBook B2 Flip B2502FBA-N80141X | |
| F1 22 - 1920x1080 High Preset AA:T AF:16x | |
| Média NVIDIA GeForce RTX 3050 Ti Laptop GPU (48 - 113, n=7) | |
| MSI Summit E16 Flip A12UDT-031 | |
| Média da turma Convertible (23 - 70.3, n=10, últimos 2 anos) | |
The Witcher 3 FPS Chart
| baixo | média | alto | ultra | QHD | |
|---|---|---|---|---|---|
| GTA V (2015) | 179.7 | 173.8 | 114.3 | 57.1 | 41.4 |
| The Witcher 3 (2015) | 186.1 | 109.3 | 63.7 | 46.4 | |
| Dota 2 Reborn (2015) | 134.8 | 122.8 | 117.9 | 114.1 | |
| Final Fantasy XV Benchmark (2018) | 104.9 | 59.2 | 44.9 | 35.1 | |
| X-Plane 11.11 (2018) | 125.7 | 105.9 | 88.1 | ||
| Strange Brigade (2018) | 270 | 114.8 | 104.9 | 88.2 | 66.2 |
| F1 22 (2022) | 122.2 | 107.9 | 79.2 | 29.3 | 13.7 |
Emissões e gerenciamento de energia - O laptop 2-em-1 fica muito barulhento sob carga
Emissões sonoras
No funcionamento diário (Escritório, Internet), os dois ventiladores não produzem uma quantidade excessiva de ruído e podem até permanecer em silêncio ocasionalmente. Entretanto, sob carga média e alta, eles ficam bastante altos a um nível máximo de ruído de 49,3 dB(A) ou 48,2 dB(A) durante o teste de estresse.
Para uma operação mais silenciosa, o laptop oferece os perfis "Modo Silencioso" e "Super Bateria", mas isso se dá ao custo do desempenho computacional. A bateria "Super Battery" garante o mais baixo nível de ruído, mas também proporciona o mais baixo nível de desempenho.
Barulho
| Ocioso |
| 25 / 25 / 28.9 dB |
| Carga |
| 49.3 / 48.2 dB |
 | ||
30 dB silencioso 40 dB(A) audível 50 dB(A) ruidosamente alto |
||
min: | ||
| MSI Summit E16 Flip A12UDT-031 GeForce RTX 3050 Ti Laptop GPU, i7-1280P, Samsung PM9A1 MZVL22T0HBLB | Asus ExpertBook B2 Flip B2502FBA-N80141X Iris Xe G7 96EUs, i7-1260P, Samsung PM9A1 MZVL21T0HCLR | Samsung Galaxy Book Pro 360 15 NP950QDB-KC3DE Iris Xe G7 80EUs, i5-1135G7, Samsung PM991 MZVLQ256HAJD | Dell Inspiron 16 7620 2-in-1 Iris Xe G7 96EUs, i7-1260P, Toshiba KBG40ZNS512G NVMe | |
|---|---|---|---|---|
| Noise | -1% | 10% | 16% | |
| desligado / ambiente * (dB) | 25 | 26 -4% | 25 -0% | 23.2 7% |
| Idle Minimum * (dB) | 25 | 26.6 -6% | 25 -0% | 23.5 6% |
| Idle Average * (dB) | 25 | 27 -8% | 25 -0% | 23.5 6% |
| Idle Maximum * (dB) | 28.9 | 27 7% | 25 13% | 23.5 19% |
| Load Average * (dB) | 49.3 | 46.7 5% | 32.7 34% | 29.4 40% |
| Load Maximum * (dB) | 48.2 | 46.7 3% | 42 13% | 39.7 18% |
| Witcher 3 ultra * (dB) | 35.6 |
* ... menor é melhor
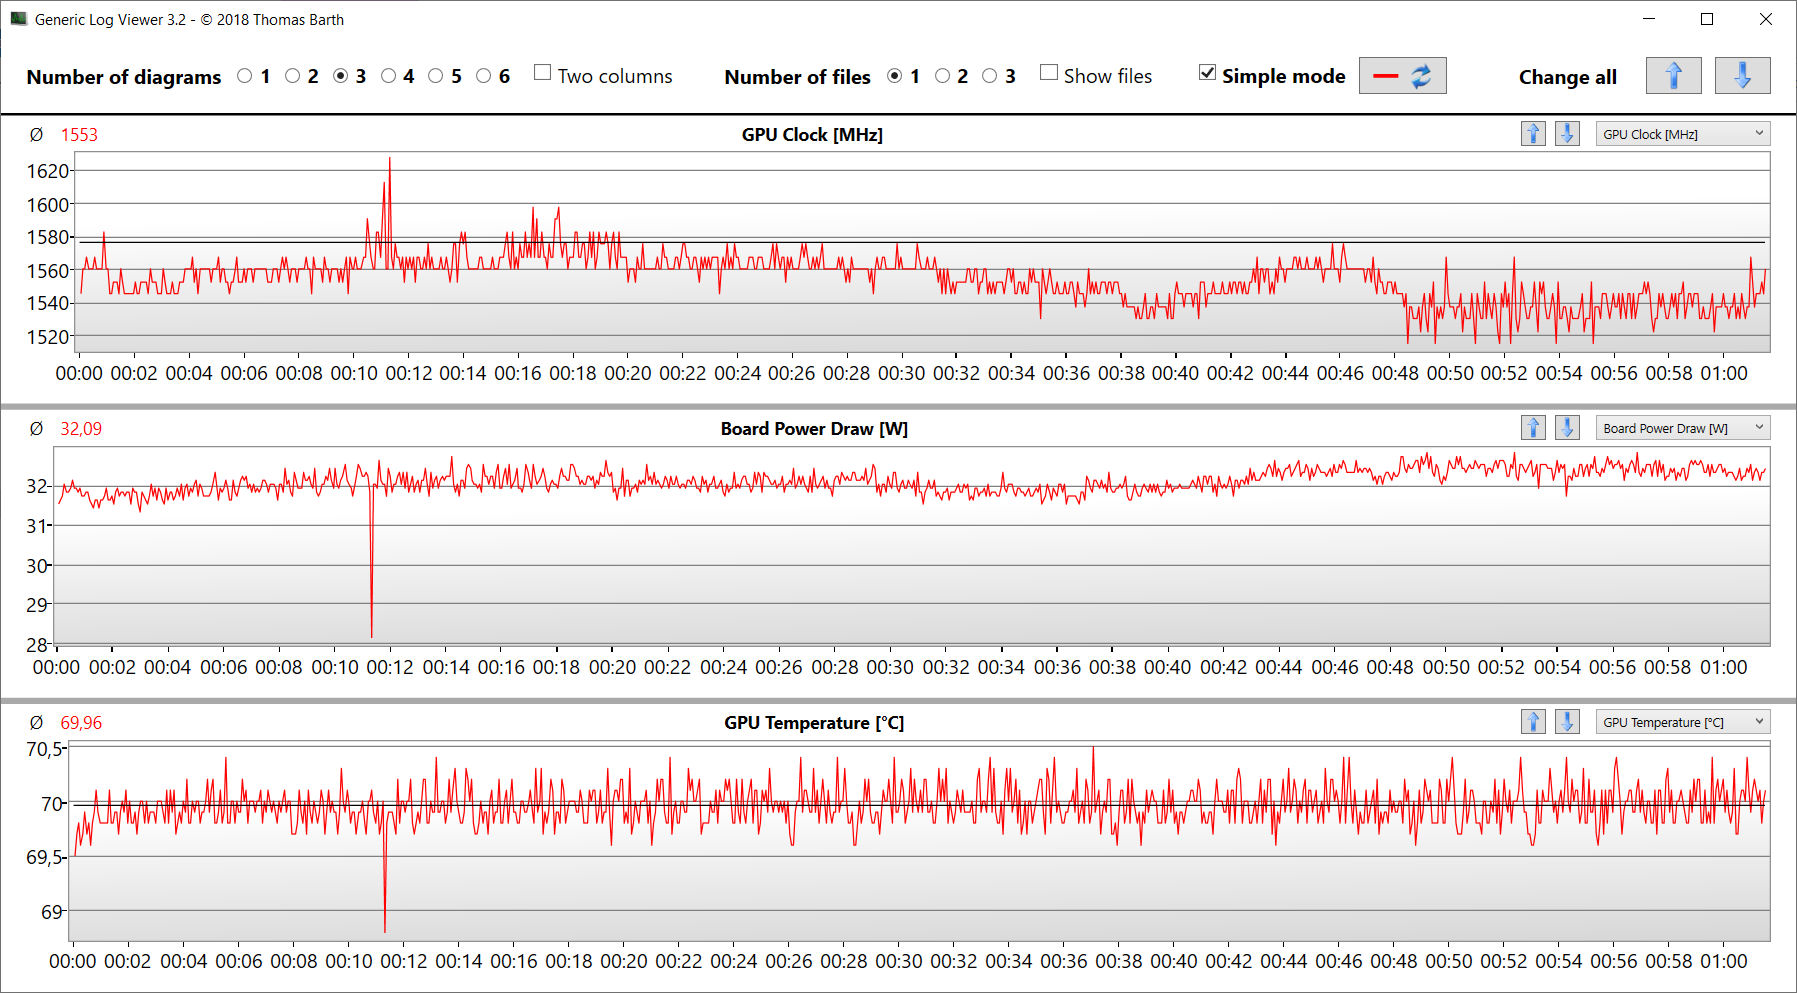
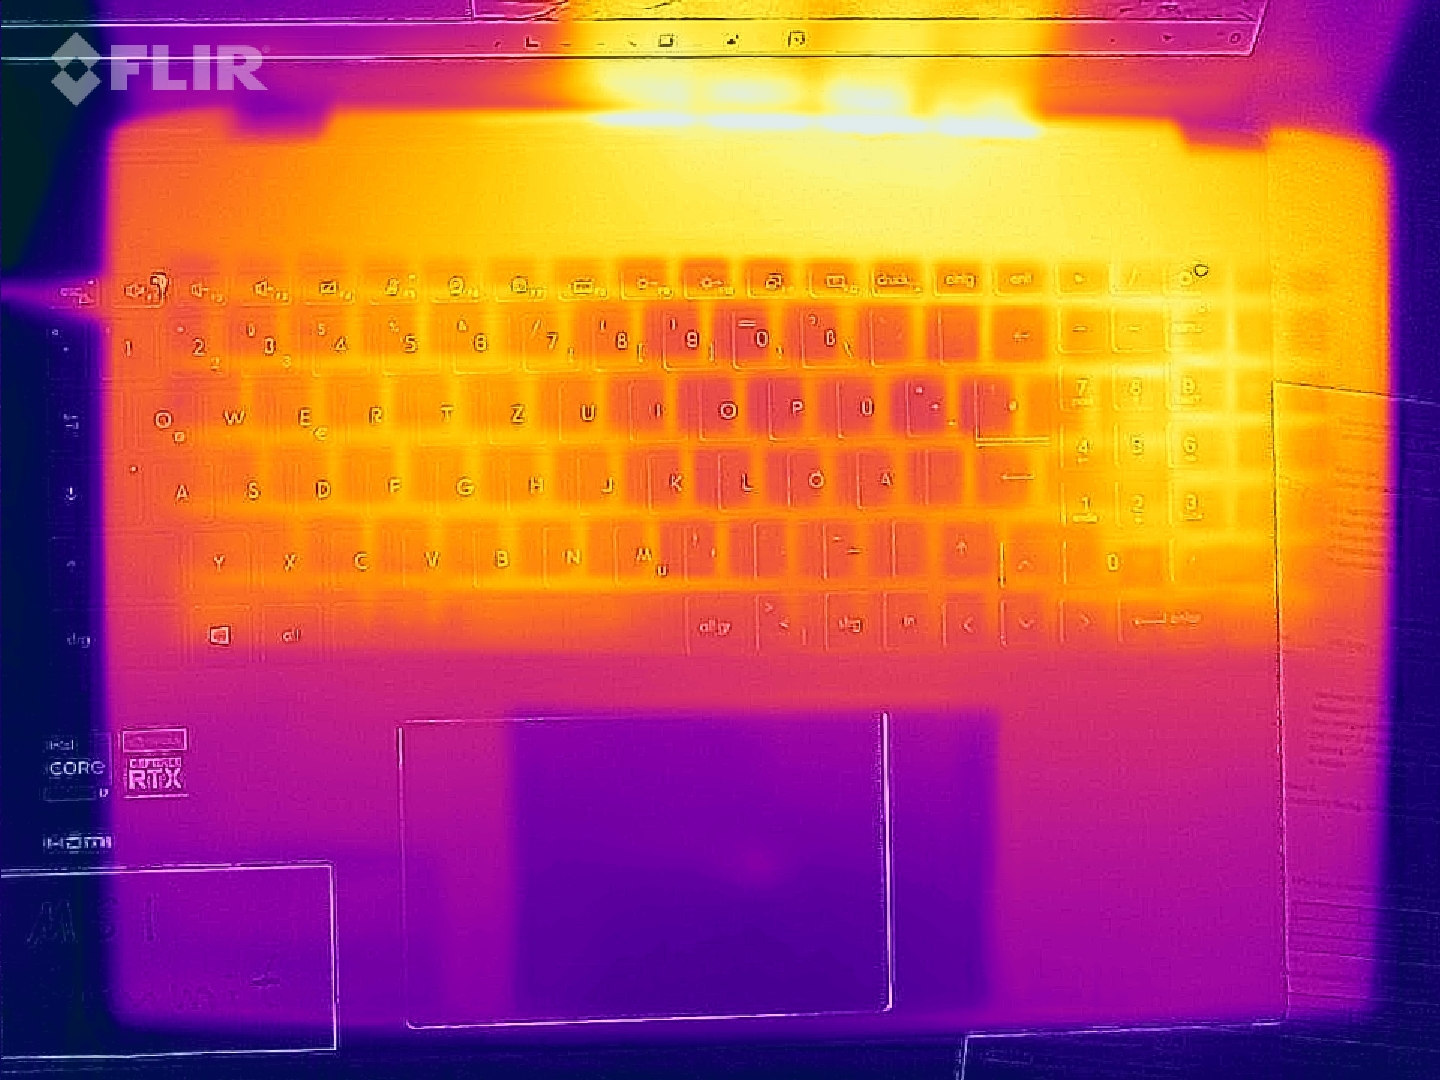
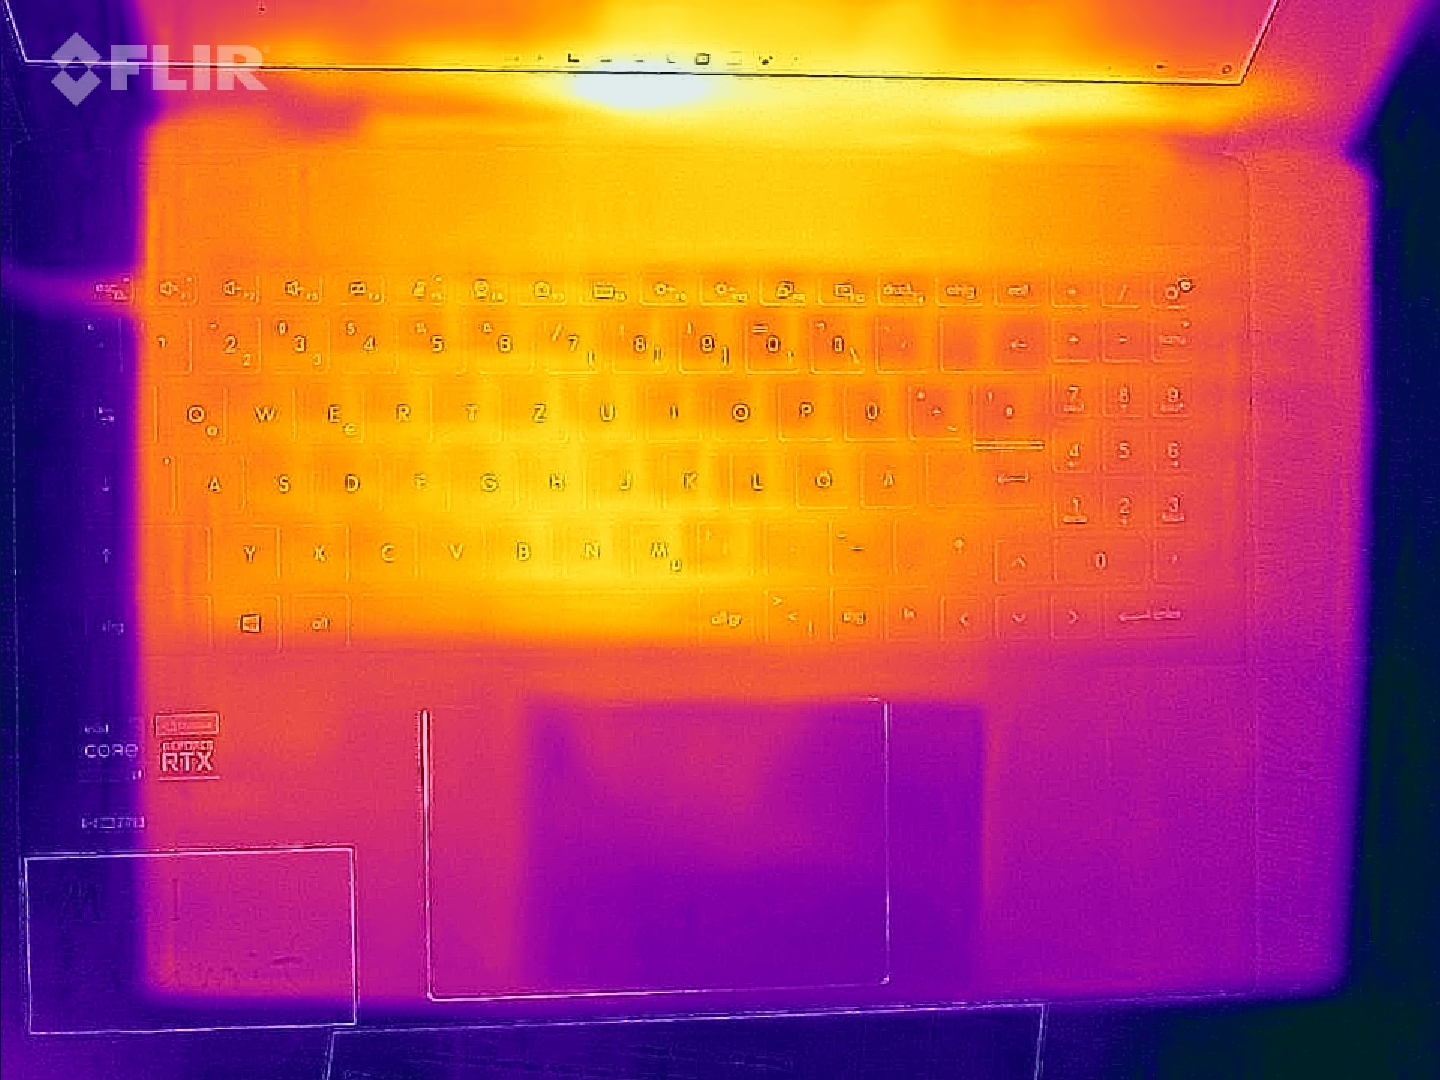
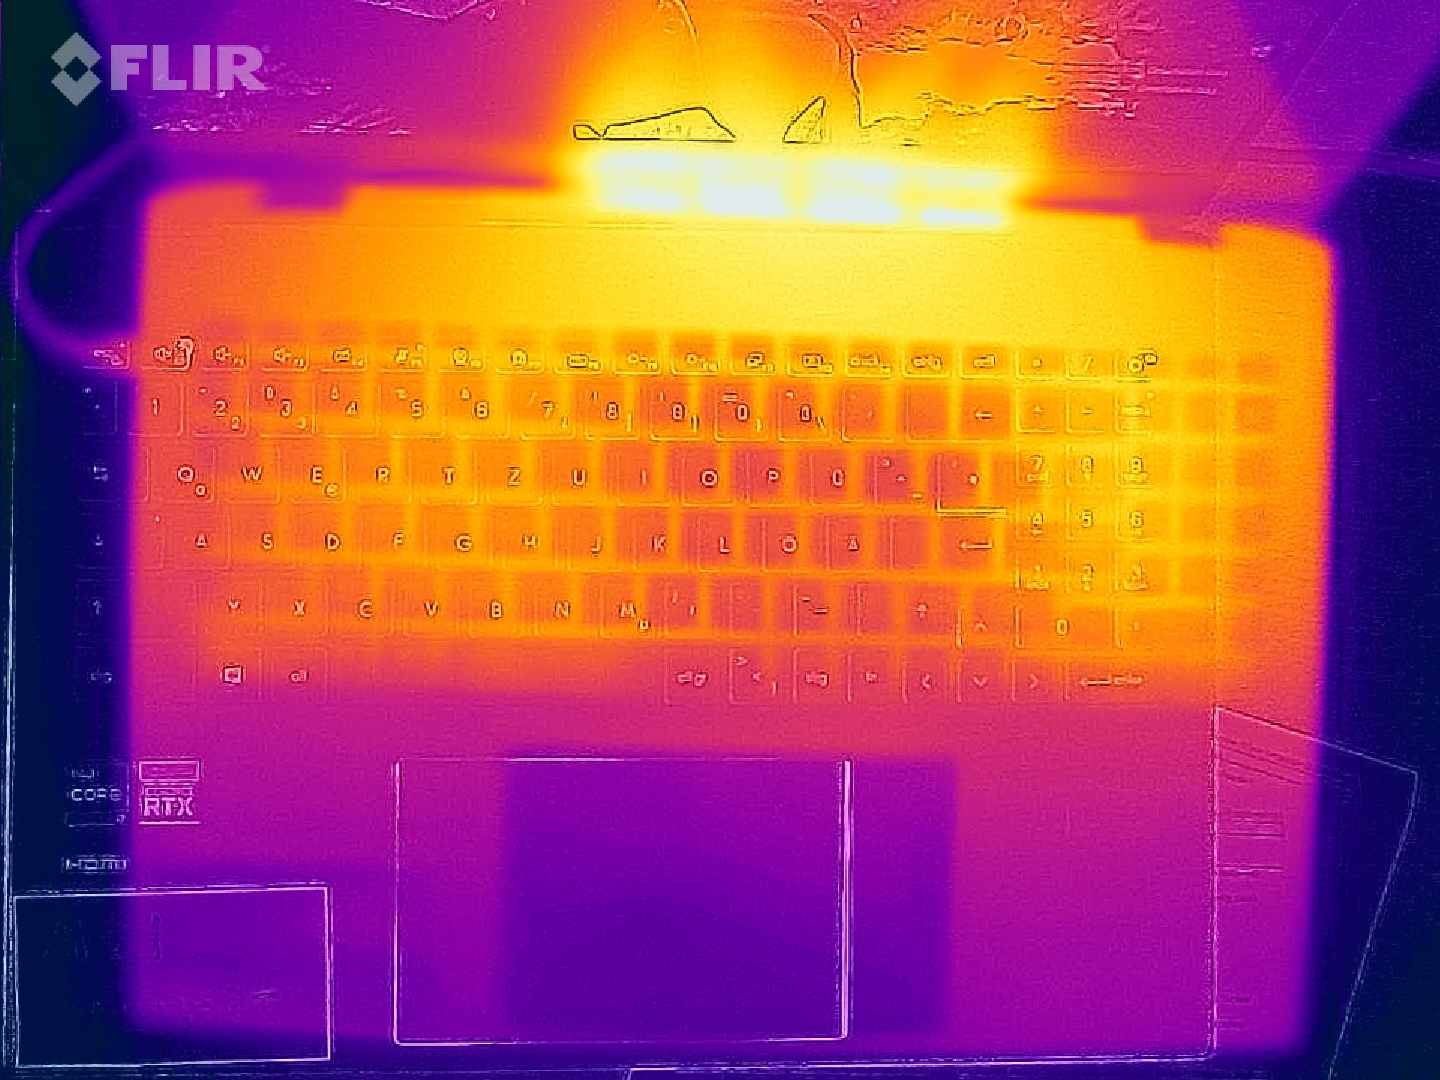
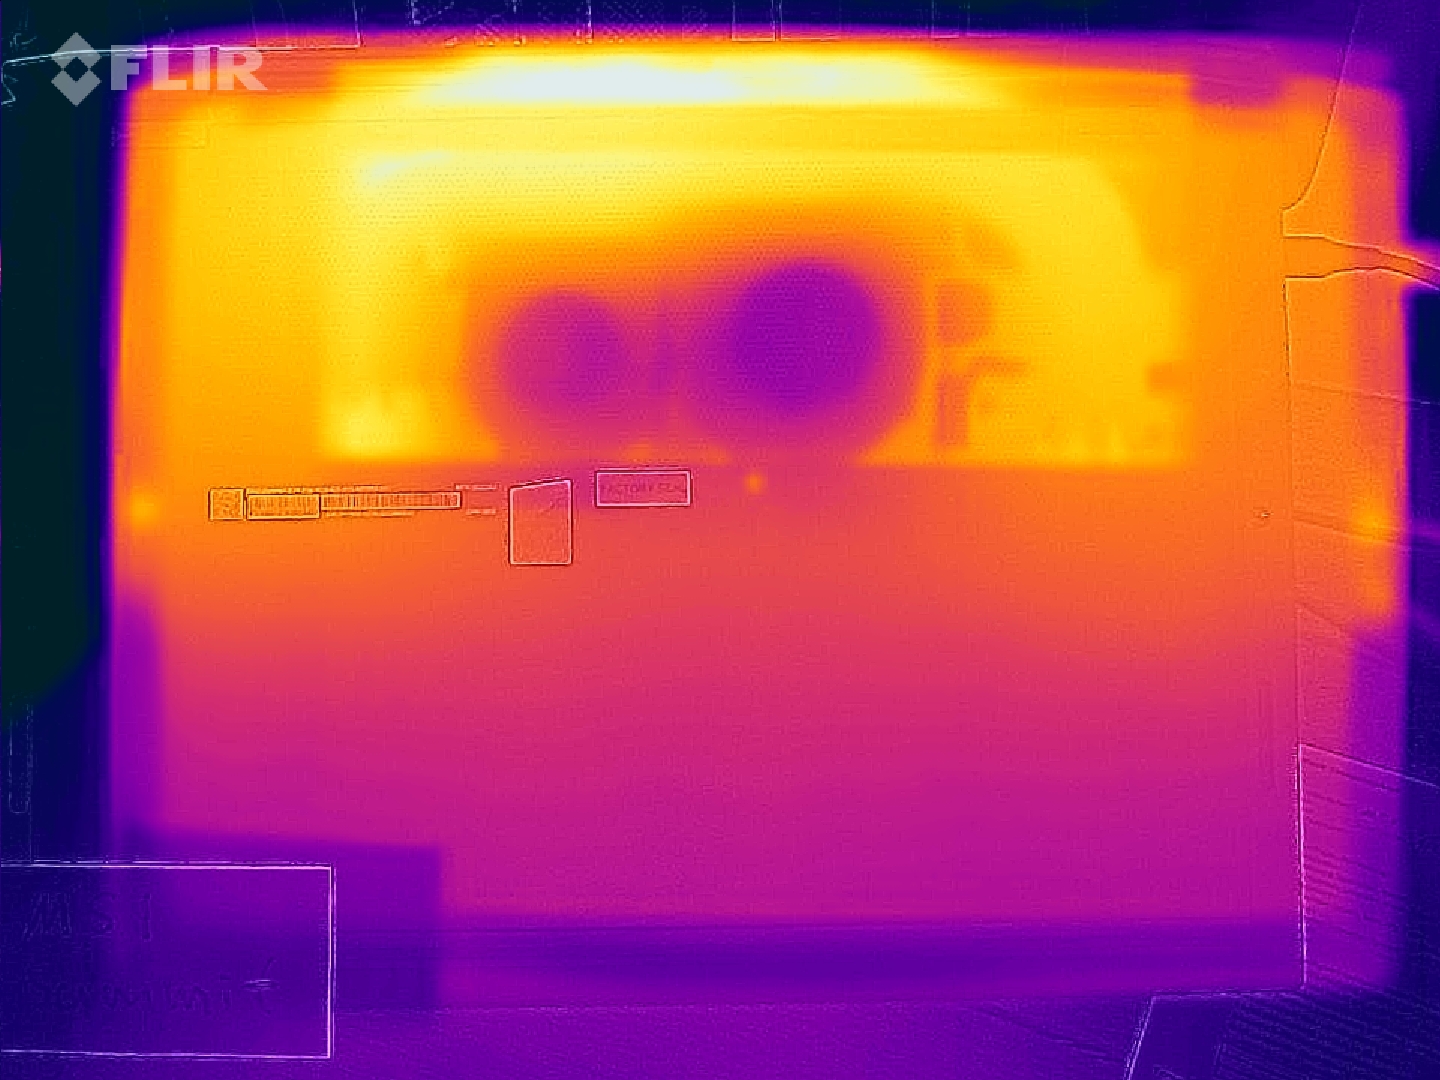
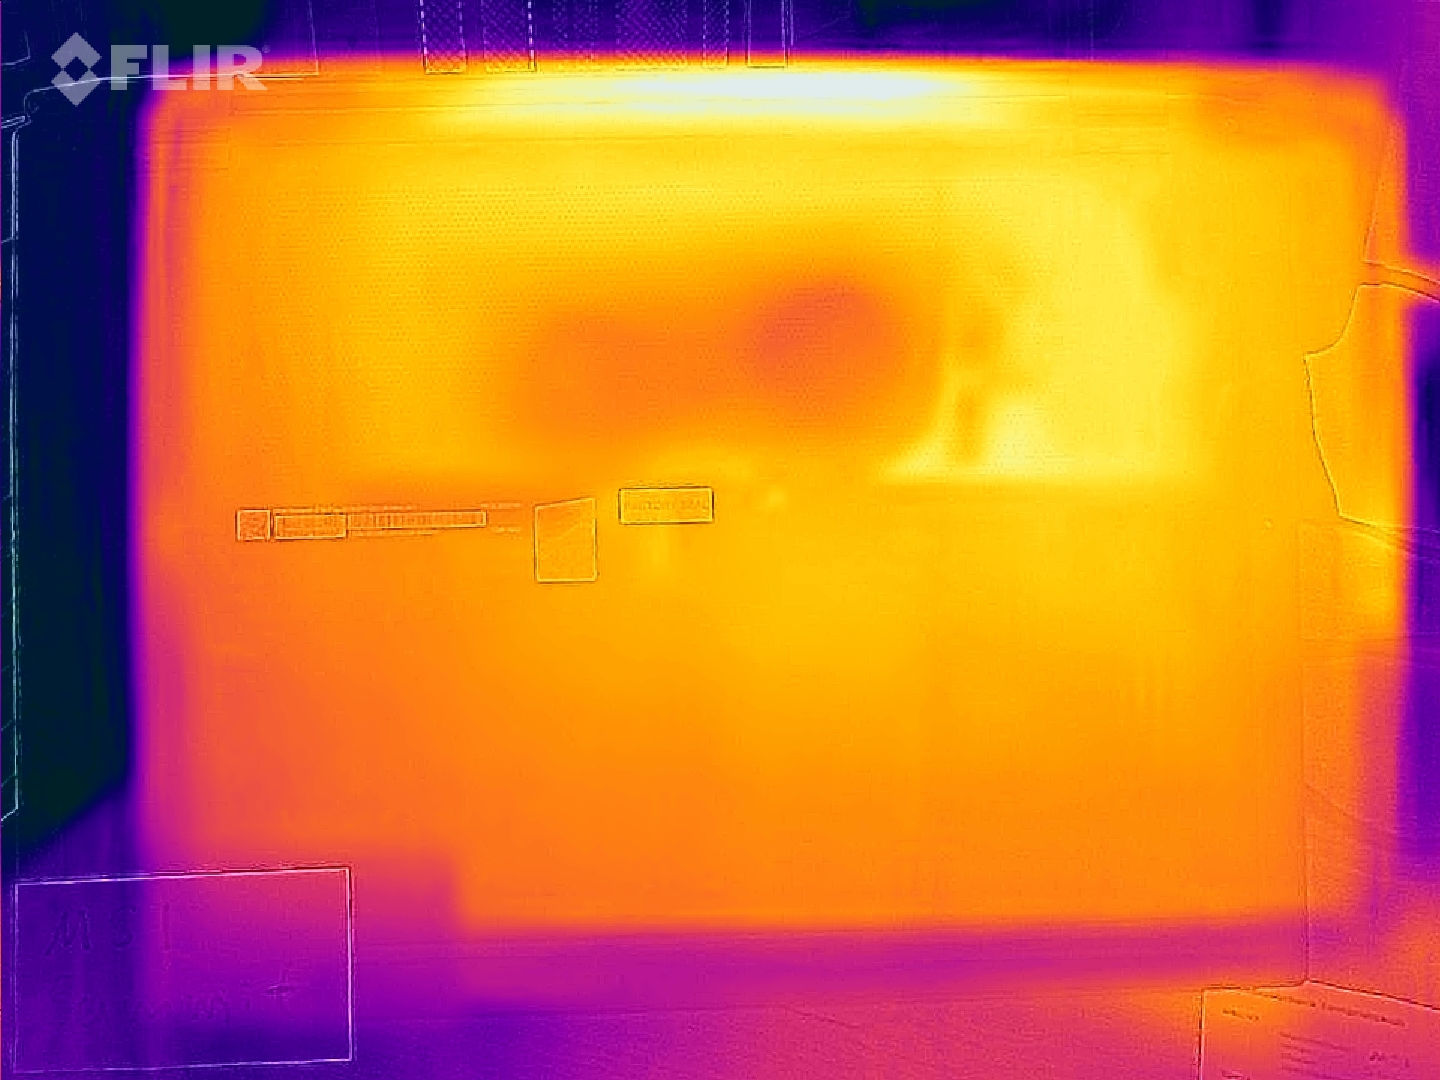
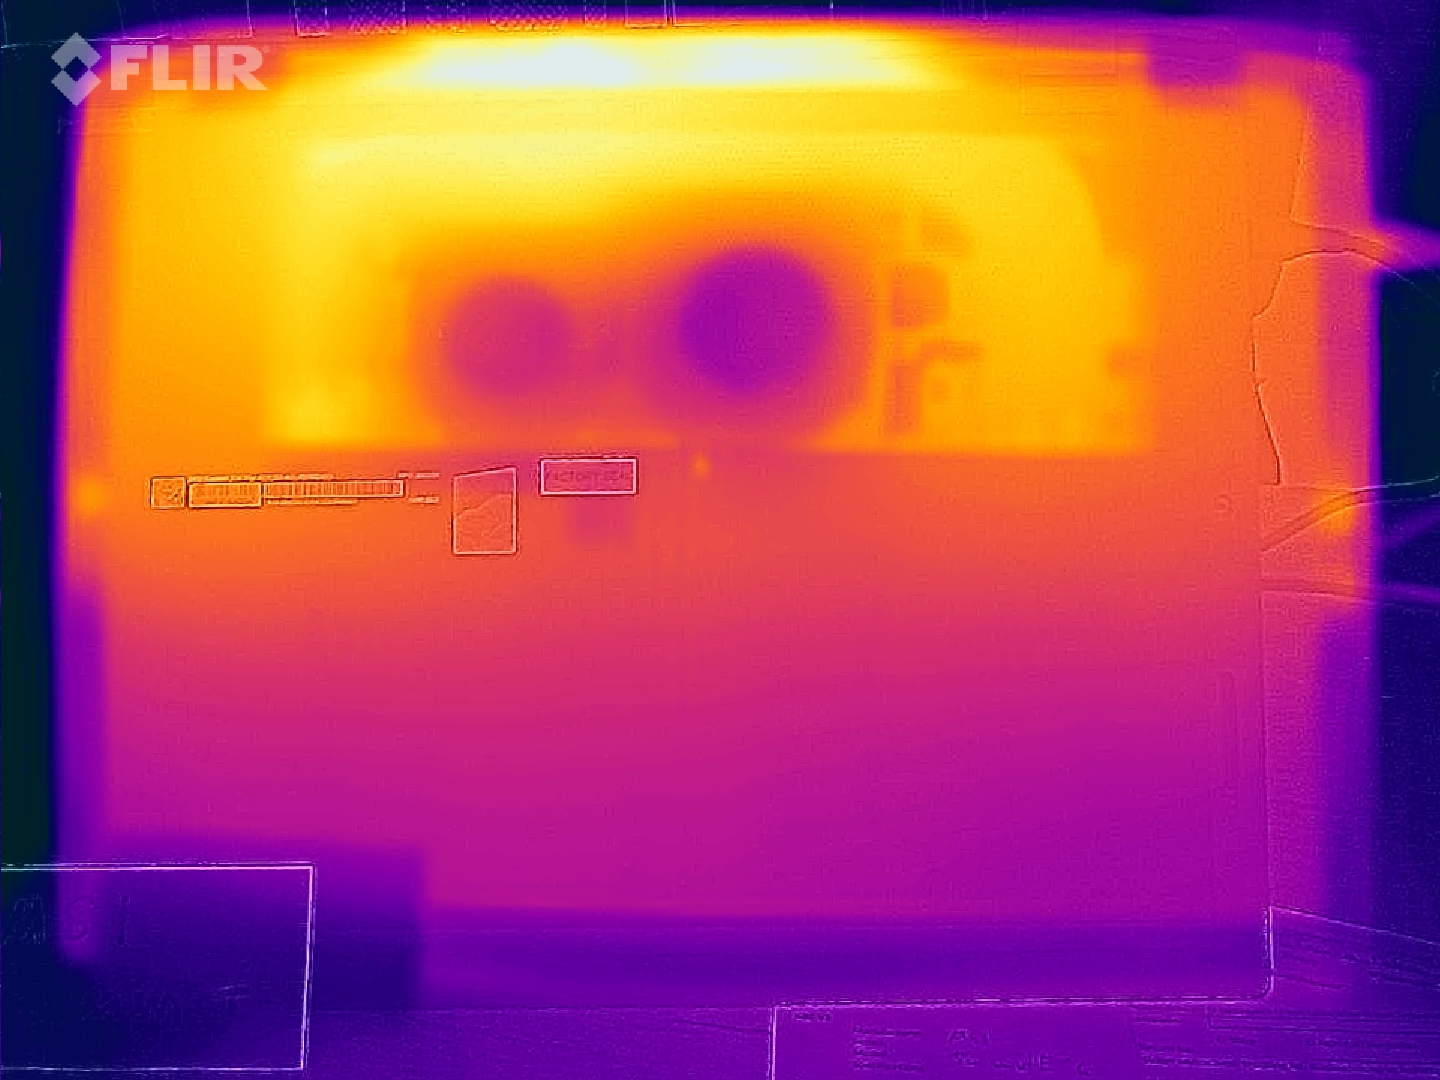
Temperaturas
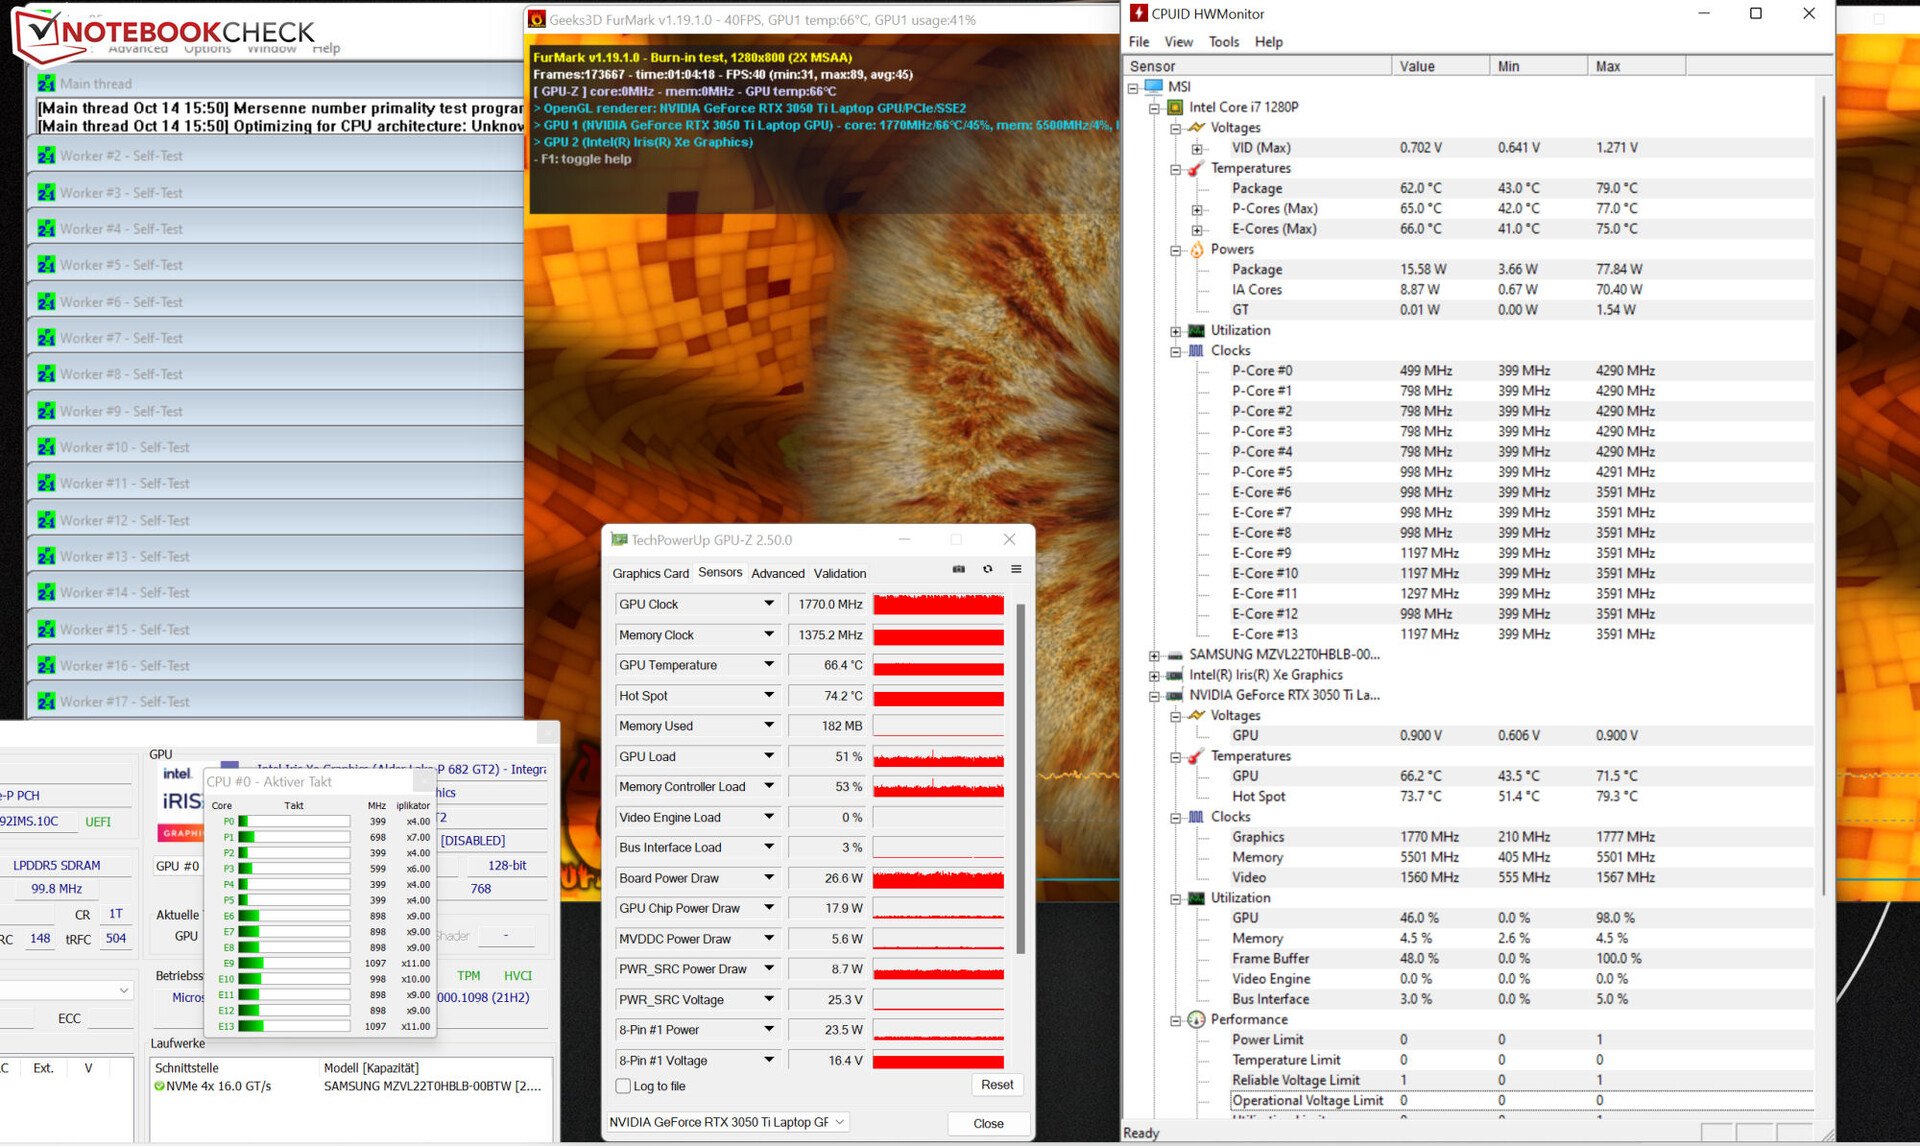
Sob carga (teste de estresse, The Witcher 3), o laptop aquece visivelmente, mas não excessivamente. Caso contrário, as temperaturas permanecem dentro da faixa verde.
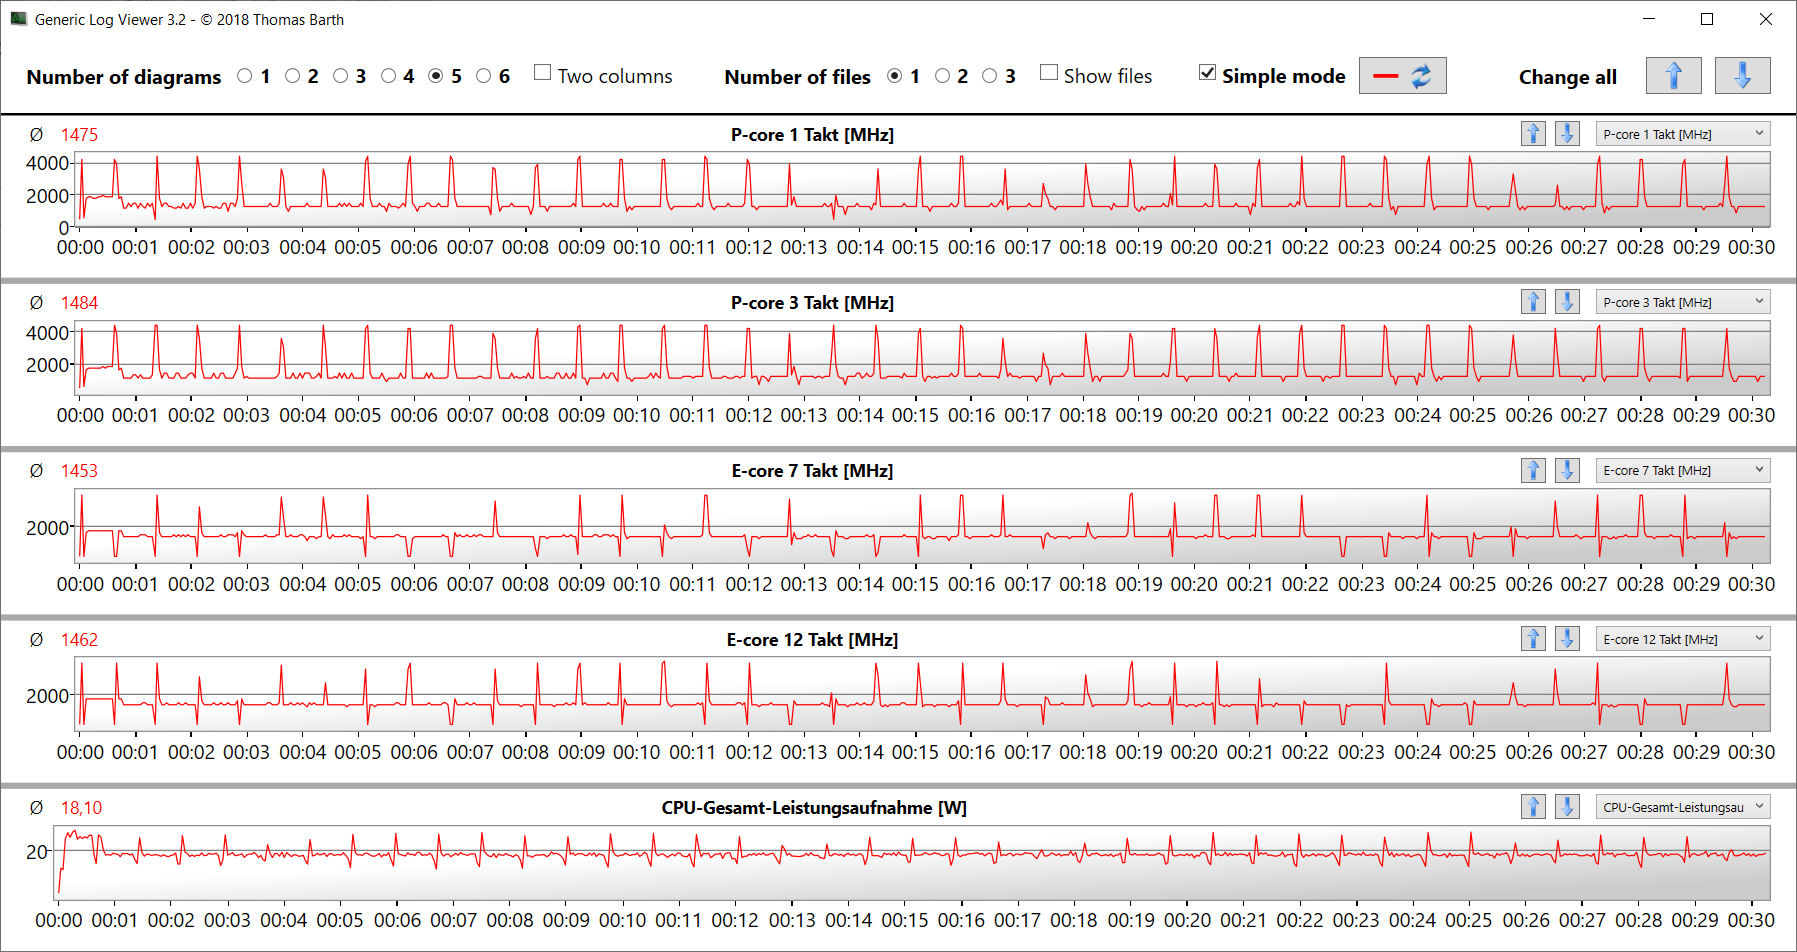
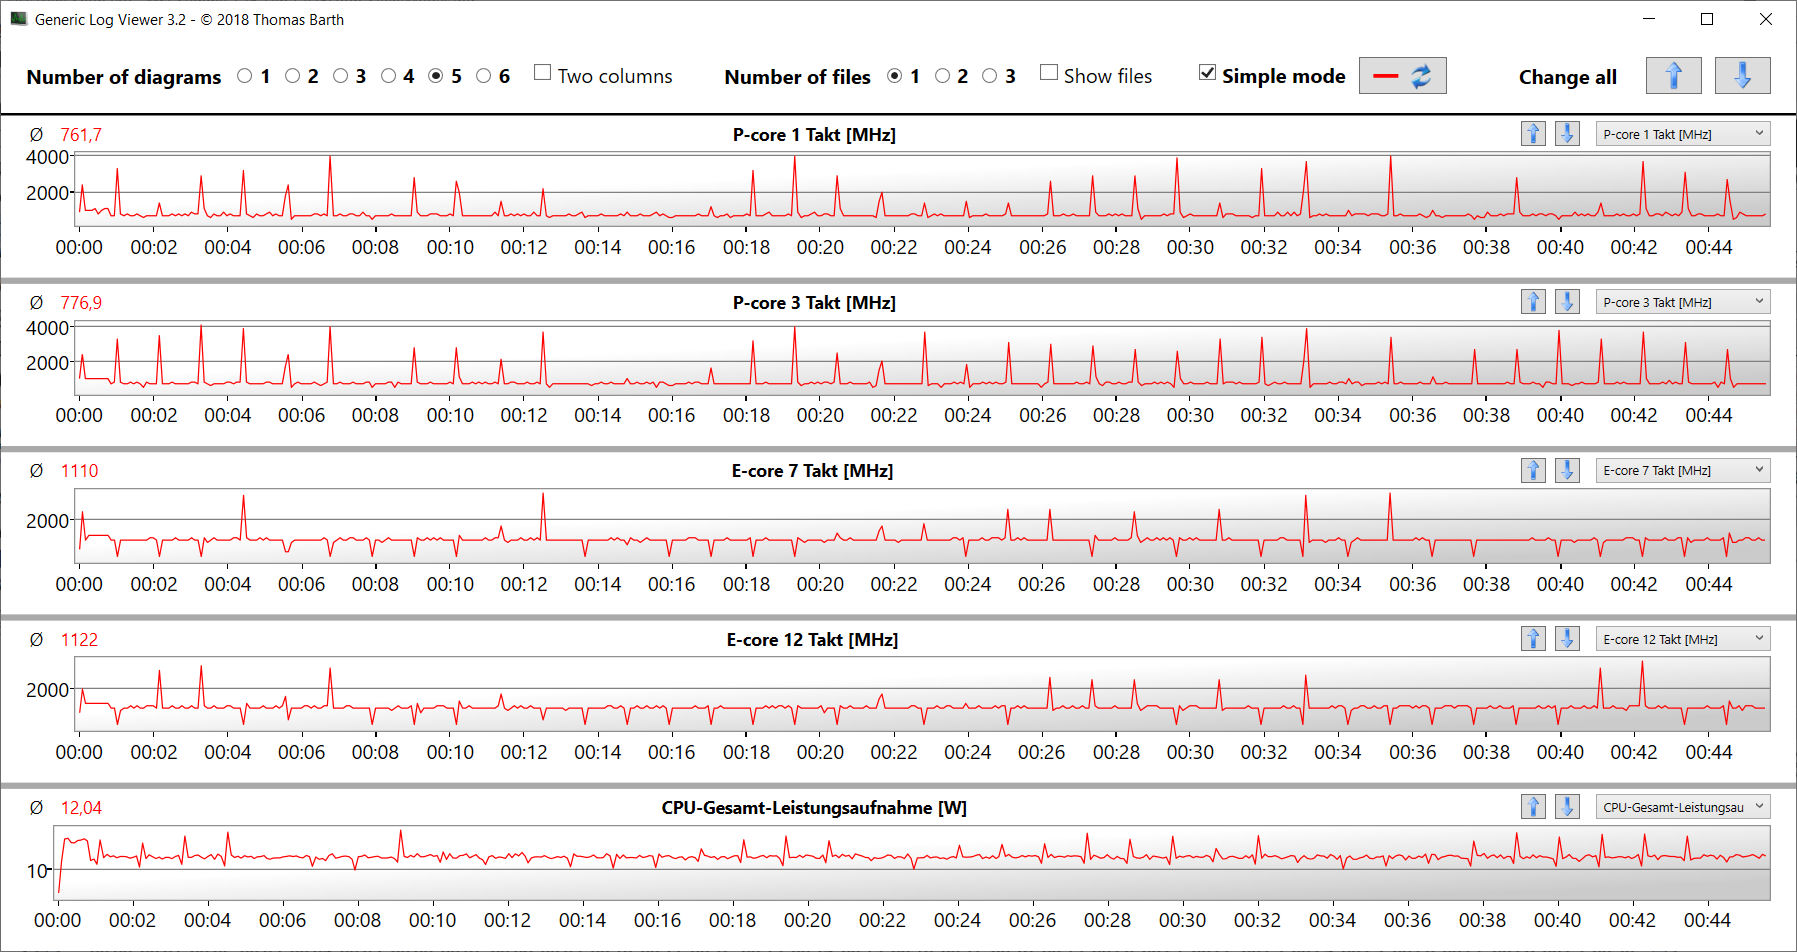
O teste de estresse (Prime95 e Furmark funcionando constantemente) representa um cenário extremo que usamos para avaliar a estabilidade do sistema sob carga total. A CPU inicia o teste em baixas velocidades de clock (P: 1,6 - 2,8 GHz; E: 1,6 - 1,7 GHz), e o núcleo gráfico funciona em 1.400 a 1.800 MHz. Enquanto a velocidade da CPU cai durante a continuação do teste, a velocidade da GPU se estabiliza a um nível alto.
(-) A temperatura máxima no lado superior é 49.2 °C / 121 F, em comparação com a média de 35.4 °C / 96 F , variando de 19.6 a 60 °C para a classe Convertible.
(-) A parte inferior aquece até um máximo de 50.2 °C / 122 F, em comparação com a média de 36.9 °C / 98 F
(+) Em uso inativo, a temperatura média para o lado superior é 27.6 °C / 82 F, em comparação com a média do dispositivo de 30.3 °C / ### class_avg_f### F.
(-) Jogando The Witcher 3, a temperatura média para o lado superior é 39.1 °C / 102 F, em comparação com a média do dispositivo de 30.3 °C / ## #class_avg_f### F.
(+) Os apoios para as mãos e o touchpad estão atingindo a temperatura máxima da pele (33.7 °C / 92.7 F) e, portanto, não estão quentes.
(-) A temperatura média da área do apoio para as mãos de dispositivos semelhantes foi 28 °C / 82.4 F (-5.7 °C / -10.3 F).
| MSI Summit E16 Flip A12UDT-031 Intel Core i7-1280P, NVIDIA GeForce RTX 3050 Ti Laptop GPU | Asus ExpertBook B2 Flip B2502FBA-N80141X Intel Core i7-1260P, Intel Iris Xe Graphics G7 96EUs | Samsung Galaxy Book Pro 360 15 NP950QDB-KC3DE Intel Core i5-1135G7, Intel Iris Xe Graphics G7 80EUs | Dell Inspiron 16 7620 2-in-1 Intel Core i7-1260P, Intel Iris Xe Graphics G7 96EUs | |
|---|---|---|---|---|
| Heat | 5% | 14% | -1% | |
| Maximum Upper Side * (°C) | 49.2 | 36.6 26% | 42.6 13% | 42.2 14% |
| Maximum Bottom * (°C) | 50.2 | 42.2 16% | 40.8 19% | 47.4 6% |
| Idle Upper Side * (°C) | 29.4 | 31.3 -6% | 25.9 12% | 32.2 -10% |
| Idle Bottom * (°C) | 30 | 34.8 -16% | 26.1 13% | 33.6 -12% |
* ... menor é melhor
Oradores
Os alto-falantes estéreo produzem um som decente que inclui quase nenhum baixo.
MSI Summit E16 Flip A12UDT-031 análise de áudio
(±) | o volume do alto-falante é médio, mas bom (###valor### dB)
Graves 100 - 315Hz
(-) | quase nenhum baixo - em média 23.6% menor que a mediana
(-) | graves não são lineares (15.1% delta para frequência anterior)
Médios 400 - 2.000 Hz
(±) | médios mais altos - em média 5.6% maior que a mediana
(±) | a linearidade dos médios é média (7.4% delta para frequência anterior)
Altos 2 - 16 kHz
(±) | máximos mais altos - em média 5.6% maior que a mediana
(+) | os máximos são lineares (4.5% delta da frequência anterior)
Geral 100 - 16.000 Hz
(±) | a linearidade do som geral é média (22.6% diferença em relação à mediana)
Comparado com a mesma classe
» 68% de todos os dispositivos testados nesta classe foram melhores, 5% semelhantes, 27% piores
» O melhor teve um delta de 6%, a média foi 20%, o pior foi 57%
Comparado com todos os dispositivos testados
» 67% de todos os dispositivos testados foram melhores, 6% semelhantes, 28% piores
» O melhor teve um delta de 4%, a média foi 23%, o pior foi 134%
Dell Inspiron 16 7620 2-in-1 análise de áudio
(+) | os alto-falantes podem tocar relativamente alto (###valor### dB)
Graves 100 - 315Hz
(-) | quase nenhum baixo - em média 15.3% menor que a mediana
(±) | a linearidade dos graves é média (8.8% delta para a frequência anterior)
Médios 400 - 2.000 Hz
(+) | médios equilibrados - apenas 3.3% longe da mediana
(+) | médios são lineares (4.8% delta para frequência anterior)
Altos 2 - 16 kHz
(+) | agudos equilibrados - apenas 3.2% longe da mediana
(+) | os máximos são lineares (5% delta da frequência anterior)
Geral 100 - 16.000 Hz
(+) | o som geral é linear (11.5% diferença em relação à mediana)
Comparado com a mesma classe
» 9% de todos os dispositivos testados nesta classe foram melhores, 3% semelhantes, 88% piores
» O melhor teve um delta de 6%, a média foi 20%, o pior foi 57%
Comparado com todos os dispositivos testados
» 8% de todos os dispositivos testados foram melhores, 2% semelhantes, 90% piores
» O melhor teve um delta de 4%, a média foi 23%, o pior foi 134%
Consumo de energia
Em geral, o consumo de energia varia em um nível normal para o hardware utilizado aqui. Enquanto o laptop passa pelo teste Witcher 3 com um consumo de energia constante, durante os testes de estresse o consumo cai regularmente por um breve período de tempo. A fonte de alimentação incluída (100 watts) é de tamanho suficiente.
| desligado | |
| Ocioso | |
| Carga |
|
Key:
min: | |
Power Consumption The Witcher 3 / Stress Test
Power Consumption With External Monitor
Vida útil da bateria
Em nosso teste WLAN realista, a bateria de 16 polegadas atinge uma duração de 7:08 horas. Este teste simula a carga ao renderizar websites através de um script.
Pro
Contra
Veredicto - Um laptop 2-em-1 para trabalho criativo móvel
O Summit E16 Flip é um laptop 2 em 1 do segmento empresarial que tem como alvo principal os usuários criativos. O MSI combina uma tela sensível ao toque de 16 polegadas no formato 16:10 com uma poderosa GPU de médio alcance.
Embora o laptop 2-em-1 da MSI não seja destinado a todos, ele deve definitivamente atrair alguns seguidores.
ONúcleo i7-1280Pe GeForce RTX 3050 Tisão capazes de funcionar constantemente em altas velocidades de relógio. O desempenho da GPU quase atinge o valor médio para os gráficos RTX 3050 Ti. Embora o laptop não fique excessivamente quente sob carga, ele pode ficar bem alto. No entanto, na operação diária, as coisas permanecem mais silenciosas.
A tela tátil (2.560 x 1.600 pixels) cobre o espaço de cores do DCI-P3. Isto é acompanhado por ângulos de visão estáveis, uma boa reprodução de cores, tempos de resposta curtos, e um bom nível de contraste. Infelizmente, o painel tem uma superfície refletiva. Além disso, a luminosidade máxima poderia ter sido maior. A tela tátil pode ser operada com os dedos, assim como a caneta de entrada MSI incluída.
Apesar de seu tamanho, podemos atestar ao dispositivo alguma mobilidade. O pacote completo traz cerca de 1,9 kg (~4,2 lb) para a balança. O E16 consegue obter um tempo de funcionamento da WLAN de aproximadamente 7 horas a partir de sua bateria de 82-Wh, o que é um valor bastante bom, considerando o equipamento de hardware.
Nosso banco de dados não inclui um concorrente direto do E16. O que pode chegar mais perto nesta categoria é o Dell Inspiron 16 7620 2 em 1que, opcionalmente, está disponível com umGeForce MX550núcleo gráfico. Além disso, esse dispositivo pontua com uma duração de bateria significativamente melhor e memória de trabalho substituível/expansível.
Preço e Disponibilidade
O MSI Summit E16 Flip A12UDT está disponível em Amazon por $1849por exemplo.
MSI Summit E16 Flip A12UDT-031
- 10/19/2022 v7 (old)
Sascha Mölck
Price comparison

